Novel genetic loci affecting facial shape variation in humans
- Erasmus MC University Medical Center Rotterdam, Netherlands
- University of Chinese Academy of Sciences (CAS), China
- University of Bristol, United Kingdom
- University of Pittsburgh, United States
- King’s College London, United Kingdom
- Leiden University Medical Center, Netherlands
- QIMR Berghofer Medical Research Institute, Australia
- University College London, United Kingdom
- Chinese Academy of Sciences (CAS), China
- Plastic Surgery Hospital, China
- ShanghaiTech University, China
- Chinese Academy of Sciences, China
- Fudan University, China
- Cardiff University, United Kingdom
- Instituto Patagonico de Ciencias Sociales y Humanas, CENPAT-CONICET, Argentina
- Universidade Federal do Rio Grande do Sul, Brazil
- Unidad de Genomica de Poblaciones Aplicada a la Salud, Mexico
- Universidad Peruana Cayetano Heredia, Peru
- Universidad de Antioquia, Colombia
- Universidad de Tarapaca, Chile
- Aix-Marseille Université, CNRS, EFS, ADES, France
Figures
Figure 1 with 5 supplements
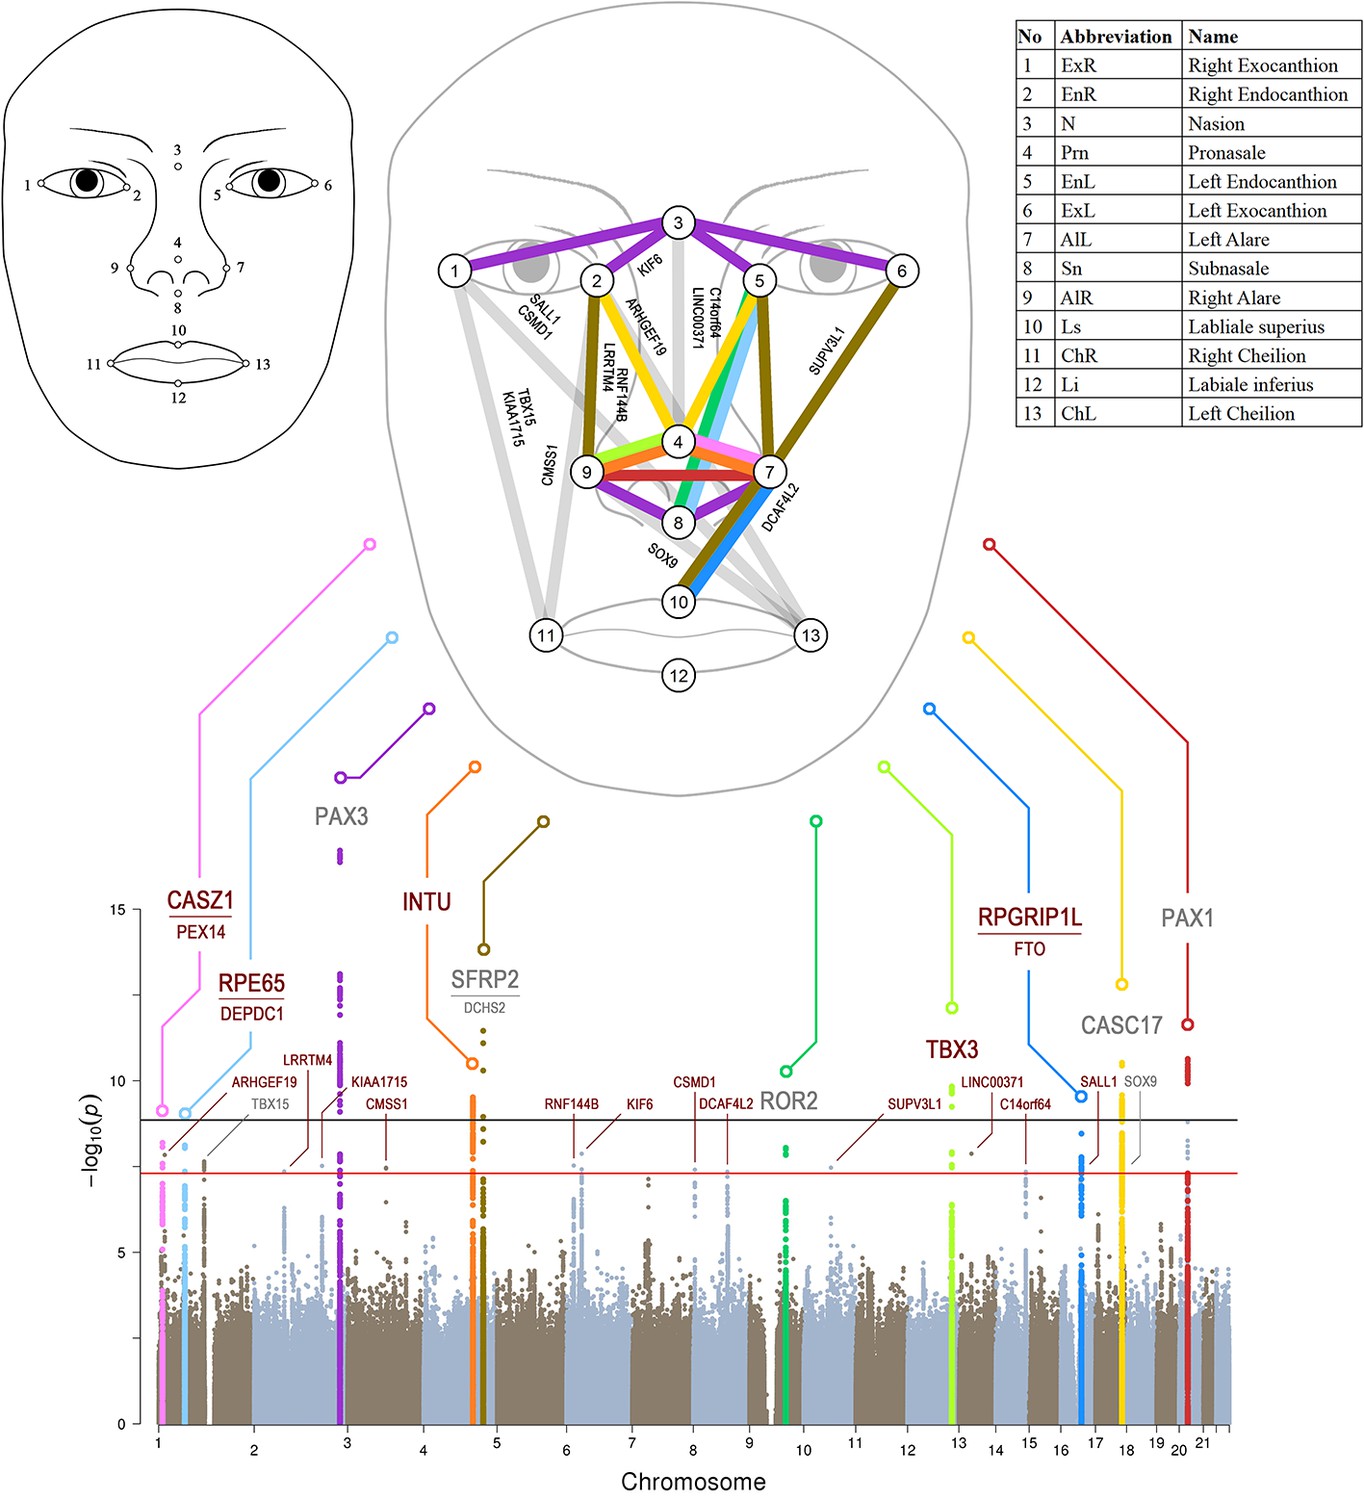
Manhattan plot from meta-analysis discovery GWAS (N = 10,115 Europeans) for 78 Euclidean distances between 13 facial landmarks.
Results from meta-analysis of four GWASs in Europeans (N = 10,115), which were separately conducted in RS, TwinsUK, ALSPAC, and PITT for 78 facial shape phenotypes that are displayed in a signal ‘composite’ Manhattan plot at the bottom of the figure. All loci consisting of SNPs reaching study-wide suggestive significance (p<5 × 10⁻⁸, red line) were nominated according to the nearby candidate genes in the associated loci, and the top 10 loci were highlighted in colors. The black line indicates study-wide significance after multiple trait correction (p<1.2×10⁻⁹). Novel and previously established face-associated genetic loci were differentiated using colored and gray text, respectively. Annotation of the 13 facial landmarks used to derive the 78 facial phenotypes and the associated facial phenotypes are illustrated in the upper part of the figure.
Figure 1—figure supplement 1
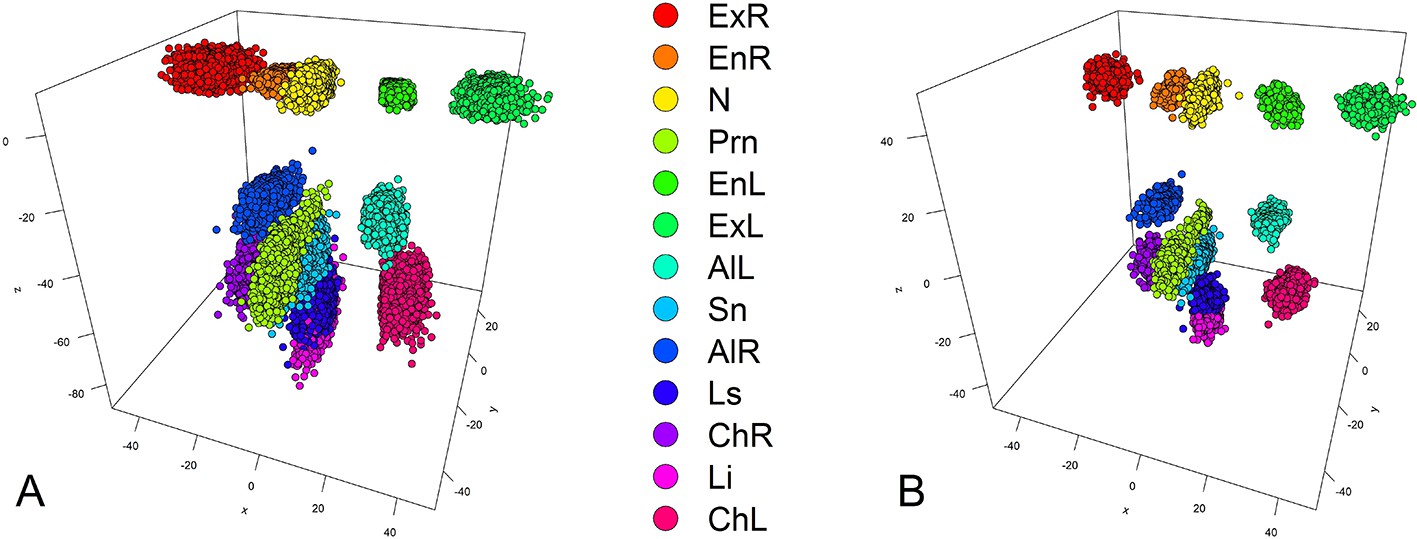
An example of GPA, facial landmarks obtained from 3dMD images in 3193 participants from the discovery cohorts RS.
(A) All raw landmarks before GPA process; (B) after GPA process.
Figure 1—figure supplement 2
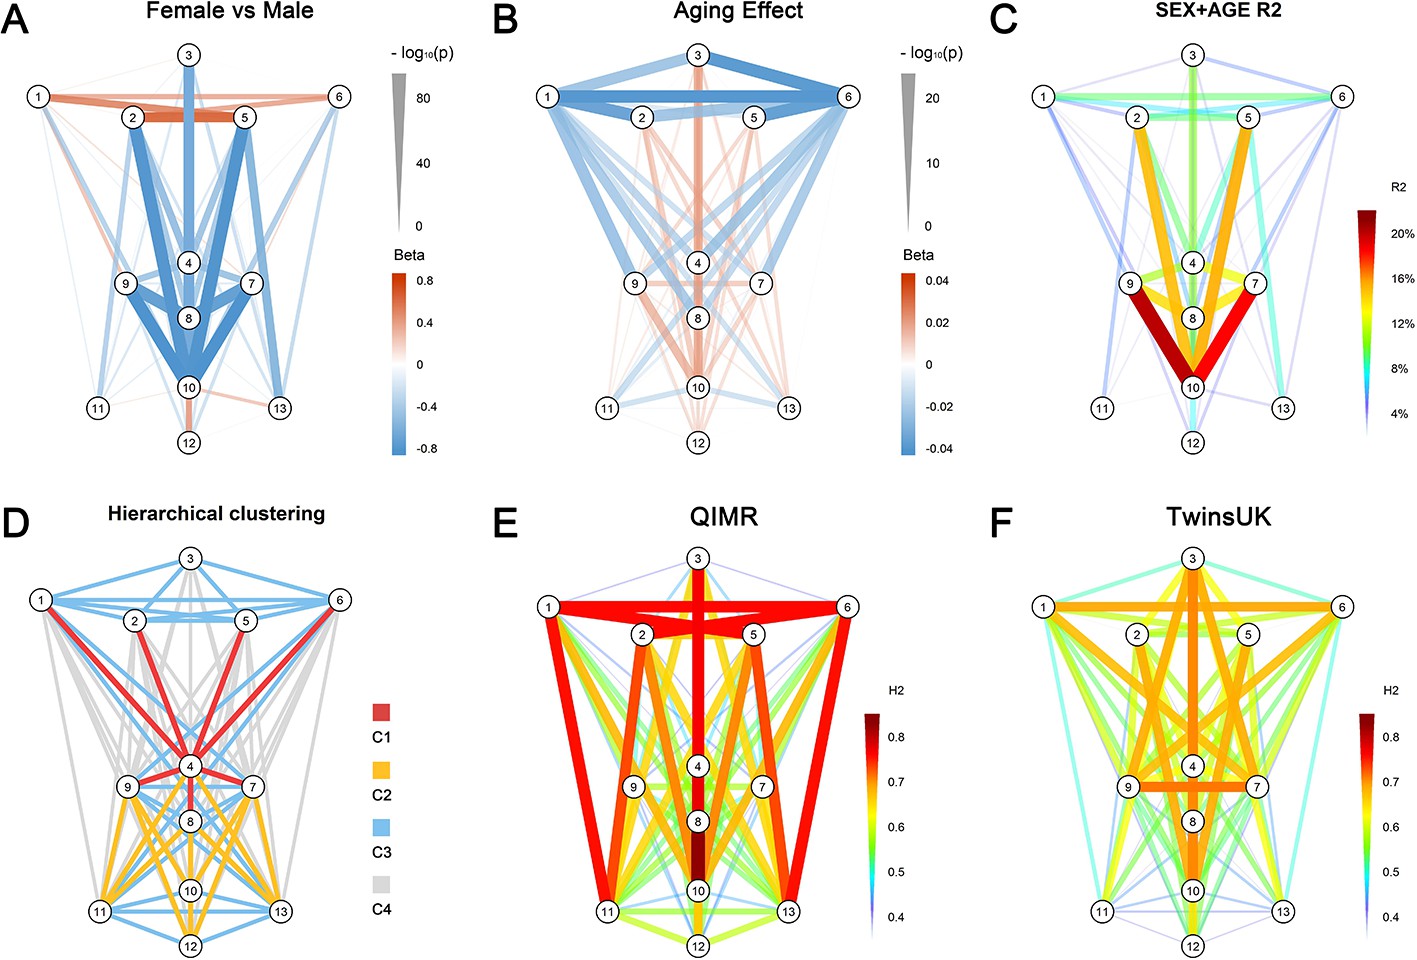
Phenotype characteristics of 78 facial traits.
(A) Sex difference (RS, N = 3,193); (B) Aging effect (RS, N = 3,193); (C) Variance explained by sex and age (RS, N = 3,193); (D) Unsupervised hierarchical clustering of phenotype correlation matrix resulted in 4 clusters of phenotypes (RS, N = 3,193); (E) Twins heritability estimates in QIMR (N = 1,101) using 2D frontal photographs; (F) Twins heritability estimates in TwinsUK (N = 1,020) using 3D images.
Figure 1—figure supplement 3
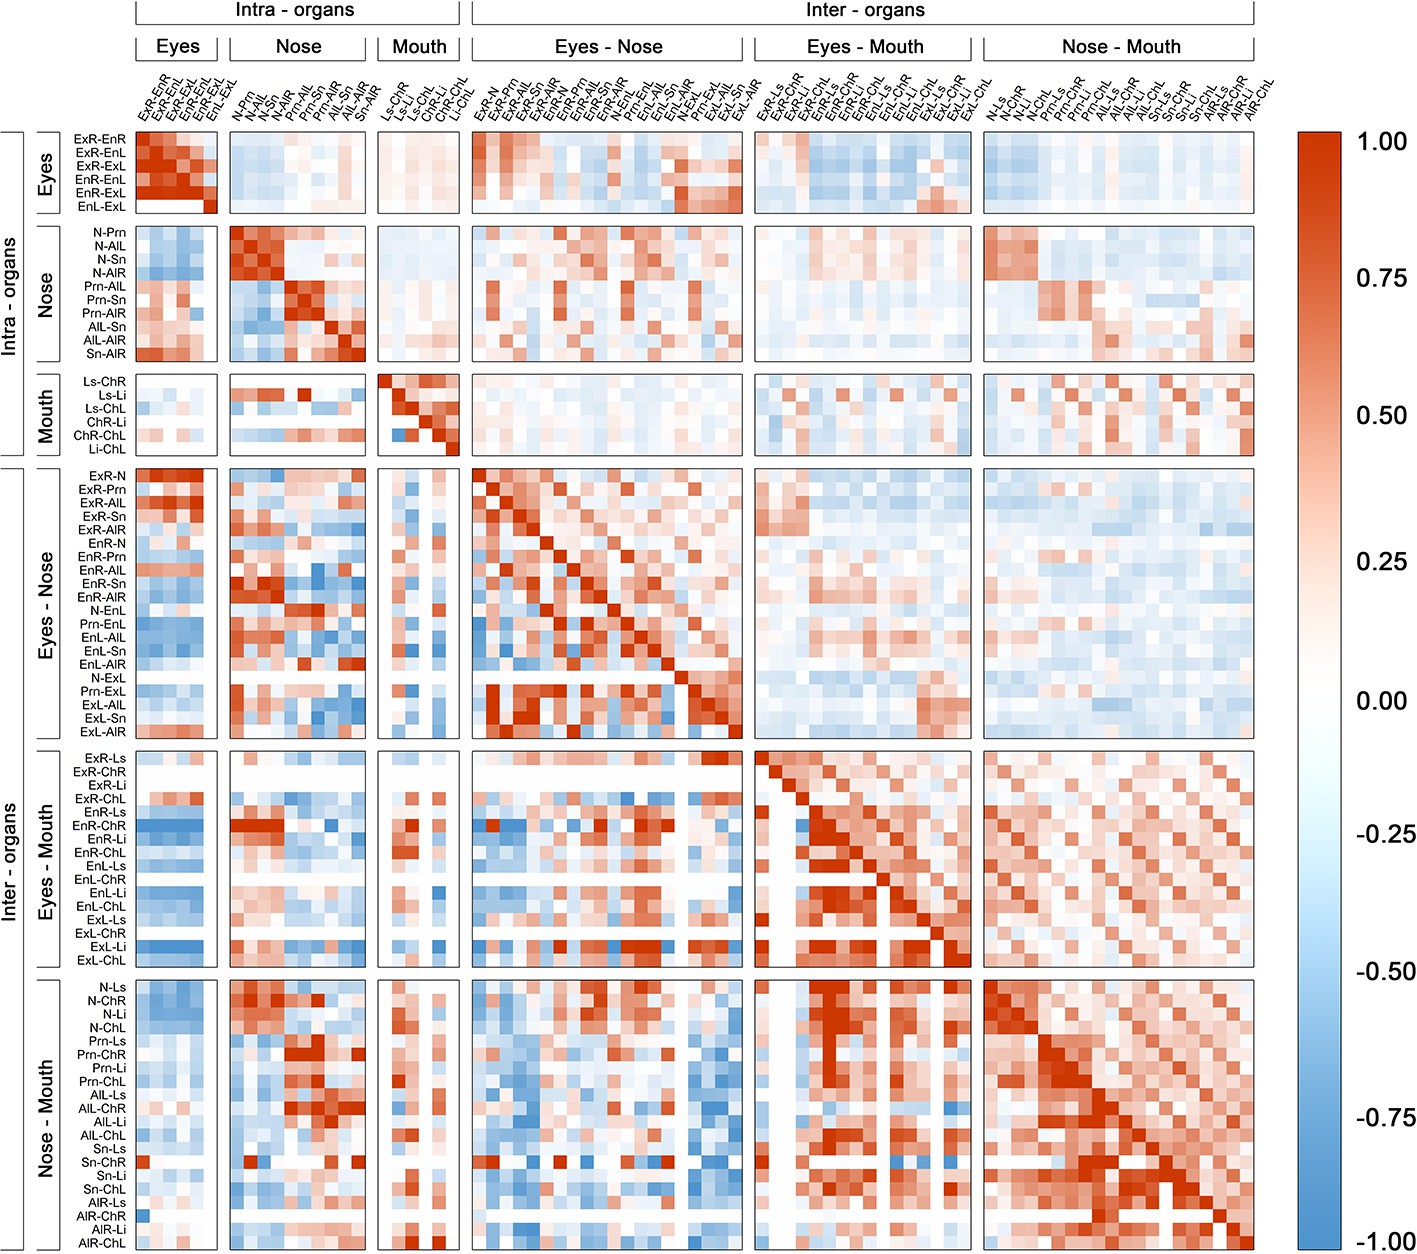
Phenotypic and genetic correlation matrix between all facial phenotypes in cohort RS.
Positive correlations are shown as brown squares; Negative correlations are shown as blue squares. Phenotypic correlation is shown above the diagonal and SNP-based genetic correlation is shown below the diagonal. The matrix was organized according to the involvement of intra- and inter- organ landmarks.
Figure 1—figure supplement 4
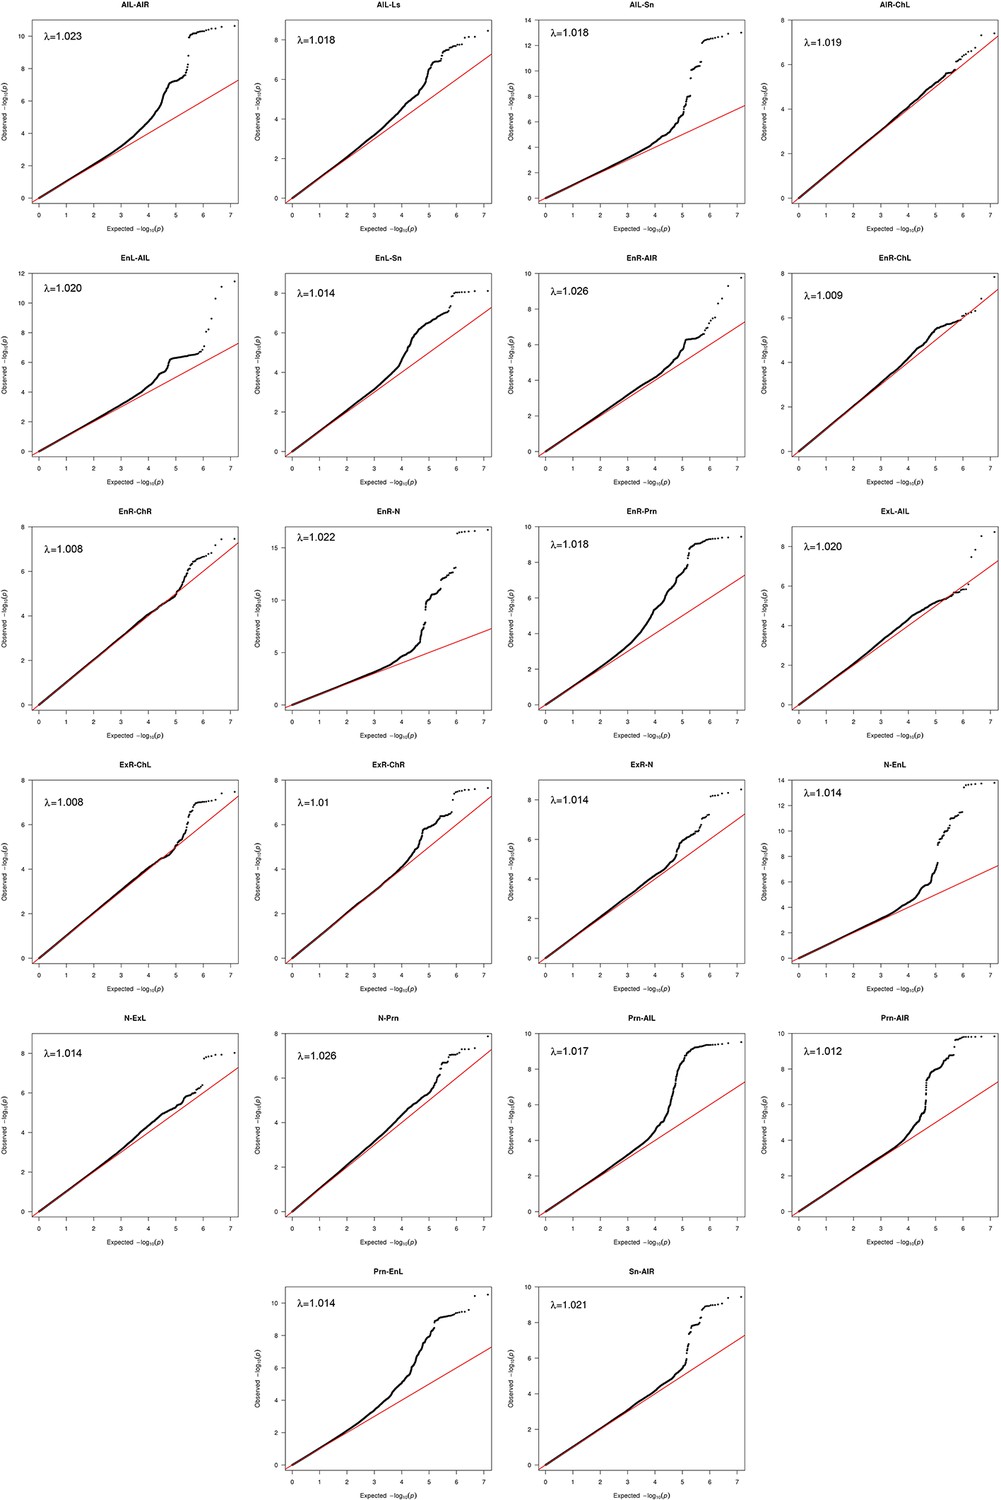
Quantile-Quantile plots and genomic inflation factors for 22 significant associated facial traits.
Figure 1—figure supplement 5
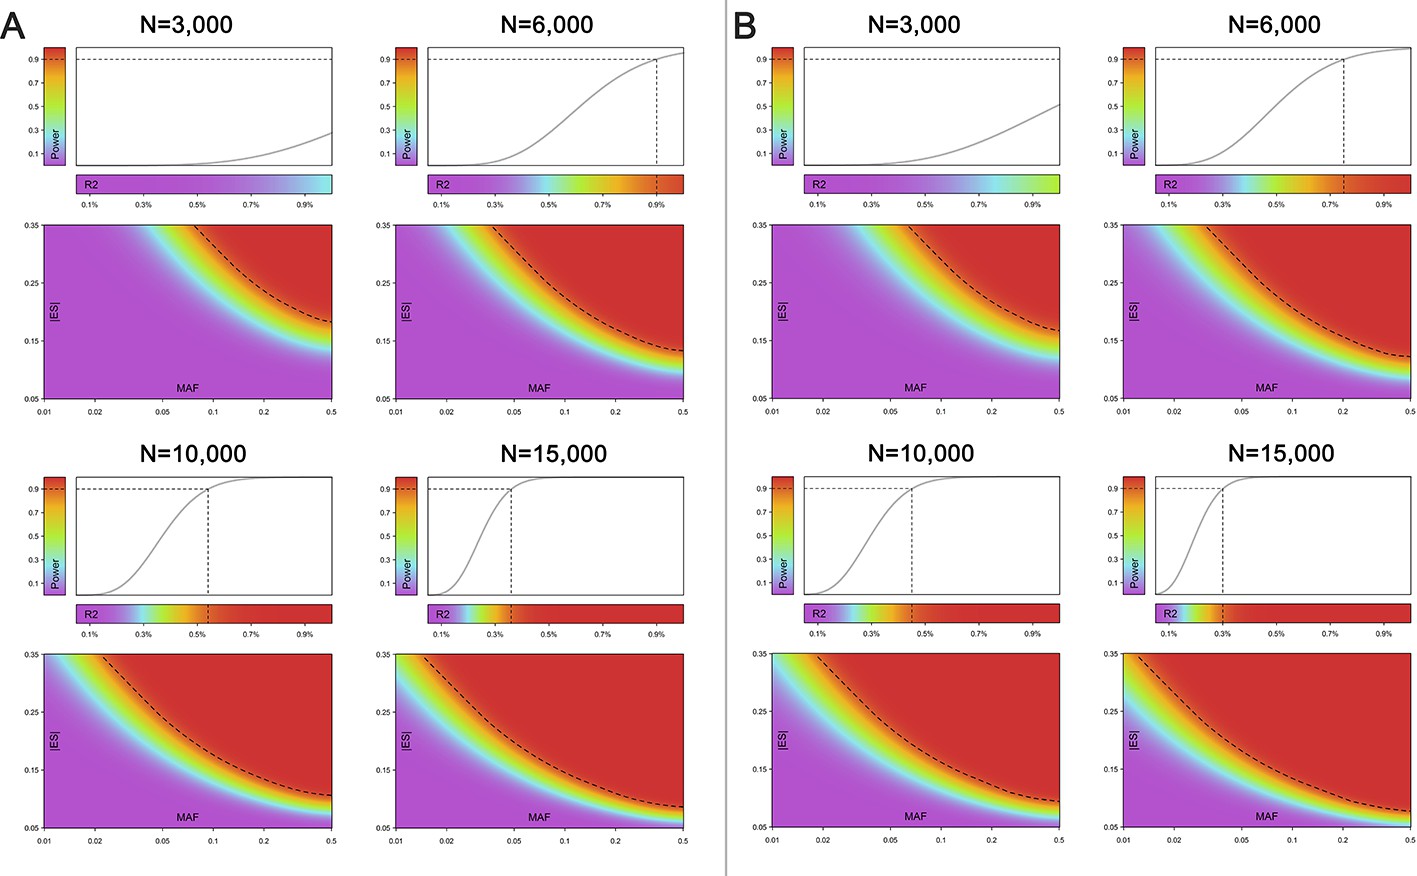
Power analysis.
The power of association tests under a variety of sample sizes (N = 3,000, 6,000, 10,000 and 15,000) with varied proportions of explained phenotypic variance (R2), absolute effect size (|ES|) and minor allele frequency (MAF) are investigated at (A) our study-wide significant level (1.2 × 10⁻⁹; and (B) our study-wide suggestive significance level (5 × 10⁻⁸). Power and R2 are indicated by different colors. The dashed line represents the distribution of 90% power value. For example, under the sample size of 10,000, our study has 90% power to detect suggestive significant SNP explaining at least 0.43% of the phenotypic variance (R2).
Figure 2 with 24 supplements

Six novel genetic loci associated with facial shape phenotypes and successfully replicated.
The figure is composed by six parts, (A) 1p36.22 CASZ1 region, (B) 4q28.1 INTU region, (C) 6p21.2 KIF6 region, (D) 12q24.21 TBX3 region, (E) 14q32.2 C14orf64 region, and (F) 16q12.2 RPGRIP1L region. Each part includes two figures, Face map (left) denoting all of the top-SNP-associated phenotypes weighted by the statistical significance (-log10P). The dashed line means that the P value was nominally significant (p<0.01) but did not reach study-wide suggestive significance (p>5e-8). LocusZoom (right) shows regional association plots for the top-associated facial phenotypes with candidate genes aligned below according to the chromosomal positions (GRCh37.p13) followed by linkage disequilibrium (LD) patterns (r2) of EUR in the corresponding regions. Similar figures for all 24 study-wide suggestively significant loci are provided in Figure 2—figure supplements 1–24.
Figure 2—figure supplement 1
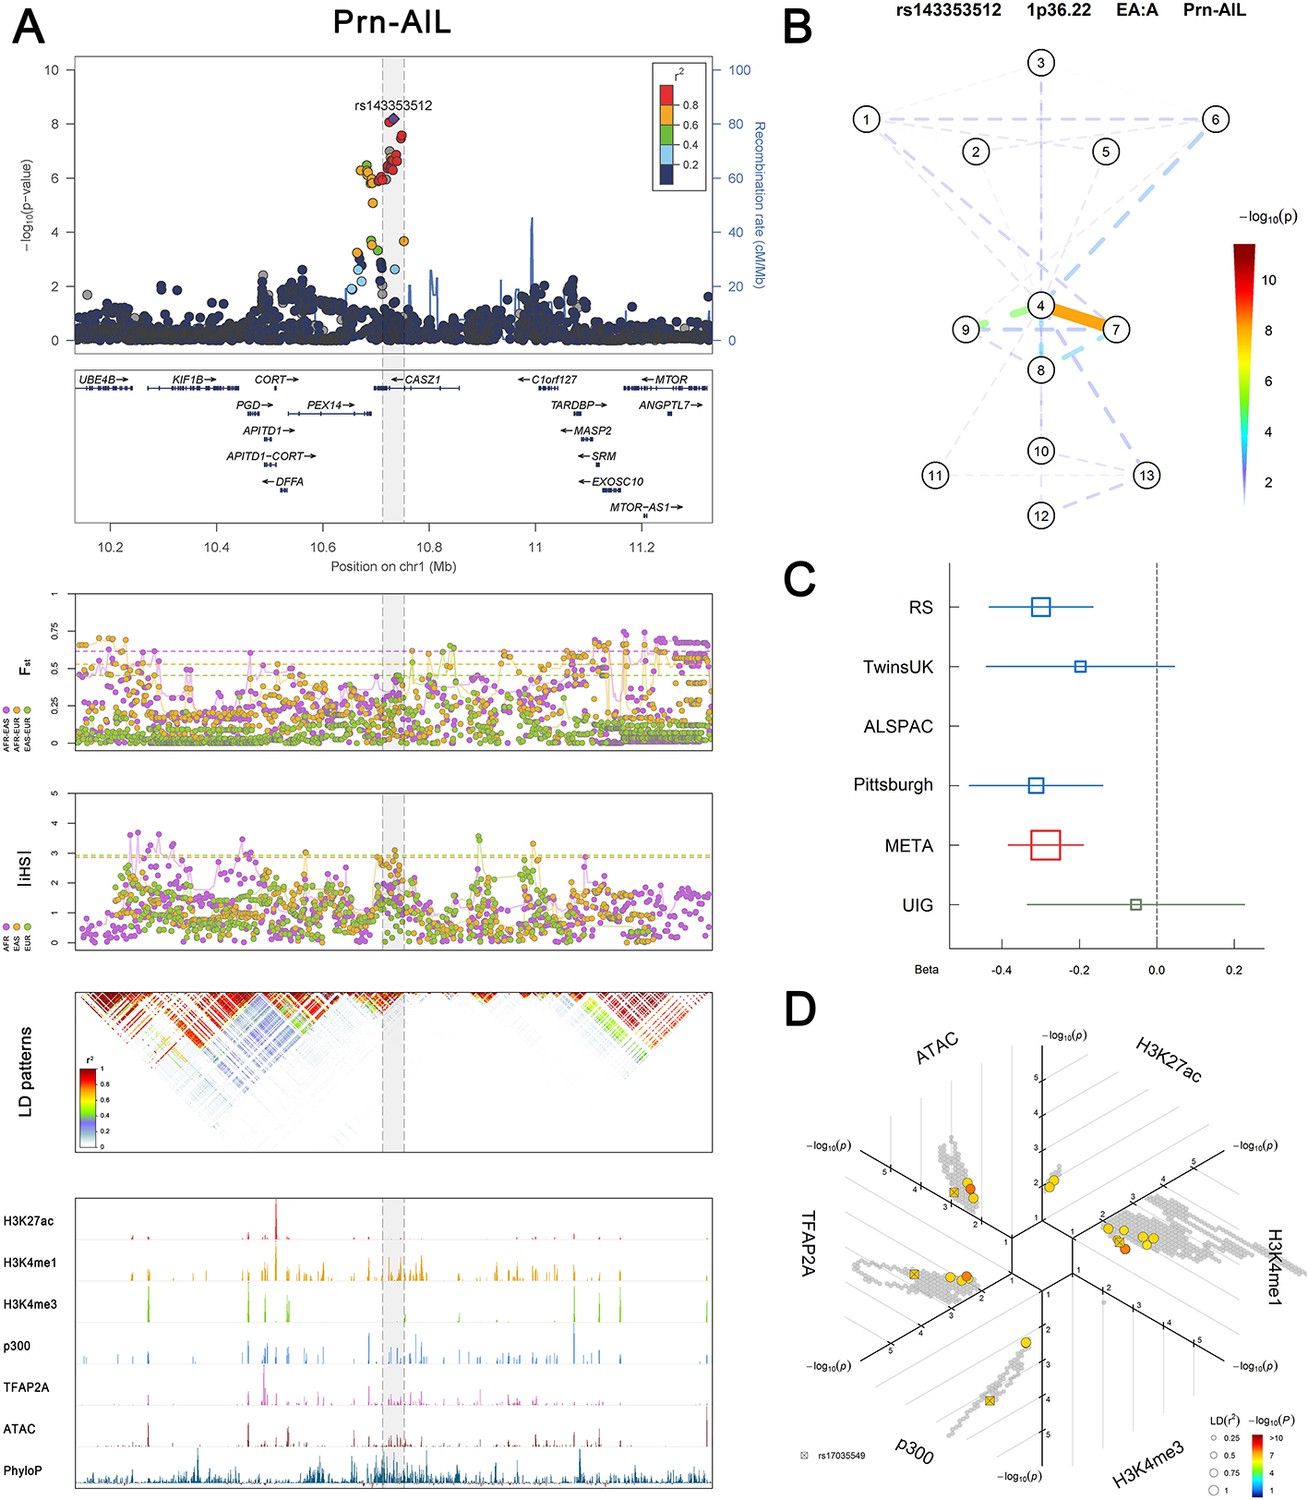
Overviews of association, selection, LD and regulation patterns in 24 associated regions.
(Figure 2—figure supplements 1–6 show six novel replicated loci, Figure 2—figure supplements 7–17 show 11 novel non-replicated loci, Figure 2—figure supplements 18–24 show seven previously reported loci) (A) From up to down, the 1st panel shows regional association plots (LocusZoom) for the top-associated facial phenotypes with candidate genes aligned below according to the chromosomal positions (GRCh37.p13). The 2nd panel shows signals of local positive selection using diversity (FST) and conservation (|iHS|) statistics between and within EUR, AFR, and EAS population samples from the 1000 Genomes Project. The 3rd panel denotes the linkage disequilibrium (LD) patterns (r2) in the associated region. The 4th panel shows epigenetic annotation of CNCC’s regulatory elements in corresponding regions using WashU Epigenome Browser. Chip-seq profiles display histone modifications associated with active enhancers (H3K27ac, H3K4me1) or promoters (H3K4me3), and binding of general coactivator p300 and transcription factor TFAP2A. The ATAC-seq track shows chromatin accessibility. The PhyloP track indicates cross-species conservation. (B) Shows a face map denoting the significance (-log10P) for the associations between the top SNP and facial phenotypes. The dashed line means that the P value was nominally significant (p<0.01) but did not reach study-wide suggestive significance (p>5e-8). (C) Effect sizes for the derived allele at index SNPs. Blue, red, and green boxes represent effect sizes estimated in the participating discovery cohort, combined meta-analysis, and in the replication UYG cohort, respectively. Box sizes are proportional to sample size. Horizontal bars indicate a 95% confidence interval of width equal to 1.96 standard errors. (D) All SNPs in LD (r2 > 0.25) with the top-associated SNP and all base-pairs in vicinity (within 20 kb, p<0.05) are displayed according to their log scaled quantile rank (-log10p, axis scale) in the circular figure below, where the rank is calculated using the Chip-seq values in the whole genome. In addition, SNPs associated with facial phenotypes in our meta-analysis of GWASs were highlighted according to their association p values (PMeta, color scale) and their LD (r2) with the top-associated SNP in the region (points size). Association, selection, LD and regulation patterns for rs143353512 located around CASZ1.
Figure 2—figure supplement 2
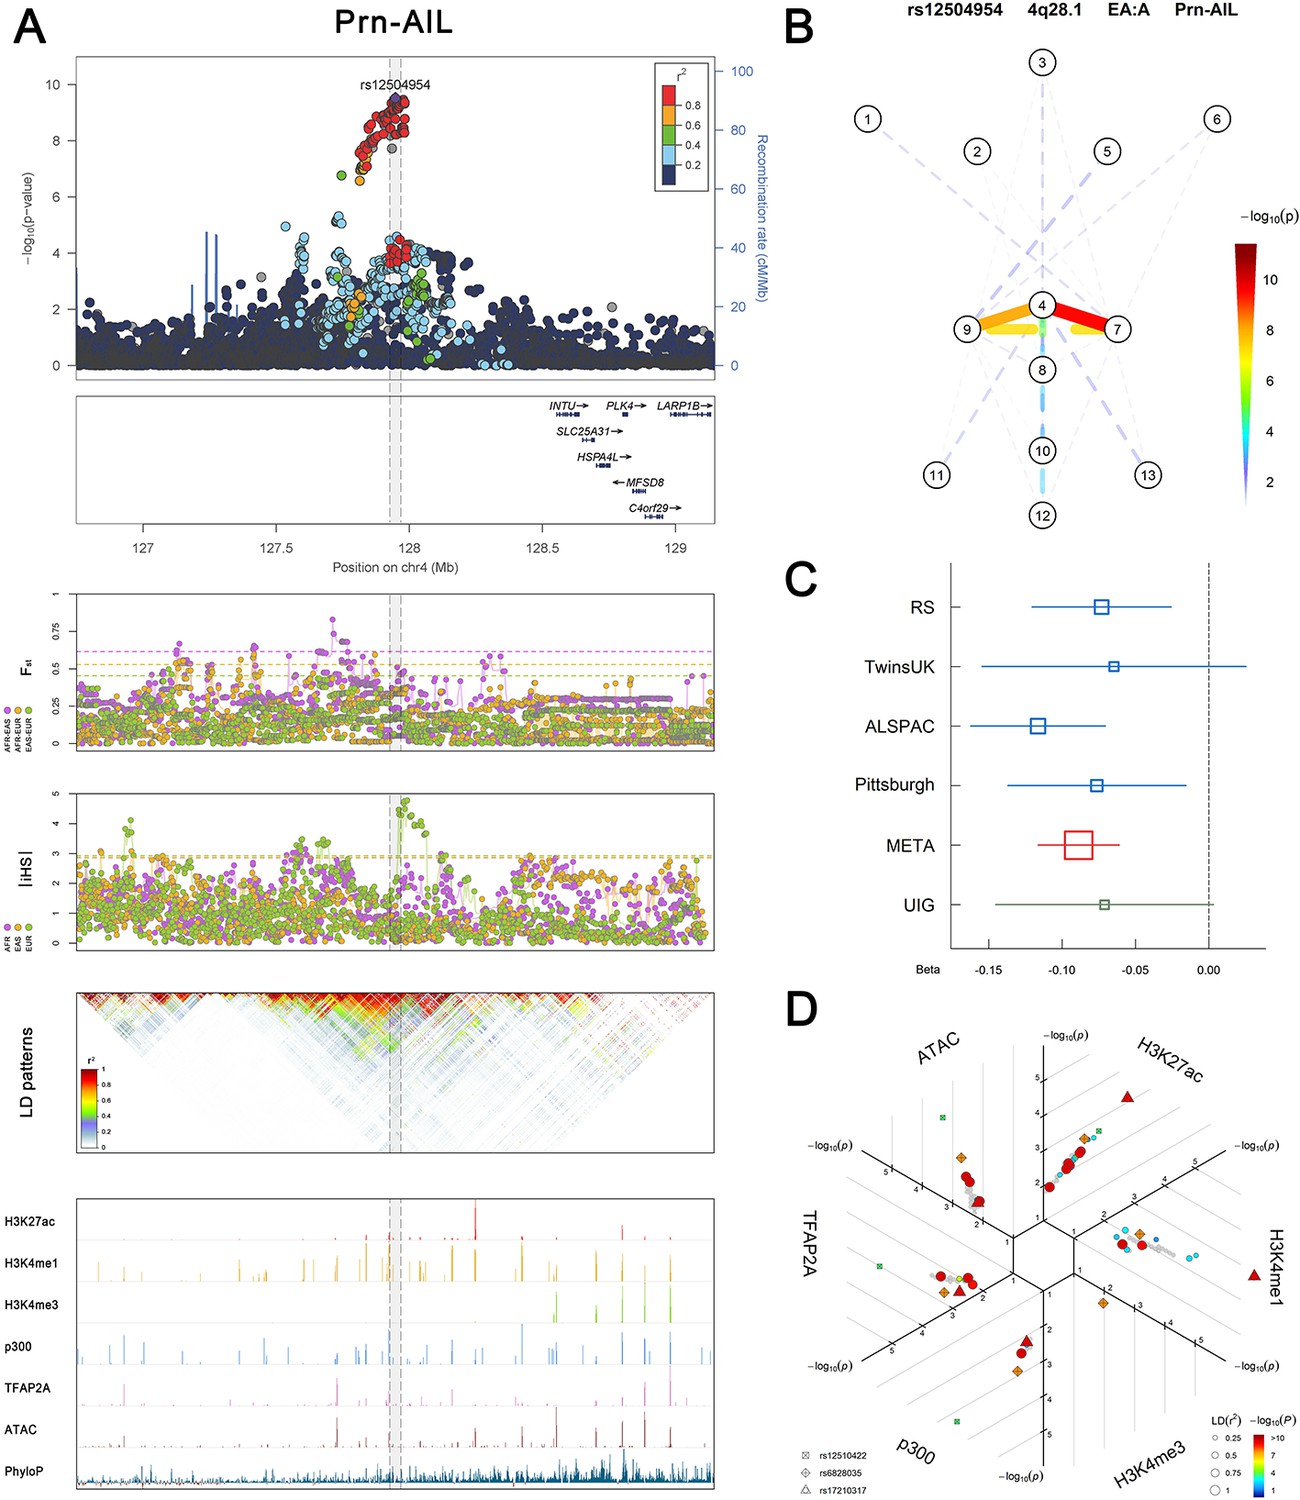
Association, selection, LD and regulation patterns for rs12504954 located around INTU.
Figure 2—figure supplement 3

Association, selection, LD and regulation patterns for rs7738892 located around KIF6.
Figure 2—figure supplement 4
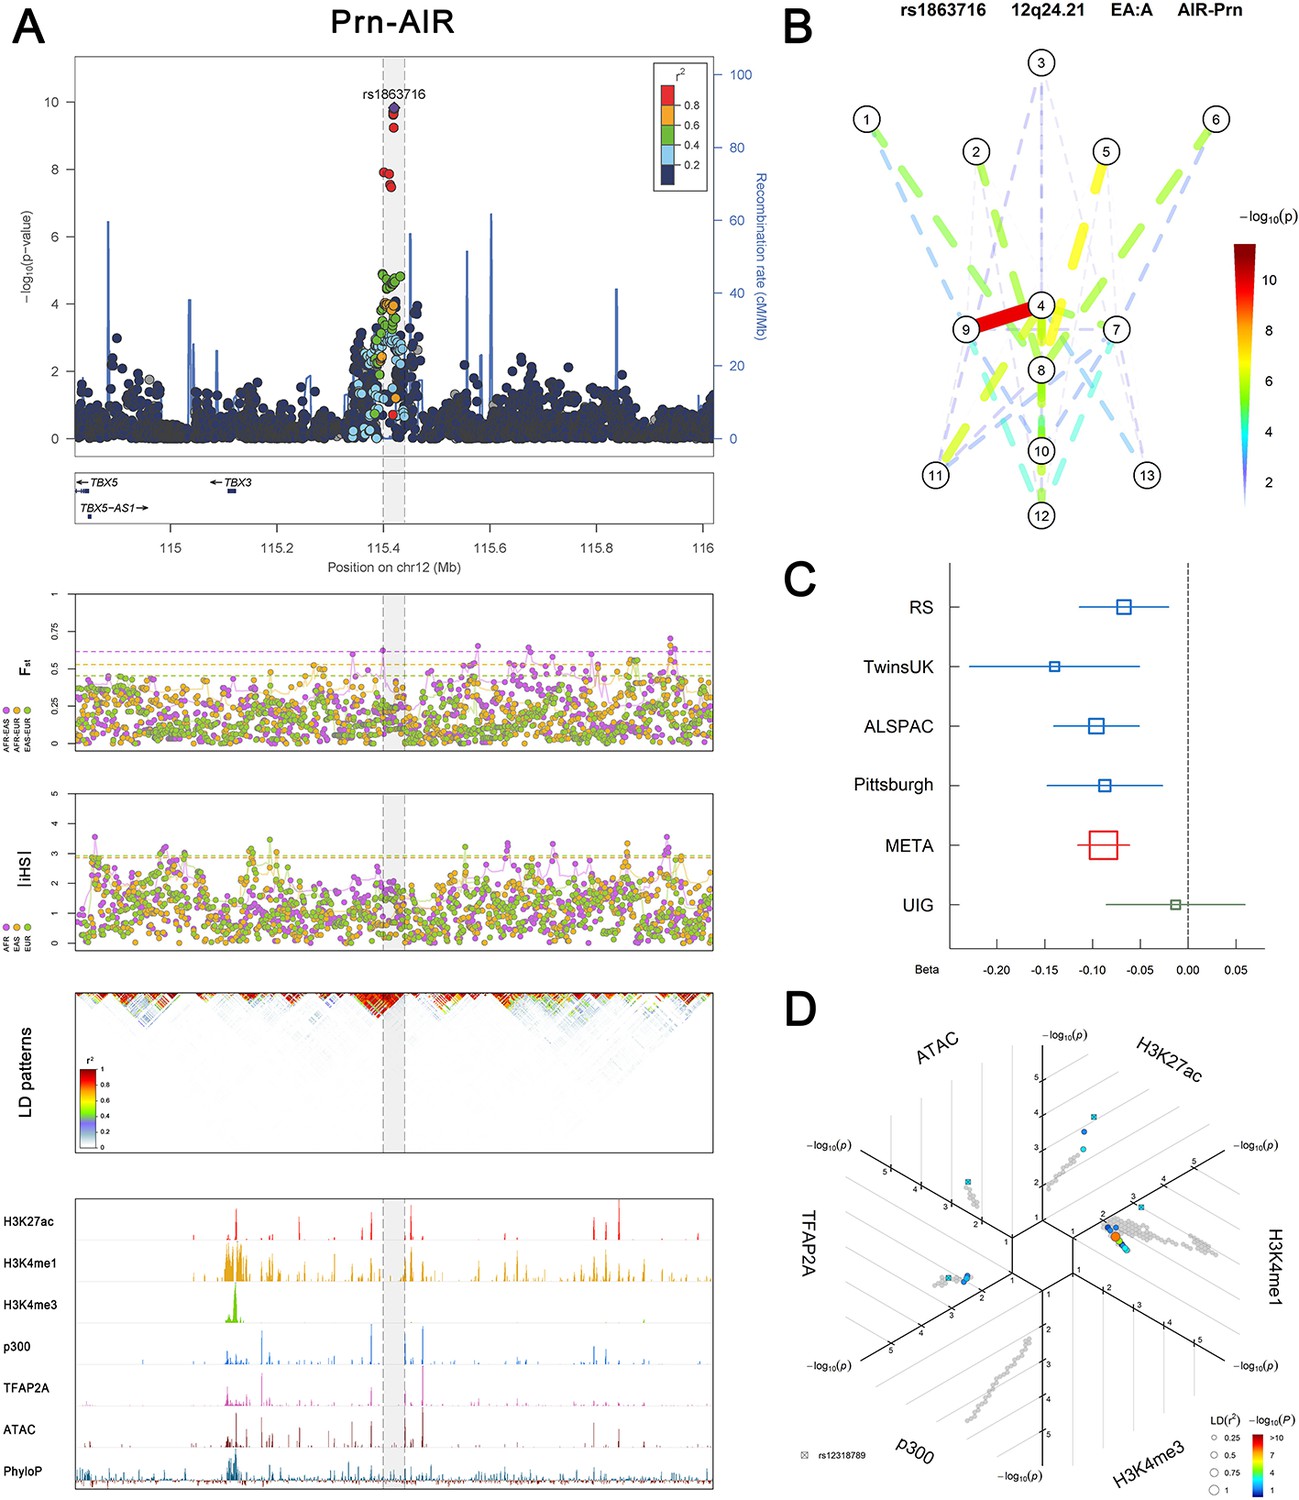
Association, selection, LD and regulation patterns for rs1863716 located around TBX3.
Figure 2—figure supplement 5
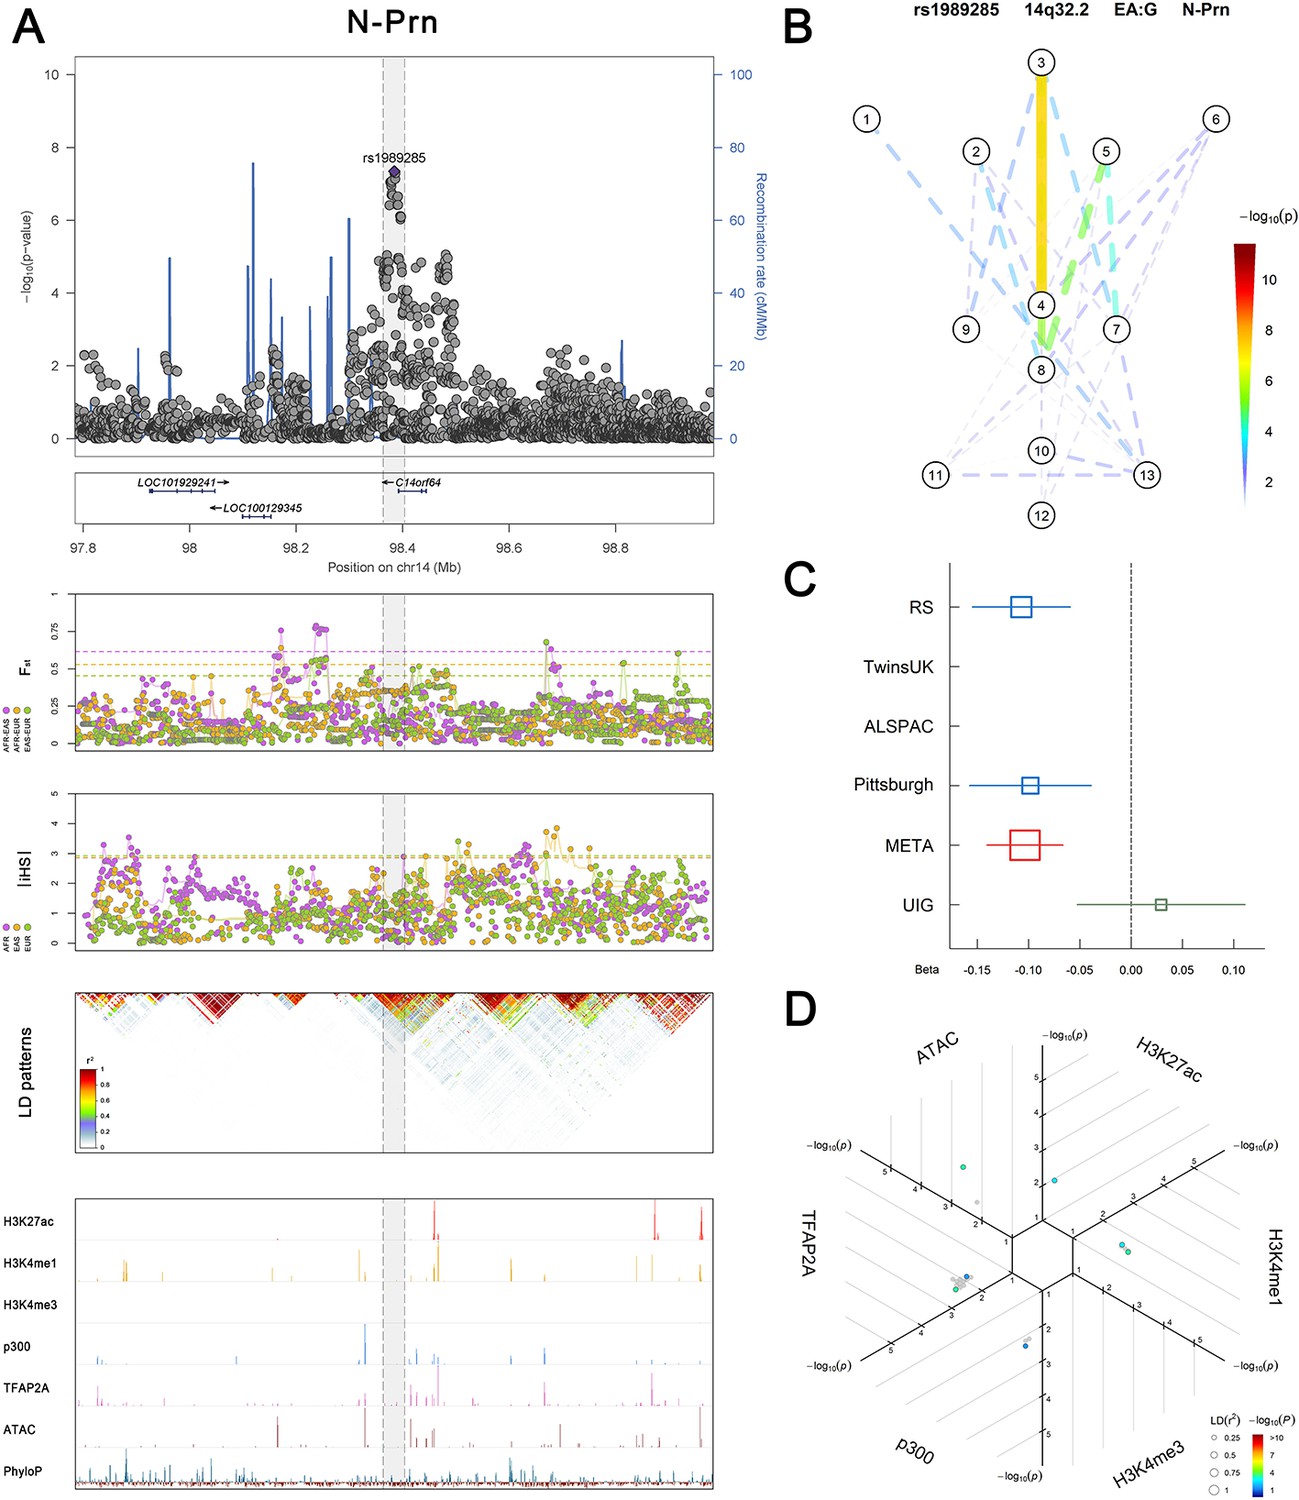
Association, selection, LD and regulation patterns for rs1989285 located around C14orf64.
Figure 2—figure supplement 6
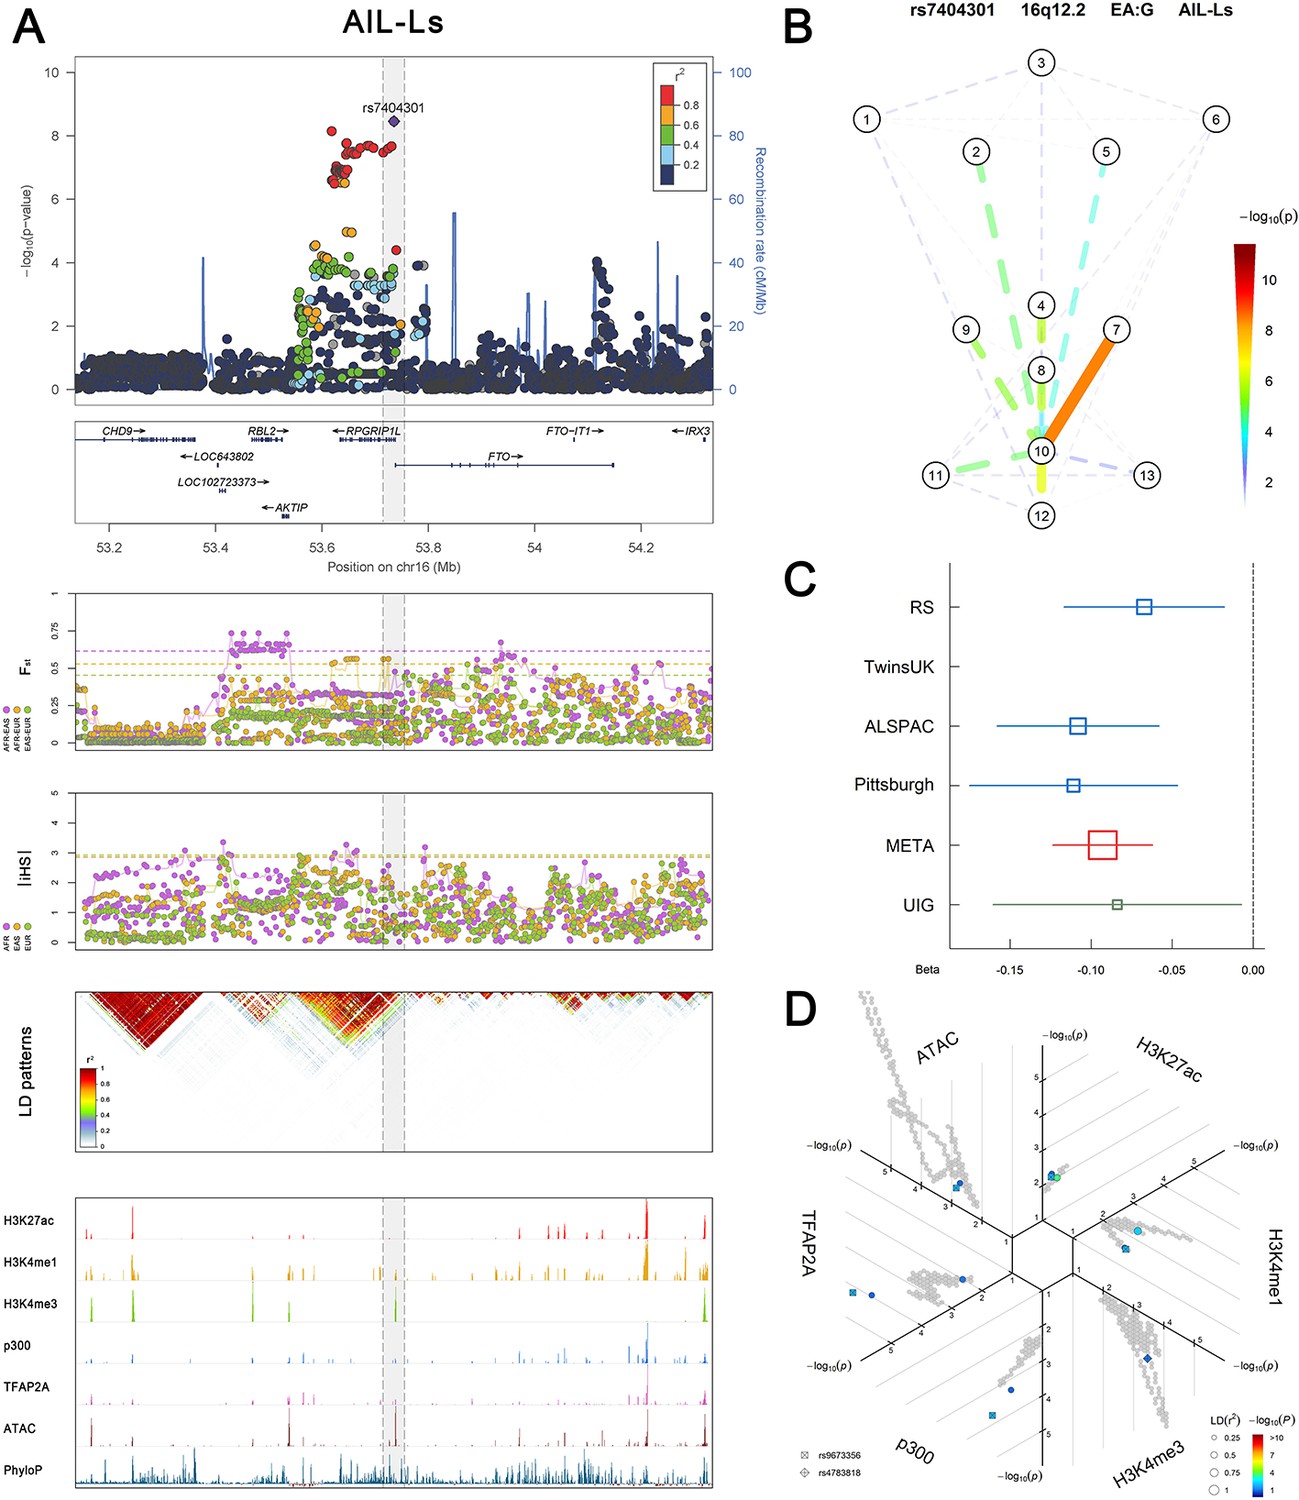
Association, selection, LD and regulation patterns for rs7404301 located around RPGRIP1L.
Figure 2—figure supplement 7
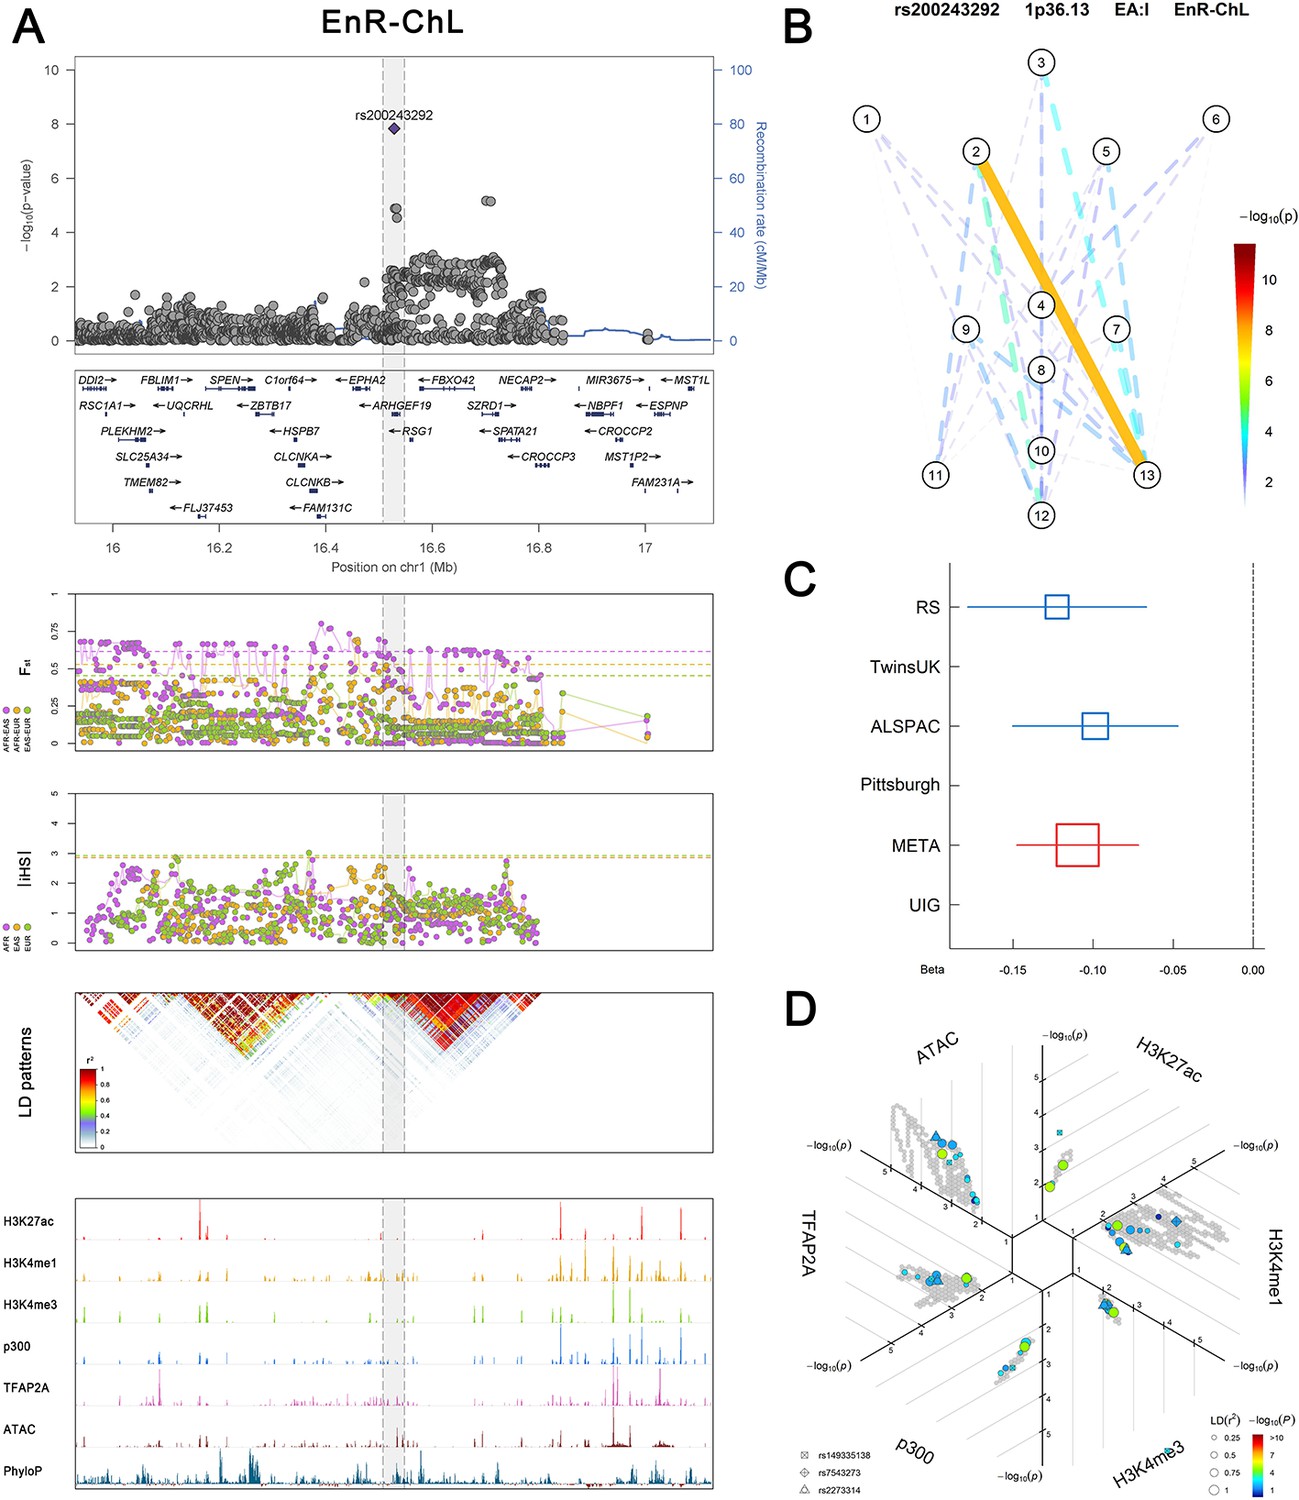
Association, selection, LD and regulation patterns for rs200243292 located around ARHGEF19.
Figure 2—figure supplement 8
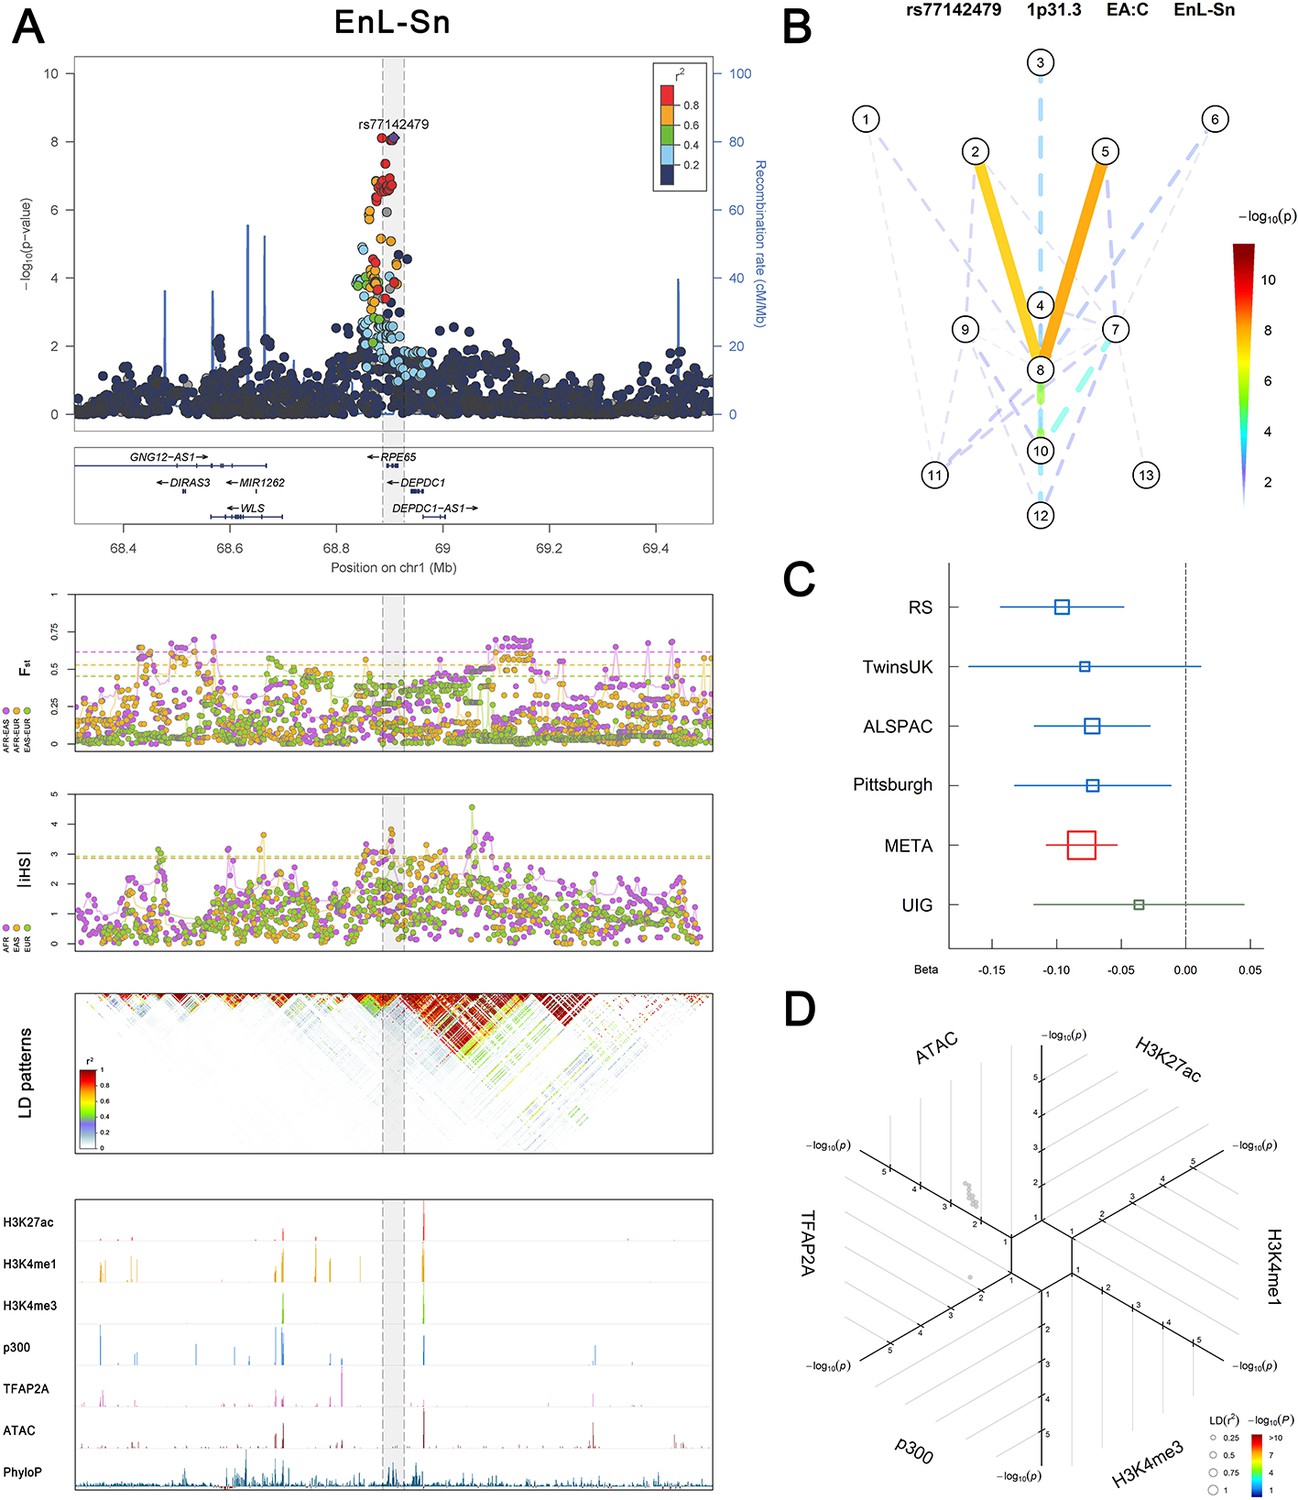
Association, selection, LD and regulation patterns for rs77142479 located around RPE65.
Figure 2—figure supplement 9
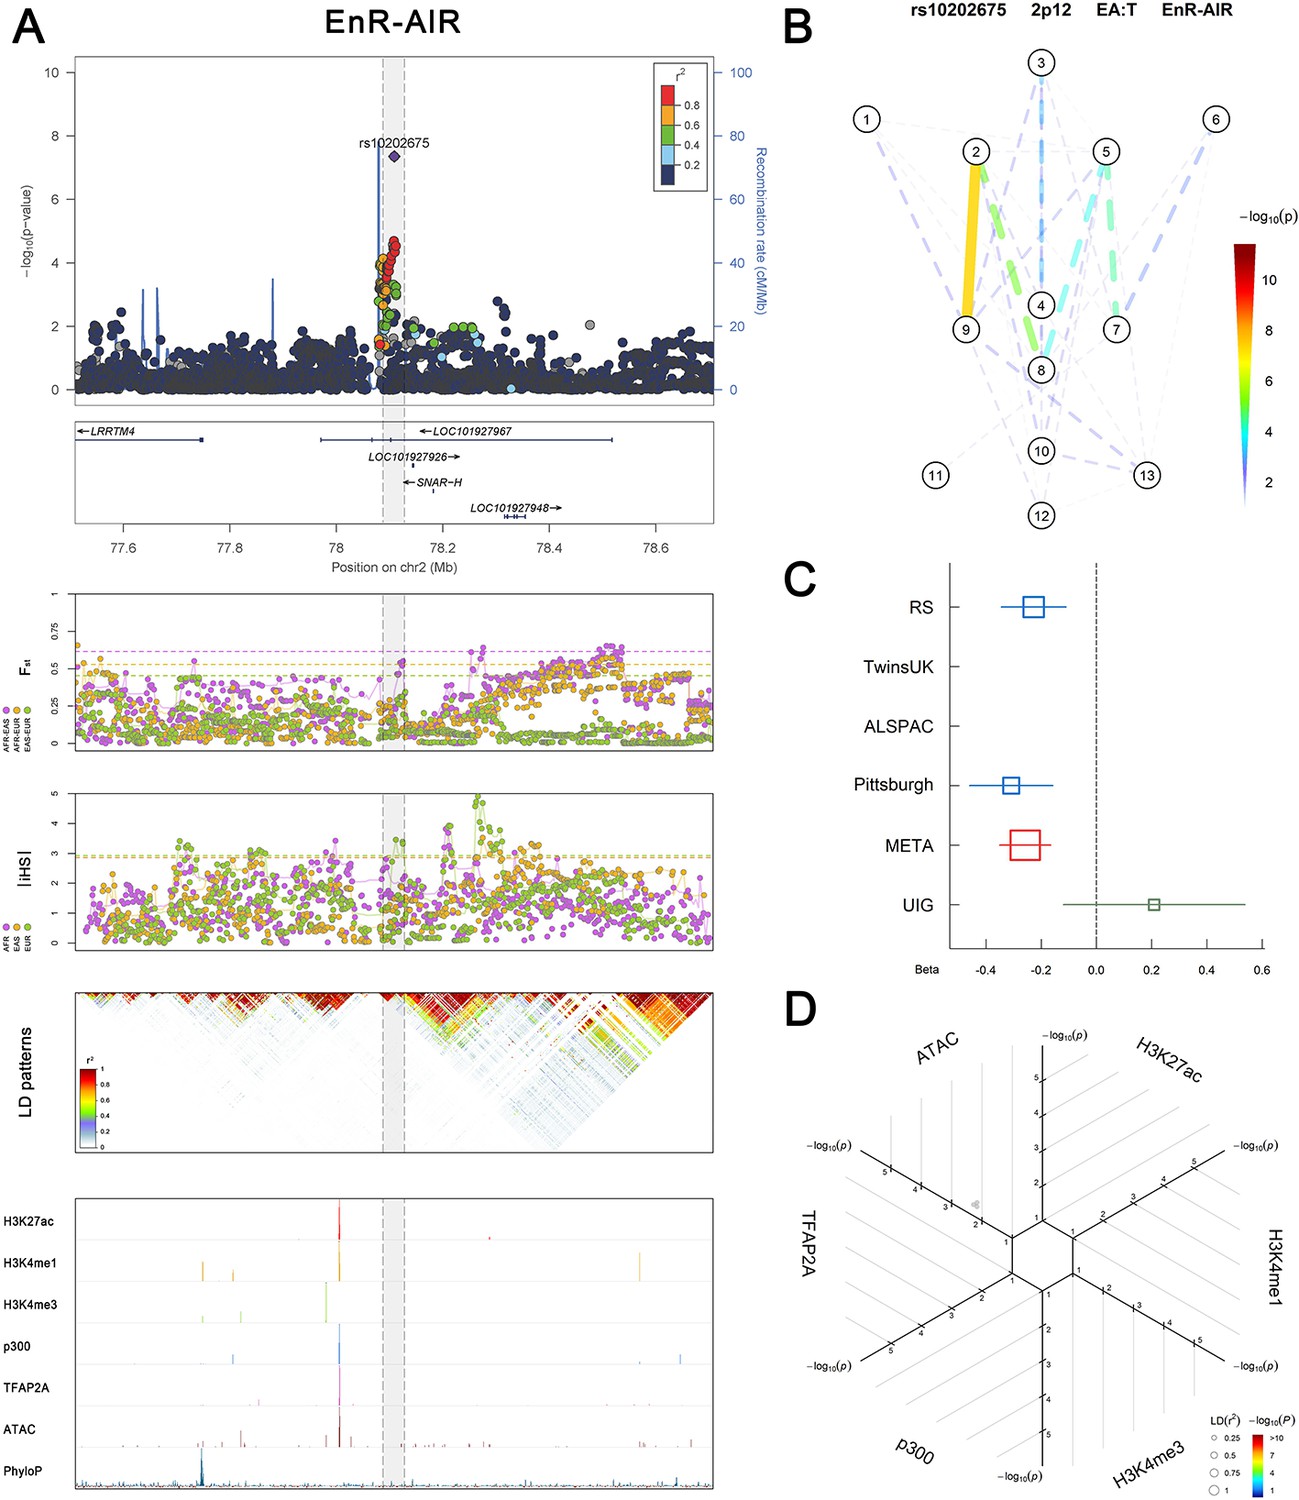
Association, selection, LD and regulation patterns for rs10202675 located around LRRTM4.
Figure 2—figure supplement 10
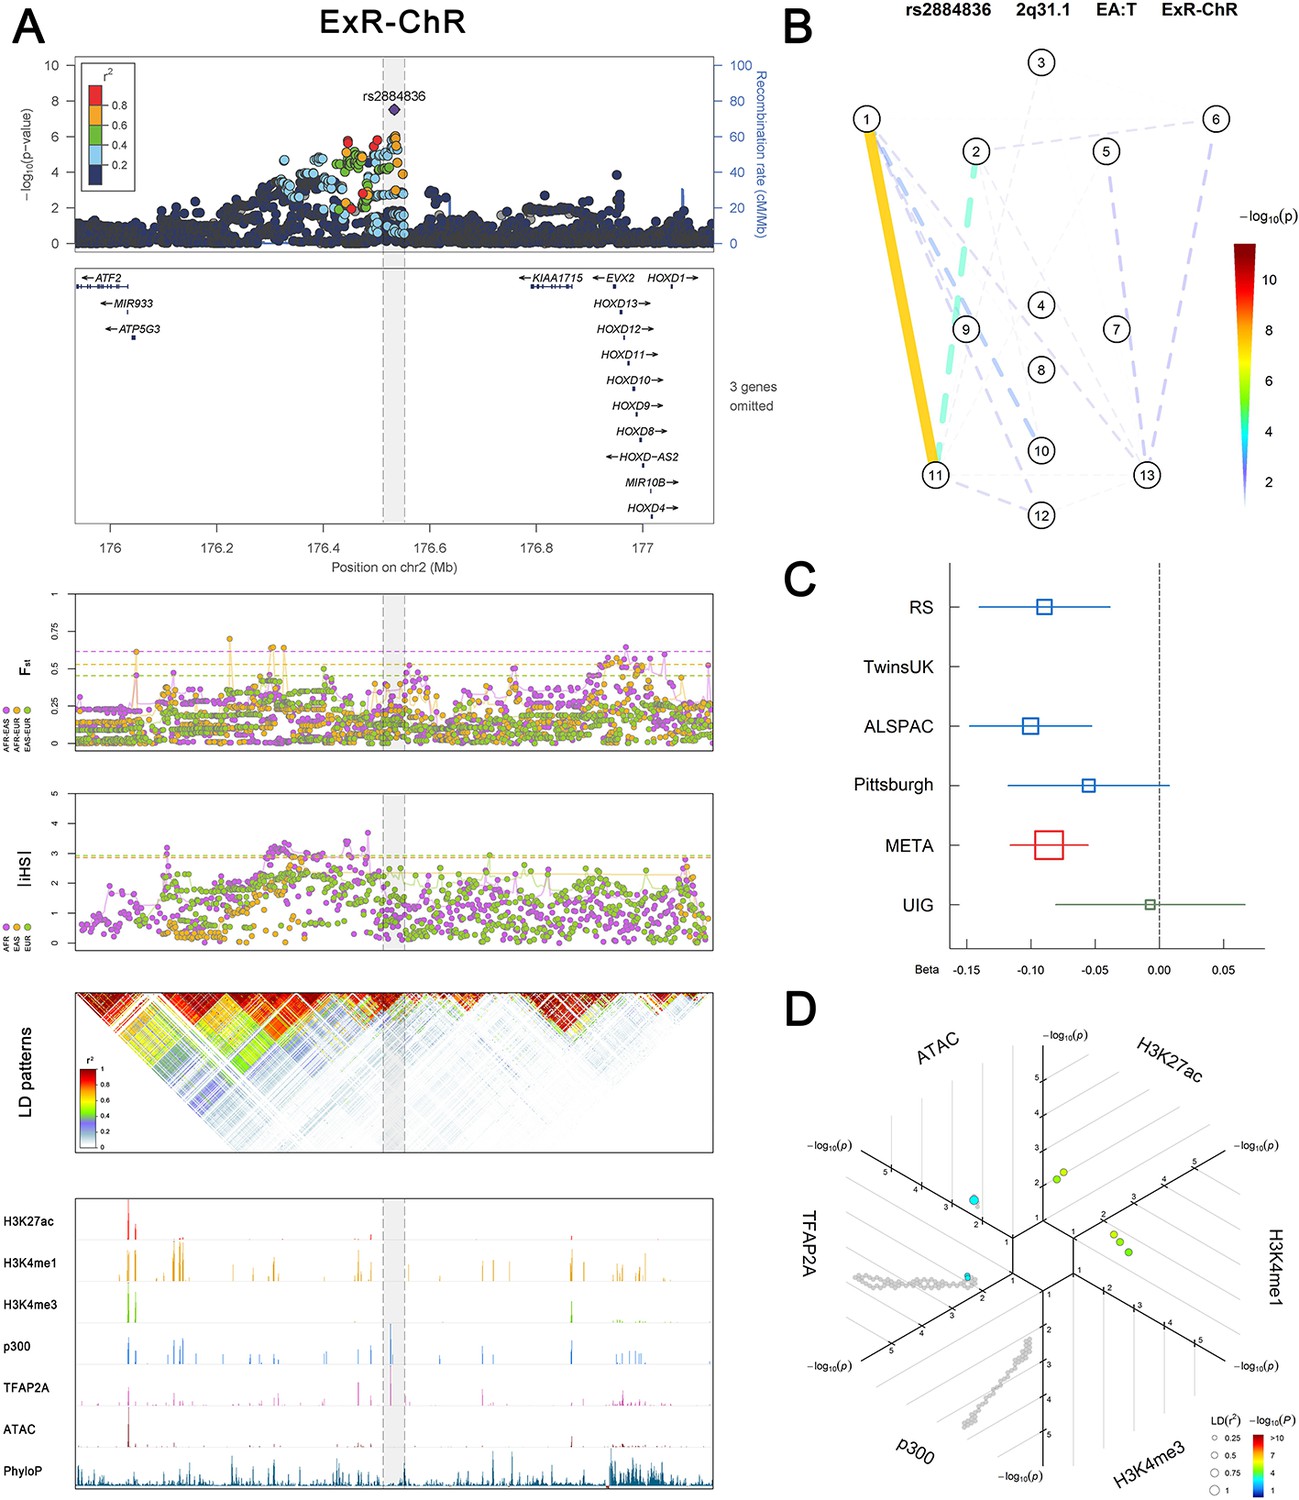
Association, selection, LD and regulation patterns for rs2884836 located around KIAA1715.
Figure 2—figure supplement 11
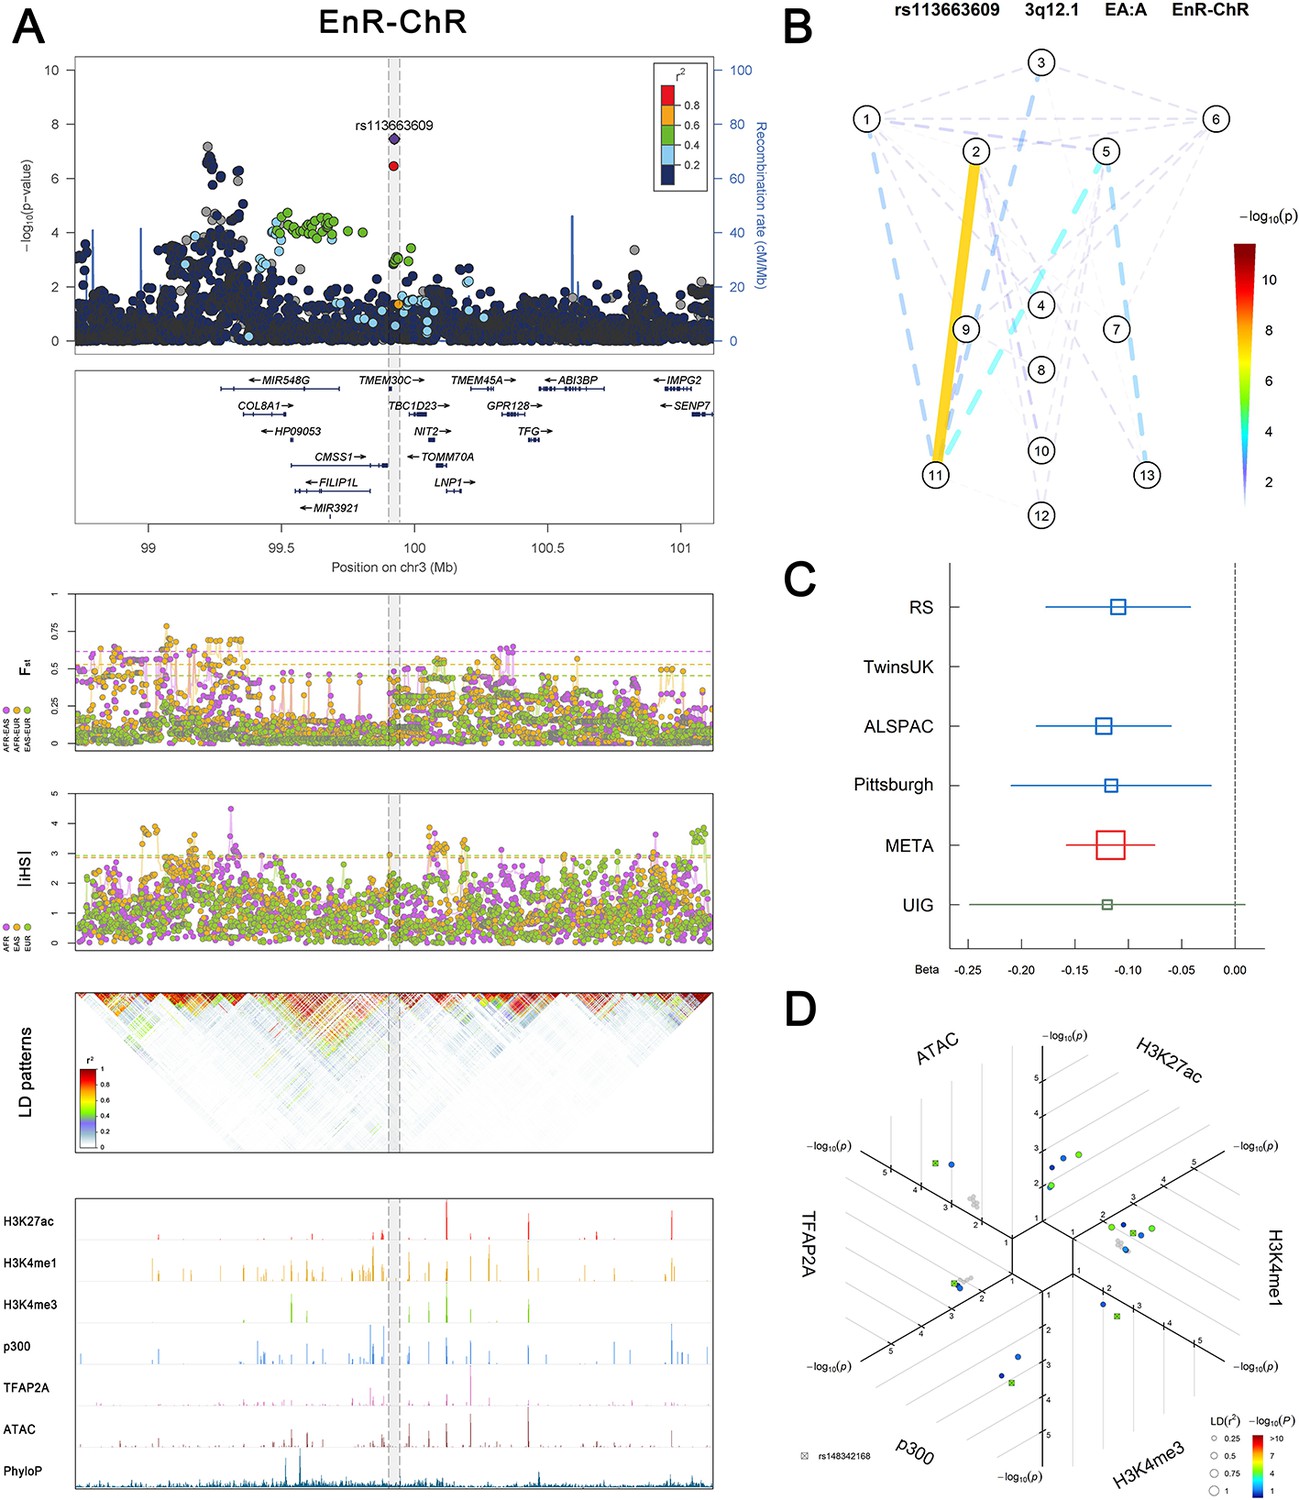
Association, selection, LD and regulation patterns for rs113663609 located around CMSS1.
Figure 2—figure supplement 12
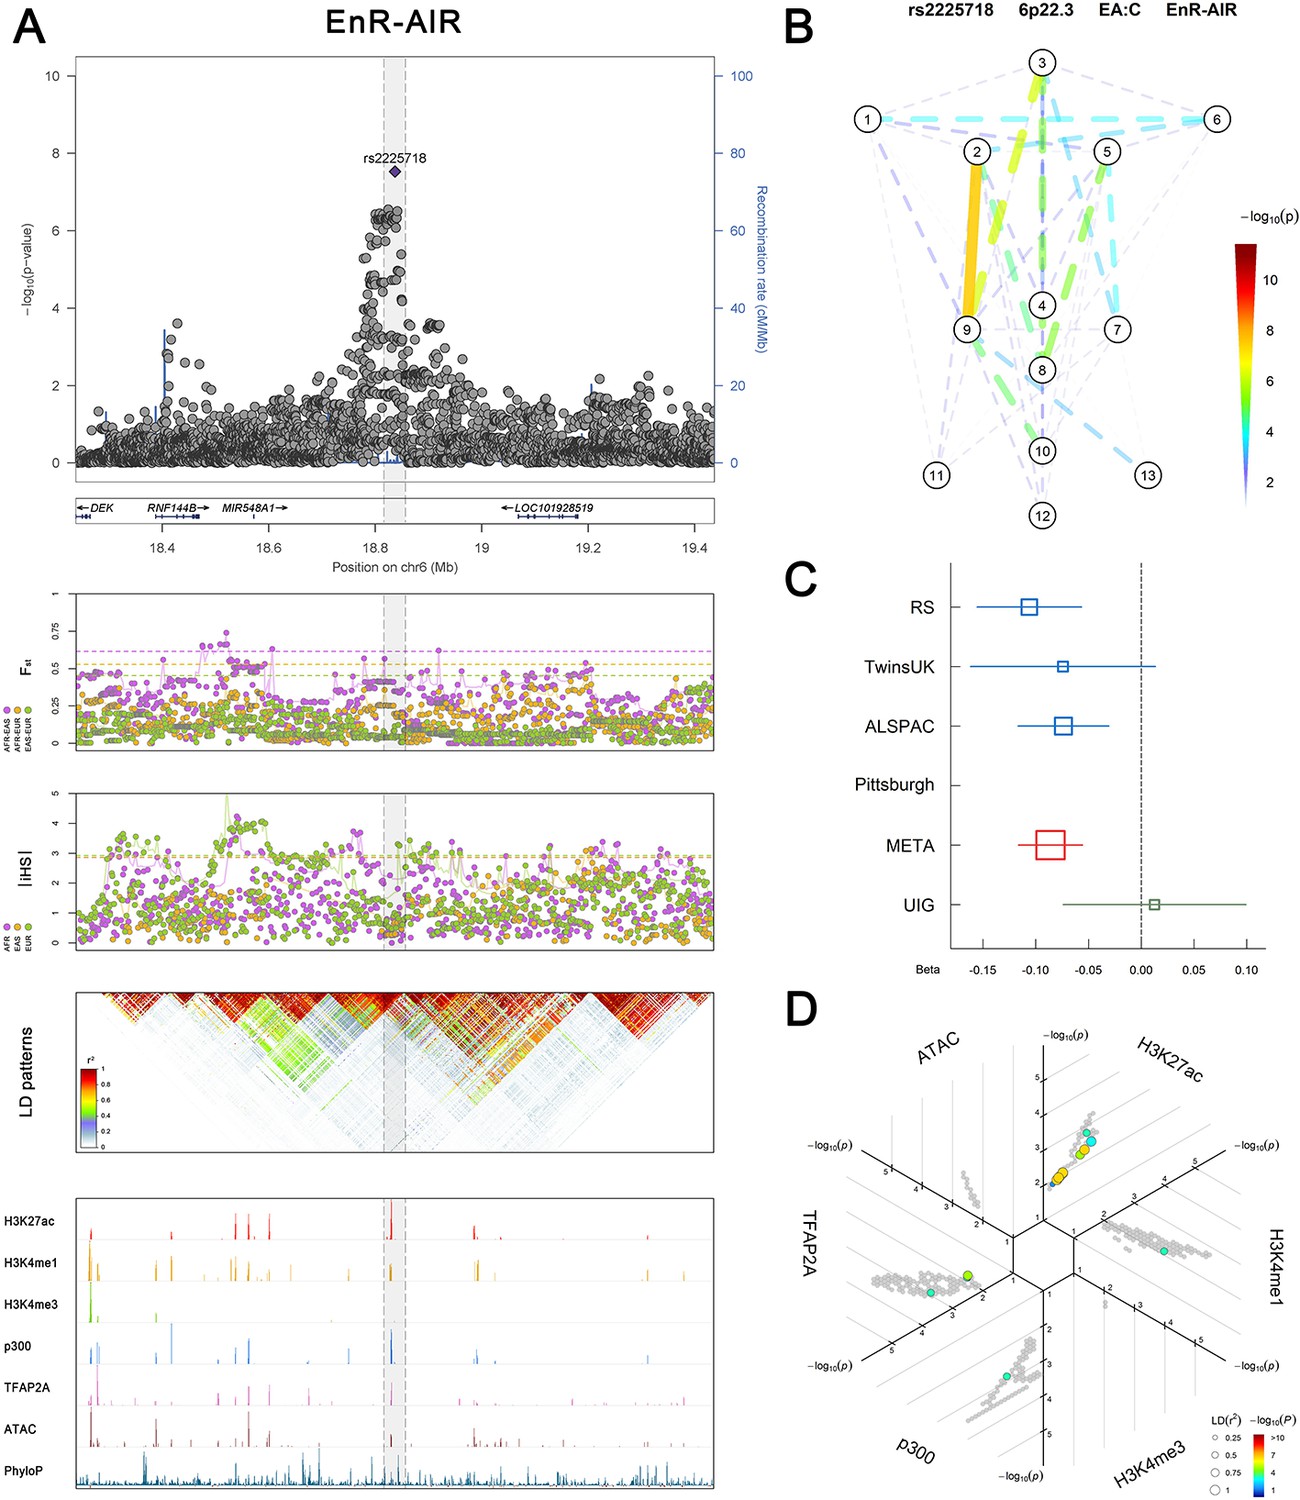
Association, selection, LD and regulation patterns for rs2225718 located around RNF144B.
Figure 2—figure supplement 13
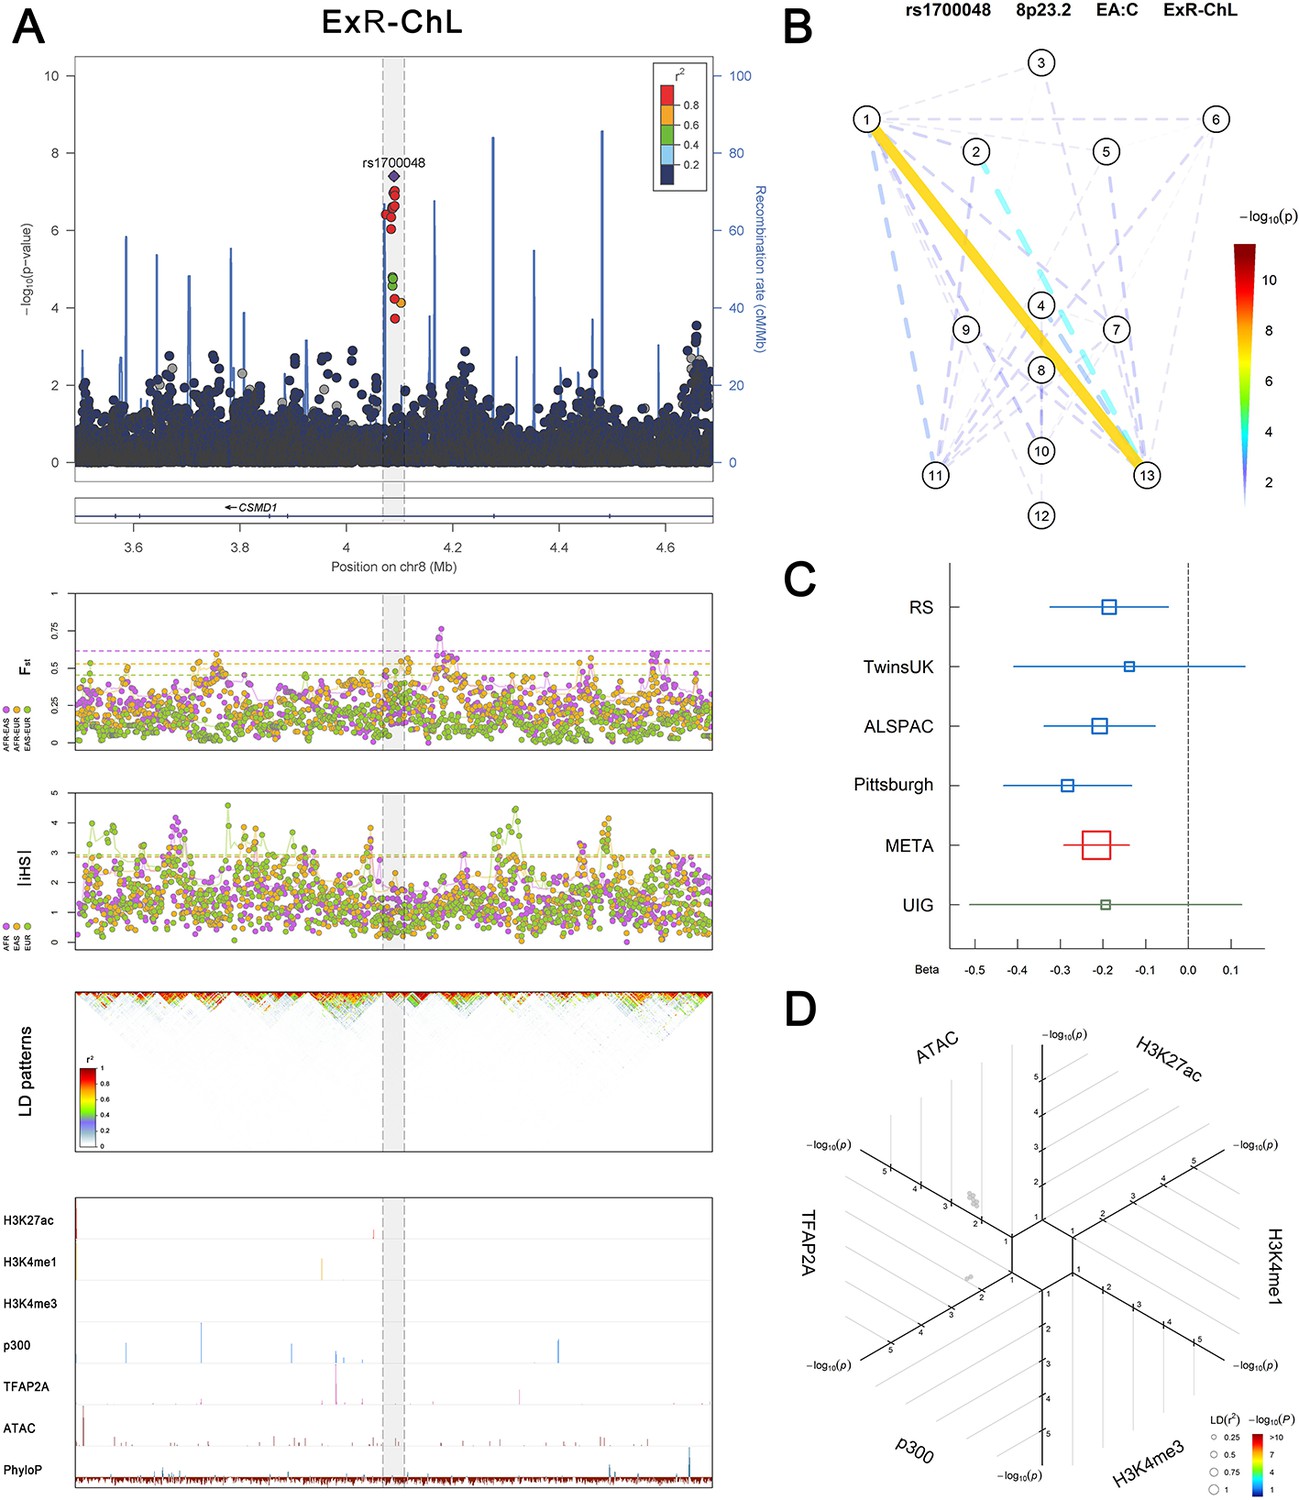
Association, selection, LD and regulation patterns for rs1700048 located around CSMD1.
Figure 2—figure supplement 14
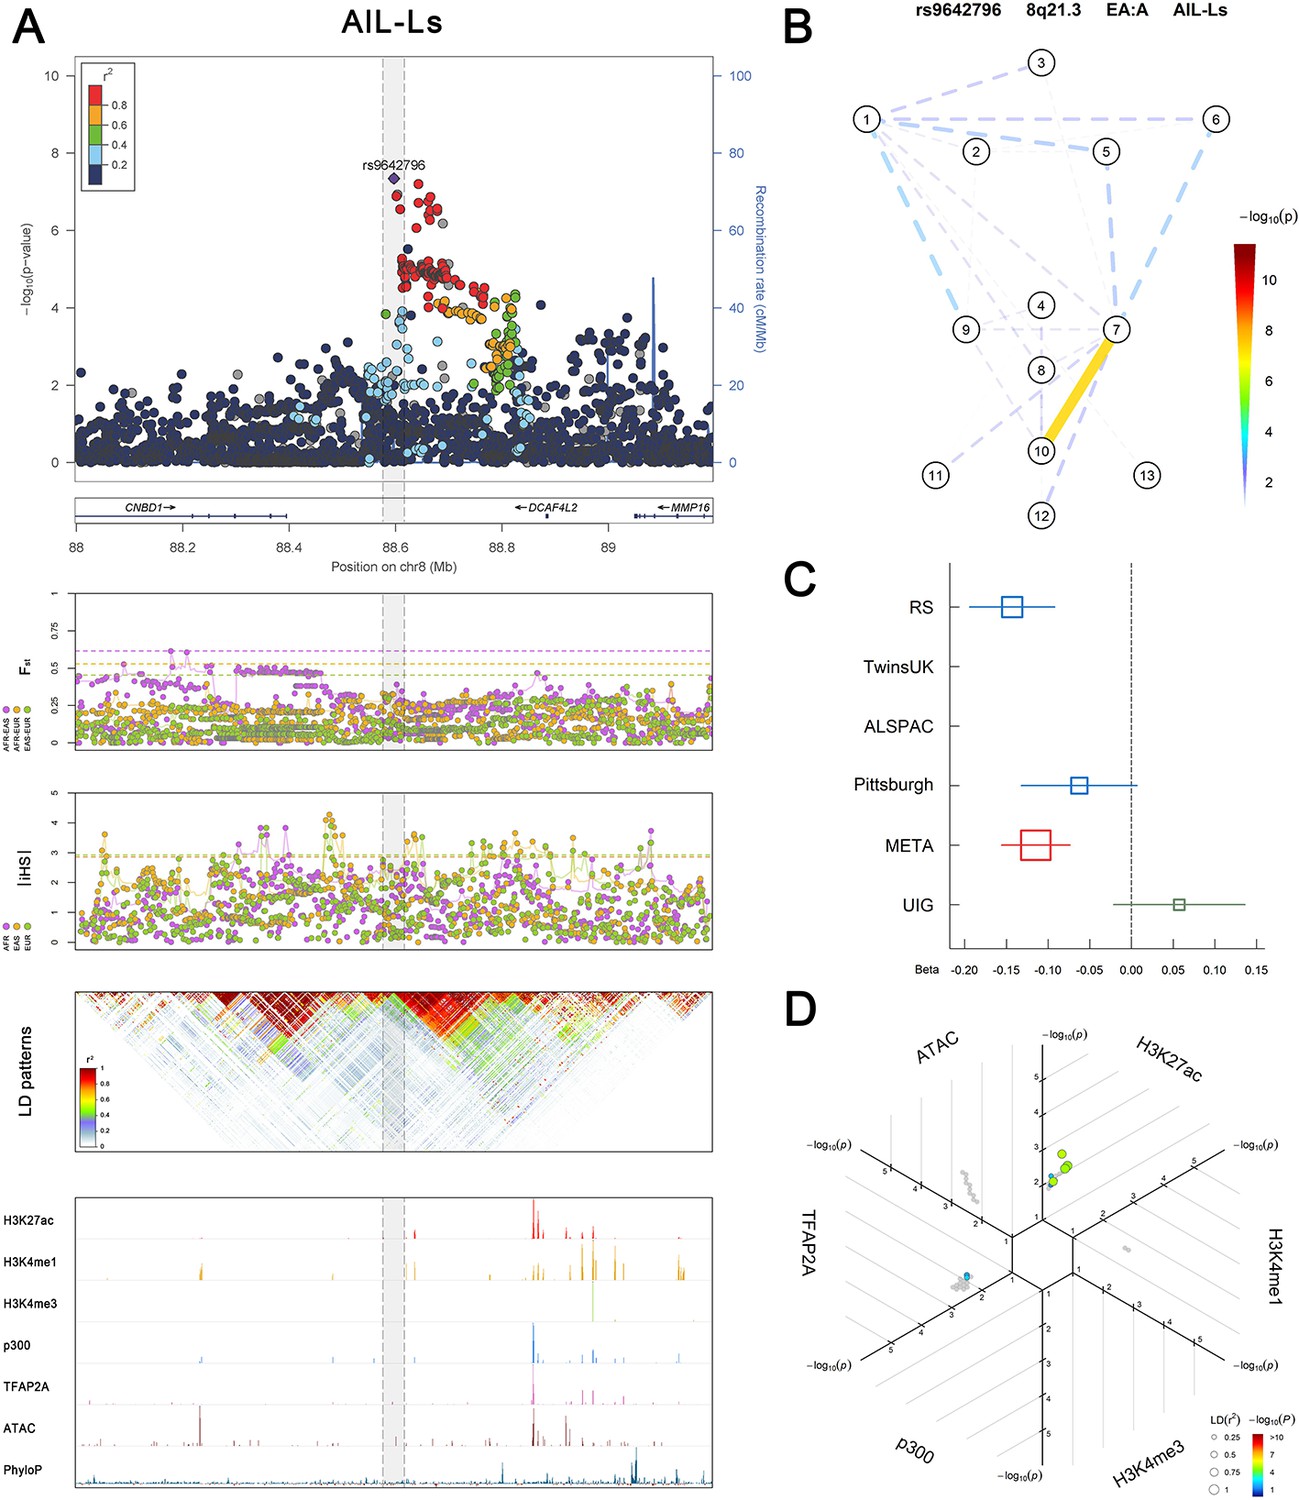
Association, selection, LD and regulation patterns for rs9642796 located around DCAF4L2.
Figure 2—figure supplement 15
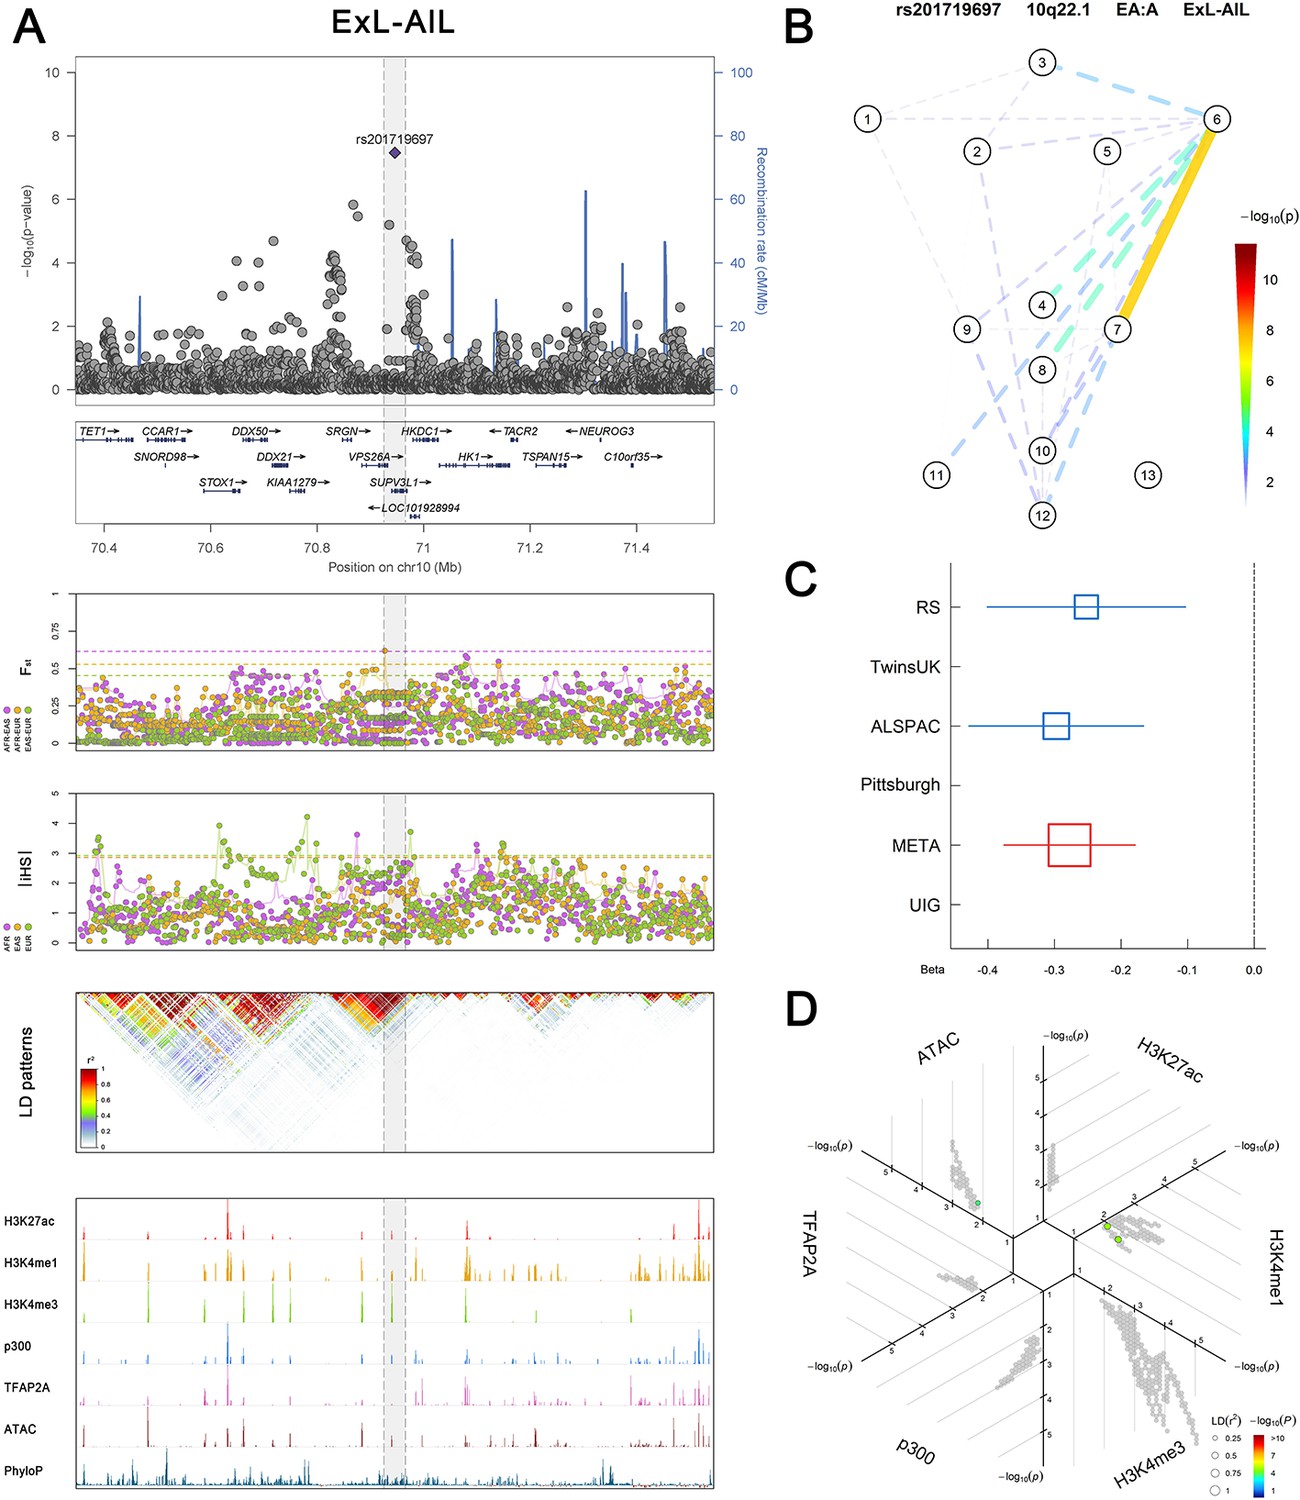
Association, selection, LD and regulation patterns for rs201719697 located around SUPV3L1.
Figure 2—figure supplement 16
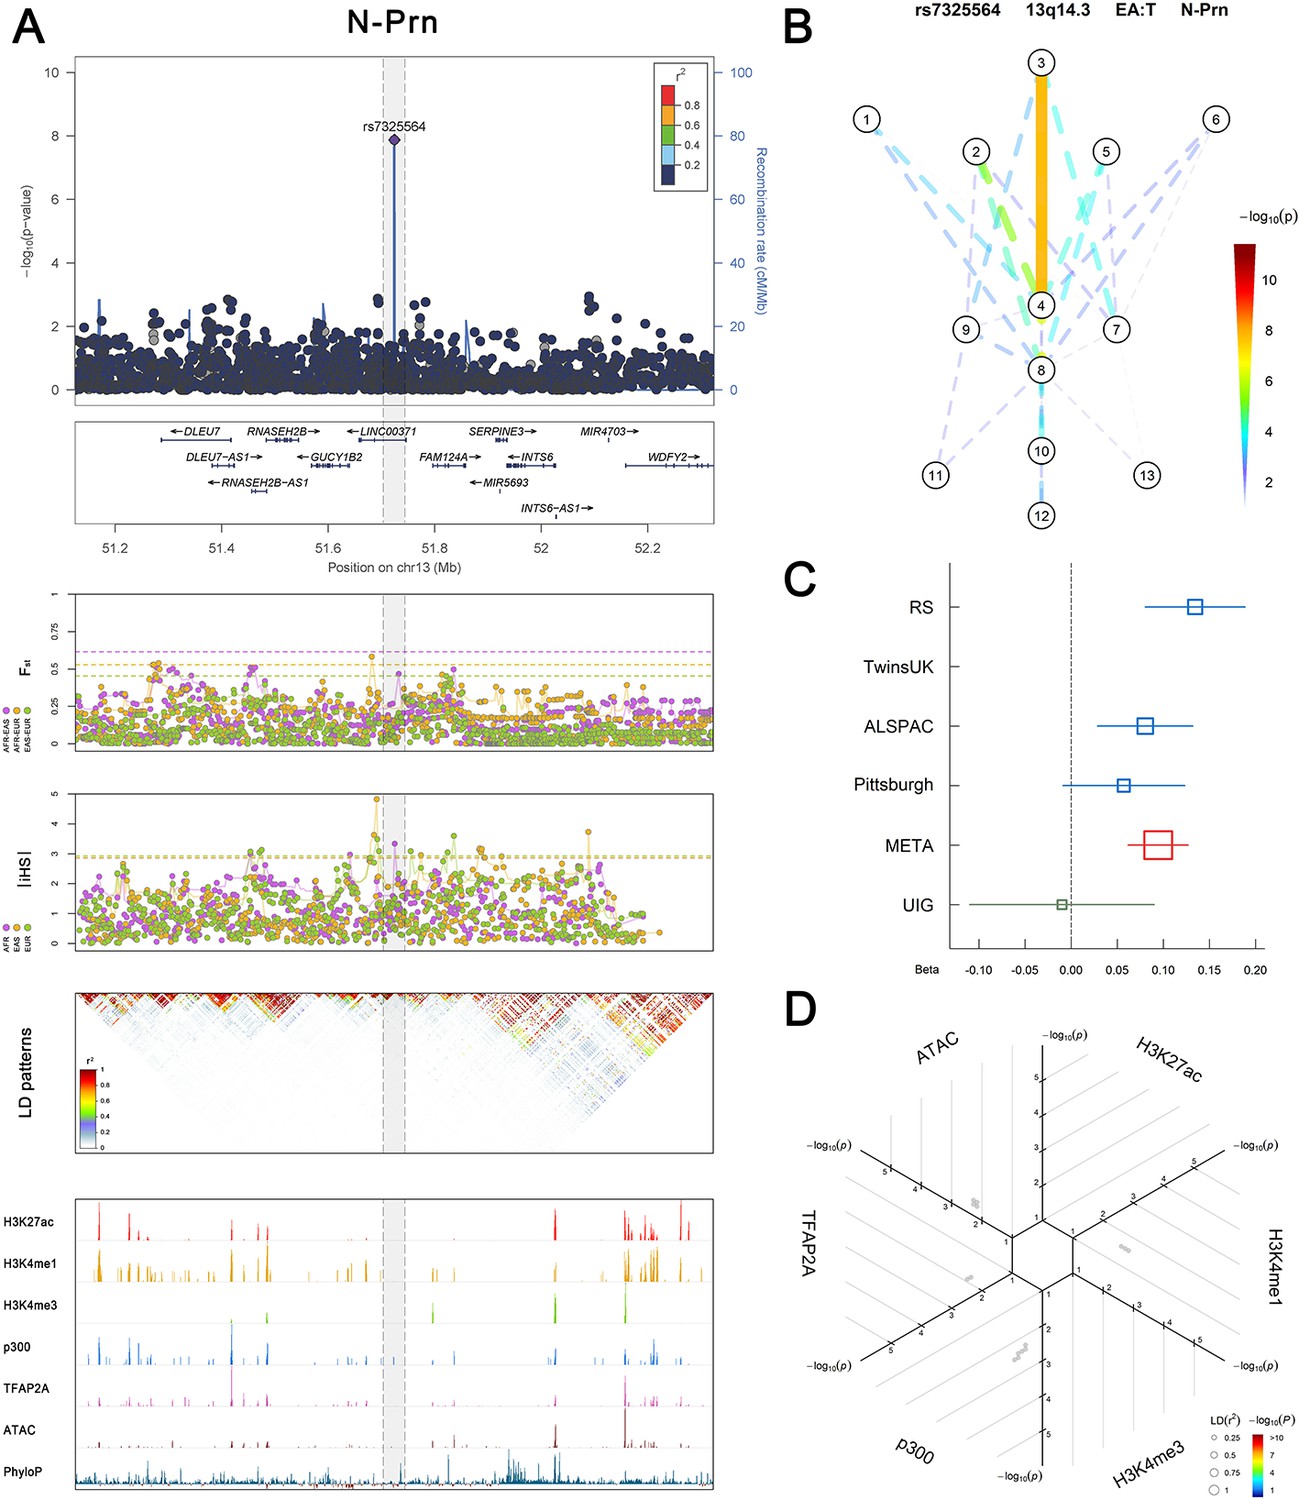
Association, selection, LD and regulation patterns for rs7325564 located around LINC00371.
Figure 2—figure supplement 17
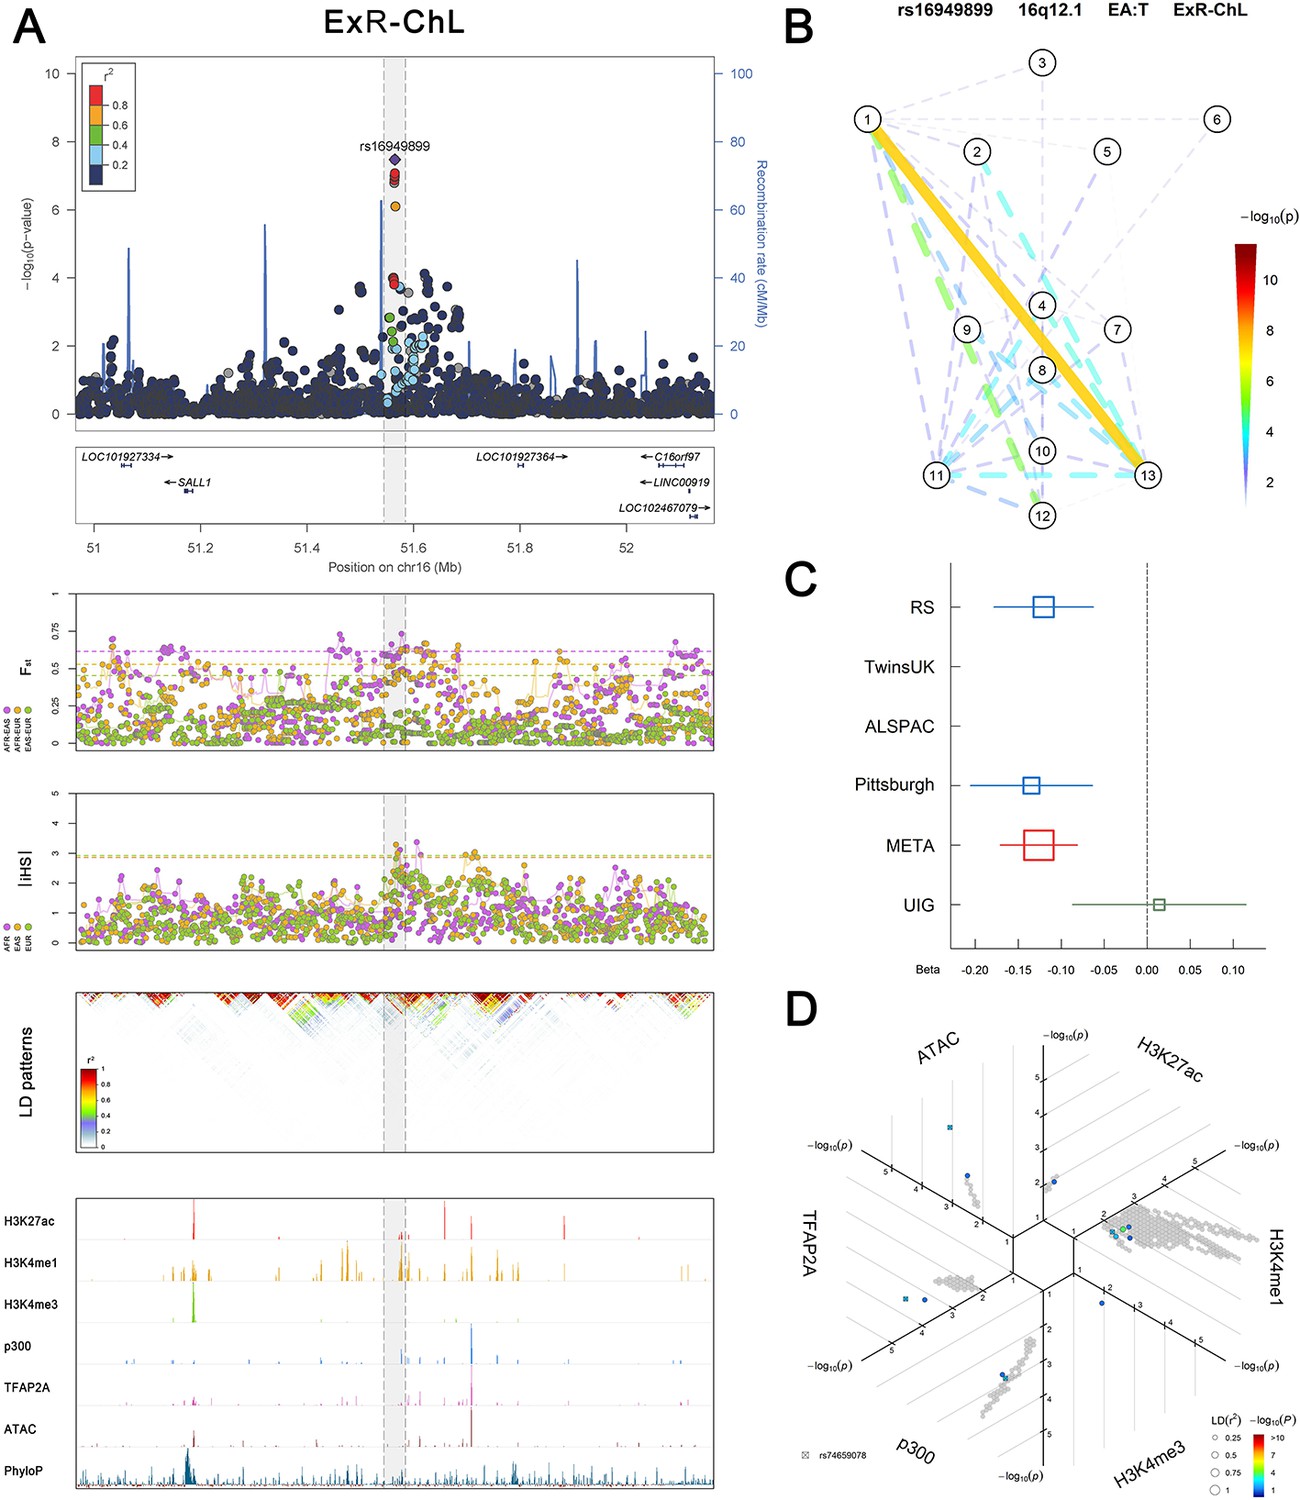
Association, selection, LD and regulation patterns for rs16949899 located around SALL1.
Figure 2—figure supplement 18
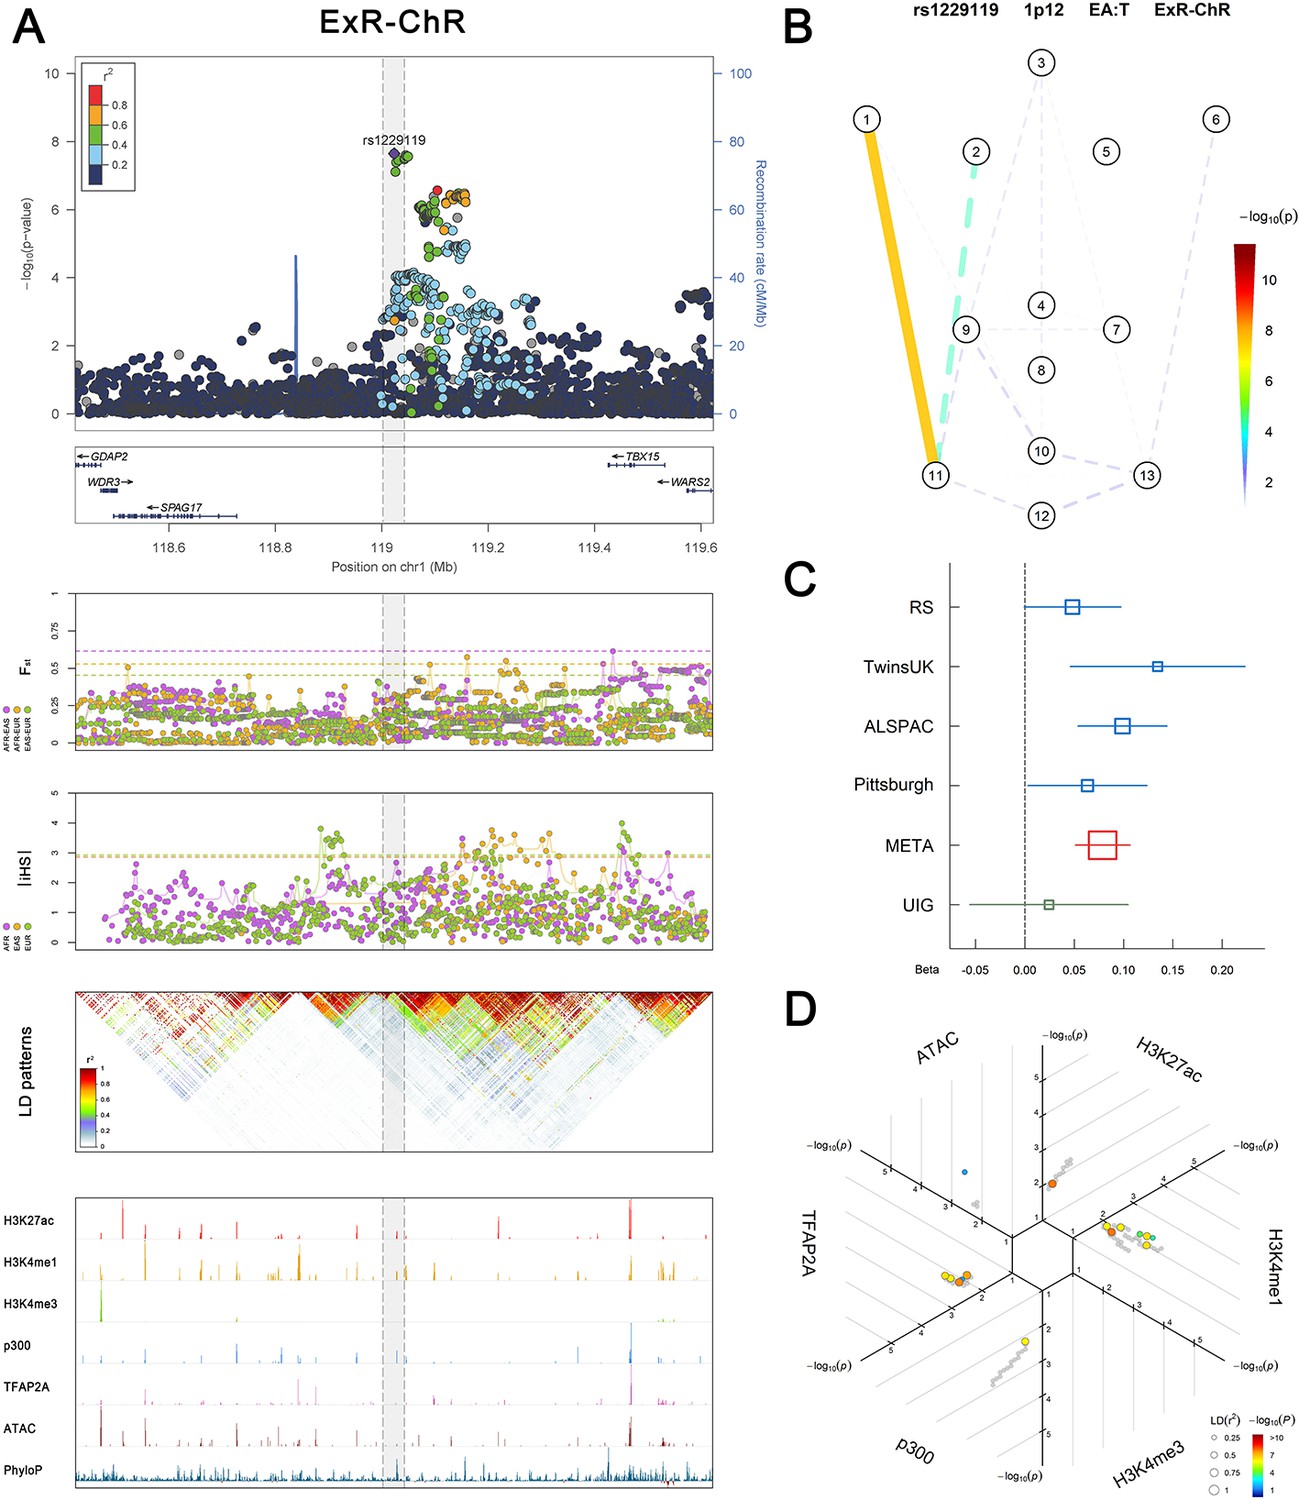
Association, selection, LD and regulation patterns for rs1229119 located around TBX15.
Figure 2—figure supplement 19
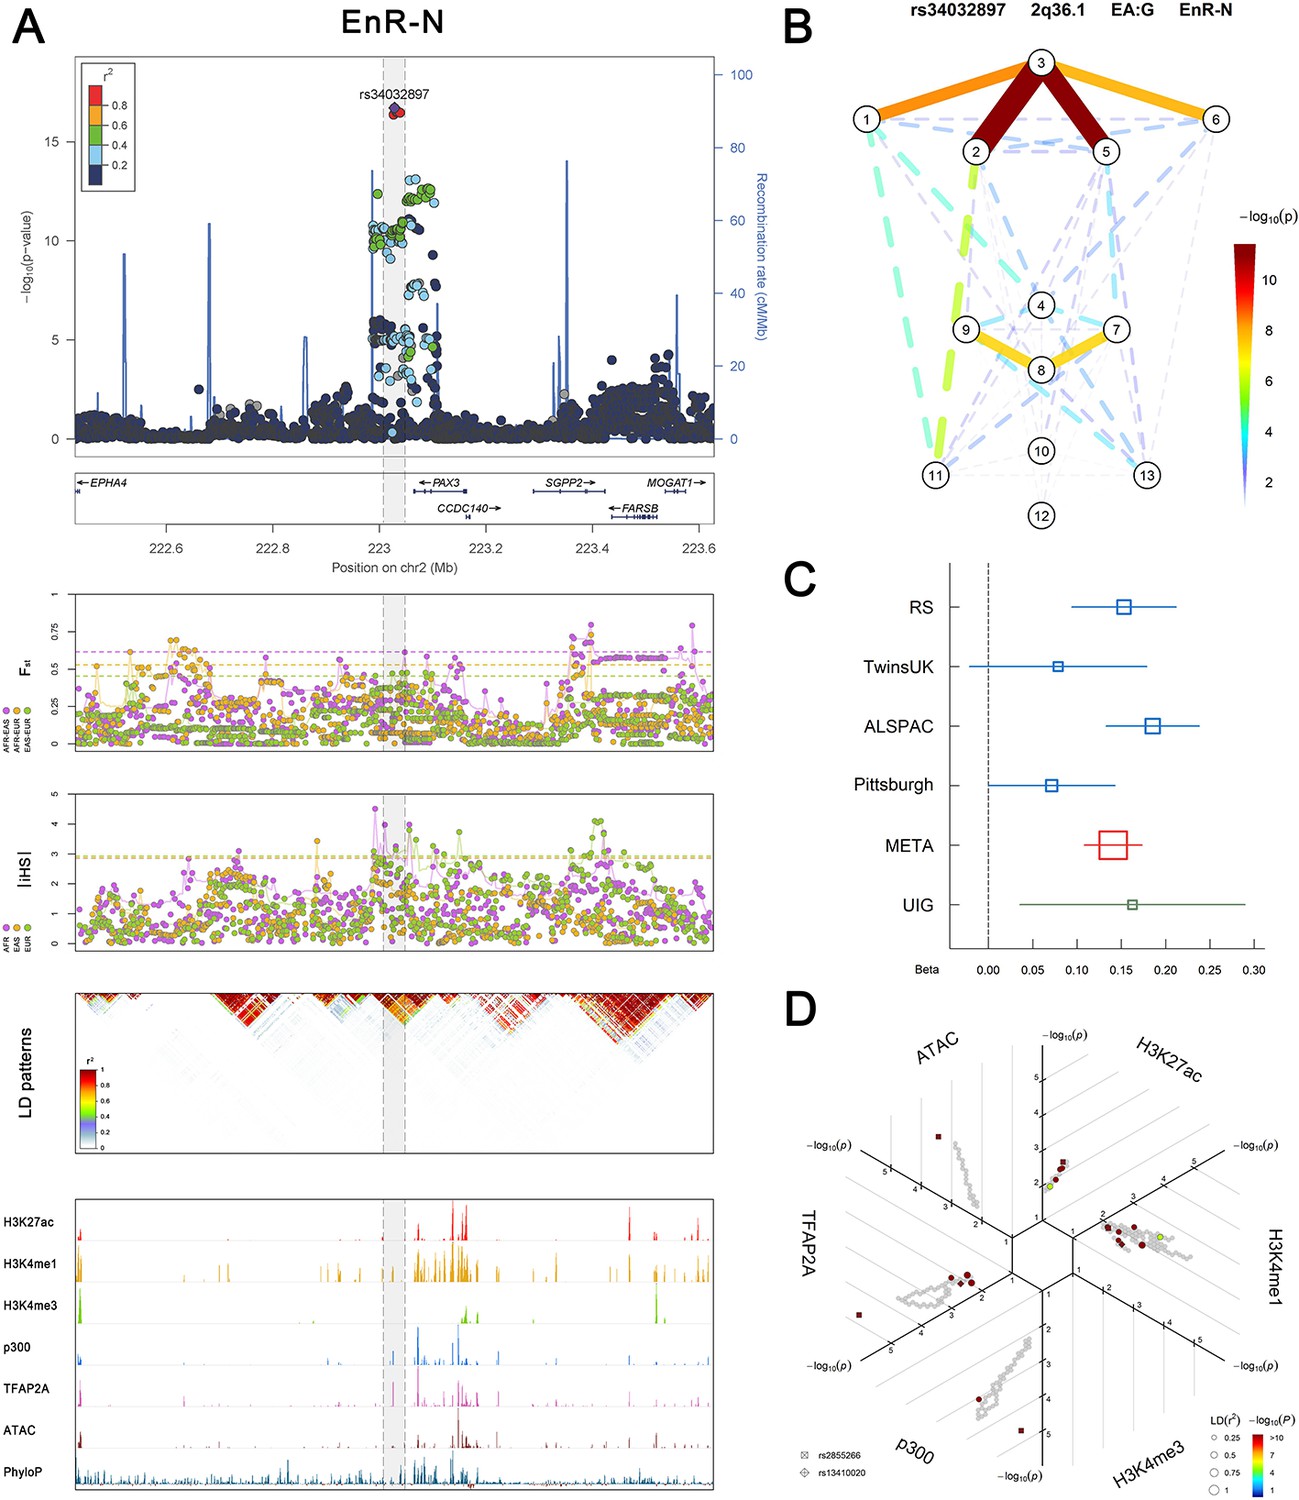
Association, selection, LD and regulation patterns for rs34032897 located around PAX3.
Figure 2—figure supplement 20
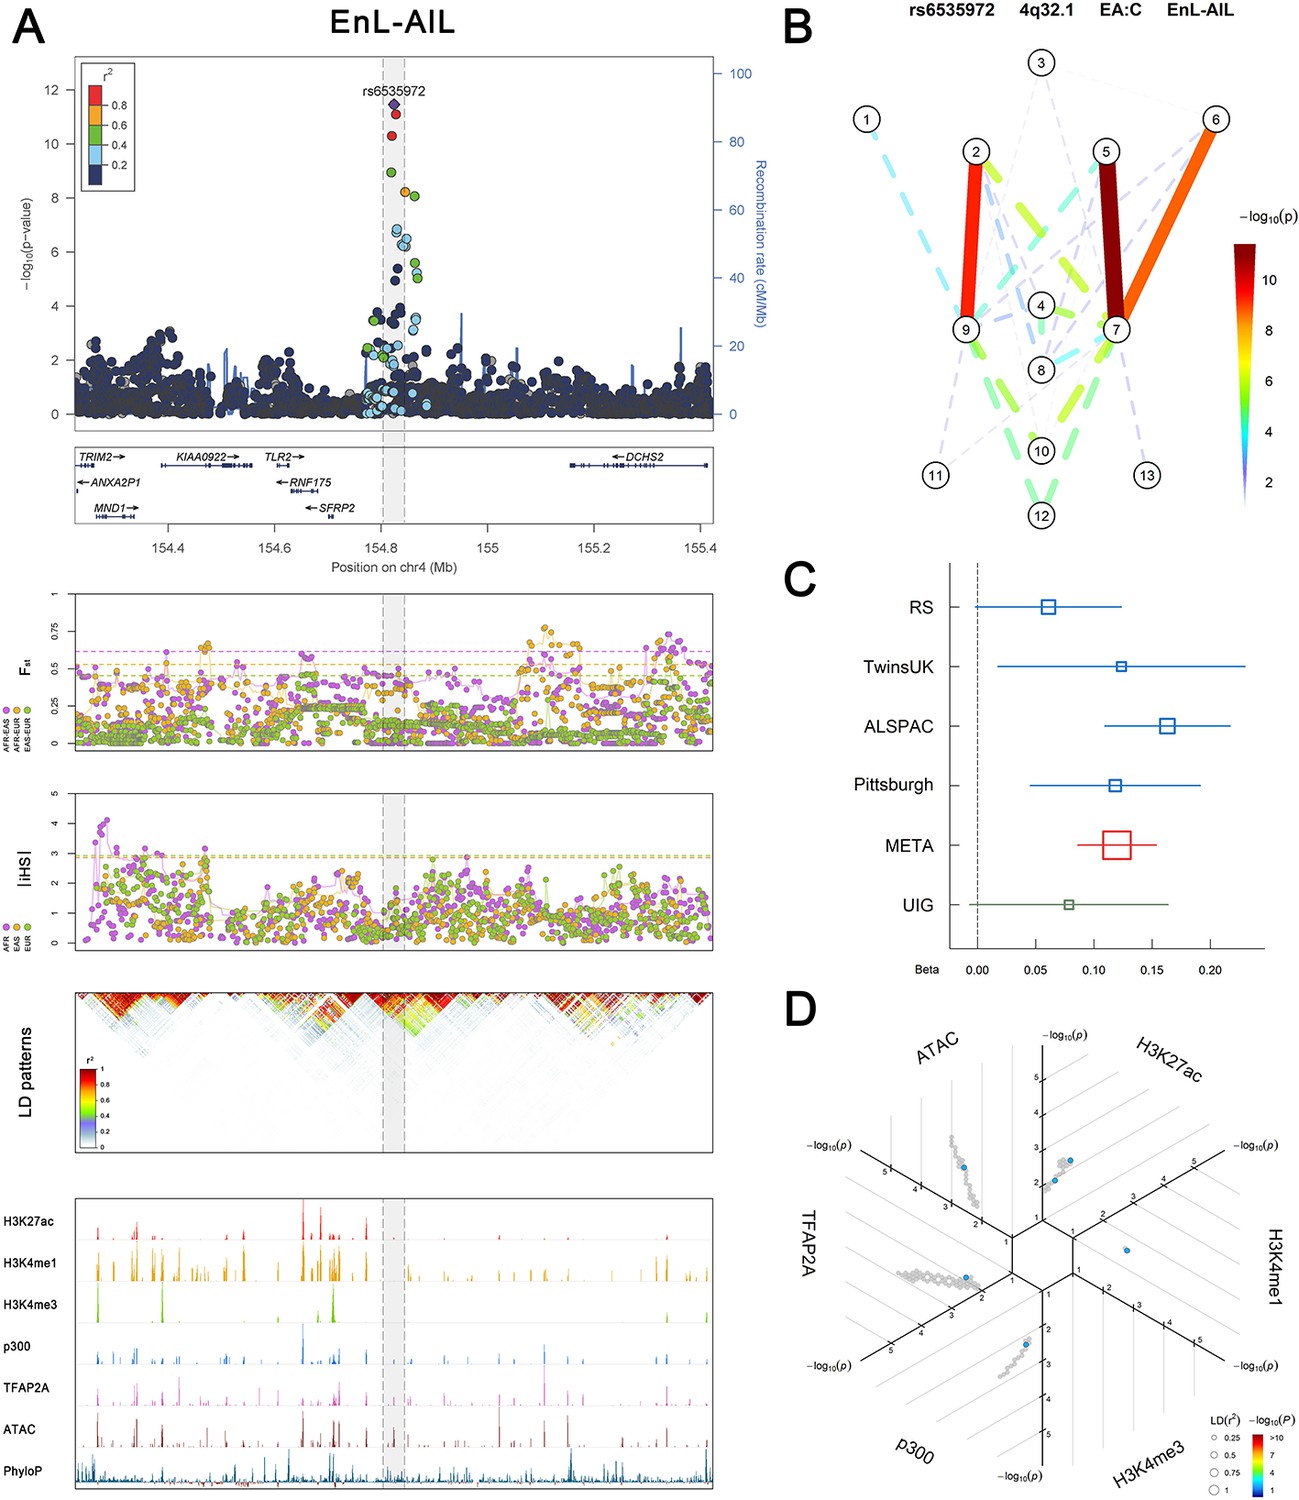
Association, selection, LD and regulation patterns for rs6535972 located around SFRP2.
Figure 2—figure supplement 21
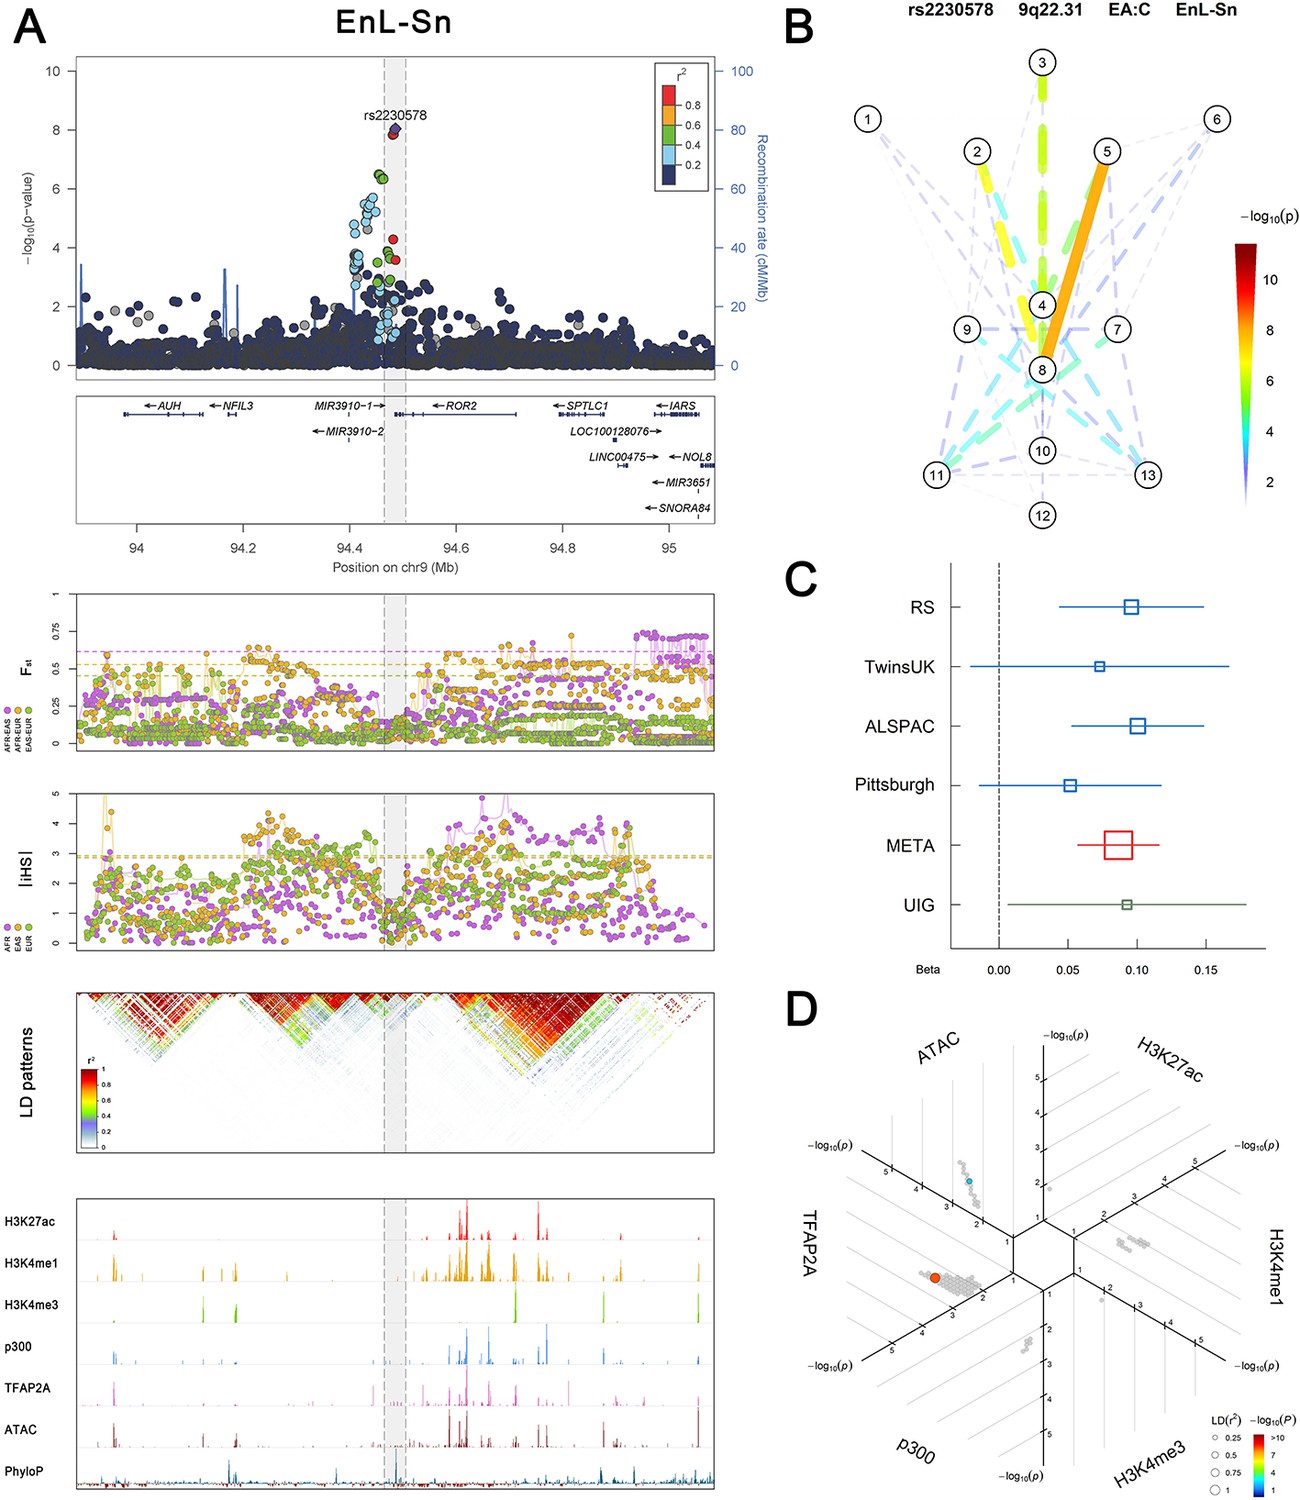
Association, selection, LD and regulation patterns for rs2230578 located around ROR2.
Figure 2—figure supplement 22
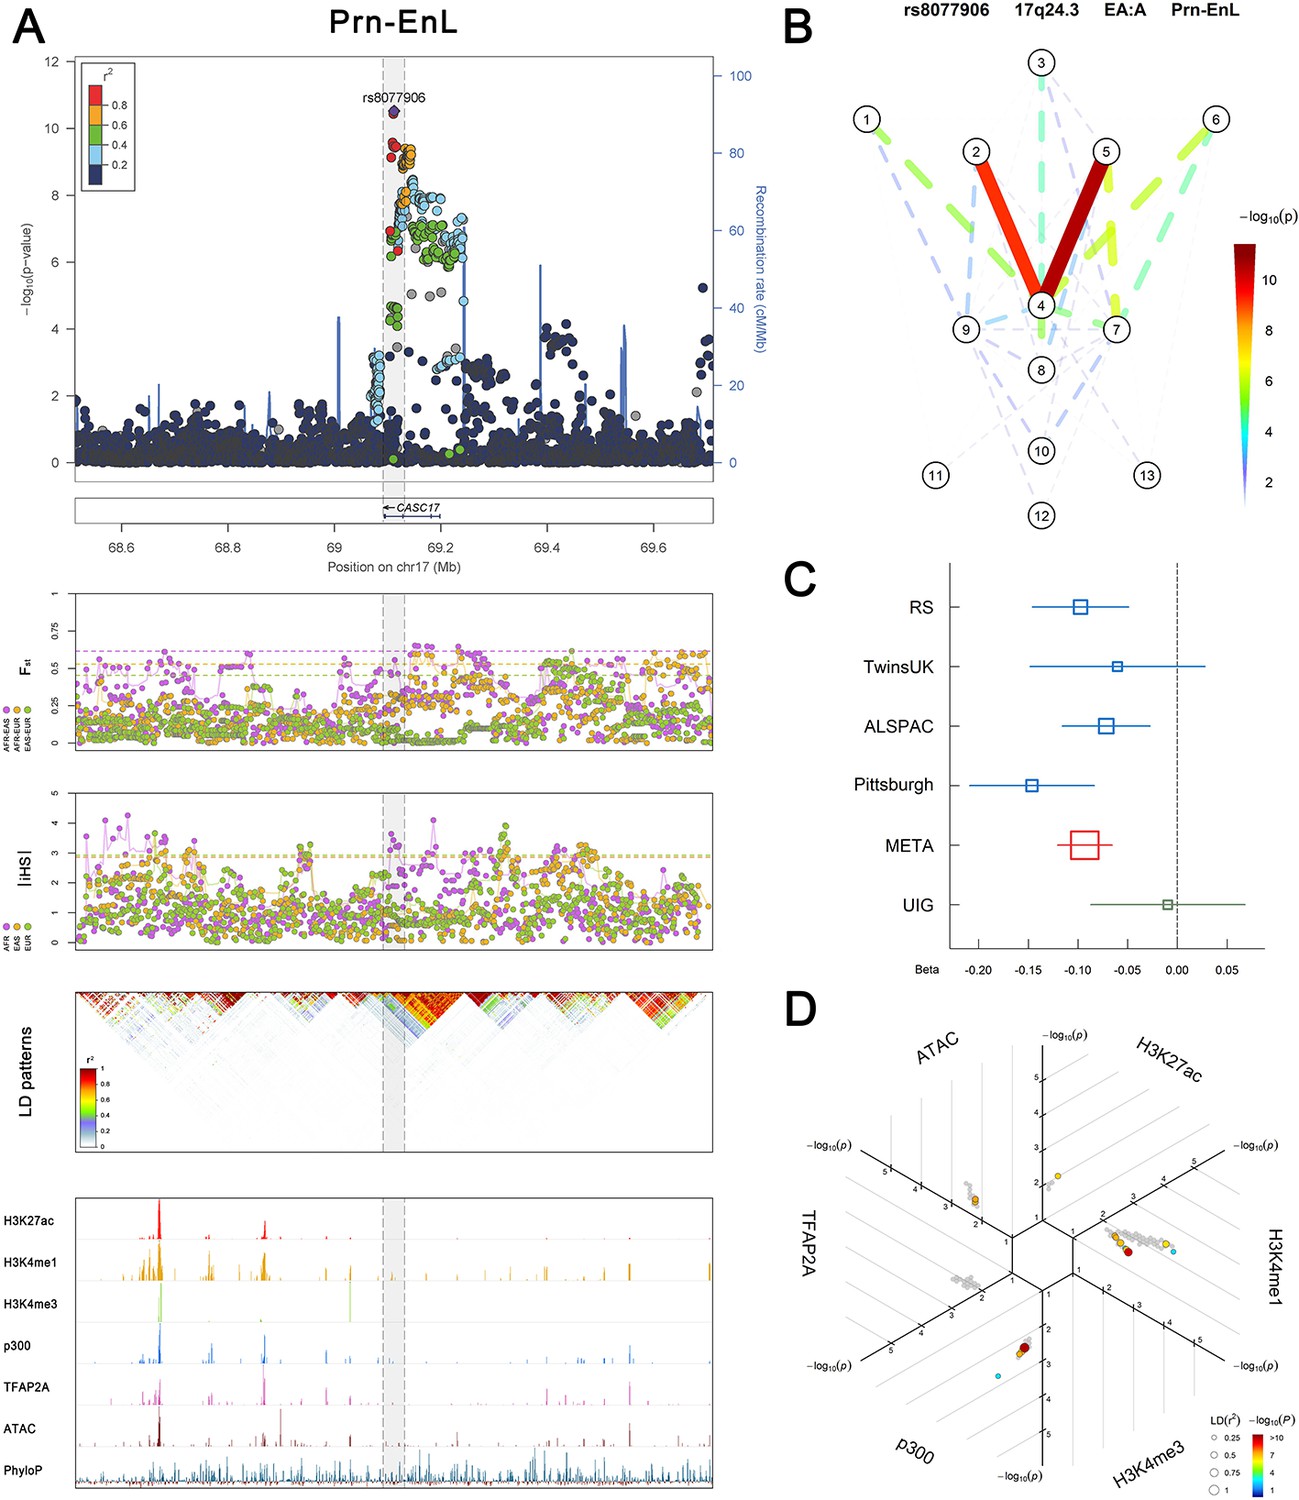
Association, selection, LD and regulation patterns for rs8077906 located around CASC17.
Figure 2—figure supplement 23
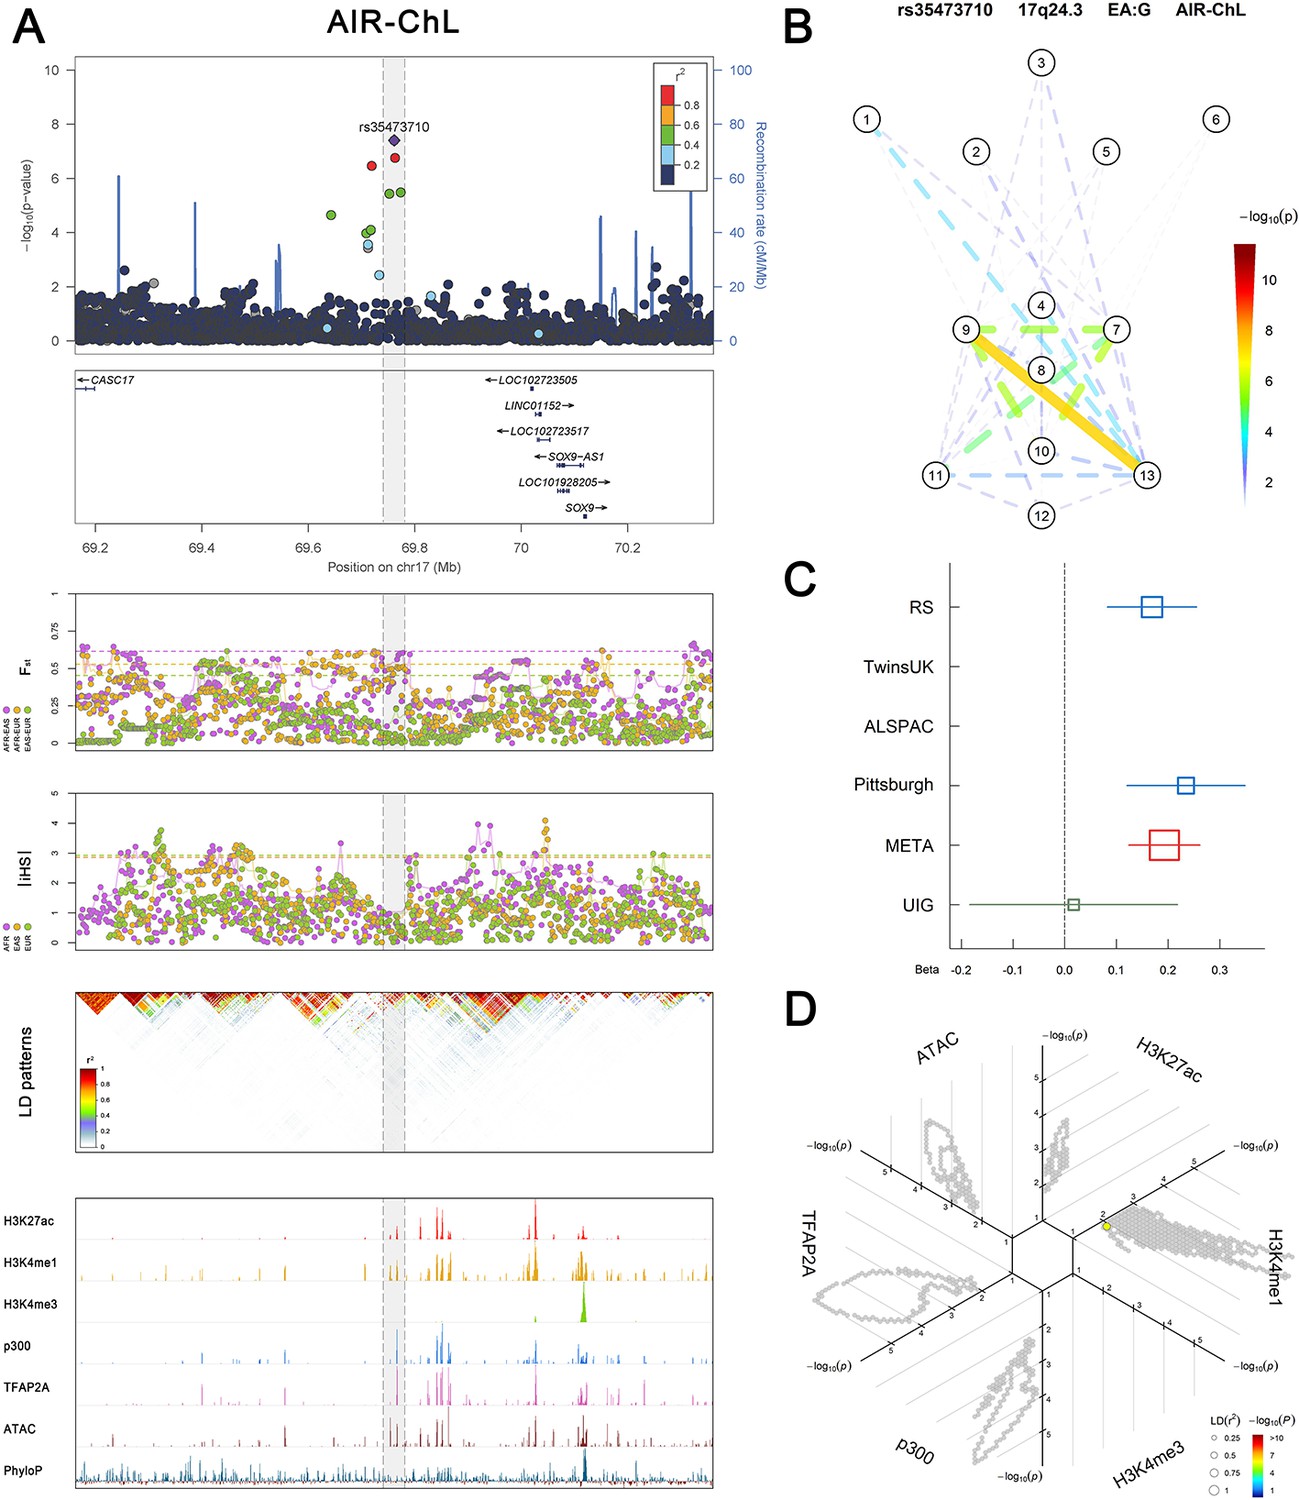
Association, selection, LD and regulation patterns for rs35473710 located around SOX9.
Figure 2—figure supplement 24
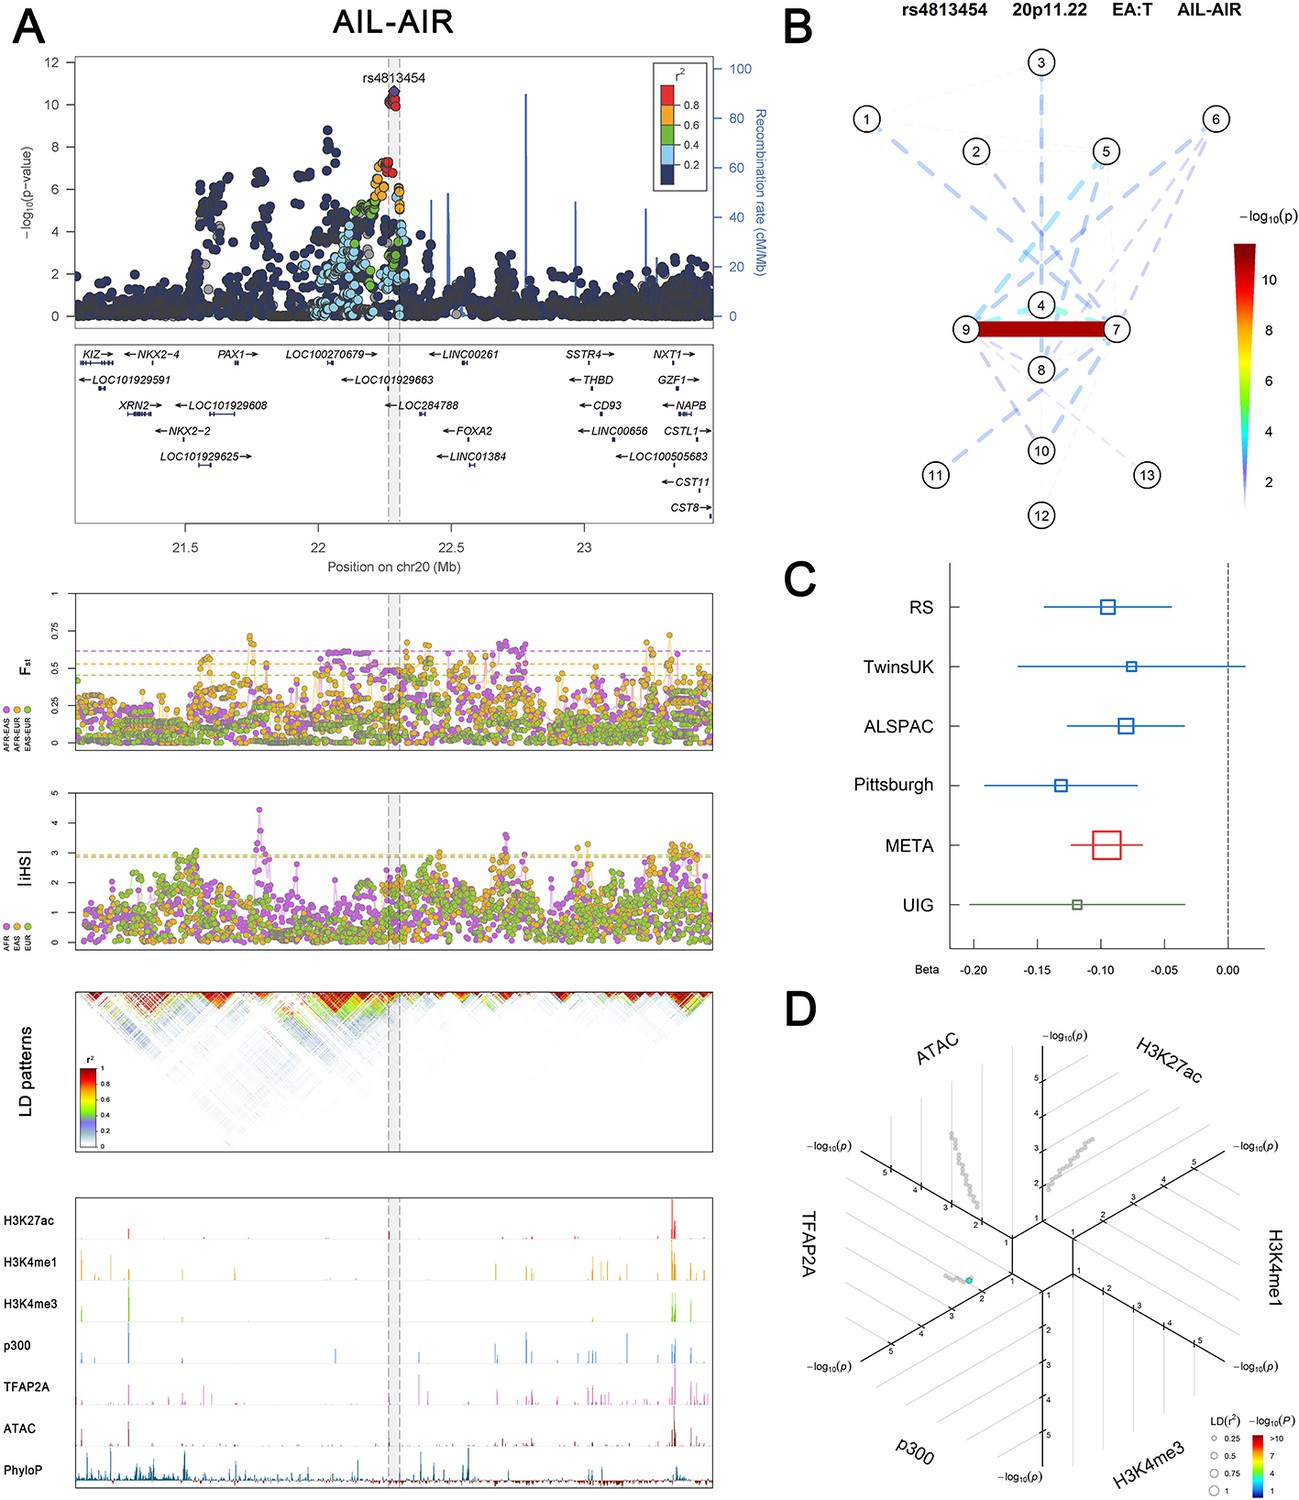
Association, selection, LD and regulation patterns for rs4813454 located around PAX1.
Figure 3 with 1 supplement
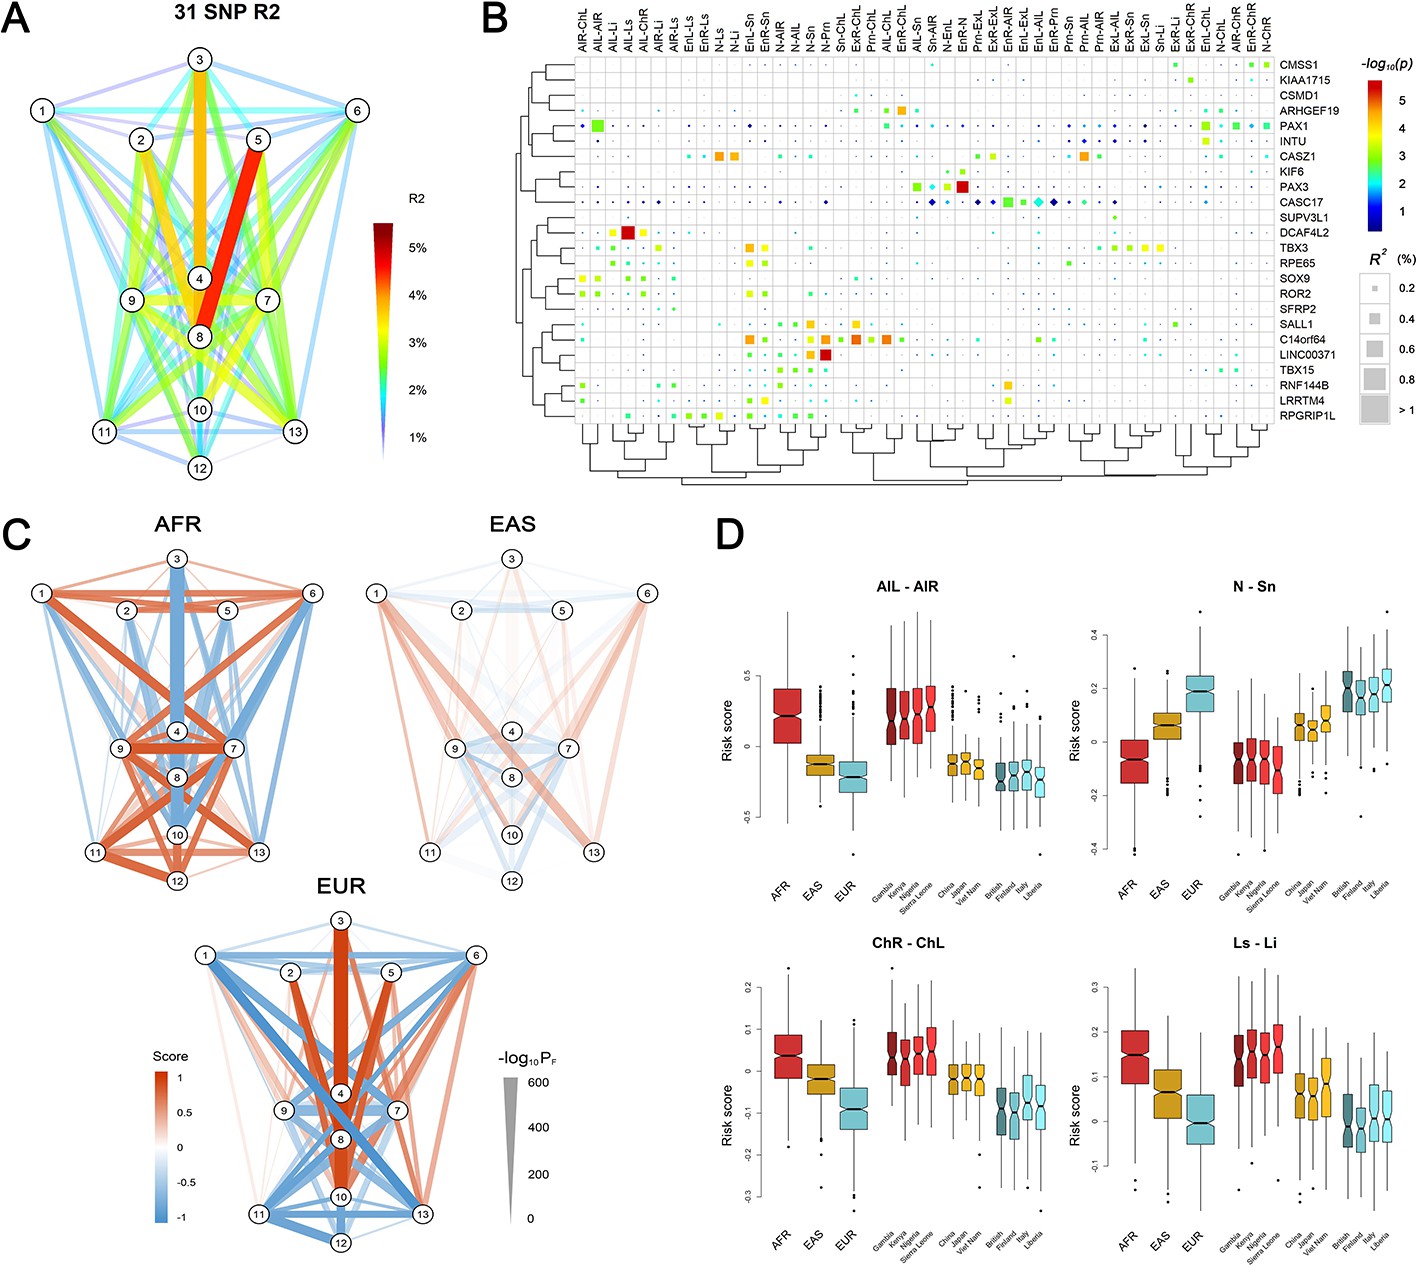
Polygenic scores of 78 facial phenotypes.
(A) Facial phenotype variance is explained by a multivariable model consisting of 31 face-associated SNPs with independent effects. (B) Unsupervised clustering reveals the details on the explained phenotype variance, where the SNPs were attributed to the candidate genes in the associated regions. All phenotypes with the total explained variance > 2% are shown. SNPs were colored according to their raw p-values and those passing FDR < 0.05 were indicated in squares. (C) Mean standardized polygenic scores calculated by applying the multivariable model trained in the RS discovery sample to Sub-Saharan Africans (AFR), East Asians (EAS) and Europeans (EUR) in the 1000 Genomes Project data. (D) Examples of the distributions of the face scores in samples of different ancestry origin/country.
Figure 3—figure supplement 1
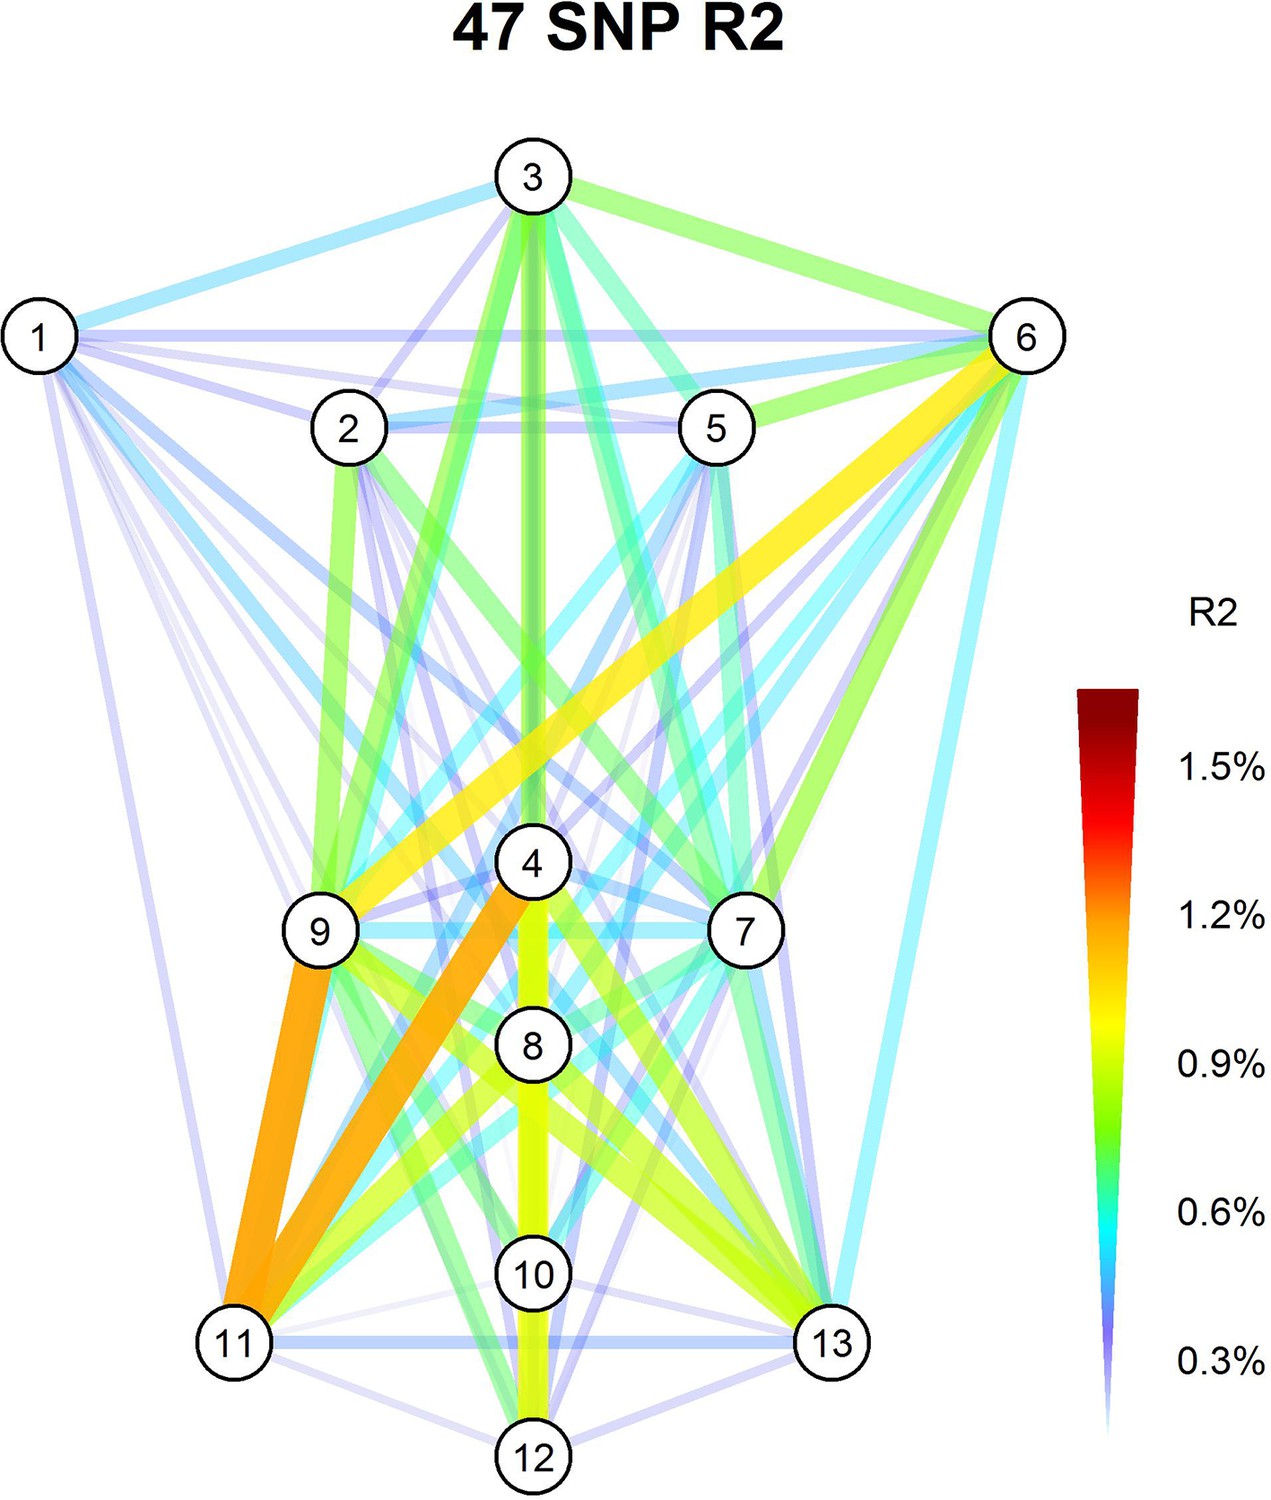
Effects of NSCL/P-associated SNPs to 78 facial phenotypes.
Facial phenotype variance is explained by polygenic scores of 47 NSCL/P-associated SNPs after LD prune (r2 > 0.5).
Figure 4 with 1 supplement
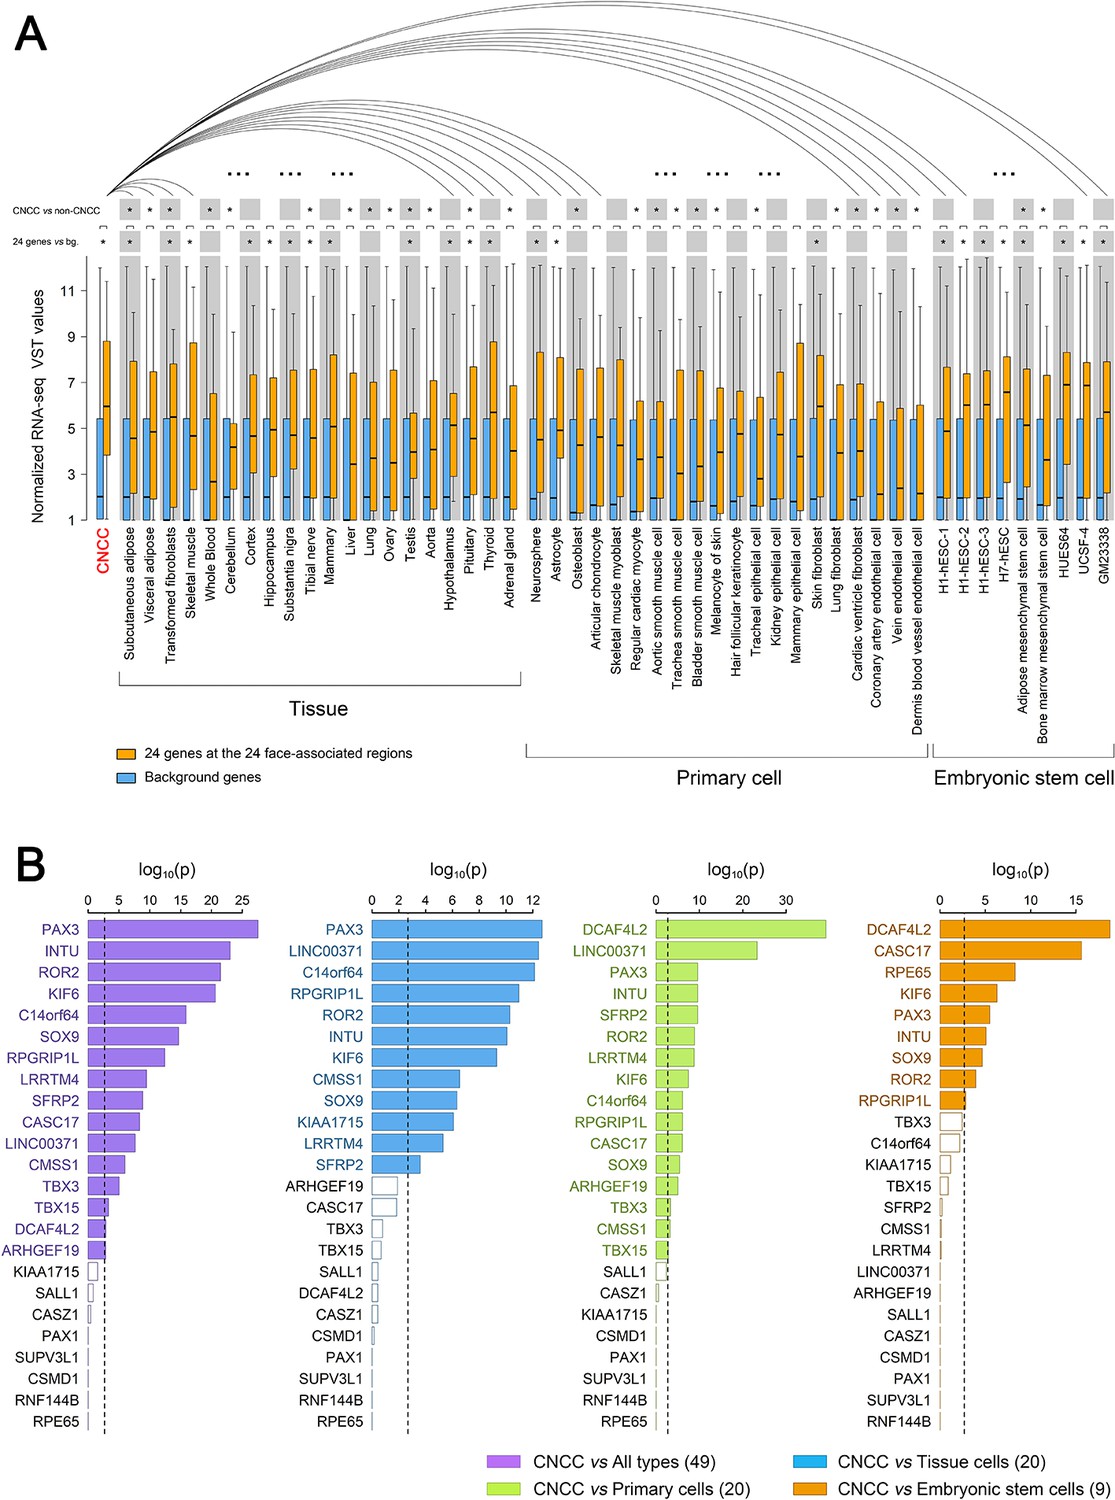
Expression of 24 genes located at the identified 24 face-associated genetic loci in 50 cell types.
Expression levels of the genes nearest to the 24 top-associated SNPs (see Table 1) in 50 cell types were displayed in boxplots based on published data from the study of Prescott et al. (2015), the GTEx database (Lonsdale et al., 2013) and the ENCODE database (ENCODE Project Consortium, 2012). The cell types included CNCC, 20 other tissue cells, 20 primary cells and nine embryonic stem cells. (A) Boxplots of normalized RNA-seq VST values for the 24 genes (in orange) and all genome background genes (~50,000 genes, in blue). Expression difference between the genome background genes and the 24 genes was tested in each cell type using the unpaired Wilcoxon rank-sum test. Distribution of the expression levels in CNCC showed smaller variation than those of several embryonic stem cells which showed higher median. The expression of the 24 genes in CNCCs was also iteratively compared with that in other cell types using paired Wilcoxon rank-sum test. Statistical significance was indicated: *p<0.05 after multiple correcting test of cell lines amount. (B) Difference significance of normalized RNA-seq VST values in each of 24 genes were displayed using barplots between CNCCs and all 49 types of cells (purple), CNCCs and 20 tissue cells (blue), CNCCs and 20 primary cells (green), CNCCs and nine embryonic stem cells (orange). The difference between the value of CNCCs and other cell type groups was tested using the one-sample Student’s t test. Dotted line represents Bonferroni corrected significant threshold (p<0.0021). Significant gene labels were in color compared to non-significant gene labels in black.
Figure 4—figure supplement 1
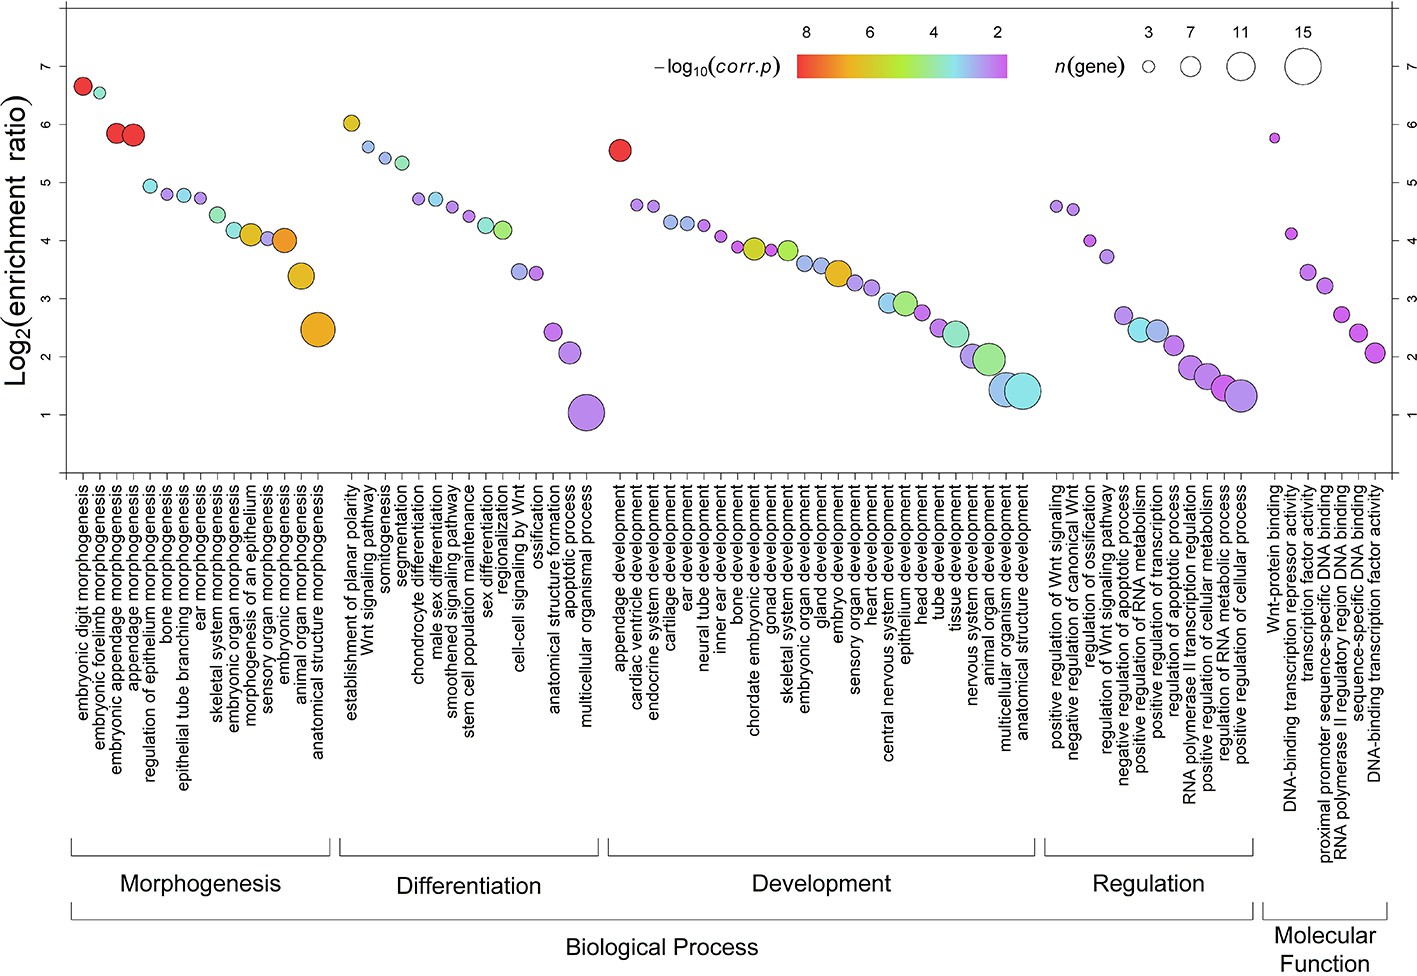
Gene ontology enrichment analysis for 24 face-associated genes.
Enrichment of the genes annotating the 24 identified face-associated genes. Enriched terms (FDR < 0.01 and n > 2, x-axis) are indicated by corrected P-value (FDR, different color), candidate genes contained by the terms (n, sizes of dots) and ratio of enrichment between test genes and background genes (y-axis).
Figure 5 with 1 supplement
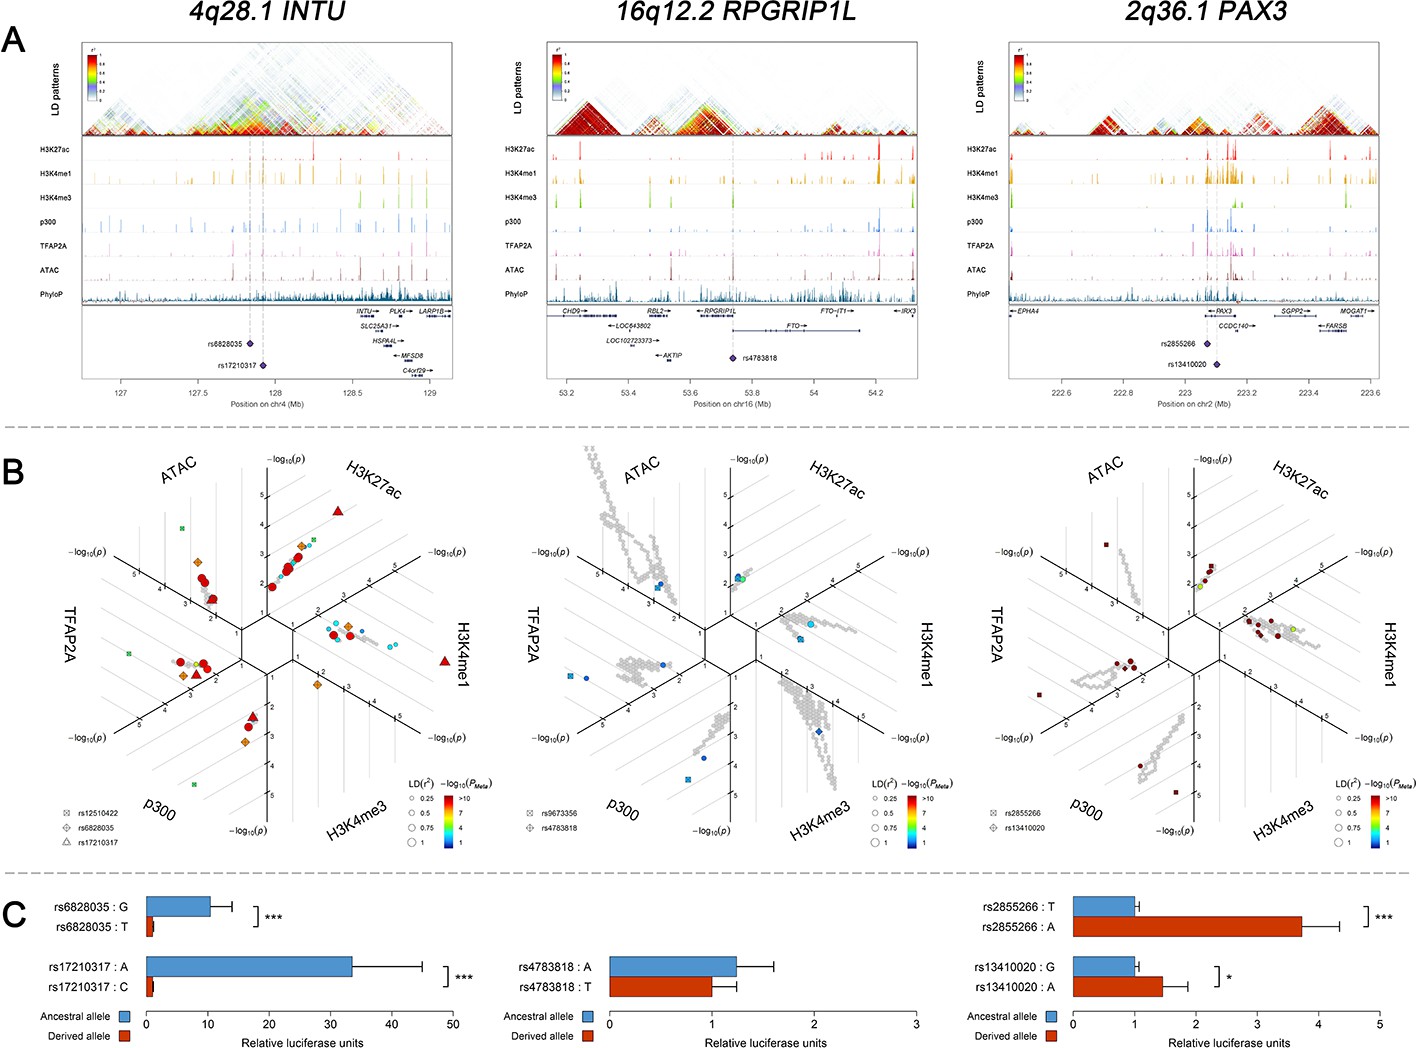
Three examples of genetic loci associated with facial shape phenotypes.
Three examples of facial shape associated loci we discovered are depicted in details, including two novel loci (INTU; RPGRIP1L) and one (PAX3) that overlaps with previous face GWAS findings. The figure is composed by three layers (A–C) organized from the top to the bottom. (A) Denotes the linkage disequilibrium (LD) patterns (r2) of EUR in the corresponding regions and epigenetic annotation of CNCC’s regulatory elements in corresponding regions using WashU Epigenome Browser. Chip-seq profiles display histone modifications associated with active enhancers (H3K27ac, H3K4me1) or promoters (H3K4me3), and binding of general coactivator p300 and transcription factor TFAP2A. The ATAC-seq track shows chromatin accessibility. The PhyloP track indicates cross-species conservation. (B) SNPs in LD (r2 > 0.25) with the top-associated SNP and all base-pairs in vicinity (within 20 kb, p<0.05) are displayed according to their log scaled quantile rank (-log10p, axis scale) in the circular figure, where the rank is calculated using the Chip-seq values in the whole genome. In addition, SNPs associated with facial phenotypes in our meta-analysis of GWASs were highlighted according to their association p values (PMeta, color scale) and their LD (r2) with the top-associated SNP in the region (points size). (C) Shows results of luciferase reporter assays in CD271+ neural crest progenitor cells by which we tested allele-specific enhancer activity of putative enhancers surrounding the selected SNPs using the Student´s t-test. Data are presented as relative luciferase activity (firefly/renilla activity ratio) fold change compared to the construct containing less active allele. Similar figures for layers A and B are provided for all face associated loci in Figure 2—figure supplements 1–24.
Figure 5—figure supplement 1
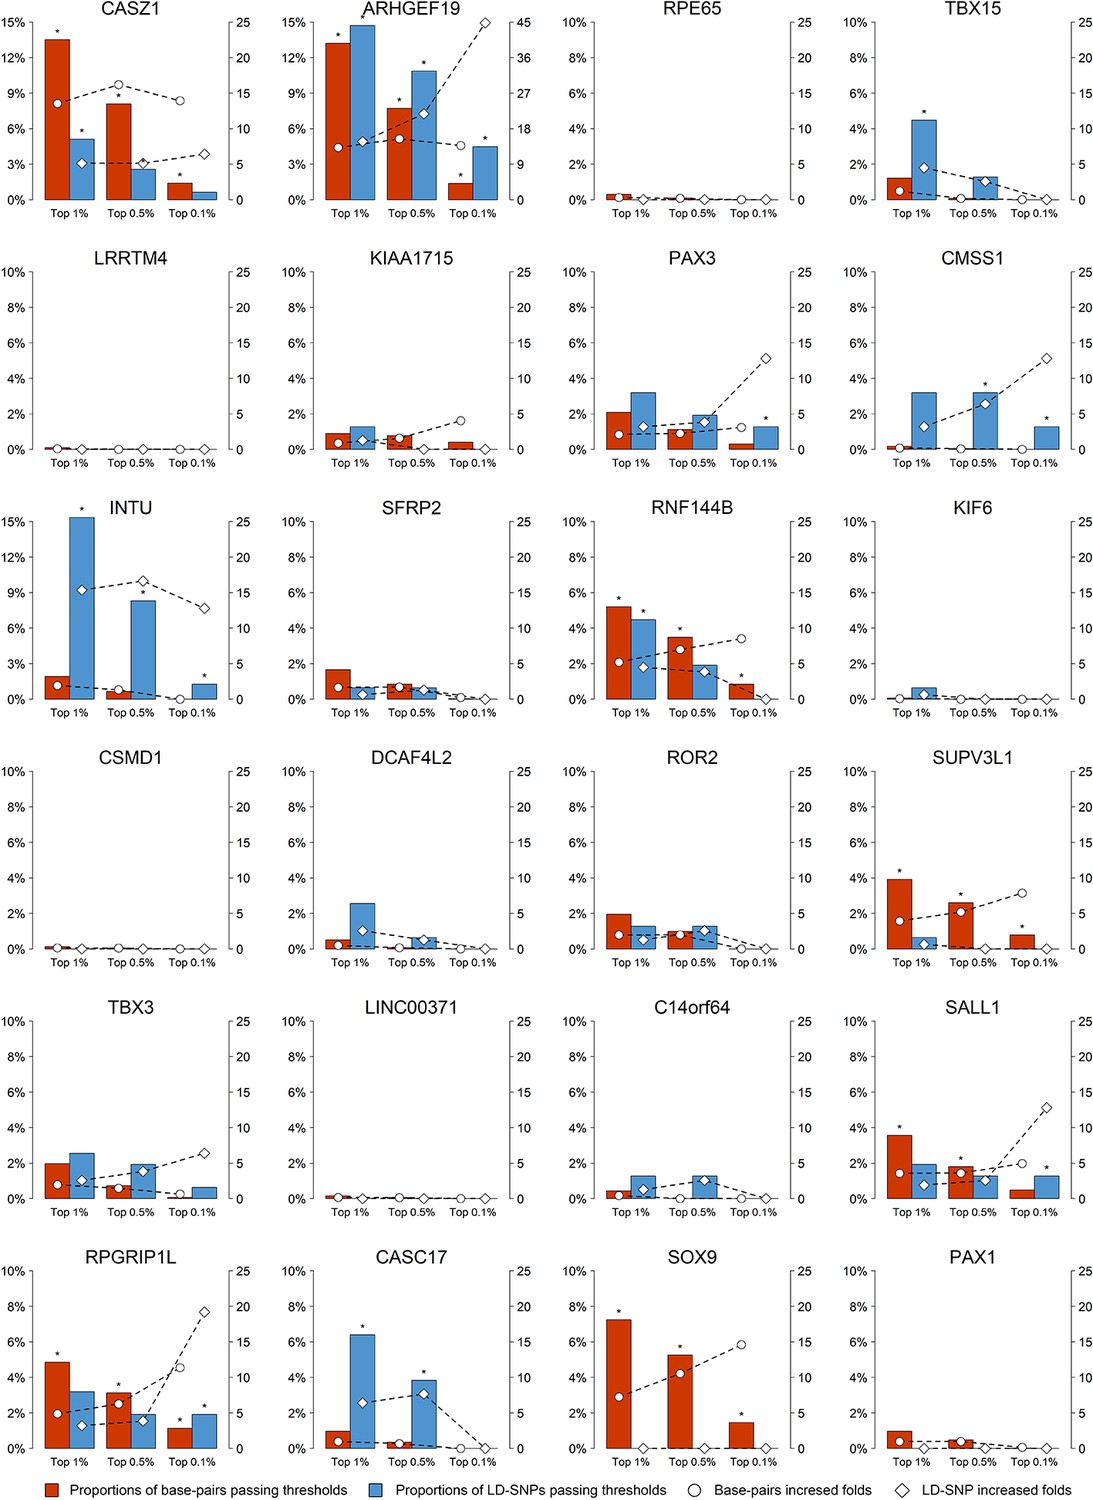
Overview of regulation activity of 24 face-associated loci in CNCCs.
For the top-associated SNPs at the 24 face associated loci, their base-pairs in vicinity within 20 kb (red bar) and LD (r2 > 0.25) SNPs (blue bar) were examined for cis-regulatory entries in six epigenomic tracks in CNCCs at three thresholds (top 1%, top 0.5%, top 0.1% of the genome). The proportions of the base-pairs or LD SNPs at each locus passing the set thresholds were displayed using bars (left y-axis), and the folds of the increase over the set thresholds were displayed using dashed lines (right y-axis). Statistical significance was derived using the Fisher’s exact test (*adjust.p<0.05).
Tables
Table 1
SNPs significantly associated (p<5×10⁻⁸) with facial shape phenotypes from European discovery GWAS meta-analysis (RS, TwinksUK, ALSPAC, and PITT), and their multi-ethnic replication (UYG, CANDELA and QIMR).
| Discovery meta-analysis | Replication | ||||||||
|---|---|---|---|---|---|---|---|---|---|
| (N = 10,115) | (N = 7,917) | ||||||||
| Region | SNP | Nearest Gene | EA | OA | Trait | Beta | P | Q | Com. P |
| Novel face-associated loci | |||||||||
| 1p36.22 | rs143353512 | CASZ1 | A | G | Prn-AlL | −0.29 | 6.44 × 10⁻⁹ | 0.73 | 0.0001 |
| 1p36.13 | rs200243292 | ARHGEF19 | I | T | EnR-ChL | −0.11 | 1.46 × 10⁻⁸ | 0.54 | 0.0640 |
| 1p31.2 | rs77142479 | RPE65 | C | A | EnL-Sn | −0.08 | 7.65 × 10⁻⁹ | 0.90 | 0.0121 |
| 2p12 | rs10202675 | LRRTM4 | T | C | EnR-AlR | −0.26 | 4.43 × 10⁻⁸ | 0.40 | 0.0226 |
| 2q31.1 | rs2884836 | KIAA1715 | T | C | ExR-ChR | −0.09 | 3.04 × 10⁻⁸ | 0.52 | 0.1096 |
| 3q12.1 | rs113663609 | CMSS1 | A | G | EnR-ChR | −0.12 | 3.46 × 10⁻⁸ | 0.96 | 0.0782 |
| 4q28.1 | rs12504954 | INTU | A | G | Prn-AlL | −0.09 | 3.03 × 10⁻¹⁰ | 0.52 | 0.0015 |
| 6p22.3 | rs2225718 | RNF144B | C | T | EnR-AlR | −0.09 | 2.97 × 10⁻⁸ | 0.60 | 0.0071 |
| 6p21.2 | rs7738892 | KIF6 | T | C | EnR-N | 0.11 | 1.34 × 10⁻⁸ | 0.09 | 0.0018 |
| 8p23.2 | rs1700048 | CSMD1 | C | A | ExR-ChL | −0.22 | 3.94 × 10⁻⁸ | 0.73 | 0.1131 |
| 8q21.3 | rs9642796 | DCAF4L2 | A | G | AlL-Ls | −0.11 | 4.52 × 10⁻⁸ | 0.07 | 0.3090 |
| 10q22.1 | rs201719697 | SUPV3L1 | A | D | ExL-AlL | −0.28 | 3.42 × 10⁻⁸ | 0.66 | NA |
| 12q24.21 | rs1863716 | TBX3 | A | C | Prn-AlR | −0.09 | 1.47 × 10⁻¹⁰ | 0.53 | 2.45 × 10⁻⁵ |
| 13q14.3 | rs7325564 | LINC00371 | T | C | N-Prn | 0.09 | 1.34 × 10⁻⁸ | 0.16 | 0.3519 |
| 14q32.2 | rs1989285 | C14orf64 | G | C | N-Prn | −0.10 | 4.54 × 10⁻⁸ | 0.82 | 0.0019 |
| 16q12.1 | rs16949899 | SALL1 | T | G | ExR-ChL | −0.13 | 3.35 × 10⁻⁸ | 0.76 | 0.8912 |
| 16q12.2 | rs7404301 | RPGRIP1L | G | A | AlL-Ls | −0.09 | 3.49 × 10⁻⁹ | 0.43 | 2.87 × 10⁻⁷ |
| Previously reported face-associated loci | |||||||||
| 1p12 | rs1229119 | TBX15 | T | C | ExR-ChR | 0.08 | 2.25 × 10⁻⁸ | 0.26 | 0.1219 |
| 2q36.1 | rs34032897 | PAX3 | G | A | EnR-N | 0.14 | 1.96 × 10⁻¹⁷ | 0.04 | 0.0020 |
| 4q31.3 | rs6535972 | SFRP2 | C | G | EnL-AlL | 0.12 | 3.51 × 10⁻¹² | 0.12 | 5.89 × 10⁻¹² |
| 9q22.31 | rs2230578 | ROR2 | C | T | EnL-Sn | 0.09 | 9.02 × 10⁻⁹ | 0.66 | 1.09 × 10⁻⁶ |
| 17q24.3 | rs8077906 | CASC17 | A | G | Prn-EnL | −0.09 | 3.00 × 10⁻¹¹ | 0.24 | 0.0505 |
| 17q24.3 | rs35473710 | SOX9 | G | A | AlR-ChL | 0.19 | 3.95 × 10⁻⁸ | 0.37 | 0.2634 |
| 20p11.22 | rs4813454 | PAX1 | T | C | AlL-AlR | −0.10 | 2.32 × 10⁻¹¹ | 0.58 | 0.0002 |
-
Except rs2230578 (3'-UTR of ROR2) and rs7738892 (a synonymous variant of KIF6), all SNPs are intronic or intergenic. Gene symbols in bold indicate successful replication after Bonferroni correction of 24 loci (p<2.1×10⁻³). Meta P in bold indicates study-wide significance in the discovery analysis after multiple trait correction (p<1.2×10⁻⁹). Replication P in bold means significant after Bonferroni correction for multiple tests (p<2.1×10⁻³). Q: p-value from the Cochran's Q test for testing heterogeneity between discovery cohorts. EA and OA, the effect allele and the another allele. Com. P: p-values from a combined test of dependent tests. NA, not available.
Additional files
-
Supplementary file 1
Supplementary Tables.
Includes: Supplementary Table 1. Characteristics of the all cohorts. Supplementary Table 2 Characteristics of 78 facial phenotypes in RS. Supplementary Table 3 Effects of 6 covariates to 78 facial phenotypes in RS. Supplementary Table 4. Phenotype correlations between all facial phenotypes in RS. Supplementary Table 5. Genetic correlation between all facial phenotypes in RS. Supplementary Table 6. Twins heritability and SNP-based heritability of all facial phenotypes in TwinsUK and QIMR. Supplementary Table7. 494 SNPs associated (p<5e-8) with facial shape phenotypes in meta-analysis of GWAS. Supplementary Table 8. Replication of reported variants of facial variation. Supplementary Table 9. GWAS Catalog entries (release on 2018-01-01), for polymorphisms that were significantly associated with facial traits in meta-analyses. Supplementary Table 10. Significant pleiotropic effect of study-wide suggestive SNPs on GeneATLAS traits. Supplementary Table 11. Frequency distribution of 24 top-associated SNPs. Supplementary Table 12. Population differentiation and positive selection at the suggestive significant GWAS SNPs. Supplementary Table 13. Replication of reported variants of NSCL/P trait. Supplementary Table 14. Multiple linear regression for 31 top-associated SNPs fitting with SEX and AGE in RS. Supplementary Table 15. Enrichment of the genes annotating the associated 24 regions. Supplementary Table 16. Significant expression quantitative trait loci effects for 494 SNPs significantly associated with facial traits and the target genes. Supplementary Table 17. Overviews of 5 selected candidate regulatory SNPs. Supplementary Table 18. Luciferase reporter assay results overview presented as relative luciferase activity fold change compared to construct containing less active allele ± standard deviation. Supplementary Table 19. Key Resource Table for functional experiments.
- https://cdn.elifesciences.org/articles/49898/elife-49898-supp1-v3.xlsx
-
Transparent reporting form
- https://cdn.elifesciences.org/articles/49898/elife-49898-transrepform-v3.pdf
Download links
A two-part list of links to download the article, or parts of the article, in various formats.
Downloads (link to download the article as PDF)
Open citations (links to open the citations from this article in various online reference manager services)
Cite this article (links to download the citations from this article in formats compatible with various reference manager tools)
Novel genetic loci affecting facial shape variation in humans
eLife 8:e49898.
https://doi.org/10.7554/eLife.49898


