SCGN deficiency results in colitis susceptibility
- University of Texas Southwestern Medical Center, United States
- Sichuan University, China
- Texas Scottish Rite Hospital for Children, United States
Figures
Figure 1 with 2 supplements

A mutation in SCGN is linked to early-onset ulcerative colitis.
(a) Pedigree of index family. Probands (P1, P2, and P3) and their siblings (S1 and S2) are indicated. SCGN genotypes are noted (+ = WT allele, - = R77H allele) (b) Representative endoscopic images of the rectum from affected individuals. (c) Multispecies alignment of SCGN protein sequences is shown; the residue affected in the rare coding variant found in affected patients (R77) is indicated. (d) Frequencies of allele variants of SCGN found in ExAC are plotted along the SCGN protein sequence, with the location of the six EF-hands also indicated. R77 is noted by an arrow.
-
Figure 1—source data 1
Source data for Figure 1D.
- https://doi.org/10.7554/eLife.49910.005
Figure 1—figure supplement 1
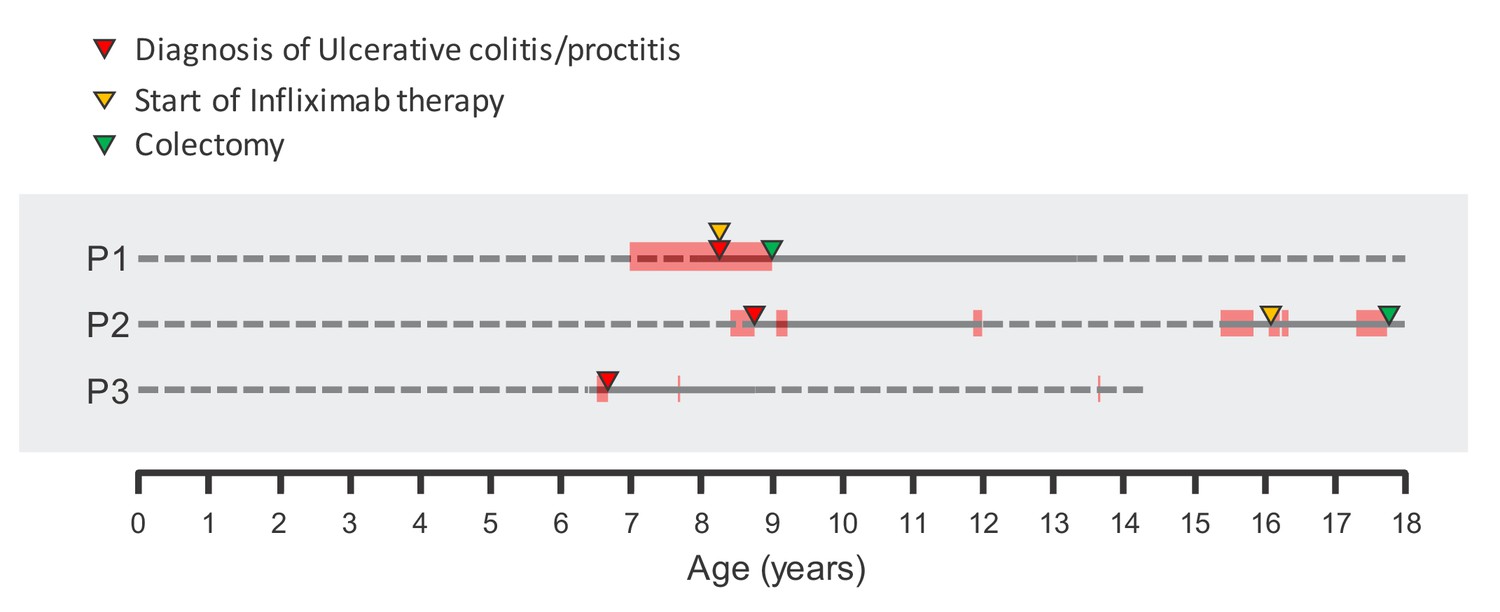
Clinical course of affected probands.
Critical clinical events are noted. Full line represents active follow-up and dashed line represents no active follow-up. Red bars along each proband’s timeline represent periods of time of reported colitic symptoms (bloody diarrhea and abdominal pain). Time of diagnosis, infliximab therapy initiation and time of colectomy are also noted.
Figure 1—figure supplement 2
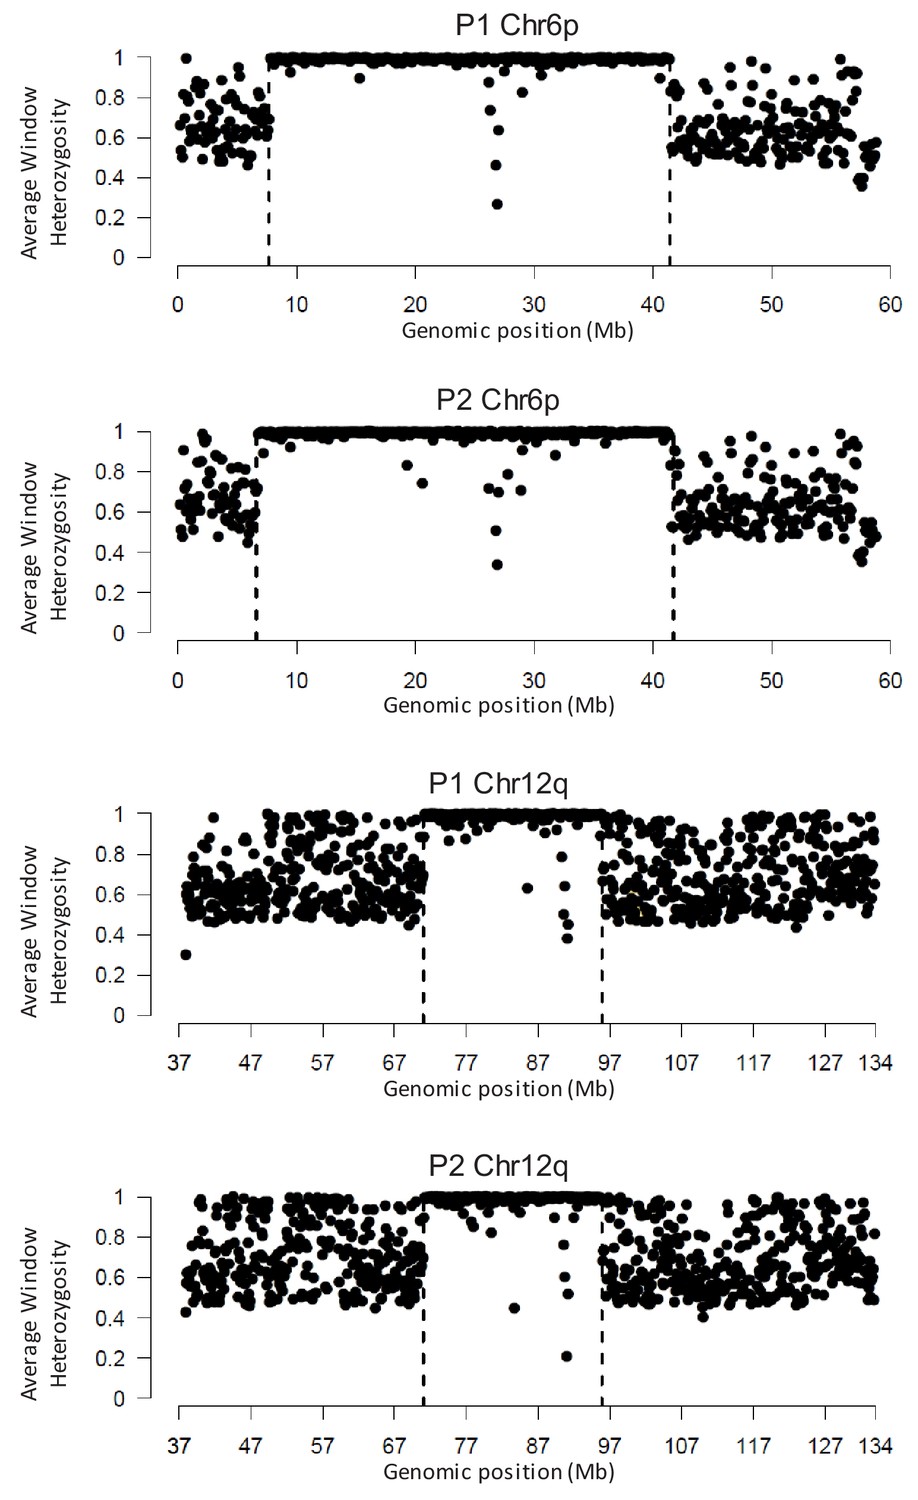
Areas of shared LOH in P1 and P2 as analyzed by WGS.
The average heterozygosity across 100 kb genomic windows are shown for both affected siblings. This analysis identified single contiguous regions of homozygosity on 6 p and 12q in both probands.
Figure 2 with 3 supplements
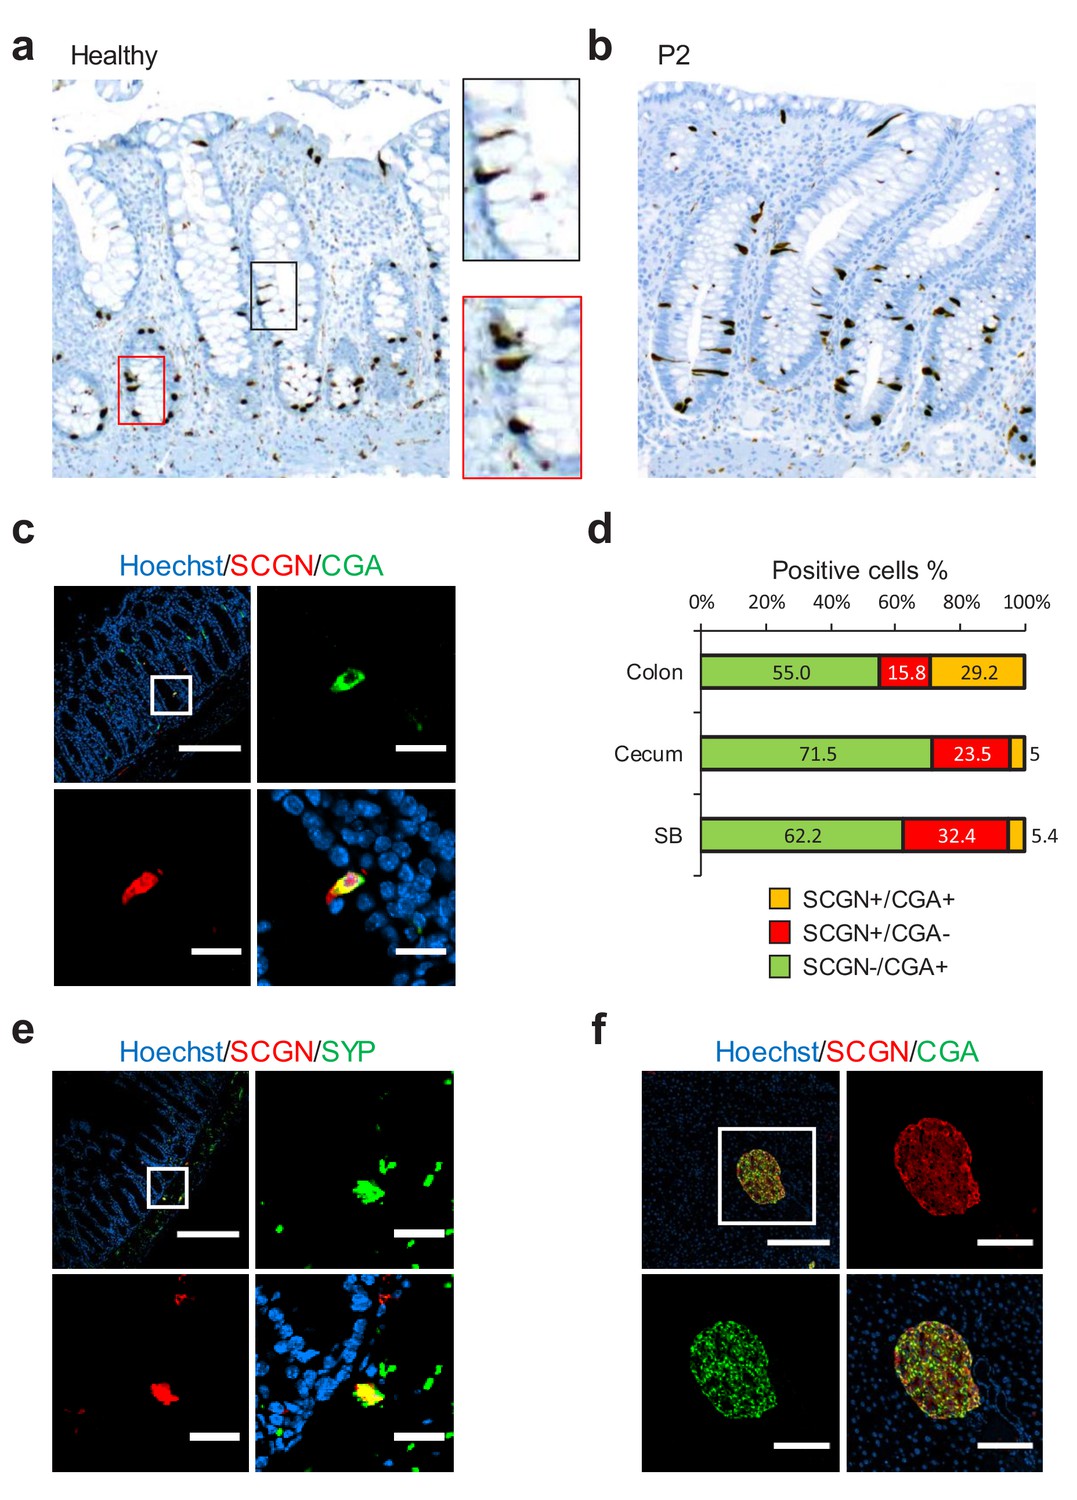
SCGN is expressed neuroendocrine cells.
(a) Immunohistochemistry (IHC) staining for SCGN in rectal biopsies obtained from a healthy individual. 40x magnification. (b) IHC staining for SCGN in rectal biopsies obtained from P2, one of the probands in the index family. 40x magnification. (c) SCGN and chromogranin A (CGA) immunofluorescence staining of murine colonic epithelium (scale bar 200 µm – inset 20 µm). (d) Morphometric quantification of SCGN and CGA staining patterns in epithelial cells of three sites of the murine gut. Cell population percentages are shown. SB: Small bowel (e) SCGN and synaptophysin (SYP) immunofluorescence staining in subepithelial cells of the murine large intestine (scale bar 200 µm – inset 20 µm). (f) SCGN and CGA immunofluorescence staining in murine pancreatic islets (scale bar 200 µm - inset 100 µm).
-
Figure 2—source data 1
Source data for Figure 2D.
- https://doi.org/10.7554/eLife.49910.011
Figure 2—figure supplement 1
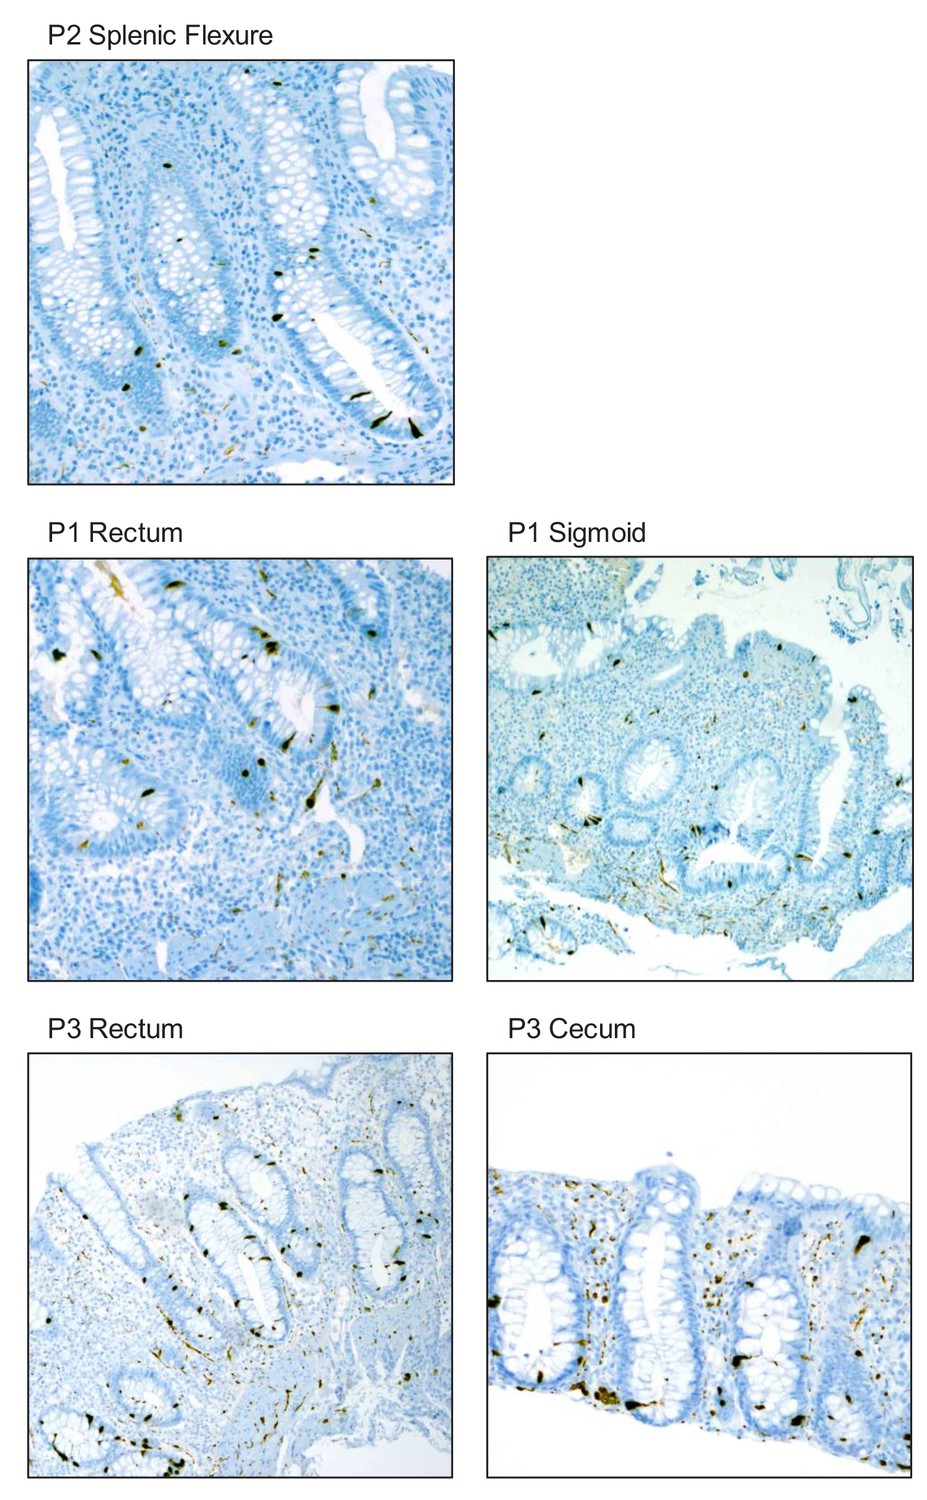
Immunohistochemistry (IHC) staining for SCGN in colonic biopsies obtained from probands P1, P2, and P3. 40x magnification.
https://doi.org/10.7554/eLife.49910.008
Figure 2—figure supplement 2

Immunofluorescence staining for markers of EEC lineage in healthy human colon (scale bar 200µ - inset 40 µm).
Arrows indicate cells that are exclusively positive for SCGN. 5-HT, 5-hydroxytryptophan (serotonin); CGB, chromogranin B; GCG, glucagon precursor peptide.
Figure 2—figure supplement 3
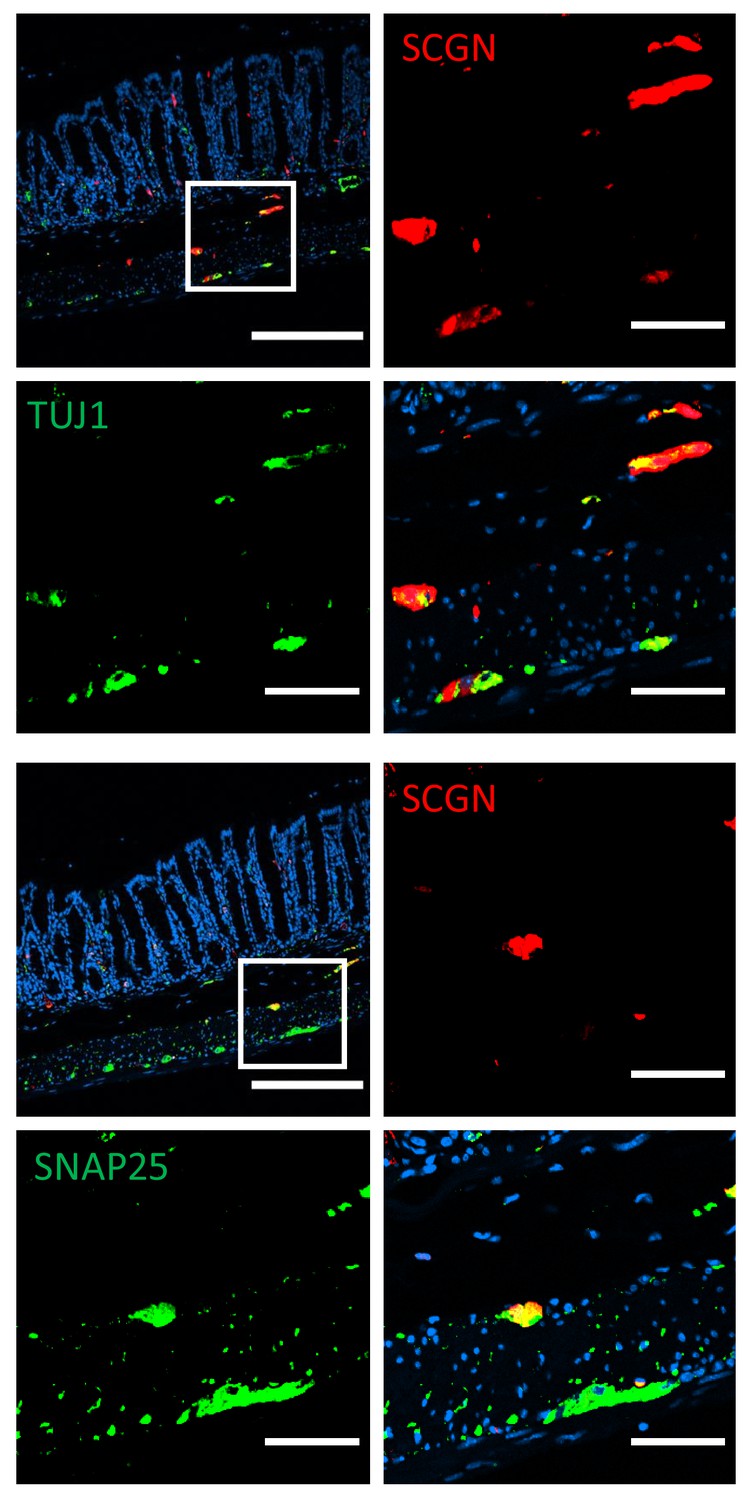
Immunofluorescence staining for neuronal markers in murine colon of C57BL/6 mice (scale bar 200 µm - inset 50 µm).
TUJ1, neuron-specific class III β-tubulin; SNAP25, synaptosomal nerve-associated protein 25.
Figure 3 with 3 supplements
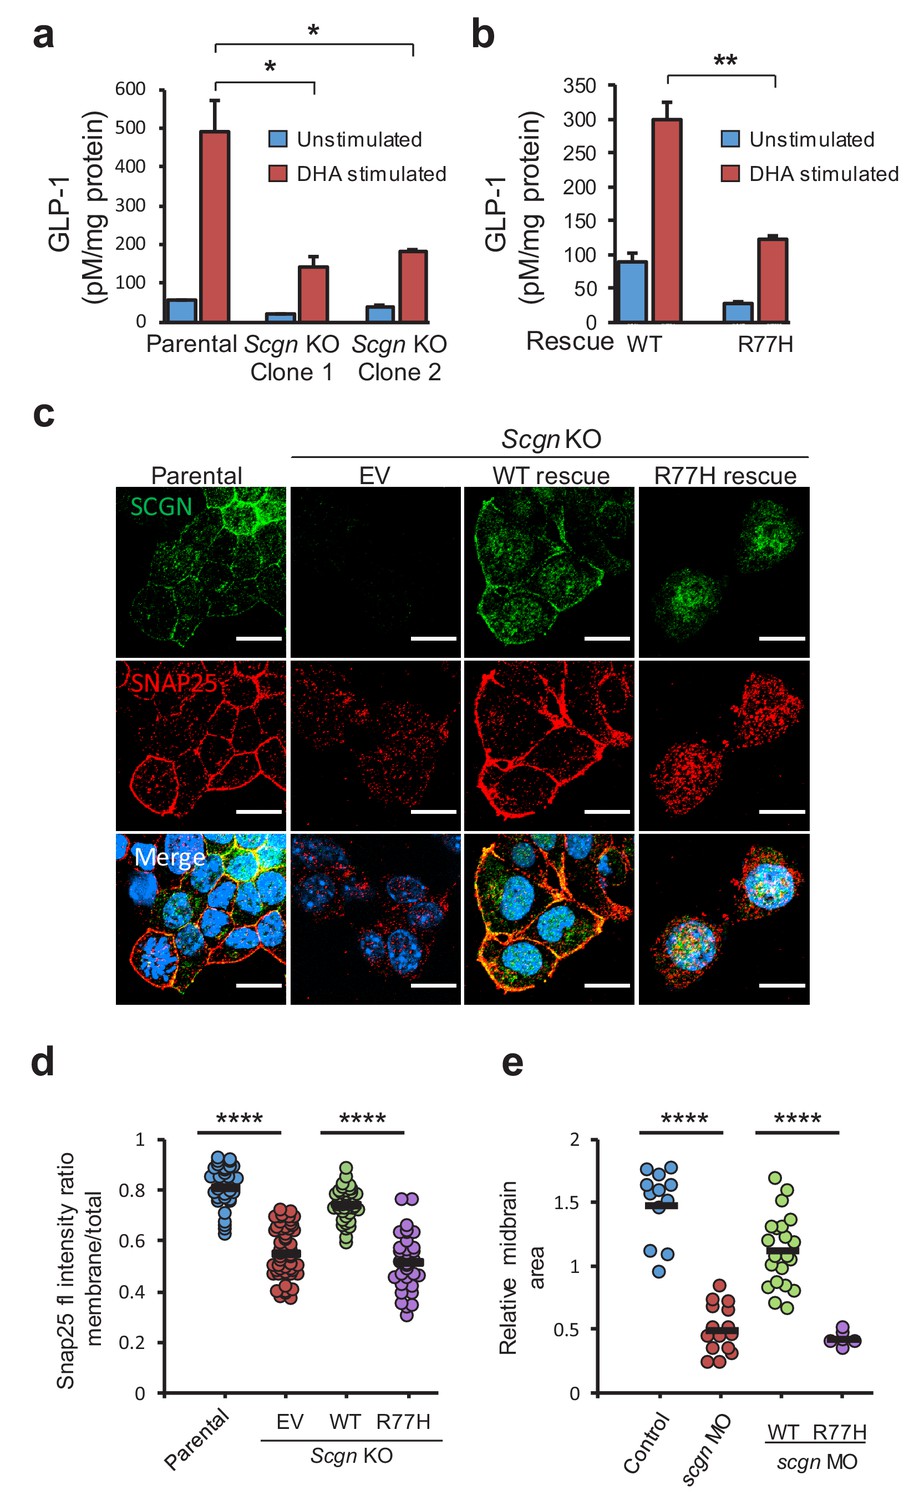
SCGN p.R77H is a hypomorphic allele.
(a) Basal and DHA fatty acid induced GLP-1 release from parental and Scgn deleted (KO) clones. GLP-1 values are normalized to total protein content. (b) Basal and DHA stimulated GLP-1 secretion from rescue clones expressing human SCGNWT or SCGNR77H. (c) Immunofluorescence images showing subcellular localization of SNAP25 and SCGN in parental STC-1 cells and the indicated SCGN KO and rescue cell lines. Scale bar 15 µm. (d) For the experiment depicted in (c), SNAP25 staining intensity ratio between the membranous compartment and the total cellular signal was plotted in the indicated cell lines. Dots indicate individual cells, horizontal bars correspond to the mean within each group. (e) Midbrain size of zebrafish after scgn targeting with morpholinos or rescue with human SCGNWT or SCGNR77H. Dots indicate individual embryos, horizontal bars correspond to the mean within each group. The zebrafish experiments were performed in triplicate. *p<0.05, **p<0.01, ****p<0.0001 unpaired student t test in (a), (b) and (d). ****p<0.0001 multiple comparison ANOVA in (e). Error bars in (a) and (b) represent the S.E.M.
-
Figure 3—source data 1
Source data for Figure 3A.
- https://doi.org/10.7554/eLife.49910.016
-
Figure 3—source data 2
Source data for Figure 3B.
- https://doi.org/10.7554/eLife.49910.017
-
Figure 3—source data 3
Source data for Figure 3D.
- https://doi.org/10.7554/eLife.49910.018
-
Figure 3—source data 4
Source data for Figure 3E.
- https://doi.org/10.7554/eLife.49910.019
Figure 3—figure supplement 1
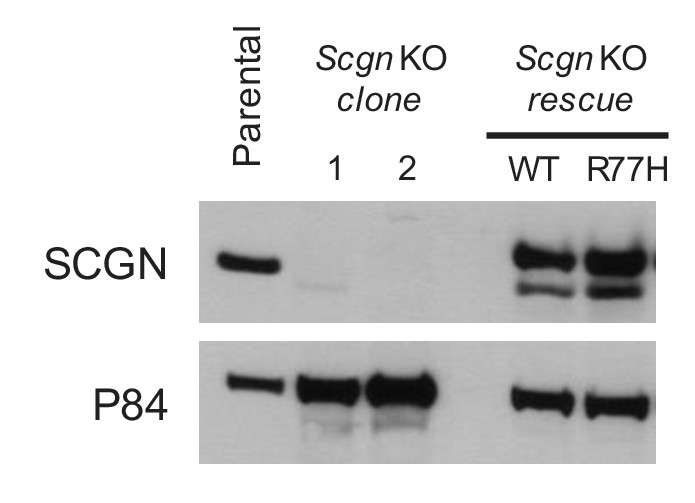
Scgn deficient clones of STC-1 cells were generated by CRISPR/Cas9 technology.
Protein knockout (KO) was confirmed by immunoblotting. Expression of SCGNWT or SCGNR77H in rescue clones is also shown.
Figure 3—figure supplement 2
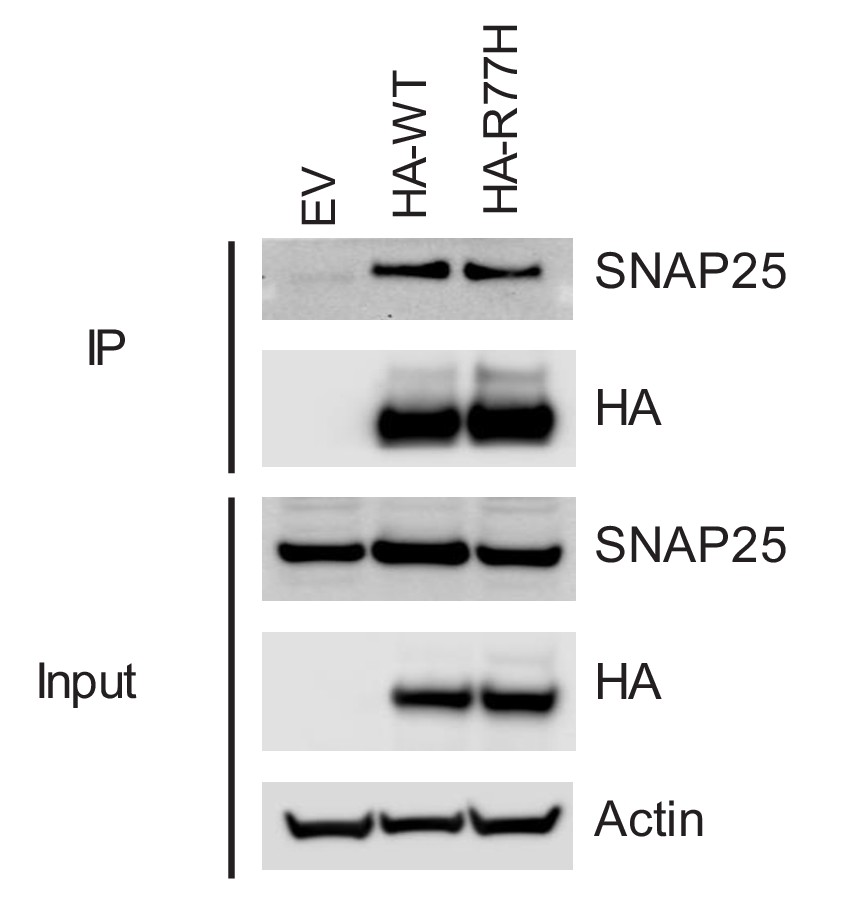
SNAP25 co-precipitation from SCGN rescue cell lines.
Re-expressed SCGN was HA tagged.
Figure 3—figure supplement 3
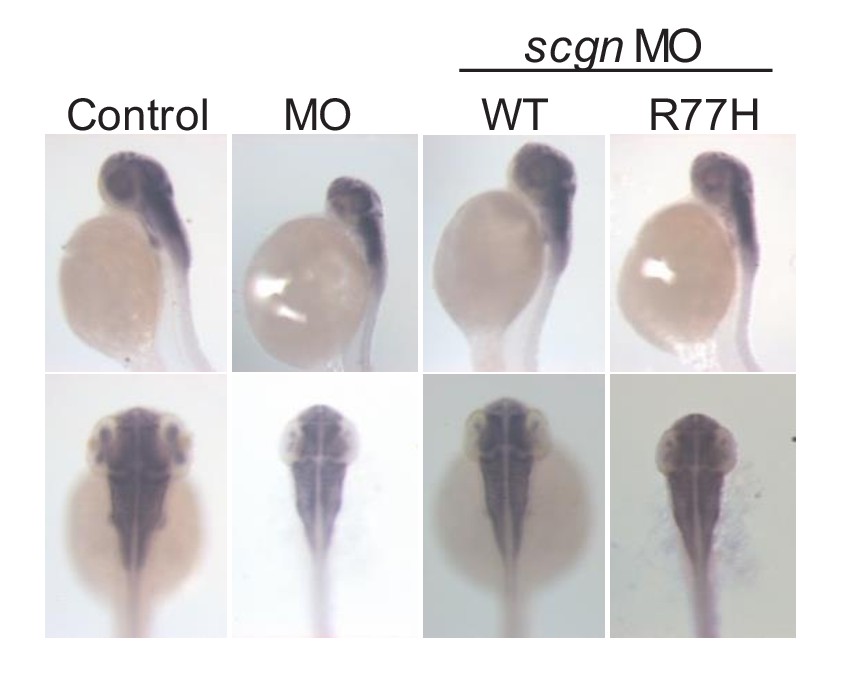
Bright-field images of zebrafish after morpholino injections (MO).
In-situ hybridization of HuC (elavl3) was performed in embryos at 48 hr post fertilization to highlight the developing brain. Control: control MO injection; MO: scgn MO injection; MO+WT: SCGN MO and human SCGN WT mRNA co-injection; MO+R77H: SCGN MO and human SCGN R77H mRNA co-injection. All injections are performed at one-cell stage of the development.
Figure 4 with 1 supplement
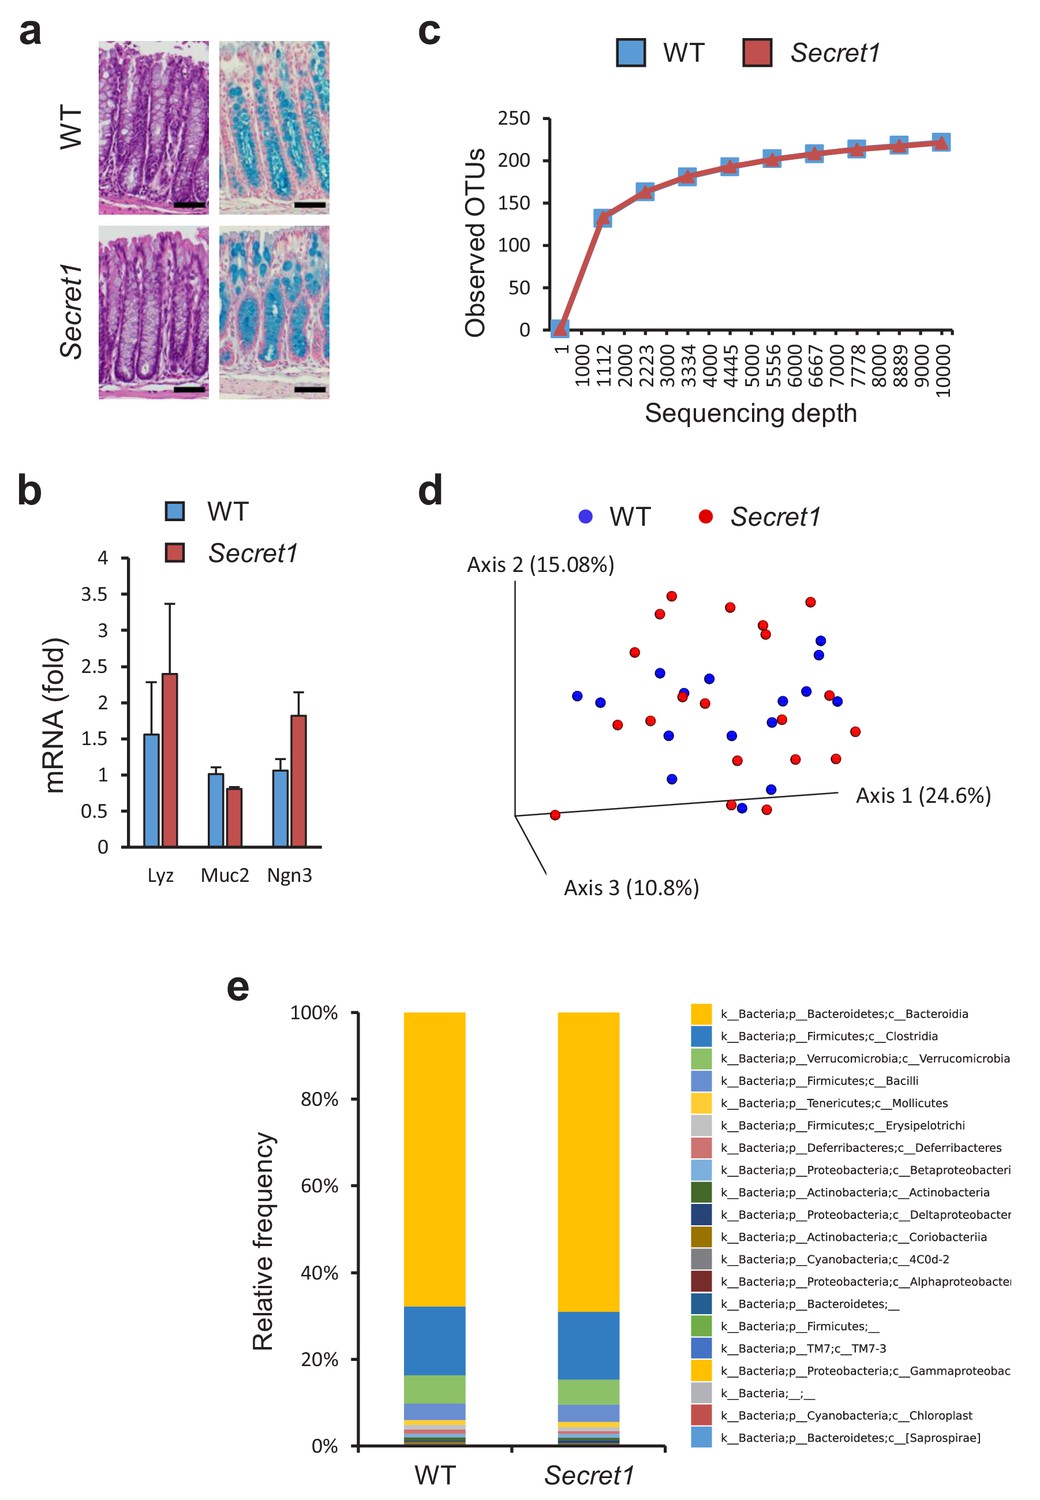
Scgn deficient mice display intact mucosal architecture and microbiota at baseline.
(a) Representative colon histologic images from Secret1 and WT animals under untreated conditions. HE is shown on the left, alcian blue staining on the right. Scale bar 100 µm. (b) Baseline expression of prototypical intestinal epithelial cell lineage-specific markers from small bowel in Secret1 and WT mice was determined by qRT-PCR (n = 3 in each group). (c) Microbiome alpha diversity as measured by observed OTU mean counts of fecal 16 s rRNA sequencing. (d) Beta diversity by unweighted UNIFRAC principal coordinate analysis (PCoA) of fecal 16 s rRNA sequencing. (e) Class level taxonomic composition for stool 16 s sequencing. WT n = 16 Secret1 n = 20. S.E.M. was used for error bars in (b).
-
Figure 4—source data 1
Source data for Figure 4B.
- https://doi.org/10.7554/eLife.49910.022
-
Figure 4—source data 2
Source data for Figure 4C.
- https://doi.org/10.7554/eLife.49910.023
-
Figure 4—source data 3
Source data for Figure 4E.
- https://doi.org/10.7554/eLife.49910.024
Figure 4—figure supplement 1
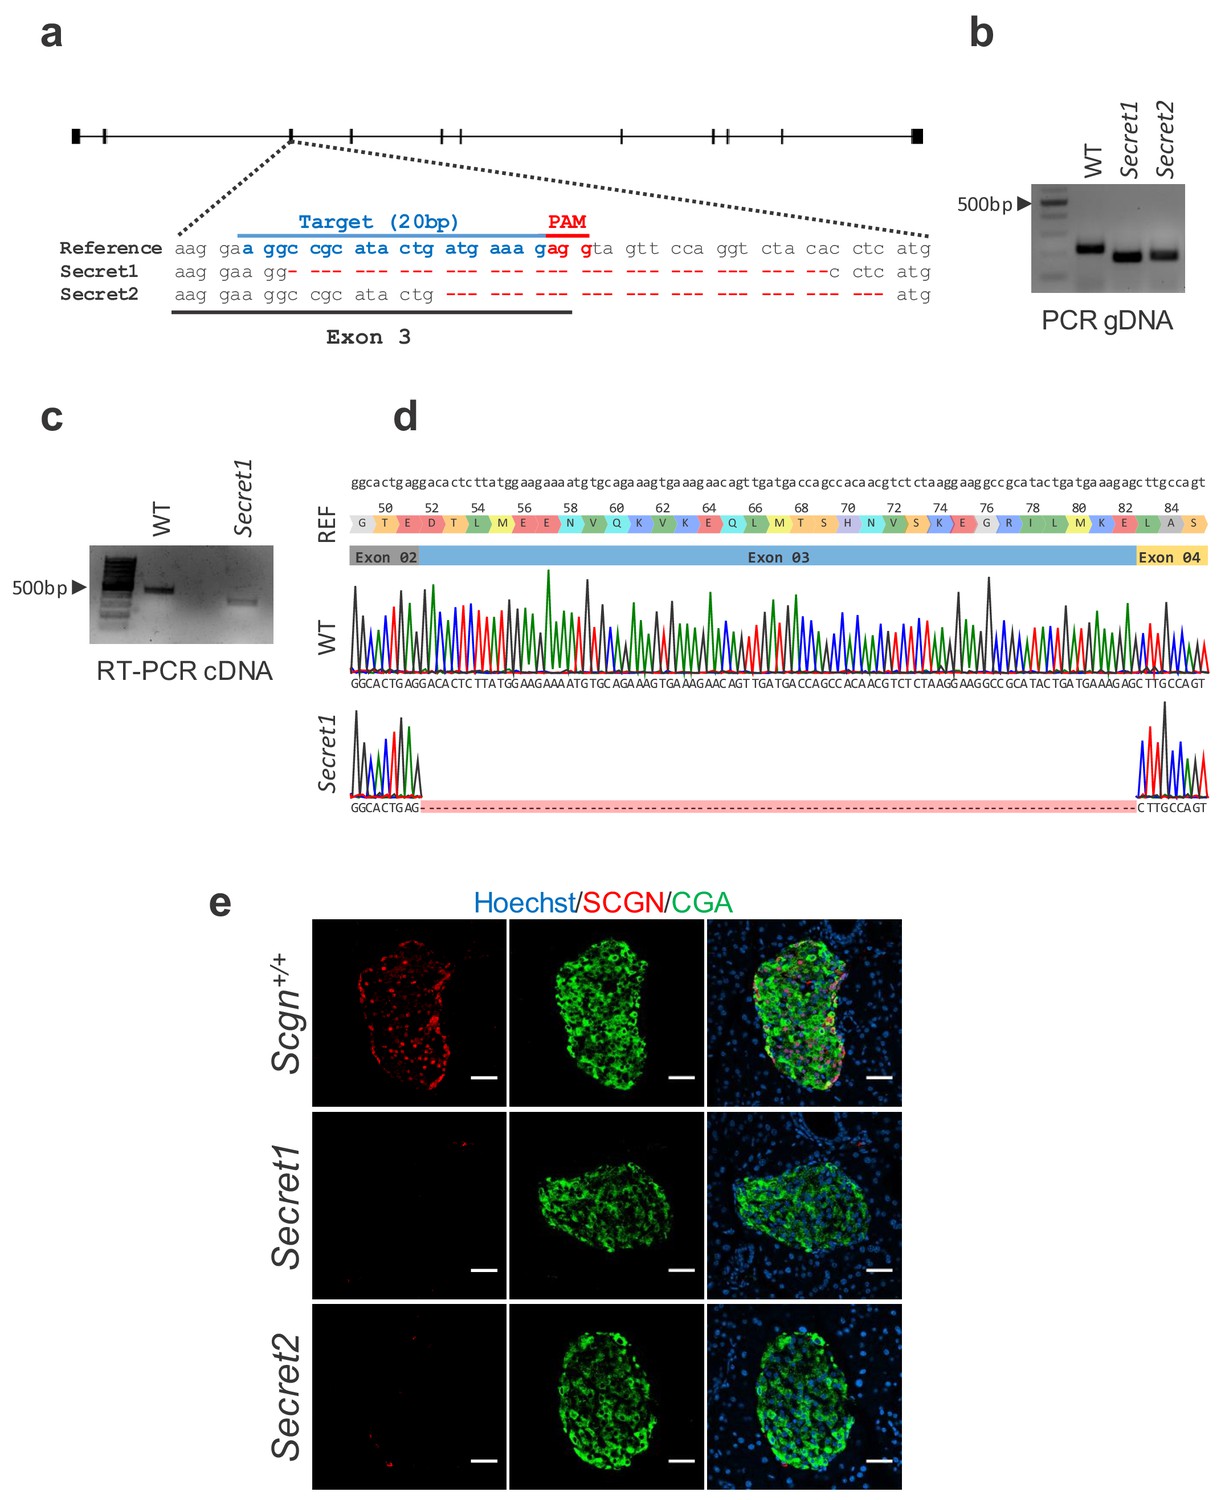
Engineering Scgn deficient animals.
(a) Diagram of CRISPR/Cas9 targeted exon 3 of Scgn. 20 nucleotide guide RNA sequence (blue), PAM (red). Reference sequence (top) and sequences from founder animals (middle and bottom) with varying length deletions are depicted. (b) Genotyping of mice carrying CRISPR/Cas9 induced deletions. (c) RT-PCR for Scgn using RNA extracted from colonocytes from WT and Secret1 animals. (d) Sequence alignment of WT and Secret1 Sanger sequencing results of RT-PCR product. (e) Fluorescent immunostaining of SCGN and CGA in pancreatic islets of Scgn sufficient (Scgn+/+) and Scgn deficient (Secret1 and Secret2) mouse lines. Scale bar 50 µm.
Figure 5 with 2 supplements
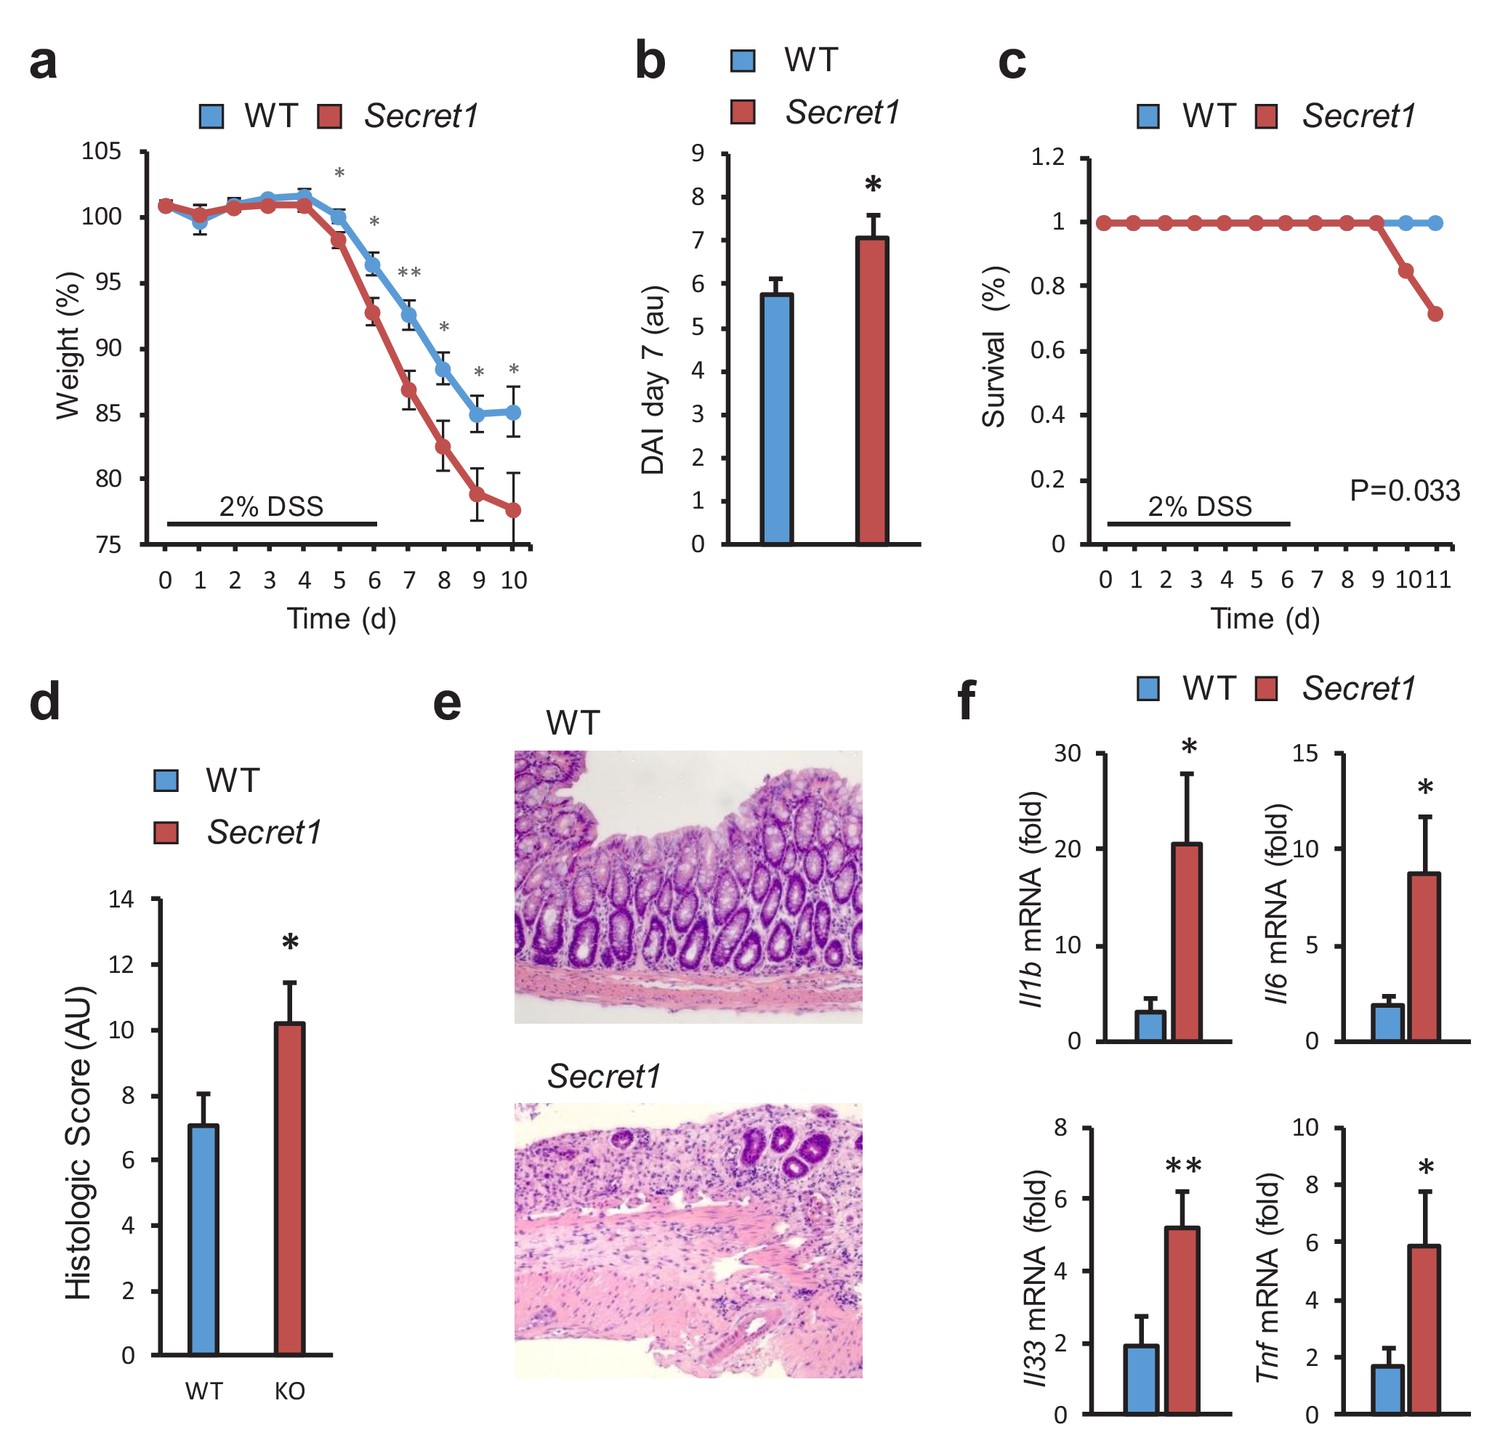
SCGN loss leads to increased sensitivity to DSS colitis.
(a–c) Body weight, disease activity index (DAI), and survival of male WT (n = 13) and Secret1 (n = 13) mice treated for 6 days with 2% DSS in their drinking water. (d) Histologic score of male and female WT (n = 11) and Secret1 (n = 13) animals treated for 6 days with 2% DSS. (e) Representative microphotographs (20x) of colonic epithelium of DSS-treated mice. (f) Inflammatory gene expression measured by qRT-PCR from ceca of DSS-treated mice. Data in (a), (b) and (c) are representative of 2 experiments. *p<0.05. **p<0.01, two tailed unpaired t test in (a), (b) and (f). *p<0.05. one tailed unpaired t test in (d). S.E.M. was used for error bars in (a), (b), (d), (f). Log rank test was used in (c).
-
Figure 5—source data 1
Source data for Figure 5A.
- https://doi.org/10.7554/eLife.49910.032
-
Figure 5—source data 2
Source data for Figure 5B.
- https://doi.org/10.7554/eLife.49910.033
-
Figure 5—source data 3
Source data for Figure 5C.
- https://doi.org/10.7554/eLife.49910.034
-
Figure 5—source data 4
Source data for Figure 5D.
- https://doi.org/10.7554/eLife.49910.035
-
Figure 5—source data 5
Source data for Figure 5F.
- https://doi.org/10.7554/eLife.49910.036
Figure 5—figure supplement 1
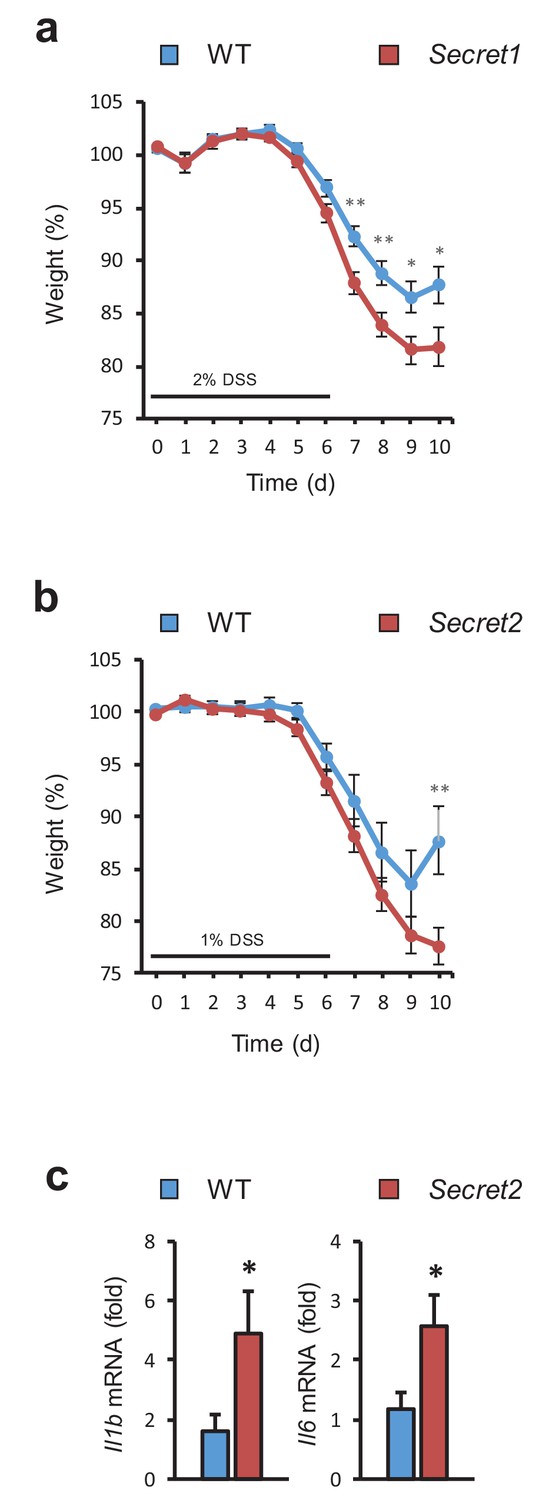
Increased sensitivity to DSS in Scgn deficient animals.
(a) Body weight of male and female Secret1 (n = 27) and WT (n = 21) mice treated with 2% DSS for 6 days. This is the aggregate data of 2 separate experiments. (b) Body weight of male Secret2 and WT mice during 6 day treatment with 1% DSS. (c) Inflammatory gene expression from ceca of experimental mice as measured by qRT-PCR. WT n = 9 Secret2 n = 12. **p<0.01 two tailed unpaired t test in (b) *p<0.05 one tailed unpaired t test in (c). Error bars in (a), (b), (c). S.E.M.
-
Figure 5—figure supplement 1—source data 1
Source data for Figure 5—figure supplement 1A.
- https://doi.org/10.7554/eLife.49910.027
-
Figure 5—figure supplement 1—source data 2
Source data for Figure 5—figure supplement 1B.
- https://doi.org/10.7554/eLife.49910.028
-
Figure 5—figure supplement 1—source data 3
Source data for Figure 5—figure supplement 1C.
- https://doi.org/10.7554/eLife.49910.029
Figure 5—figure supplement 2
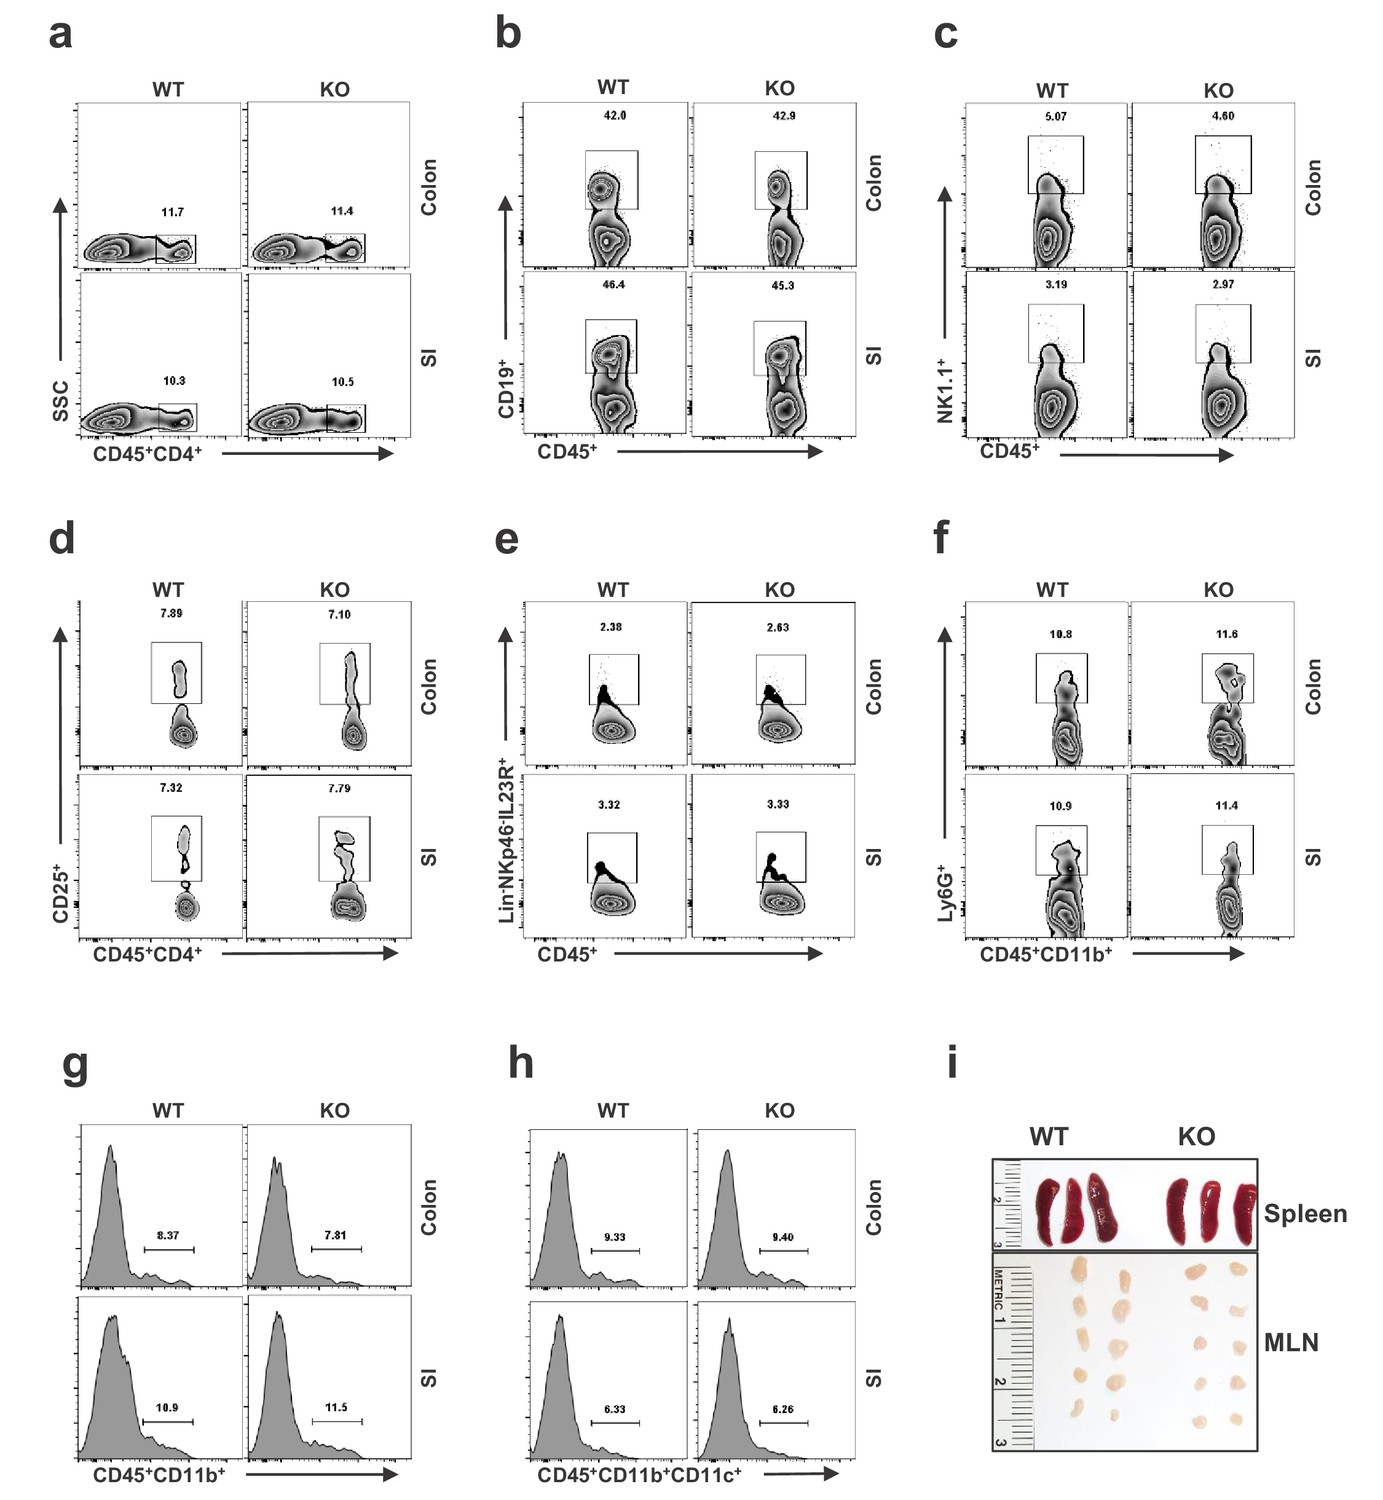
Immunophenotying of WT and Secret1 mice.
Lamina propria leukocytes were extracted from colon and small intestine (SI) of WT and Secret1 mice and stained for flow cytometry. The flow cytometry images show pooled analysis of (a) CD45+CD4+ cells T cells, (b) CD45+CD19+ B cells, (c) CD45+NK1.1+ NKT cells, (d) CD45+CD4+CD25+ Tregs, (e) CD45+Lin–NKp46–IL23R+ ILC3, (f) CD45+CD11b+Ly6G+ neutrophils, (g) CD45+CD11b+ macrophages, and (h) CD45+CD11b+CD11c+ dendritic cells. (i) Representative images showing gross appearance of the spleen and MLN from WT and Secret1 mice (n = 5 mice in each group).
-
Figure 5—figure supplement 2—source data 1
Source data for Figure 5—figure supplement 2.
- https://doi.org/10.7554/eLife.49910.031
Figure 6
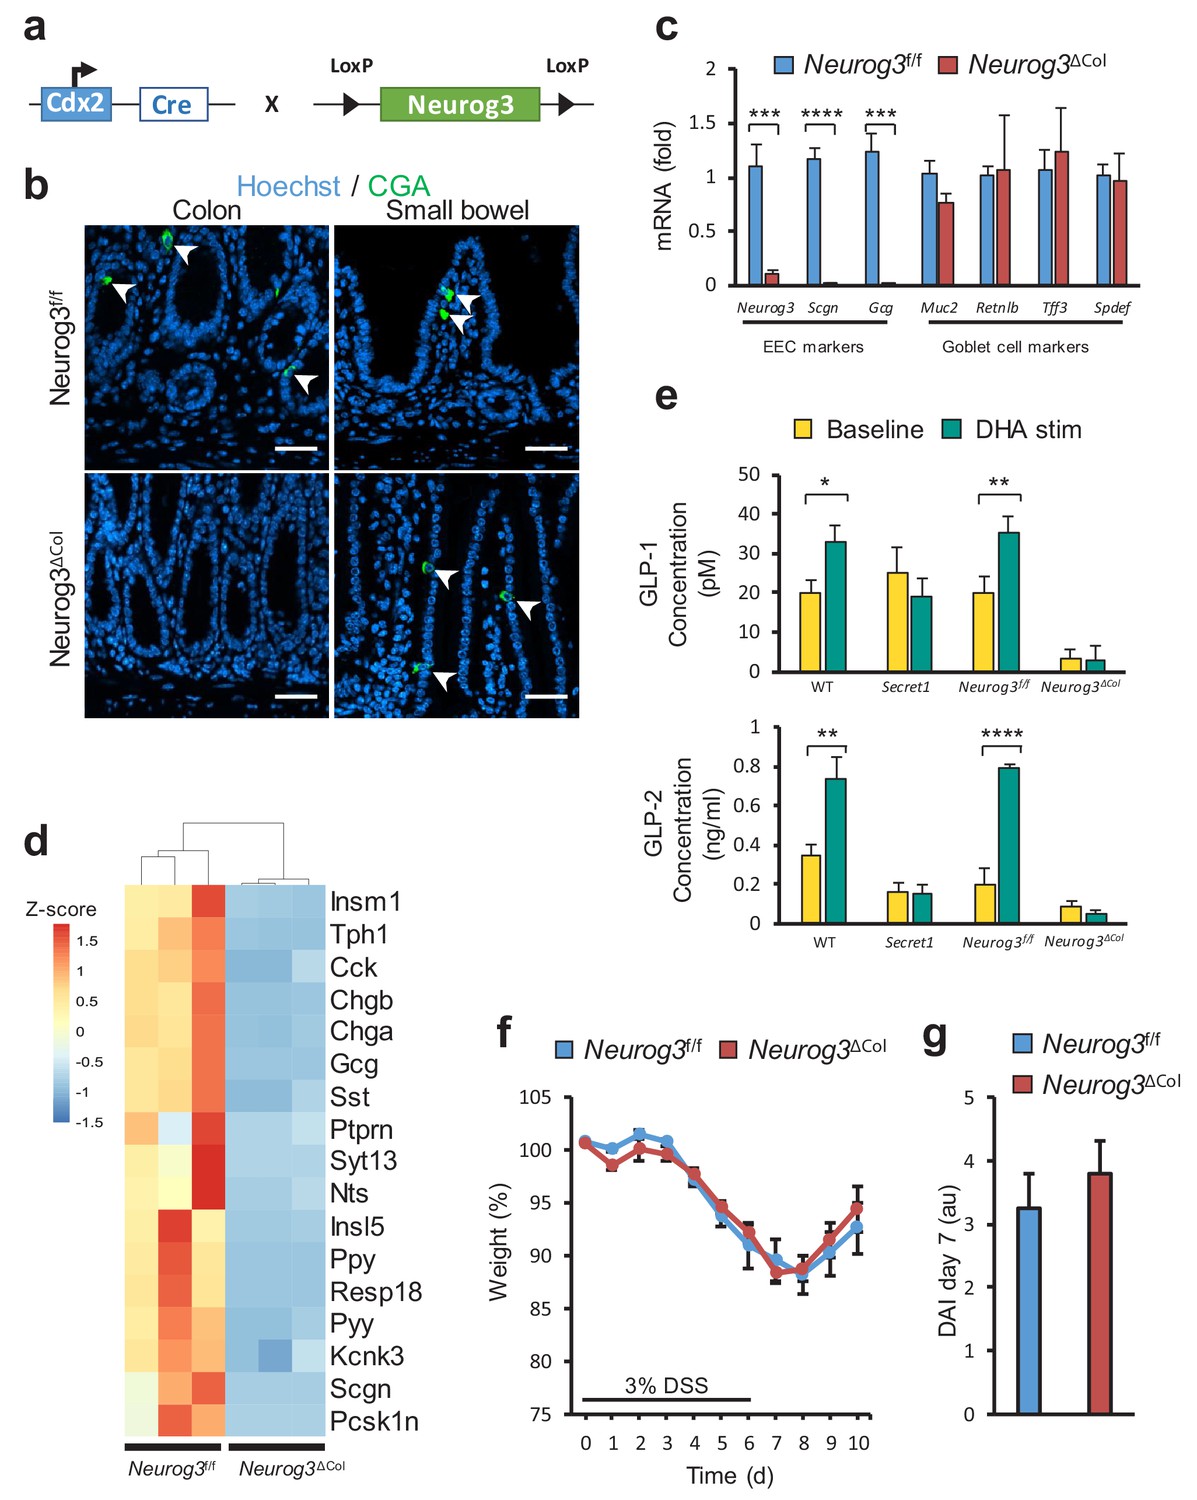
Loss of colonic EECs does not confer DSS susceptibility.
(a) Diagram depicting the mating strategy used to generate colonic EEC (Neurog3ΔCol) deficient mice. (b) CGA immunofluorescent staining of colon and small bowel from wild-type (Neurog3f/f) and colonic EEC deficient (Neurog3ΔCol) mice (c) qRT-PCR of epithelial lineage makers from colonic epithelium from Neurog3f/f and Neurog3ΔCol mice (n = 3 in each group). (d) Heat map presentation of top differentially expressed genes from RNA-seq of colonic epithelia of Neurog3f/f and Neurog3ΔCol mice. (e) Ex-vivo basal and DHA-stimulated GLP-1 and GLP-2 secretion from colonic explants of Secret1 and EEC deficient mice. (GLP-1: Neurog3f/f n = 7, Neurog3ΔCol n = 6, WT n = 6, Secret1 n = 6) (GLP2: Neurog3f/f n = 5, Neurog3ΔCol n = 5, WT n = 6, Secret1 n = 4). Bars represent the mean and error bars the S.E.M. (f–g) Body weight and DAI of conventionally raised Neurog3f/f and Neurog3ΔCol mice treated for 6 days with 3% DSS (n = 15 in each group). Scale bar in (b) 50 µm. *p<0.05, **p<0.01, ***p<0.001 ****p<0.0001 two tailed unpaired t test in (c) and (e). S.E.M. was used for error bars in (c), (e), (f) and (g).
-
Figure 6—source data 1
Source data for Figure 6C.
- https://doi.org/10.7554/eLife.49910.038
-
Figure 6—source data 2
Source data for Figure 6D.
- https://doi.org/10.7554/eLife.49910.039
-
Figure 6—source data 3
Source data for Figure 6E.
- https://doi.org/10.7554/eLife.49910.040
-
Figure 6—source data 4
Source data for Figure 6F.
- https://doi.org/10.7554/eLife.49910.041
-
Figure 6—source data 5
Source data for Figure 6G.
- https://doi.org/10.7554/eLife.49910.042
Author response image 1
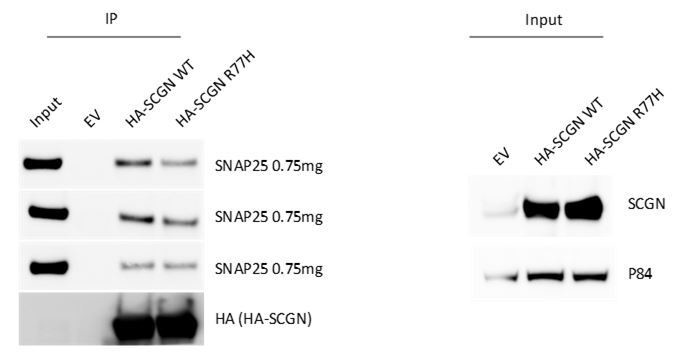
HEK293T cells, which do not express SNAP25, were transfected with HA-tagged SCGN (WT or R77H).
These proteins were subsequently purified through an HA binding resin. The purified proteins, immobilized on the resin were then incubated with cellular lysates of STC-1 cells (0.75mg of lysate offered), and SNAP25 binding was determined by immunoblotting. Three technical replicates of the IP were performed (top three panels on the left). Input from HEK293 cells are shown on the right. This experiment is representative of 3 independent iterations.
Tables
Table 1
Areas of shared loss-of-heterozygosity (LOH) among affected probands as defined by SNP array.
https://doi.org/10.7554/eLife.49910.006| Start | End | |
|---|---|---|
| Chr 12 | 71,016,157 | 72,070,710 |
| 72,320,251 | 73,669,855 | |
| 73,671,276 | 75,891,939 | |
| 77,249,400 | 79,204,389 | |
| 79,302,419 | 82,139,004 | |
| 82,147,487 | 83,157,896 | |
| 83,541,966 | 88,441,286 | |
| 88,594,159 | 89,910,070 | |
| 89,915,484 | 91,765,486 | |
| 91,766,720 | 93,152,115 | |
| 93,251,750 | 95,410,845 | |
| Chr 6 | 16,893,011 | 18,222,277 |
| 18,262,607 | 19,682,599 | |
| 19,686,123 | 19,803,768 | |
| 19,804,188 | 21,778,105 | |
| 23,584,375 | 26,148,311 |
Additional files
-
Supplementary file 1
Copy number variation and loss of heterozygosity (LOH) analysis by SNP array.
- https://doi.org/10.7554/eLife.49910.043
-
Supplementary file 2
Scoring system for inflammation-associated histological changes in the colon (DSS).
- https://doi.org/10.7554/eLife.49910.044
-
Supplementary file 3
Disease activity index for colitis model.
- https://doi.org/10.7554/eLife.49910.045
-
Supplementary file 4
Primer Sequences.
- https://doi.org/10.7554/eLife.49910.046
-
Supplementary file 5
Key resource table.
- https://doi.org/10.7554/eLife.49910.047
-
Transparent reporting form
- https://doi.org/10.7554/eLife.49910.048
Download links
A two-part list of links to download the article, or parts of the article, in various formats.
Downloads (link to download the article as PDF)
Open citations (links to open the citations from this article in various online reference manager services)
Cite this article (links to download the citations from this article in formats compatible with various reference manager tools)
SCGN deficiency results in colitis susceptibility
eLife 8:e49910.
https://doi.org/10.7554/eLife.49910


