Combinatorial chromatin dynamics foster accurate cardiopharyngeal fate choices
- New York University, United States
Figures
Figure 1 with 3 supplements
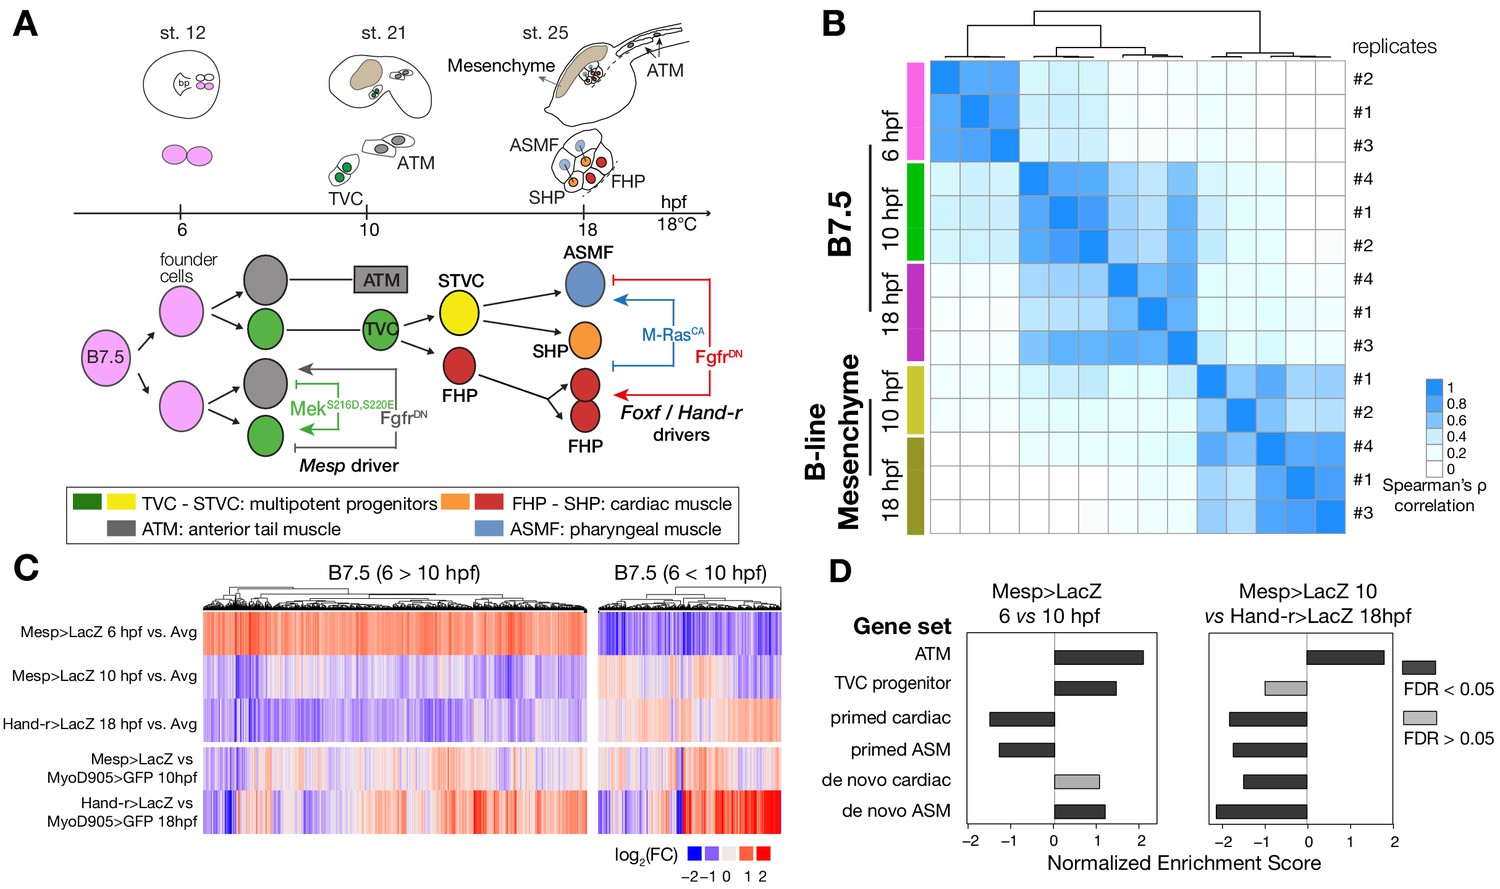
Profiling chromatin accessibility dynamics during early cardiopharyngeal cell development.
(A) Embryos, larvae and lineage diagram showing B7.5 blastomeres, their cardiopharyngeal progeny, and the main stages sampled for ATAC-seq. Anterior tail muscle (ATM, gray), trunk ventral cell (TVC, green), secondary TVC (STVC, yellow), first heart precursor (FHP, red), second heart precursor (SHP, orange), atrial siphon precursor cells (ASMF, blue). Stages (St.) according to Hotta et al. (2007) with hours post fertilization (hpf). (B) Spearman correlation of RPKM (reads per kb per million mapped reads) values in 14,178 regions changing accessibility over time or between B7.5 and B-line mesenchyme lineages. (C) Temporal changes in chromatin accessibility for 5,450 regions. ‘B7.5 6 > 10’: 3,691 regions more accessible at Mesp>LacZ 6 hpf than Mesp>LacZ 10 hpf. ‘B7.5 6 < 10’: 1,759 regions more accessible at Mesp>LacZ 10 than Mesp>LacZ 6 hpf. The accessibility of these regions is shown for Mesp>LacZ 6 hpf, Mesp>LacZ 10 hpf, and Hand-r>LacZ 18 hpf vs. the average (avg) accessibility in the control cells. Cell-type-specific chromatin accessibility is shown in the comparison of Mesp>LacZ and MyoD905>GFP at 10 and Hand-r>LacZ and MyoD905>GFP 18 hpf. (D) Gene Set Enrichment Analysis (GSEA) normalized enrichment score of defined gene sets in regions ranked by difference in accessibility between time points as indicated (see Materials and methods).
Figure 1—figure supplement 1
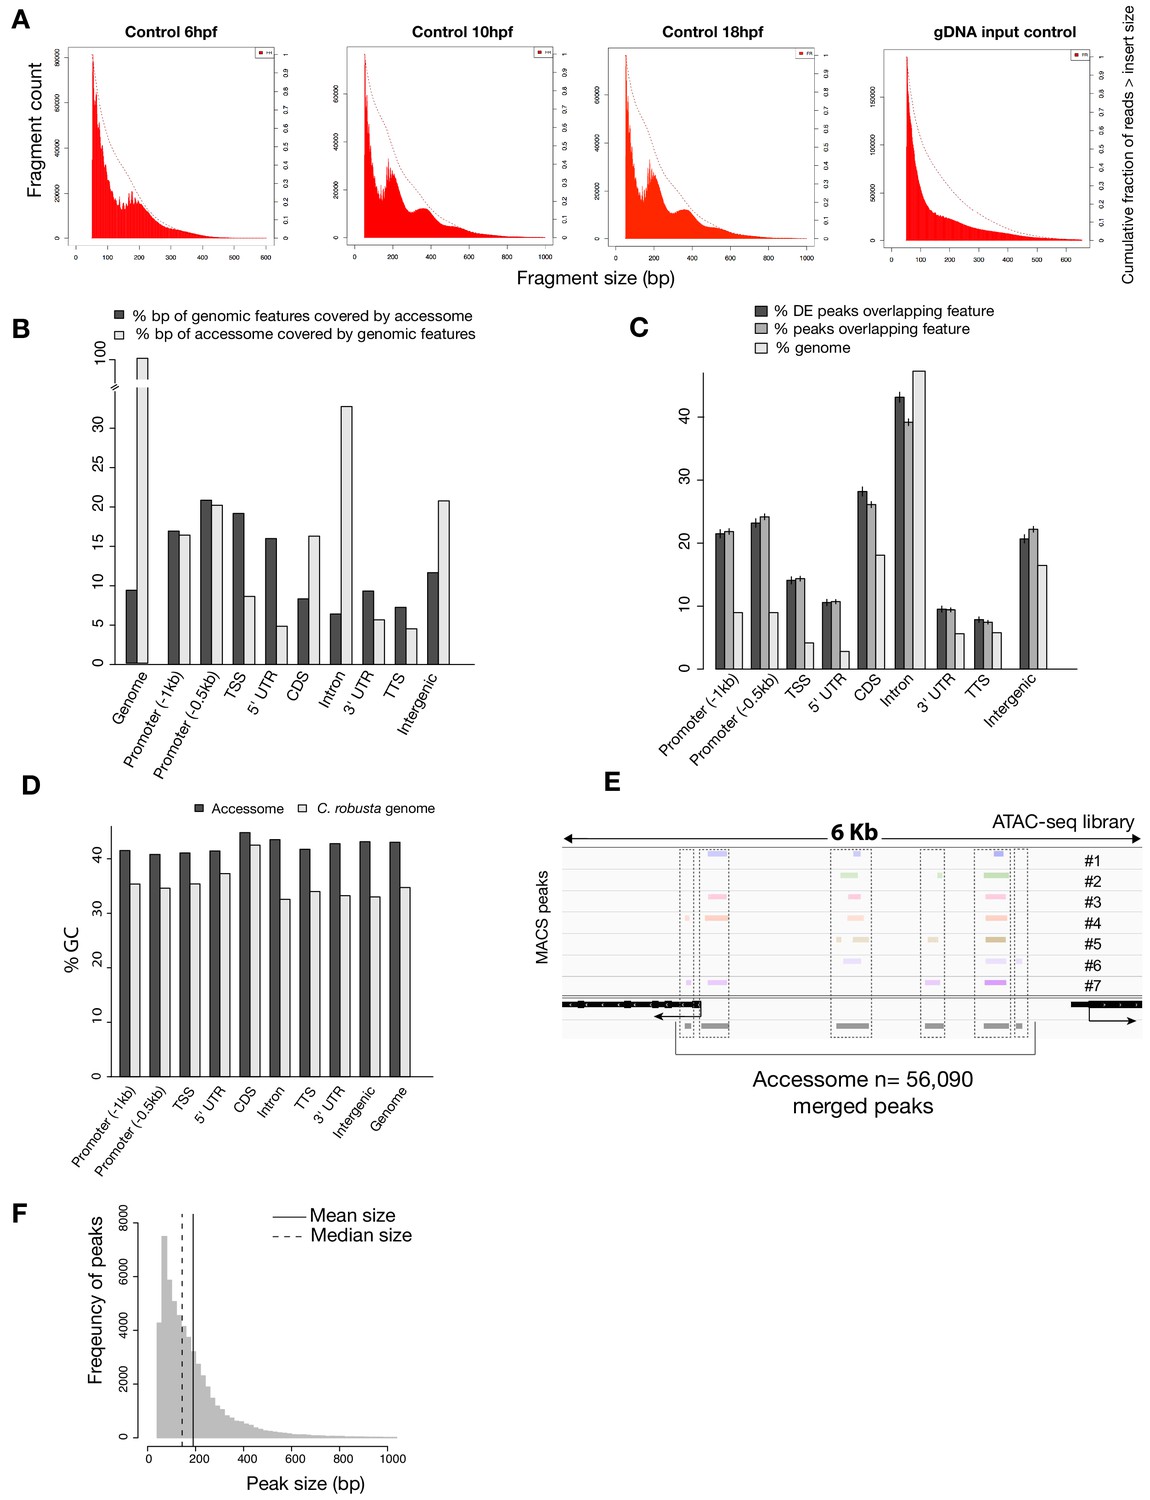
General characterization of the accessome.
(A) Fragment size for B7.5 control samples at developmental time indicated (first three panels from the left) showing consistent approximately 147 bp periodicity, likely corresponding to nucleosome-protected fragments. This periodicity is not present in the purified genomic DNA (gDNA) input control (far right panel). Dotted lines show the cumulative fraction of reads larger than a given size. (B) Proportion of genomic features covered by the accessome and proportion of the accessome covered by genomic features (in bp). (C) Two-tailed binomial test for enrichment of accessible elements overlapping a genomic feature. Accessible elements associated with any DE gene from any scRNA-seq or bulk RNA-seq experiment were considered DE peaks. Bars show the predicted (based on bp coverage of the genome by a feature) and observed probabilities that an accessible element will overlap a genomic feature. Error bars show the 99% confidence interval. (D) Comparison of GC content of genomic features and accessible regions overlapping these features. (E) A 6 kb region displaying MACS2-called peaks in seven ATAC-seq libraries (upper panel), gene model (black) and accessome (gray). (F) Accessible element size distribution.
Figure 1—figure supplement 2
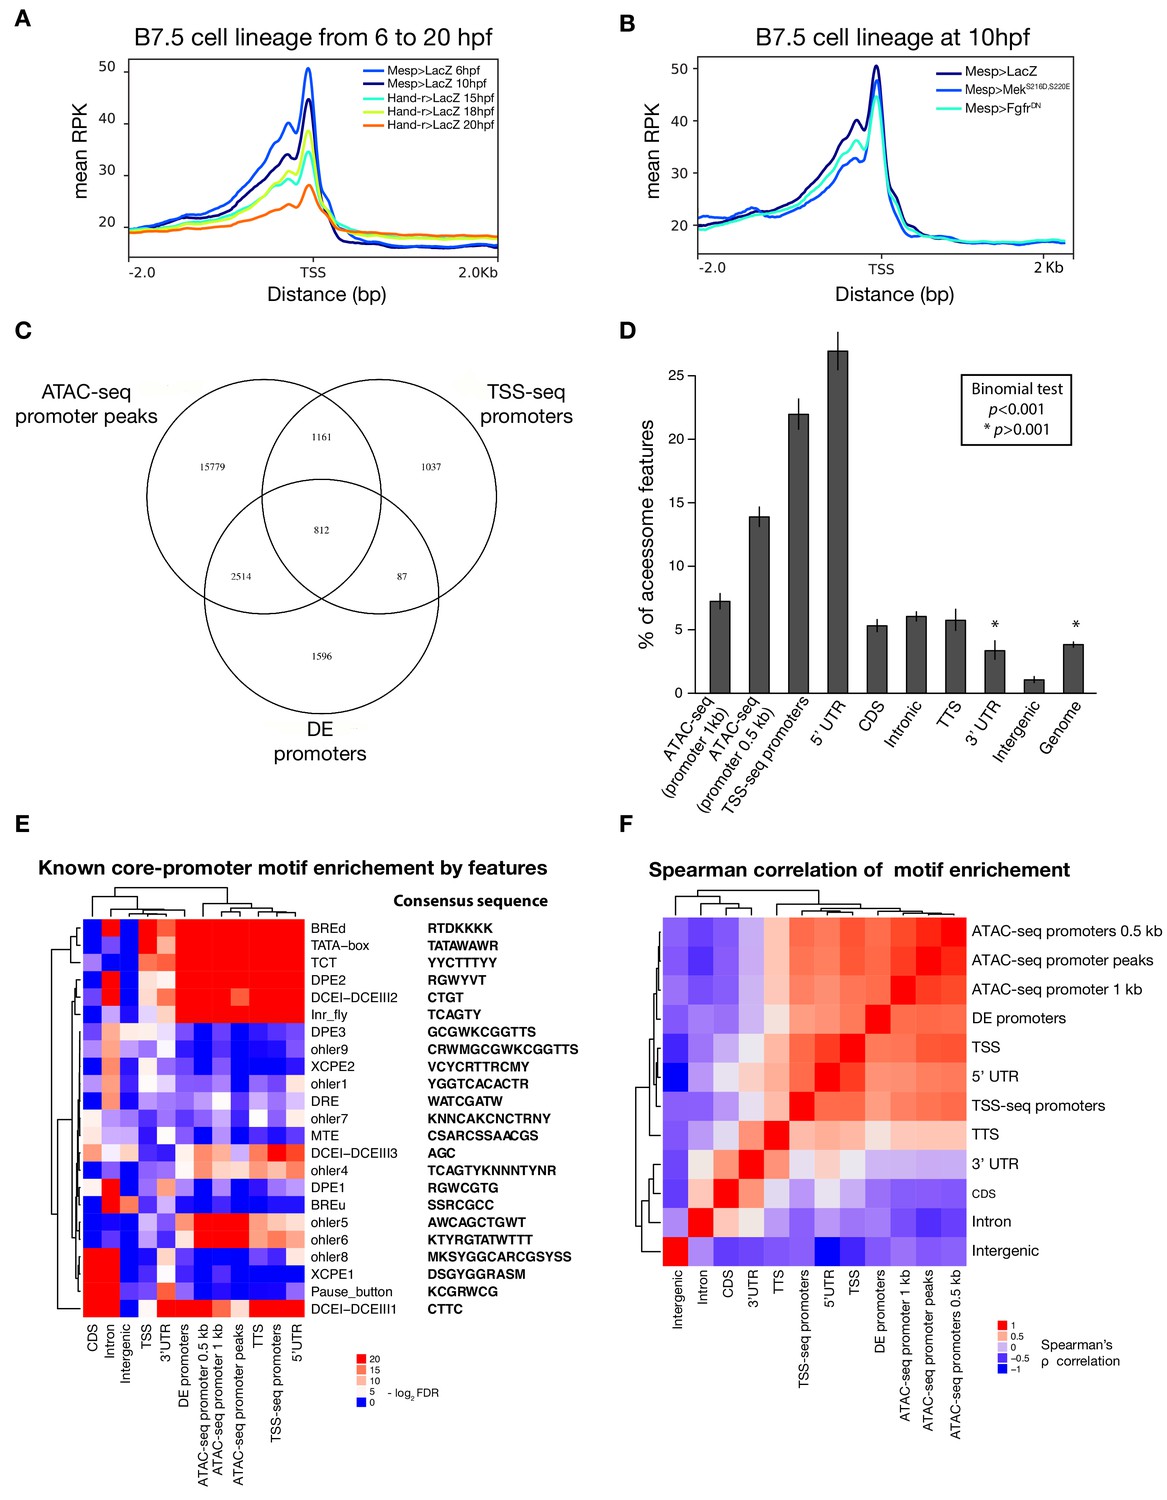
Characterization of promoter regions.
(A) Read density within 2 kb upstream or downstream of TSS shows global closing of TSS over time. (B) Accessibility of the TSS is maintained in response to FgfrDN perturbation at 10 hpf. (C) Intersections of overlapping promoter elements. ‘ATAC-seq promoter peaks’ are accessible elements overlapping the putative promoter (−1,107 to +107 bp from the TSS). ‘DE promoters’ are differentially expressed putative promoters in any bulk RNA-seq condition (see Materials and methods). (D) Two-tailed binomial test for enrichment of accessible elements overlapping TSS-seq sites by genomic feature. Bars show the observed probability that an accessible element overlapping a genomic feature will also overlap a TSS-seq element. Error bars show the 99% confidence interval. The expected probability was calculated from the percent of the accessome overlapping TSS-seq elements (3.8%). (E) One-tailed hypergeometric test for enrichment of promoter motifs in genomic features. Eukaryotic core promoter motifs were taken from Haberle and Stark (2018). (F) Spearman correlation of inferred motif enrichment (see Materials and methods). Motifs in each class of element were ranked based on a one-tailed hypergeometric test.
Figure 1—figure supplement 3
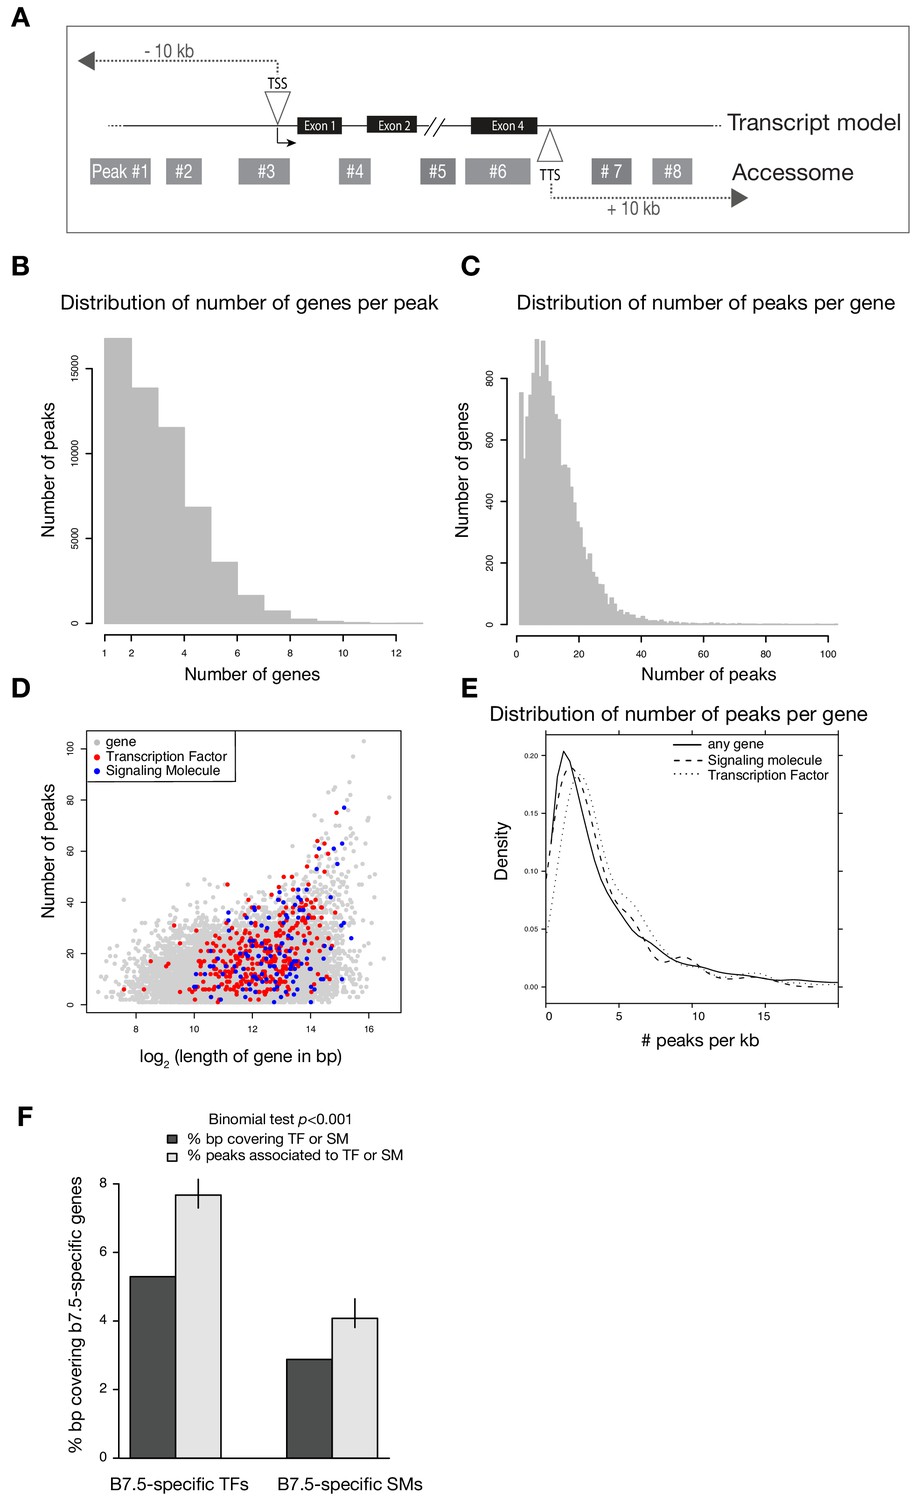
Annotation of the accessome.
(A) Example diagram of accessible elements surrounding a gene locus. (B) Distribution of number of genes associated with each peak. (C) Distribution of number of peaks associated with each gene. (D) Gene size vs. number of associated peaks. Red and blue dots show all transcription factor (TF) and signaling molecule (SM) genes, respectively. (E) Density of peaks per kb of each gene. (F) Two-tailed binomial test for enrichment of accessible elements associated with TF or signaling molecule genes. Predicted probability of an element associating to a TF or signaling molecule is given by the proportion of bps in all gene bodies ± 10 kb covering TFs or signaling molecule gene bodies ± 10 kb. Error bars show the 99% confidence interval of the binomial test. Only genes that were differentially expressed in any scRNA-seq or bulkRNA-seq comparison (Wang et al., 2019) were considered.
Figure 2 with 6 supplements
Cardiopharyngeal accessibility profiles are established in multipotent progenitors.
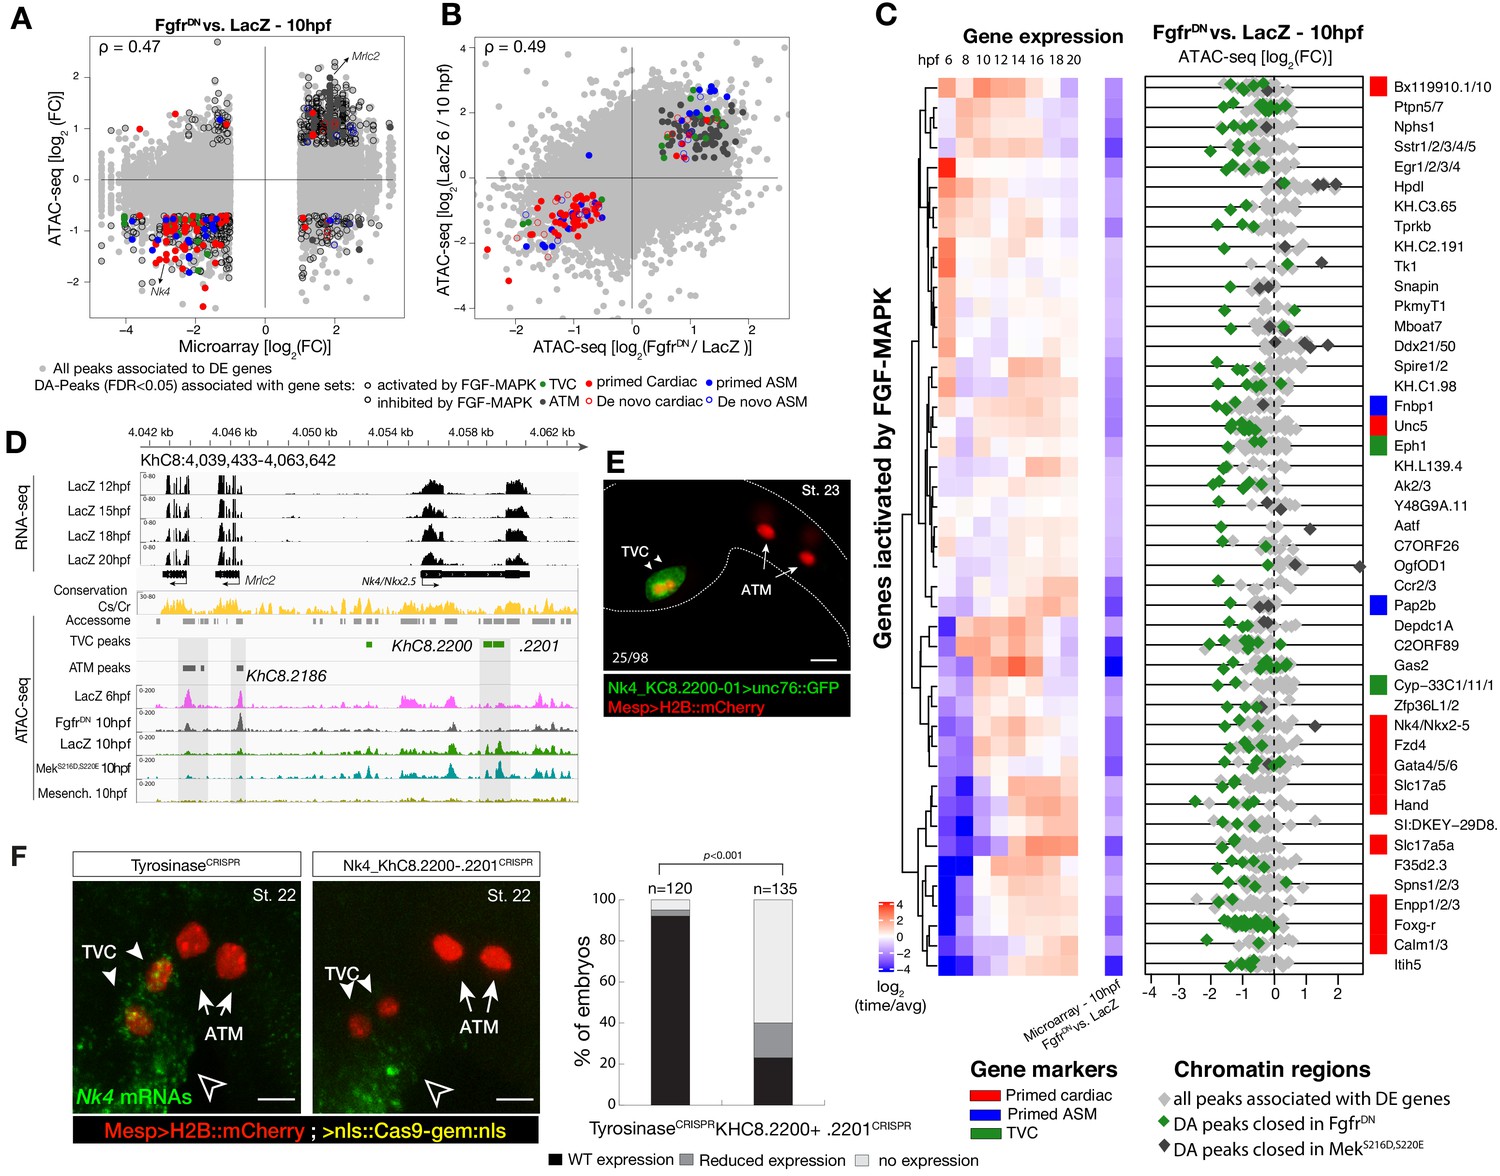
(A–B) Correlations between differential gene expression (DE) and differential chromatin accessibility (DA) in response to FGF-MAPK perturbation in the multipotent progenitors (A) and between chromatin accessibility in response to FGF-MAPK perturbation and in multipotent progenitors (10 hpf) versus founder cells (6 hpf). (B). Colored dots are DA peaks associated with cell type-specific DE genes. ρ is the Spearman correlation of expression and accessibility for DA regions associated with DE genes (A) or of region response to MAPK perturbation with accessibility in founder cells versus multipotent progenitors (B). (C) Relationship between expression and accessibility of DE genes associated with DA regions for genes in the bottom 0.75% quantile of fold change between expression in FgfrDN and control (log2(FC) < −1.32). Microarray log2(fold change (FC)) values are shown on the left. The fold change for all time points is versus the average. (D) A 24 kb region on chromosome eight displaying expression (RNA-seq) and chromatin accessibility (ATAC-seq; normalized by total sequencing depth). Gray shaded boxes show validated ATM-specific promoters and a newly identified TVC-specific enhancer in Nk4/Nkx2-5 intron. (E) Enhancer-driven in vivo reporter expression (green) of tested ATAC-seq regions (KhC8.2200 and .2201). TVCs marked with Mesp>H2B::mCherry (red). Numbers indicate observed/total of half-embryos scored. (F) Endogenous expression of Nk4/Nkx2-5 visualized by in situ (green) in TyrosinaseCRISPR and upon CRISPR/Cas9-induced deletions of TVC-specific region. Nuclei of B7.5 lineage cells are labelled by Mesp>nls::LacZ and revealed with an anti beta-galactosidase antibody (red). Nk4/Nkx2-5 expression was not affected in the epidermis (open arrowhead). Experiment performed in biological replicates. Scale bar, 20 μm. Fisher exact test, total numbers of individual halves scored per condition are shown in 'n='. Gene expression data for 6 hpf and ‘FGF-MAPK perturbation 10 hpf’ (Christiaen et al., 2008) and 8 to 20 hpf (Razy-Krajka et al., 2014) were previously published.
Figure 2—figure supplement 1
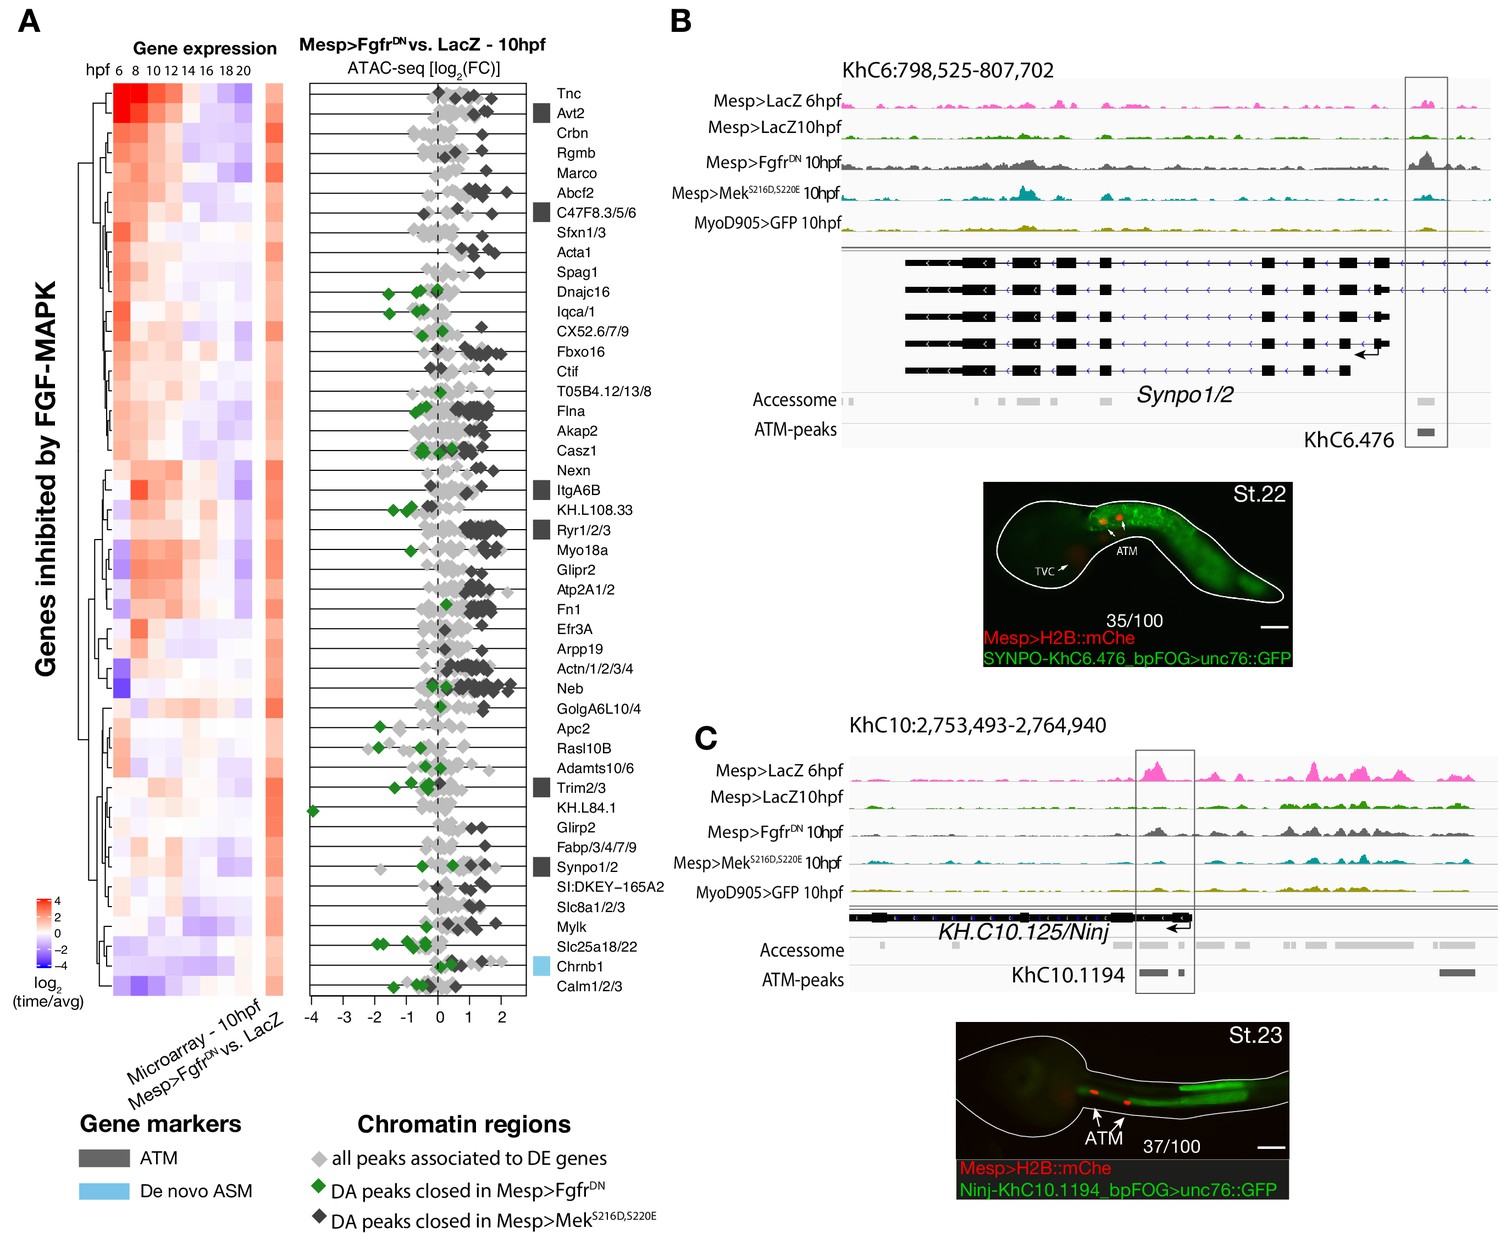
Inhibition of FGF signaling (Mesp>FgfrDN−10 hpf) induces opening of ATM-specific elements.
(A) Relation between expression and accessibility for DE genes in the top 99.25% quantile of fold change between expression in FgfrDN and control at 10 hpf (log2(FC) > 1.31). (B, C) A 10 kb region on chromosome 6 and 10 including Synpo1/2 (B) and KH.C10.125 (C) displaying chromatin accessibility profiles from ATAC-seq (normalized by total sequencing depth). The newly identified enhancers are in boxed regions. ATAC-seq peaks were tested in vivo by reporter gene assay (see Supplementary file 4). Reporter gene assay in embryos at stage 23 (Hotta et al., 2007). GFP expression was detected specifically in ATM cells and not in TVCs. Nuclei of B7.5 lineage cells are labelled by Mesp>H2B::mCherry and Mesp>hCD4::mCherry (red). Numbers indicate observed/total of half-embryos scored. Scale bar = 30 μm.
Figure 2—figure supplement 2
General characterization of differential accessibility.
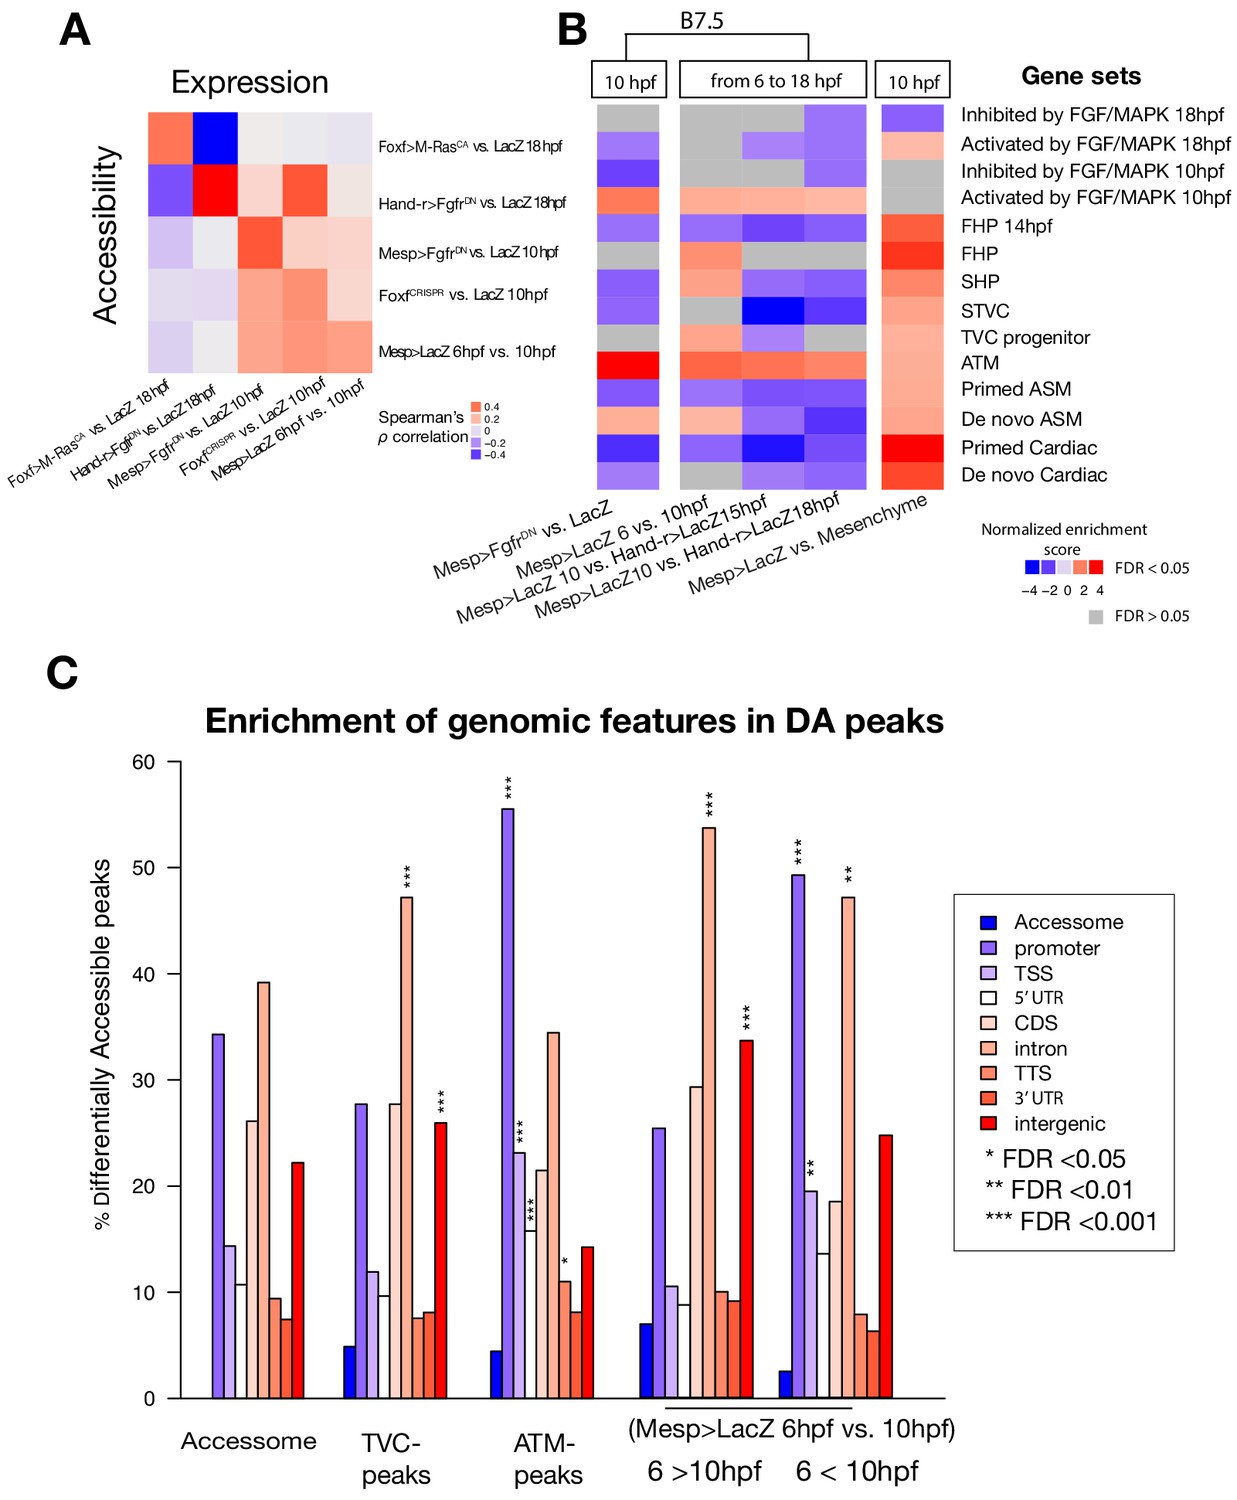
(A) Spearman correlation of expression of bulk RNA-seq or microarray (for B7.5 6 vs. 10 hpf and Mesp>FgfrDN vs. Mesp>LacZ - 10 hpf) pairwise comparisons with ATAC-seq pairwise comparisons. Correlation was calculated based on log2(FC) of differentially expressed genes associated with differentially accessible peaks for each comparison. Differentially expressed genes in Mesp>FgfrDN vs. Mesp>LacZ at 10 hpf derived from Christiaen et al. (2008), Hand-r>FgfrDN vs. Hand-r>LacZ and Foxf>M RasCA vs. Foxf>LacZ at 18 hpf from Wang et al. (2019), FoxfCRISPR vs. ControlCRISPR at 10 hpf from the present study. (B) GSEA for ATAC-seq pairwise comparisons. A negative normalized enrichment score (NES) indicates elements annotated to that gene set are less accessible in the comparison. A positive NES indicates elements annotated to that gene set are more accessible in the comparison. (C) One-tailed hypergeometric test for enrichment of accessible elements overlapping a genomic feature. The leftmost column shows the expected distribution of accessible elements from the accessome.
Figure 2—figure supplement 3
Peakshift validation of sgRNA efficiency.
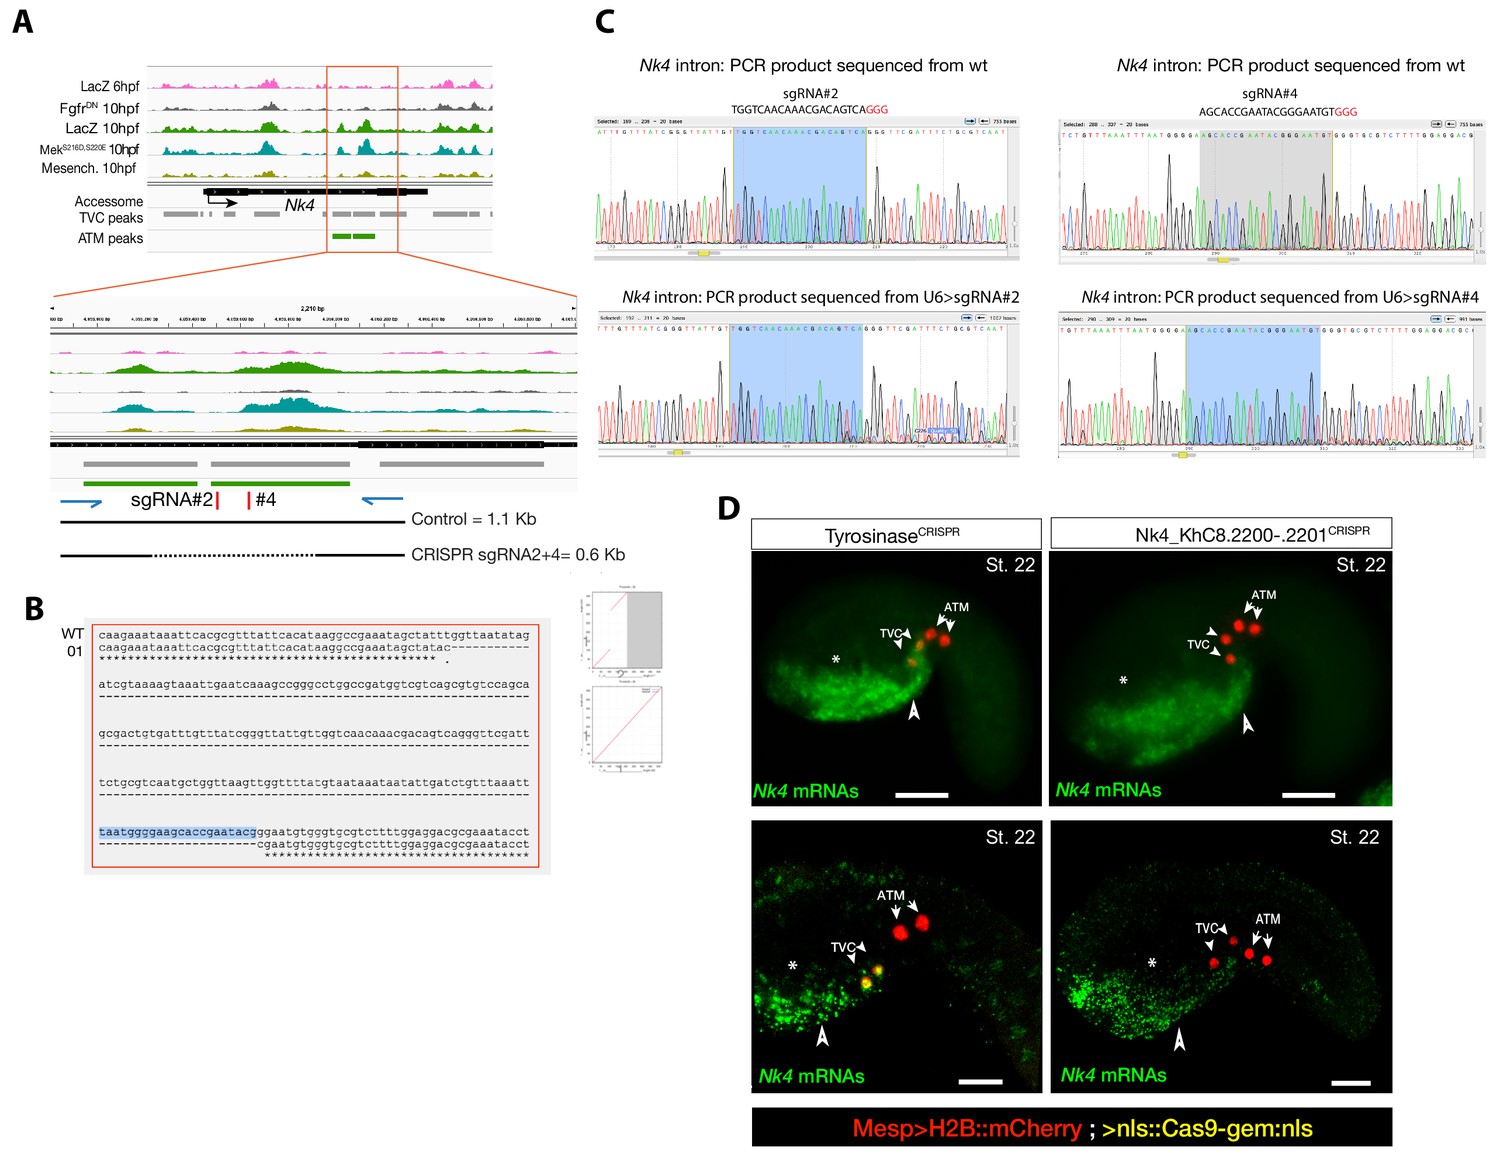
(A) Chromatin accessibility profiles from ATAC-seq (normalized by total sequencing depth). Transcript model is indicated as black bar. The newly identified TVC-specific enhancer is in boxed regions; in the zoom region, blue arrows indicate primers used to amplify the region between the target sites. In wild-type embryos, the resulting PCR product is ~1.1 kilobase pairs. The two single guide RNAs used to target Nk4/Nkx2-5 intronic element are in red. (B) Alignment of cloned PCR products amplified using the primers indicated in (A), from wild-type (wt) embryos, and from embryos electroporated with 25 µg Ef1α>nls::Cas9-gem::nls and 40 µg each of U6>sgRNA2 and U6>sgRNA4. Clone '01' contains a ~0.6 kilobase deletion between the approximate sites targeted by the two sgRNAs. (C) Quantification of indel-shifted electrophoresis chromatogram peaks (‘Peakshift’ assay; Gandhi et al., 2017) revealed sgRNA mutagenesis efficacies. (D) In situ hybridization for Nk4 (green) showing expression throughout the ventral head endoderm in embryos electroporated with Mesp>H2B::mCherry (red), Mesp>nls::Cas9-Gem::nls and U6>sgRNAs targeting Nk4 intron (Nk4_KhC8.2200-.2201CRISPR) or Tyrosinase (TyrosinaseCRISPR), used as control. In control embryos (panels on the left) Nk4 expression is essentially wild-type with a strong expression in ventral head endoderm (asterix and arrowhead) and TVCs. In Nk4_KhC8.2200-.2201CRISPR embryos (panels on the right) Nk4 expression is lost specifically in the B7.5 lineage and not in the other endogenous territories. Scale bars = 30 µm.
Figure 2—figure supplement 4
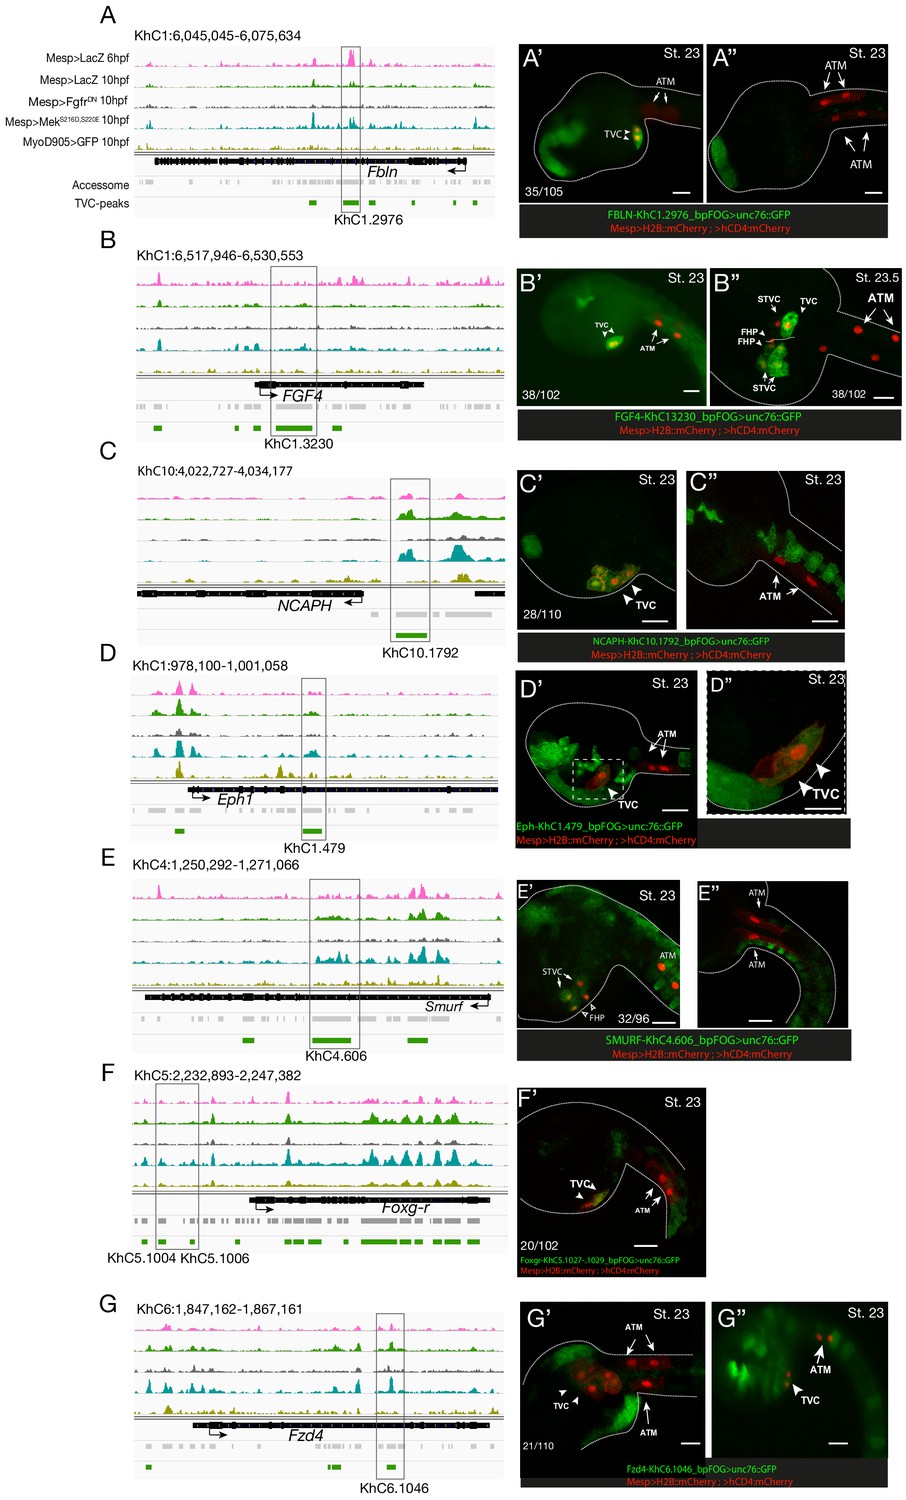
Candidate TVC-specific enhancers in vivo validation by reporter gene assay.
(A–G) ATAC-seq peaks specifically accessible in TVC displaying chromatin accessibility profiles from ATAC-seq (normalized by total sequencing depth). Transcript model is indicated as black bar. The newly identified enhancers are in boxed regions. ATAC-seq peaks were tested in vivo by reporter gene assay (see Supplementary file 4). (A’–G’’) Reporter gene assay in embryos at stage 23 (Hotta et al., 2007). GFP expression was detected specifically in TVC cells but not in ATMs. Nuclei of B7.5 lineage cells are labelled by Mesp>H2B::mCherry and Mesp>hCD4::mCherry (red). Numbers indicate observed/total of half-embryos scored. Scale bar = 30 μm.
Figure 2—figure supplement 5
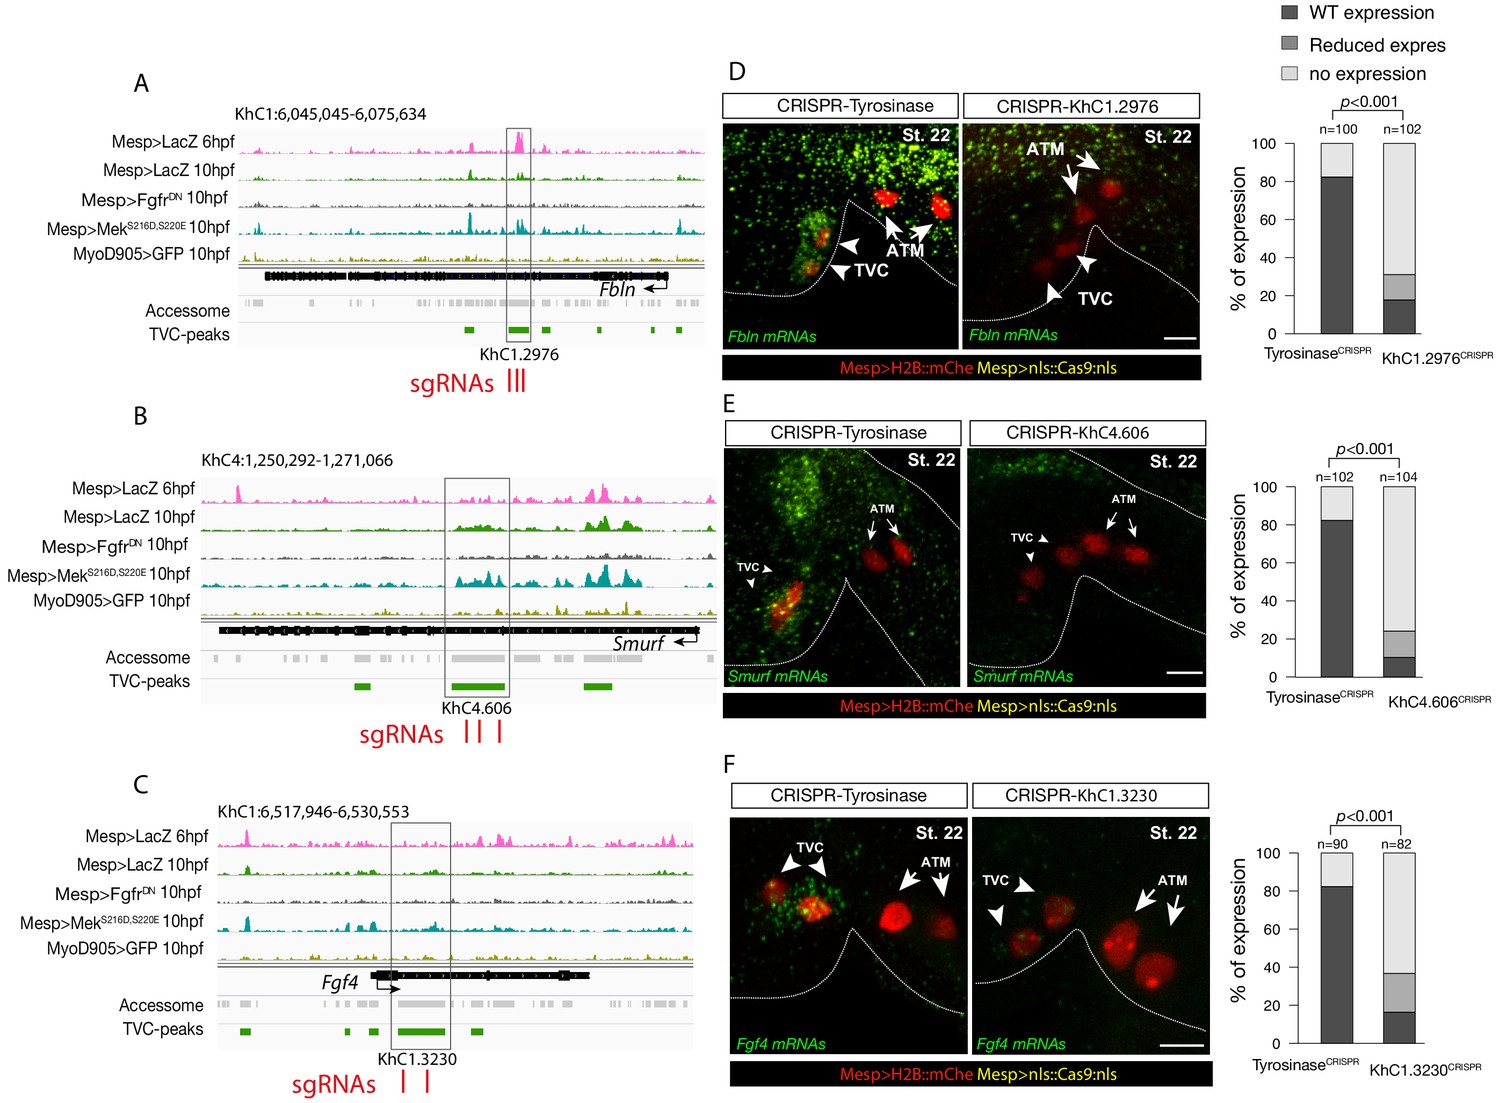
Candidate TVC-specific enhancers in vivo validation by CRISPR/Cas9.
(A–C) TVC-specific enhancers in Fbln, Smurf and Fgf4 loci targeted by two or three single guide RNA (sgRNAs) for CRISPR/Cas9-mediated deletions. Upper panel is showing chromatin accessibility profiles from ATAC-seq (normalized by total sequencing depth). Transcript model is indicated as black bar. (D–F) Endogenous expression of Fbln (D), Smurf (E) and Fgf4 (F) visualized by in situ (green) in TyrosinaseCRISPR (right panel) and upon CRISPR/Cas9-induced deletions of TVC-specific peaks (left panel). Nuclei of B7.5 lineage cells are labelled by Mesp>nls::LacZ and revealed with an anti beta-galactosidase antibody (red). Anterior to the left, stages indicated as 'st.'. Experiment performed in biological replicates. Scale bar = 20 μm. All the treatments were significant versus TyrosinaseCRISPR (Fisher exact test, p < 0.001); ‘n’: total numbers of embryos.
Figure 2—figure supplement 6
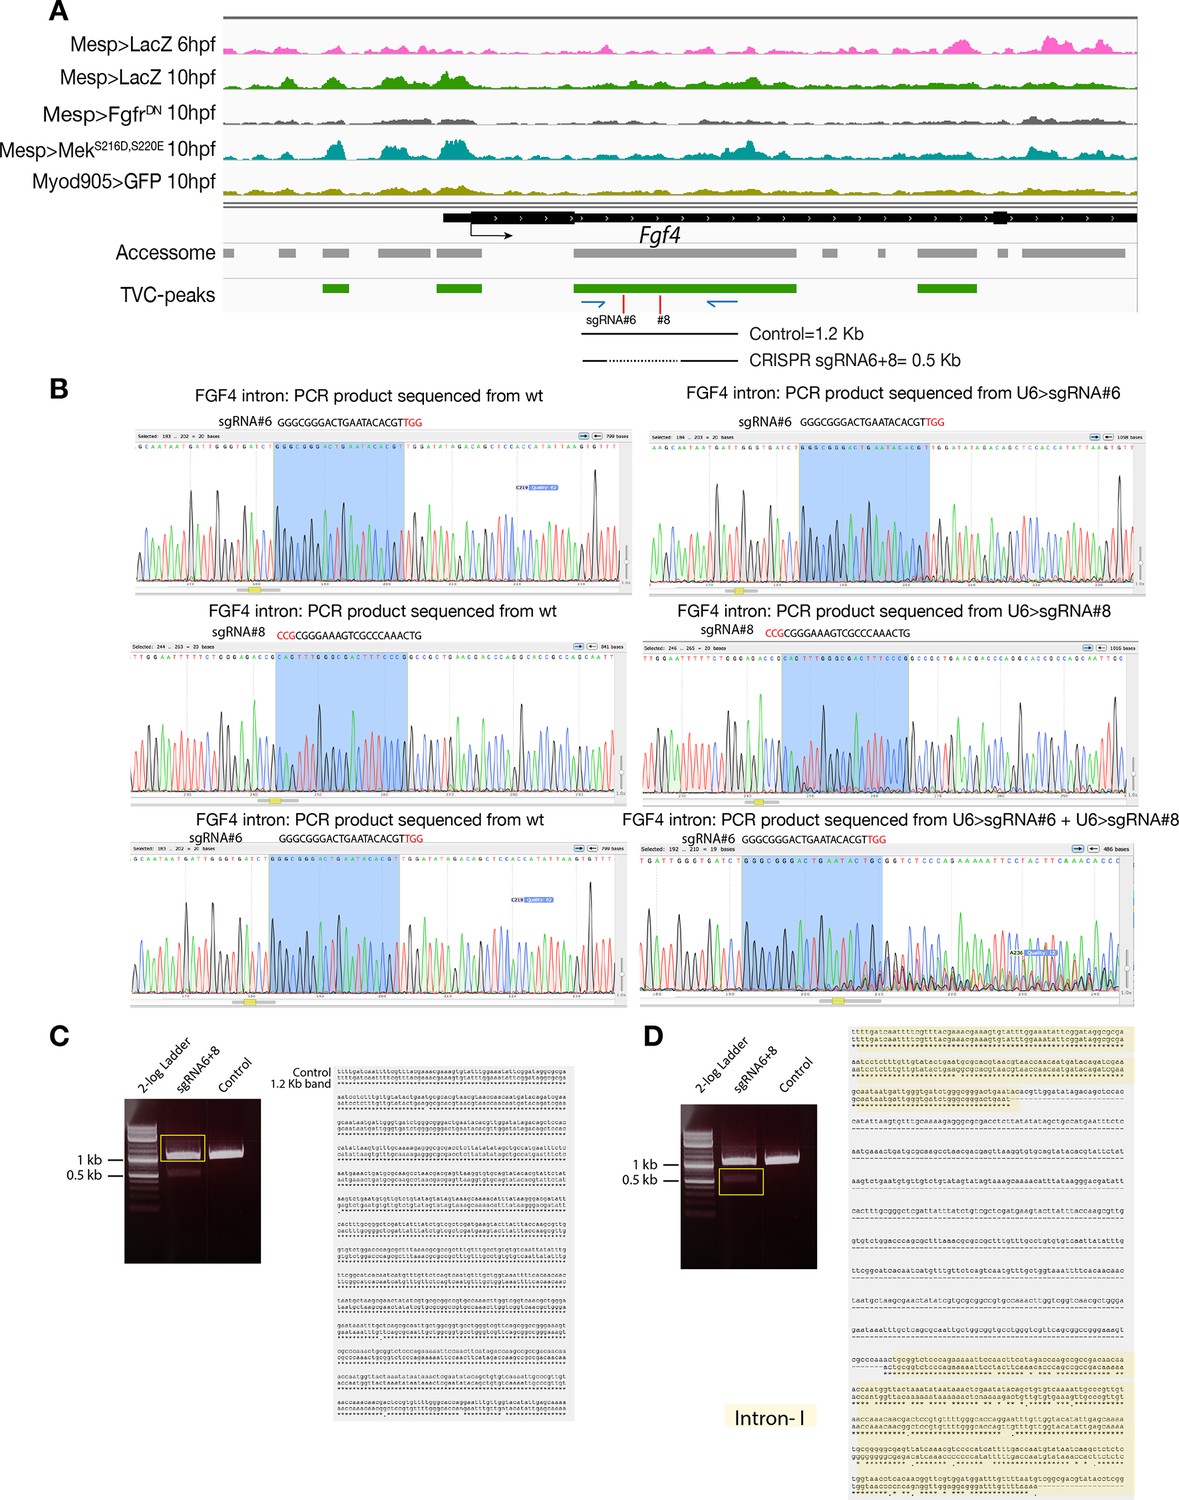
CRISPR validation on the TVC-specific Fgf4 enhancer.
(A) Chromatin accessibility profiles from ATAC-seq (normalized by total sequencing depth). Transcript model is indicated as black bar. The newly identified TVC-specific enhancer is in boxed regions; in the zoom region, blue arrows indicate primers used to amplify the region between the target sites. In wild-type embryos, the resulting PCR product is ~1.2 kilobase pairs. The two single guide RNAs used to target Fgf4 intronic element are in red. (B) Quantification of indel-shifted electrophoresis chromatogram peaks (‘Peakshift’ assay; Gandhi et al., 2017) revealed sgRNA mutagenesis efficacies. (C–D) 1% Agarose gel and alignment of cloned PCR products showing the result of Fgf4 intron-I amplification with the oligos indicated in (A) from embryos electroporated with 25 µg Ef1α>nls::Cas9-gem::nls and 40 µg each of U6>sgRNA6 and U6>sgRNA8. (C) Alignment of cloned PCR products amplified using the primers indicated in (A), from the ~1.2 kilobase band that is similar to the control. (D) Alignment of cloned PCR products amplified using the primers indicated in (A), from the ~0.5 kilobase band that corresponds to the expected deletion between the approximate sites targeted by the two sgRNAs. The intronic element that is excluded from the sites targeted by the two sgRNAs remained intact (yellow box).
Figure 3 with 7 supplements
Foxf is required for cardiopharyngeal-specific chromatin accessibility.
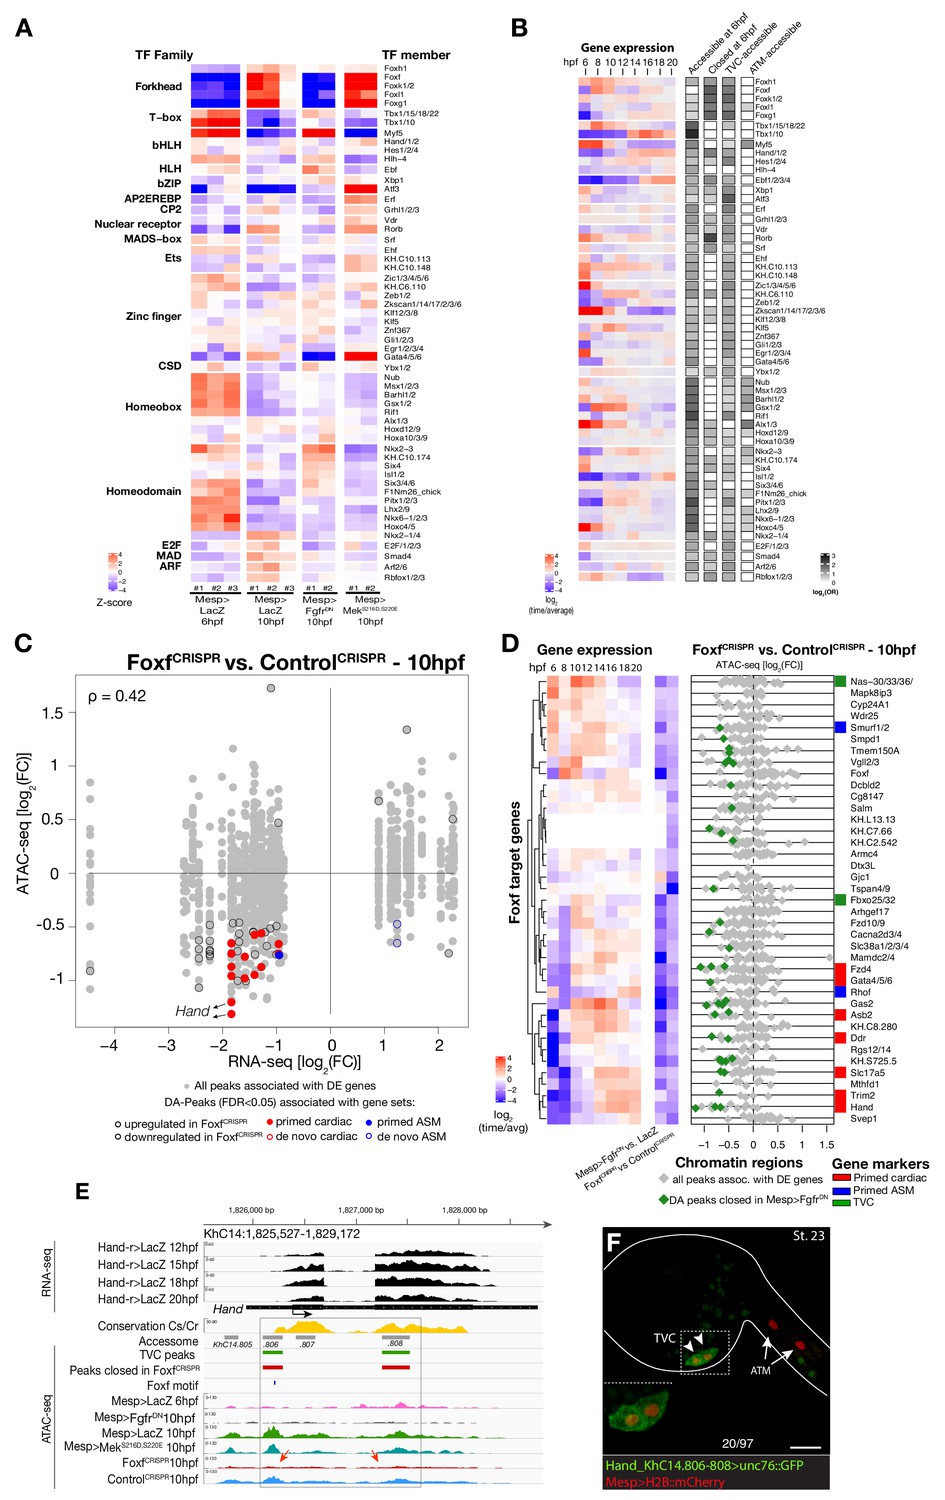
(A) Motif accessibility between libraries from chromVAR (Schep et al., 2017). Motifs were obtained and associated with Ciona transcription factors (TFs) as described in the Materials and methods. Deviations were computed for FGF signaling-dependent regions at 10 hpf and B7.5 replicates at 6 and 10 hpf. We calculated the differential accessibility of all motifs between conditions and time points. Only the most significant motif is shown for each TF. (B) Expression of transcription factors over time compared to enrichment of corresponding TF motifs in condition specific peak sets. log2(odds ratio) values (log2(OR), see Materials and methods) are shown for motifs that are significantly enriched in a peak set (one-tailed hypergeometric test, FDR < 0.05). Only TFs expressed in the B7.5 lineage are shown. (C) Differential expression of Foxf target genes (DE) vs. differential chromatin accessibility (DA) in FoxfCRISPR. ρ is the Spearman correlation of expression and accessibility for DA regions associated with DE genes. (D) Association between expression of Foxf target genes and accessibility of proximal regions which were both TVC-specific and closed in FoxfCRISPR as in Figure 2C. (E) A 3.6 kb region on chromosome 14 displaying expression profiles of RNA-seq and chromatin accessibility profiles of ATAC-seq normalized tag count. Foxf core binding site (GTAAACA) is displayed as blue line. The boxed region indicates a newly identified TVC-specific enhancer in Hand locus. Red arrow indicates a TVC-specific enhancer showing closed chromatin in FoxfCRISPR ATAC-seq. (F) Enhancer-driven in vivo reporter expression (green) of tested ATAC-seq peaks. TVCs marked with Mesp>H2B::mCherry (red). Numbers indicate observed/total of half-embryos scored. Experiment performed in biological replicates. Scale bar, 30 μm. Gene expression data for 6 hpf and ‘FGF-MAPK perturbation 10 hpf’ (Christiaen et al., 2008), and from 8 to 20 hpf (Razy-Krajka et al., 2014) were previously published.
Figure 3—figure supplement 1
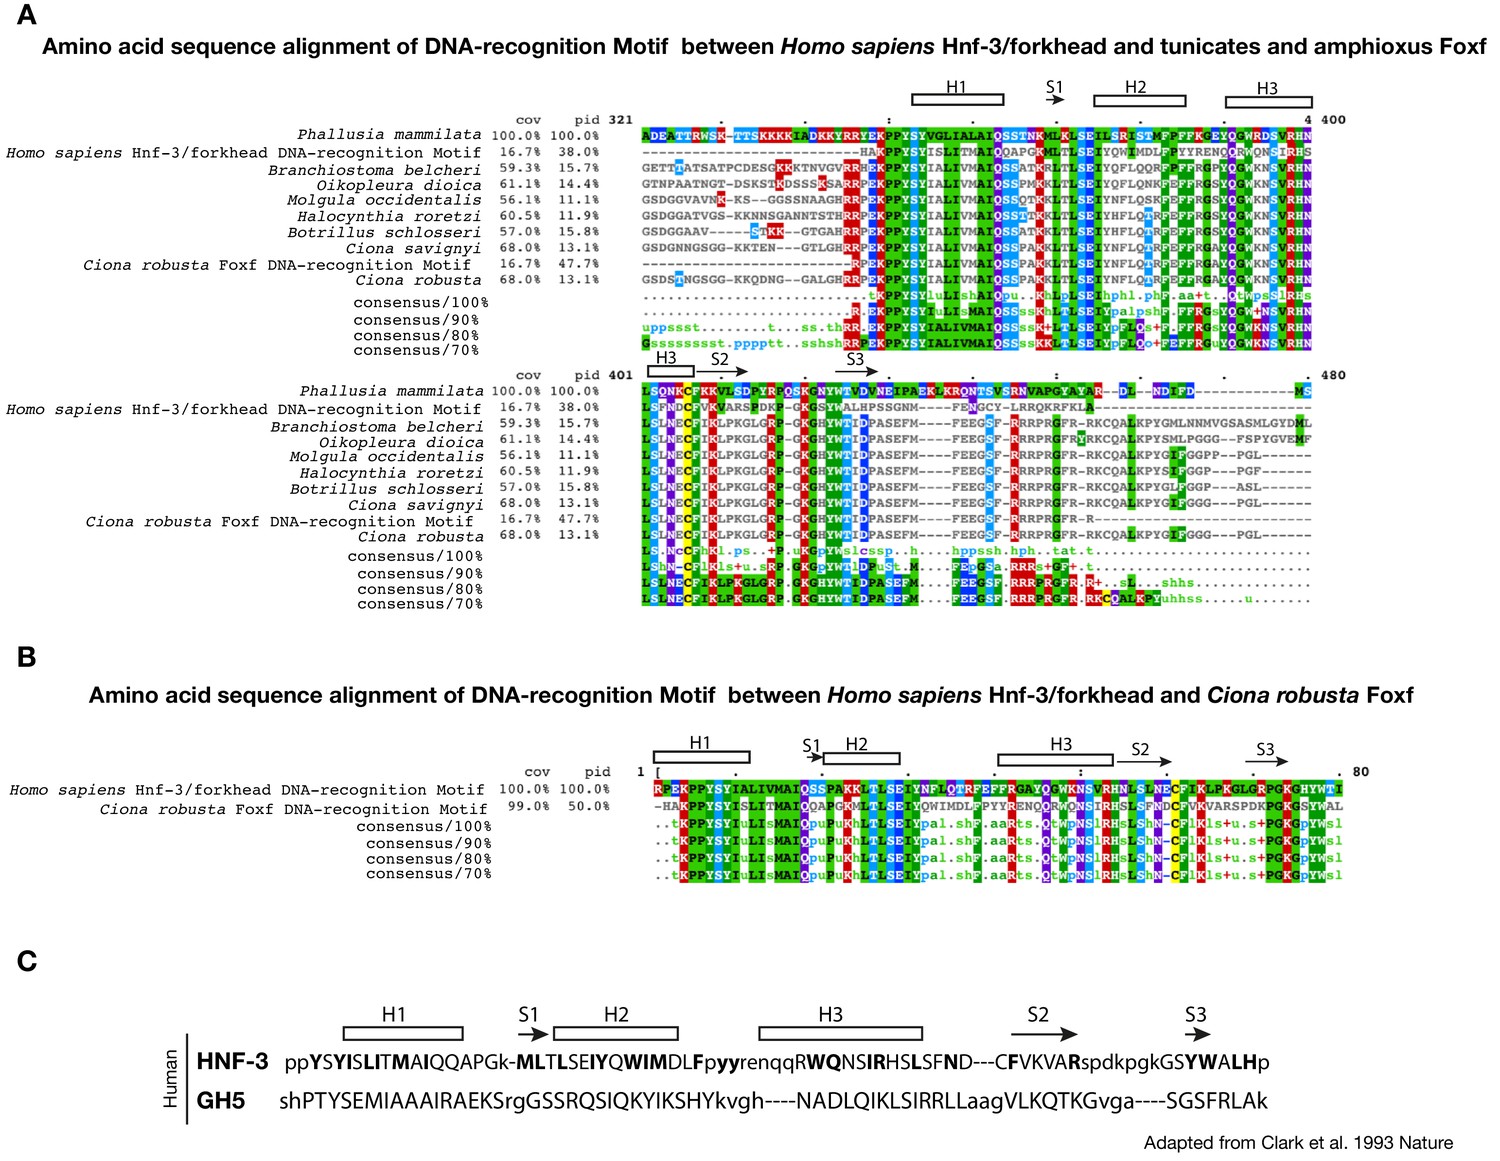
Conservation of DNA-recognition motifs of Foxf proteins.
(A) Conservation of DNA-recognition motifs among Homo sapiens Hnf-3/forkhead and tunicates and amphioxus Foxf proteins. The protein sequences were retrieved from NCBI (www.ncbi.nlm.nih.gov), Ensembl (www.ensembl.org) and Aniseed (www.aniseed.cnrs.fr/aniseed) databases using Foxf of Ciona robusta as query sequence (see Supplementary file 1). Alignment of conserved amino-acid residues in Foxf orthologues was obtained using Clustal Omega (MView algorithm) (McWilliam et al., 2013). (B) Amino acid sequence alignment of DNA-recognition motif between Homo sapiens Hnf-3/forkhead (AAT74628.1) and Ciona robusta Foxf (NP_001071710.1). Asterisks indicate the structurally equivalenced residues between HFN3γ and GH5 as in Clark et al. (1993). (C) Amino acid sequence alignment in HFN3γ (107-223) and GH5 based on structural alignment and secondary structural elements indicated as rectangle for ɑ-helices and arrows for β-strand (structurally equivalenced residues are indicated in upper case) adapted from Clark et al. (1993).
Figure 3—figure supplement 2
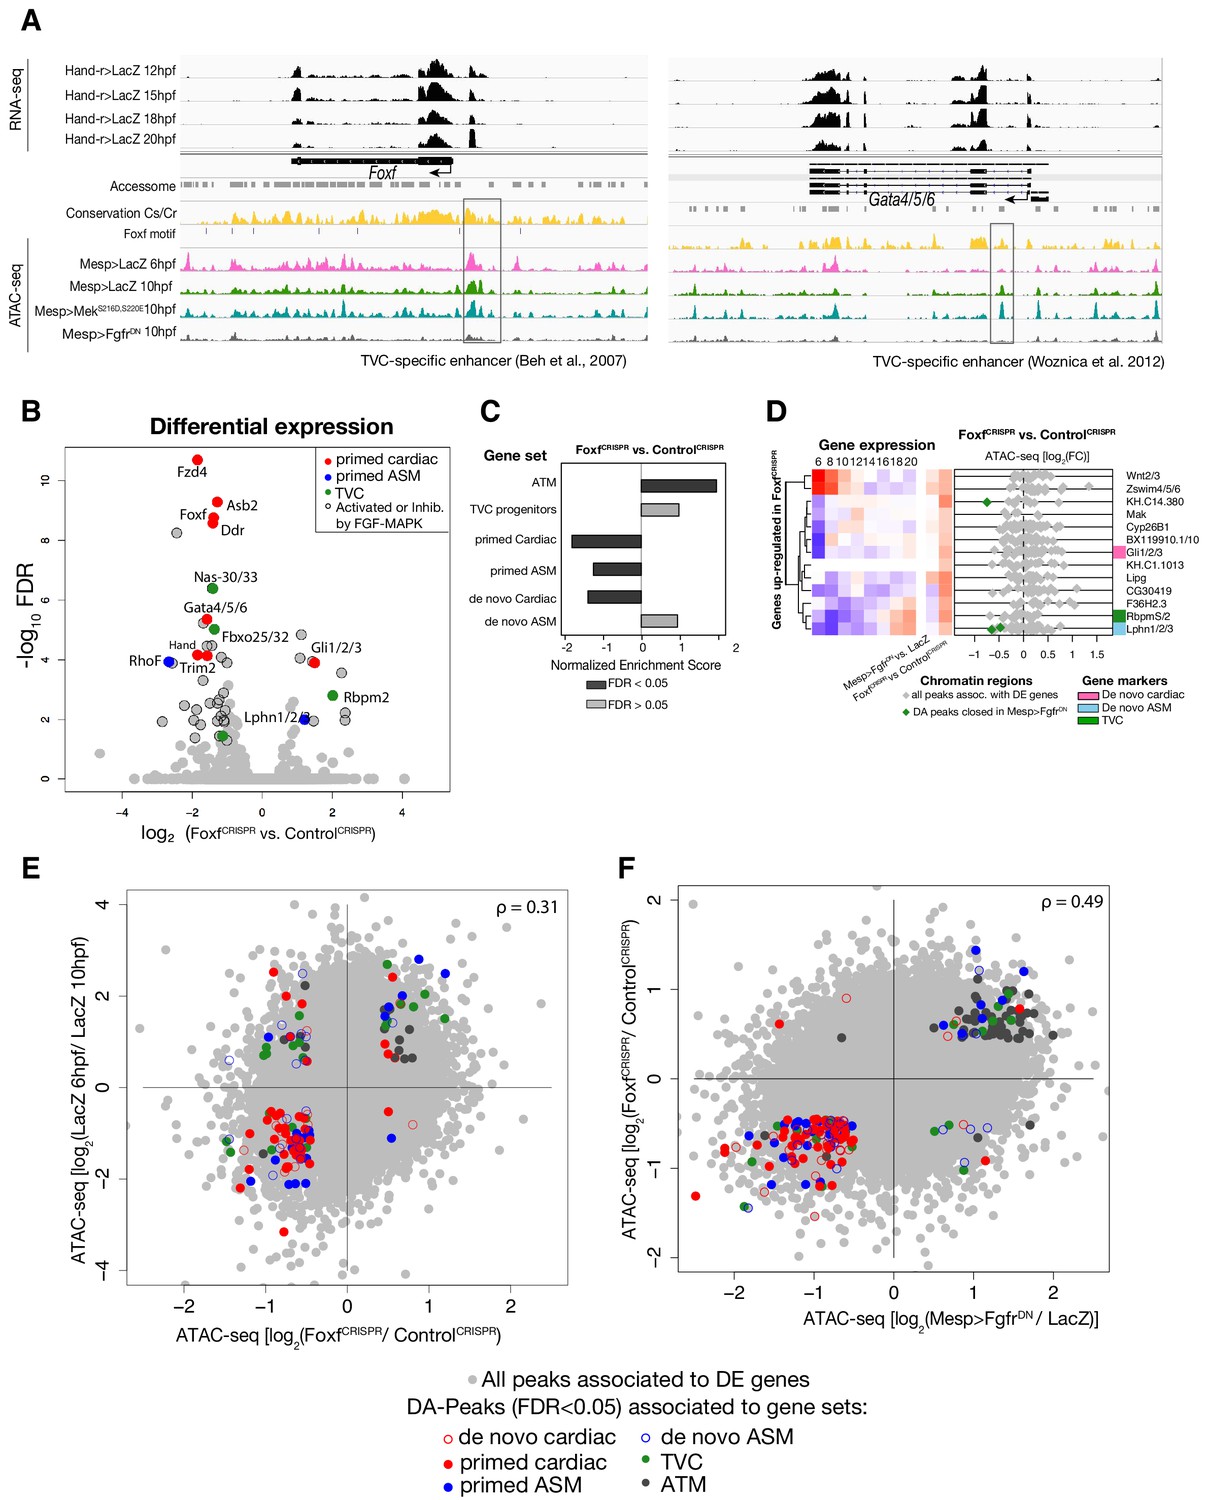
General characterization of FoxfCRISPR.
(A) ATAC-seq peaks displaying Foxf and Gata4/5/6 loci with expression profiles from RNA-seq and chromatin accessibility profiles from ATAC-seq (normalized by total sequencing depth). Known TVC-specific enhancers of Foxf (Beh et al., 2007) and Gata4/5/6 (Woznica et al., 2012) are in the boxed regions. (B) Differential gene expression determined by RNA-seq analysis of FoxfCRISPR vs. ControlCRISPR at 10 hpf. Colored dots represent genes that are differentially expressed (FDR < 0.05) in FoxfCRISPR vs. ControlCRISPR at 10 hpf. Genes not differentially expressed are shown in gray. (C) GSEA showing normalized enrichment score (NES) of gene sets in peaks ranked by difference in accessibility between FoxfCRISPR vs. ControlCRISPR at 10 hpf. Dark gray bars indicate significant enrichment. Light gray bars are not significant (FDR < 0.05). (D) Change in accessibility between ATAC-seq samples. Colored dots represent peaks associated with genes that are differentially accessible (FDR < 0.05 and |log2(FC)| > 0.5). (E) Association between expression and accessibility of Foxf up-regulated genes and peaks which were both closed in FoxfCRISPR and associated with TVC-specific peaks as in Figure 2C. Gene expression data for 6 hpf and ‘FGF-MAPK perturbation 10 hpf’ (Christiaen et al., 2008), and from 8 to 20 hpf (Razy-Krajka et al., 2014) were previously published.
Figure 3—figure supplement 3
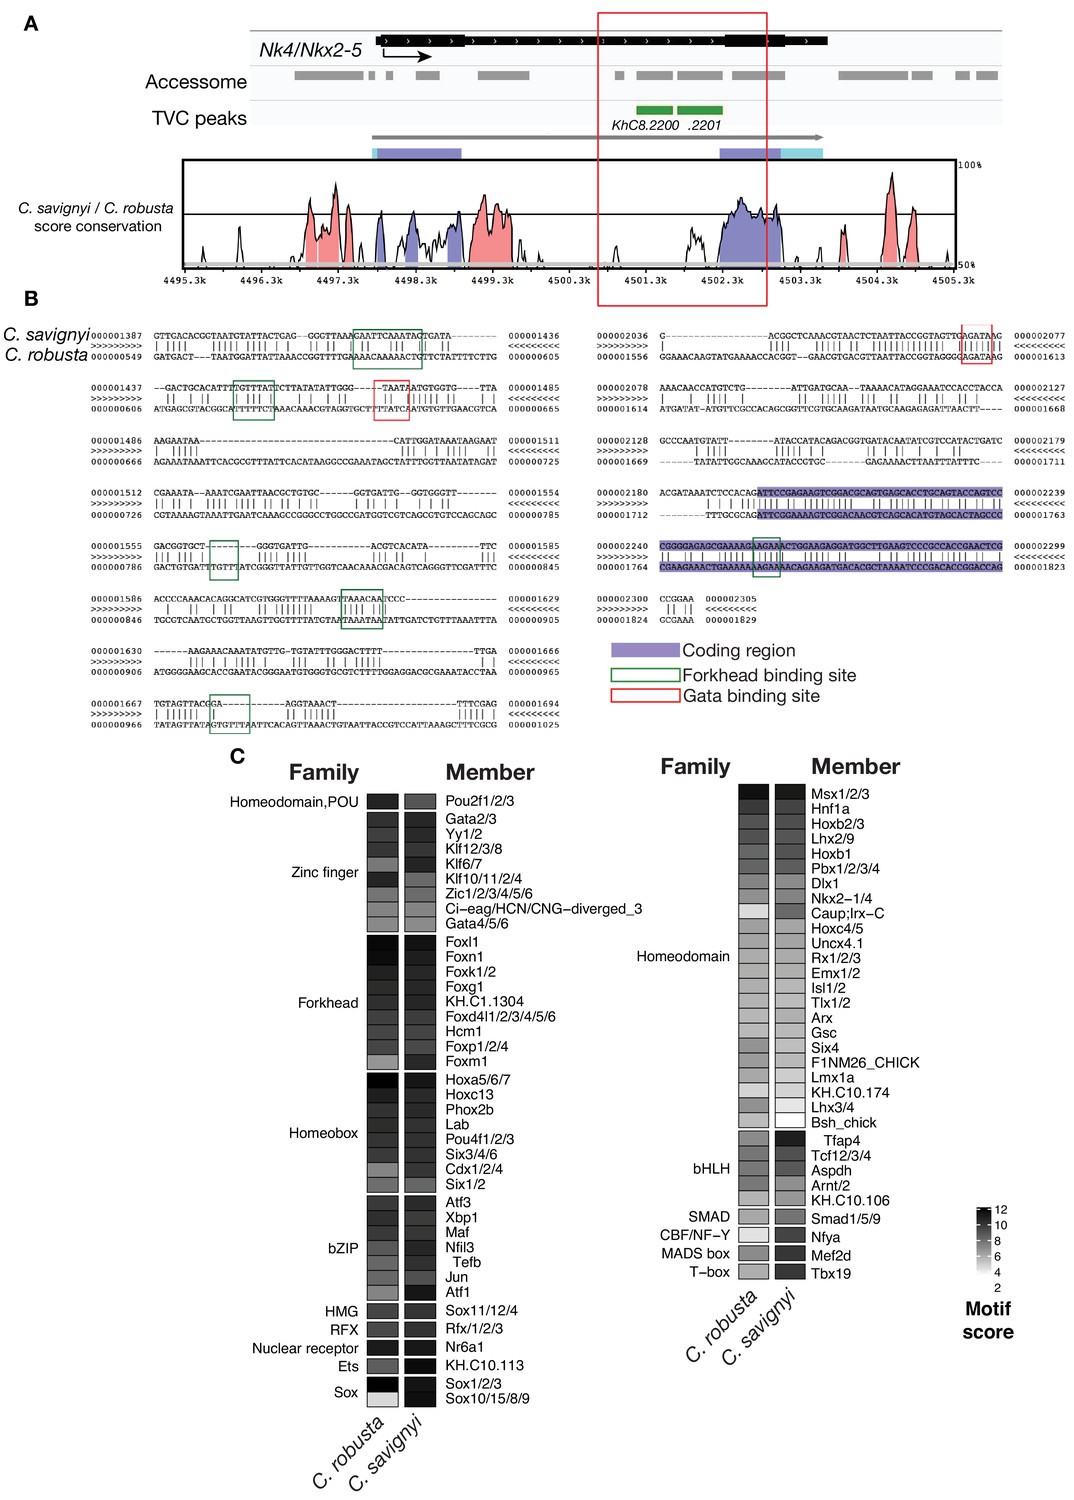
Conserved binding motifs in TVC-specific Nk4/Nkx2-5 enhancer.
(A) Conservation of TVC-accessible elements of Nk4/Nk2-5 locus between Ciona robusta and Ciona savignyi. The transcript model is shown in black. Conservation score was calculated using mVISTA (http://genome.lbl.gov/vista/mvista/submit.shtml). Pink peaks indicate conserved non-coding sequences (> 65% identity per 80 bp). (B) Alignment of DNA region corresponding to ‘KhC8.2201’ peak between Ciona savignyi and Ciona robusta (bottom sequence). Only the core nucleotides are shown for putative Forkhead and Gata binding sites. (C) Match scores for TF binding motifs present in the boxed region (~1.2 Kb) including the I-intronic element of both Ciona robusta and Ciona savignyi Nk4/Nk2-5 transcripts. Only the highest scoring match for each TF is shown.
Figure 3—figure supplement 4
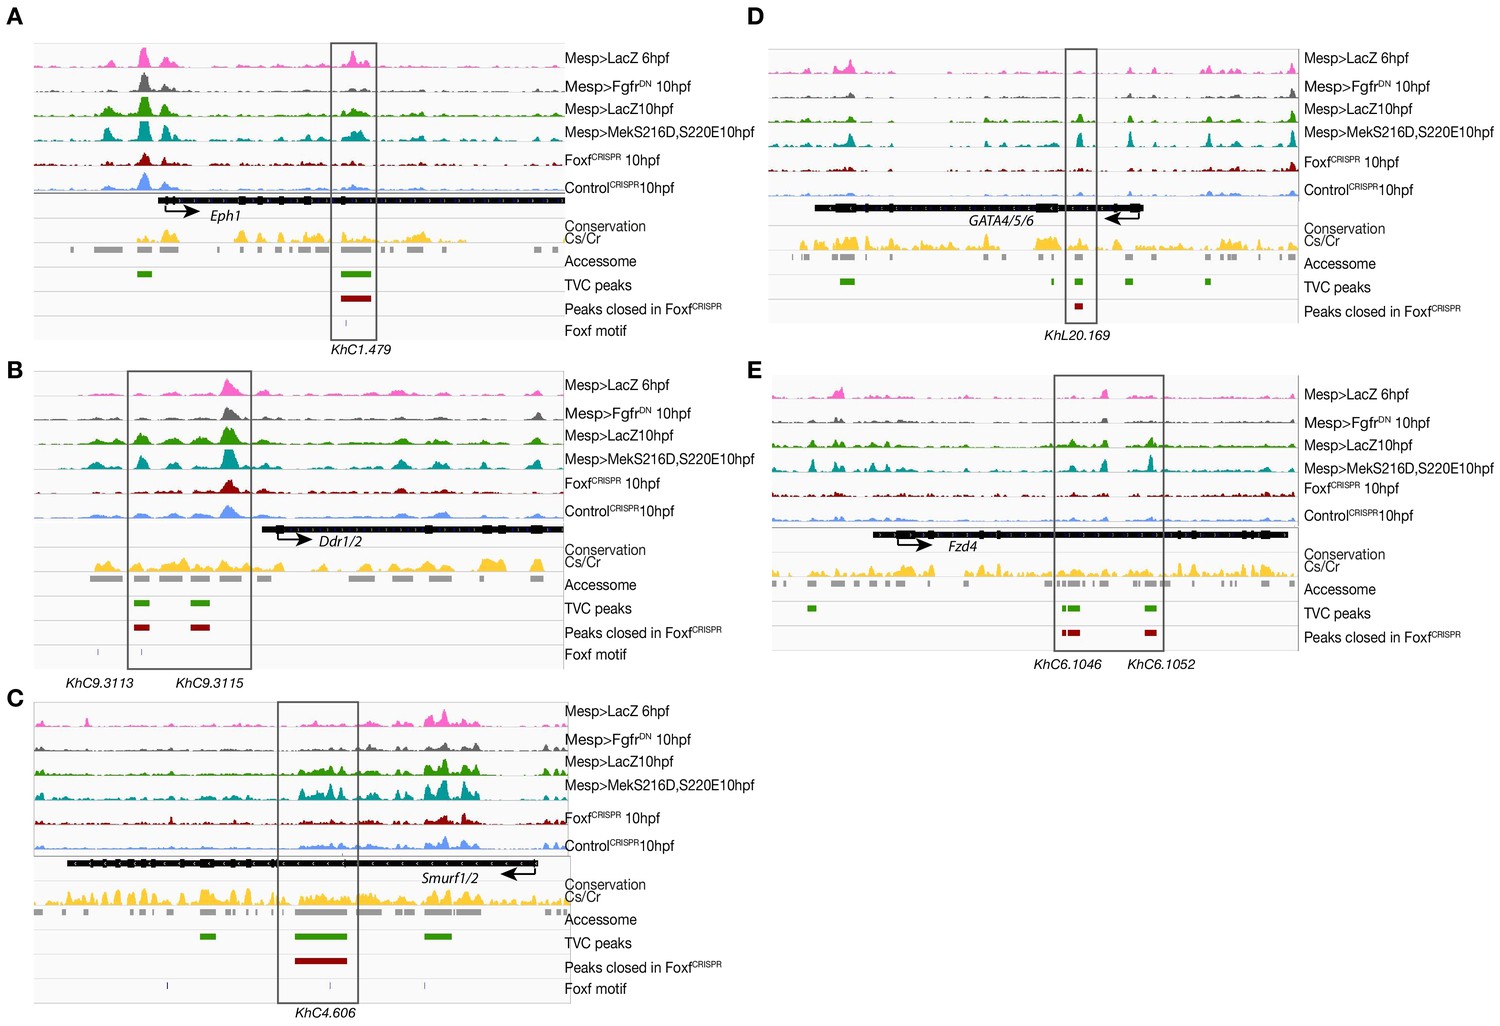
Foxf loss-of-function (FoxfCRISPR) caused closing of TVC-specific enhancers.
(A–E) Foxf target gene loci chromatin accessibility profiles showing ATAC-seq (normalized by total sequencing depth) in the indicated conditions. Foxf core binding sites (GTAAACA) are displayed as blue lines. The transcript model is shown in black.
Figure 3—figure supplement 5
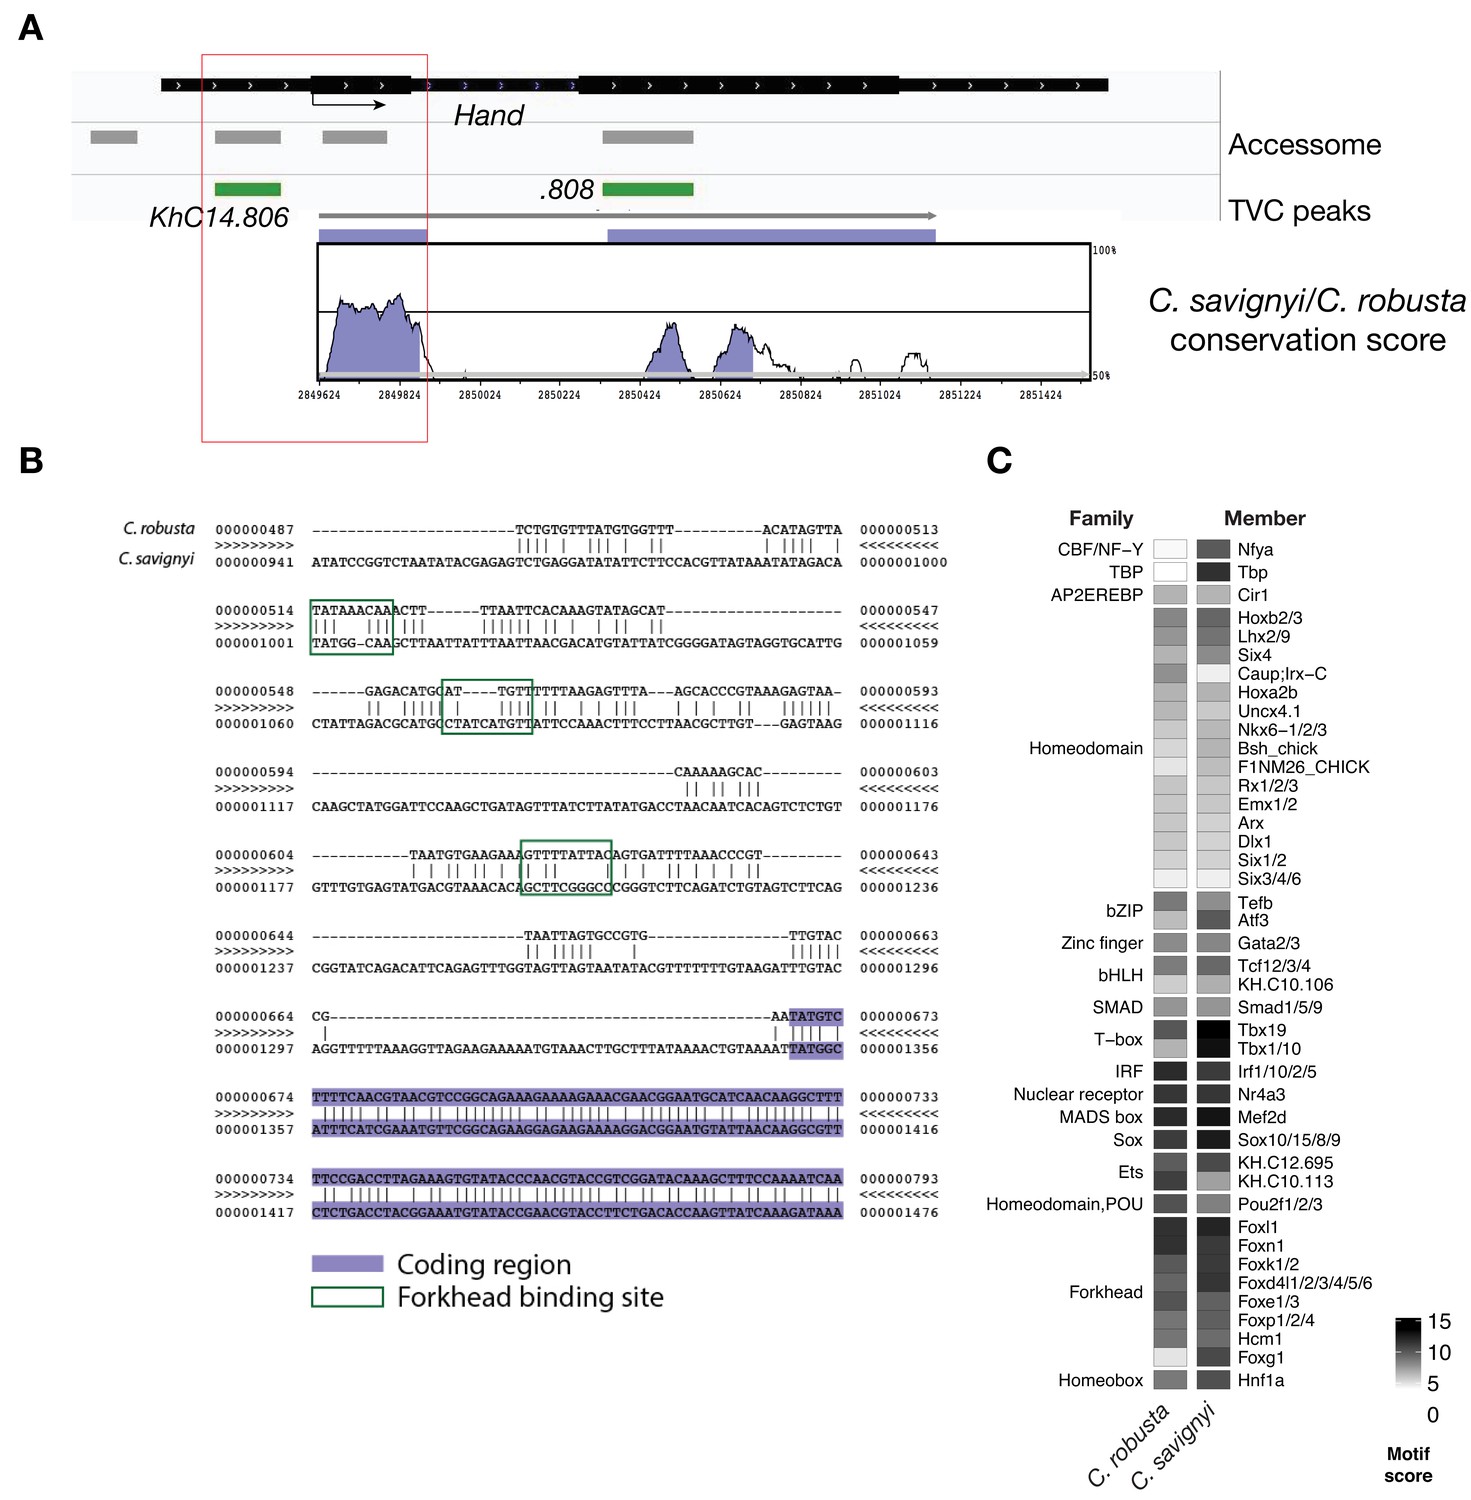
Conserved binding motifs in TVC-specific Hand enhancer.
(A) Conservation of TVC-accessible elements of Hand locus between Ciona robusta and Ciona savignyi. The transcript model is shown in black. Conservation score was calculated using mVISTA (http://genome.lbl.gov/vista/mvista/submit.shtml). Violet peaks indicate conserved sequences (> 65% identity per 80 bp). (B) Alignment of DNA region corresponding to ‘KhC14.806’ peak between Ciona robusta and Ciona savignyi (bottom sequence). Putative Forkhead binding sites are evidenced in green box (only the core nucleotides are shown). (C) Match scores for TF binding motifs present in the boxed region (~0.8 Kb) upstream of the coding ATG in both Ciona robusta and Ciona savignyi Hand transcripts. Only the highest scoring match is shown for each TF.
Figure 3—figure supplement 6
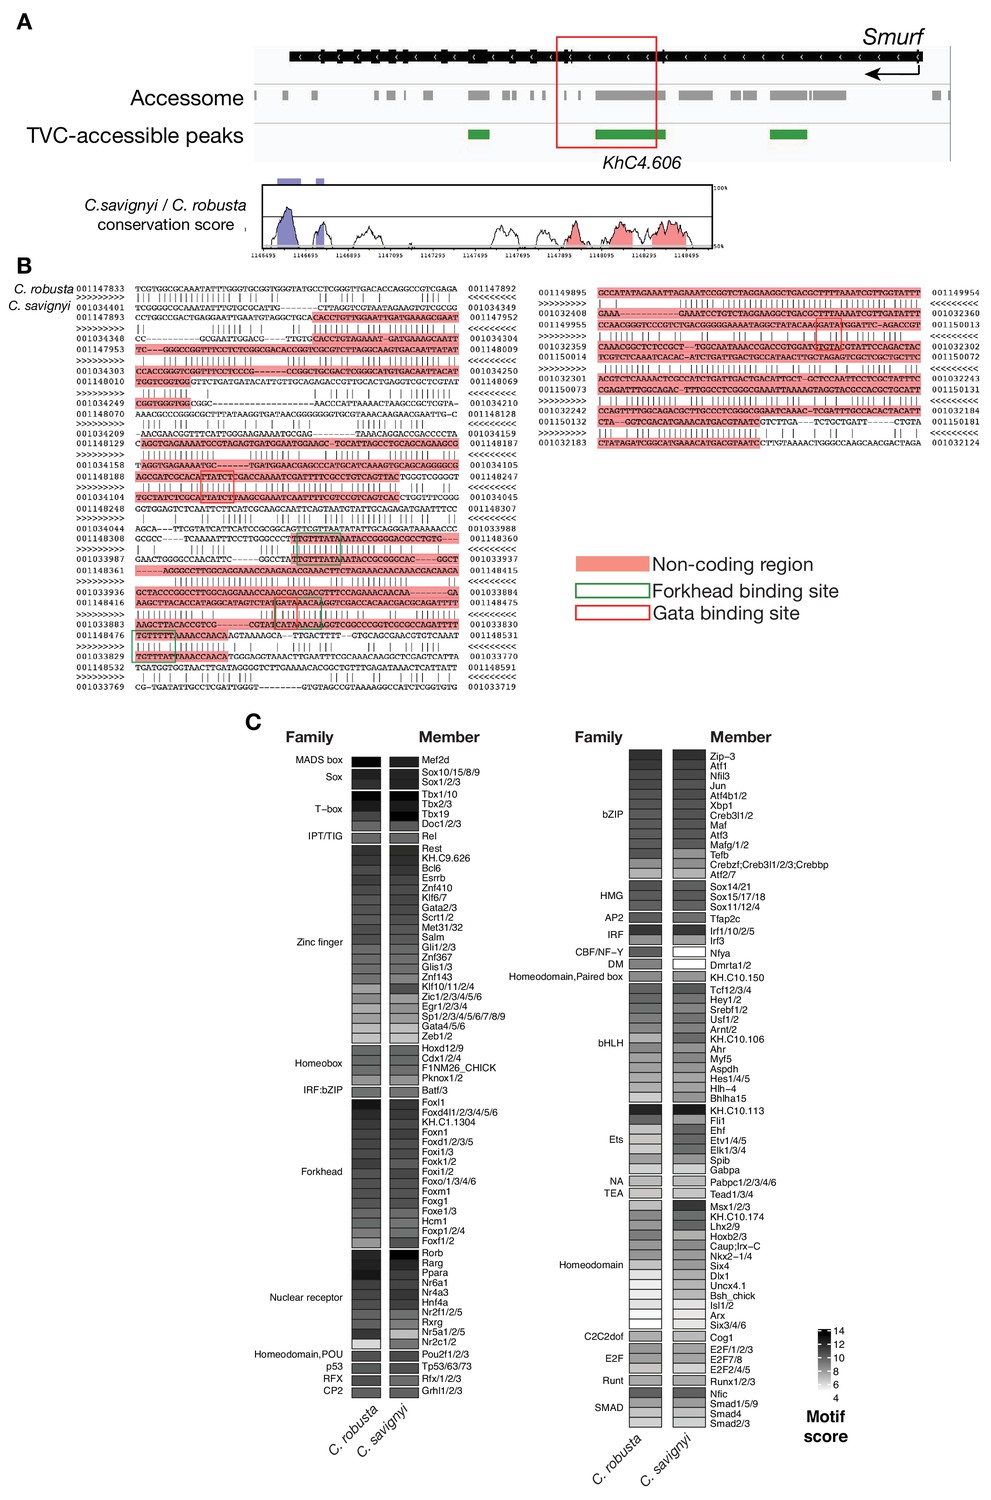
Conserved binding motifs in Smurf enhancer.
(A) Conservation of TVC-accessible elements of Smurf locus between Ciona robusta and Ciona savignyi. The transcript model is shown in black. Conservation score was calculated using mVISTA (http://genome.lbl.gov/vista/mvista/submit.shtml). Pink peaks indicate conserved non-coding sequences (> 65% identity per 80 bp). (B) Alignment of DNA region corresponding to ‘KhC4.606’ peak between Ciona robusta and Ciona savignyi (bottom sequence). Only the core nucleotides are shown for putative Forkhead and GATA binding sites. (C) Match scores for TF binding motifs present in the boxed region including the II-intronic element and exon III-IV of both Ciona robusta and Ciona savignyi Smurf transcripts. Only the highest scoring match is shown for each TF.
Figure 3—figure supplement 7
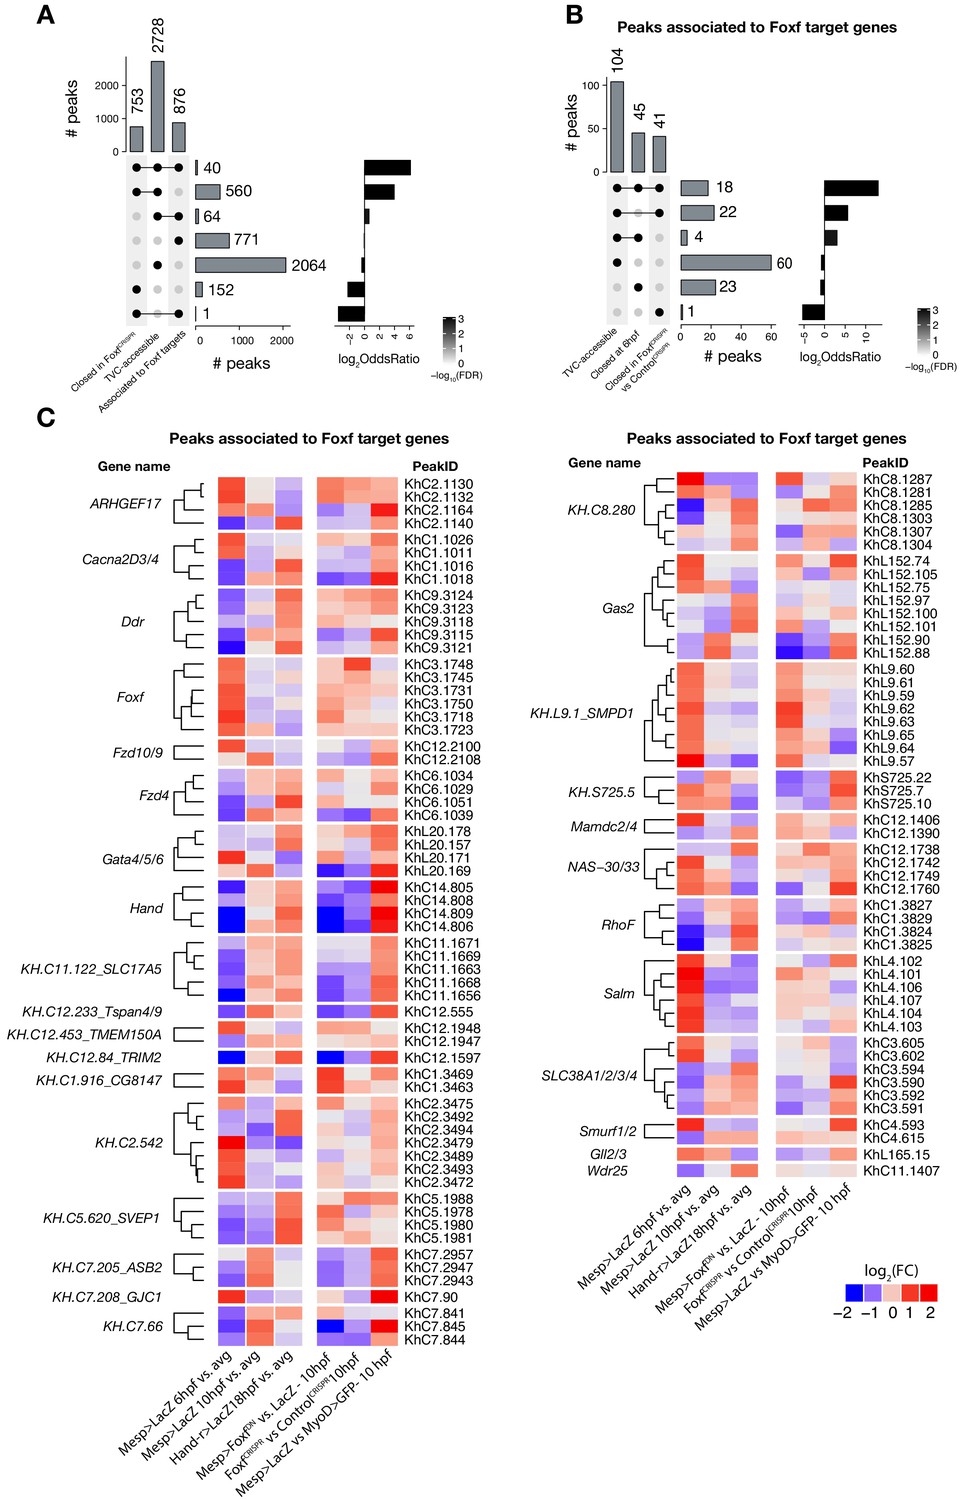
Accessible elements annotated to Foxf target genes.
(A) Intersection of elements associated with Foxf target genes at 10 hpf (see Material and methods) and differentially accessible elements. Peaks closed in FoxfCRISPR are peaks more accessible in ControlCRISPR vs. FoxfCRISPR at 10 hpf. A two-tailed binomial test was performed on each intersection against the null hypothesis that the intersection’s constituent sets are independent (see Statistics under Materials and methods). (B) Subset of (A) showing only elements associated with Foxf target genes. Peaks closed at 6 hpf are peaks more accessible in Mesp> LacZ 10 hpf vs. Mesp > LacZ 6 hpf. (C) ATAC-seq peaks (113 regions) associated with Foxf target genes showing differential accessibility (FDR < 0.05, see Material and methods) over time. The log2(FC)for each time point is versus the average (avg) of all control samples.
Figure 4 with 4 supplements
Cardiopharyngeal lineage-specific accessibility profiles and decoupling between enhancer accessibility and activity for de novo expressed genes.
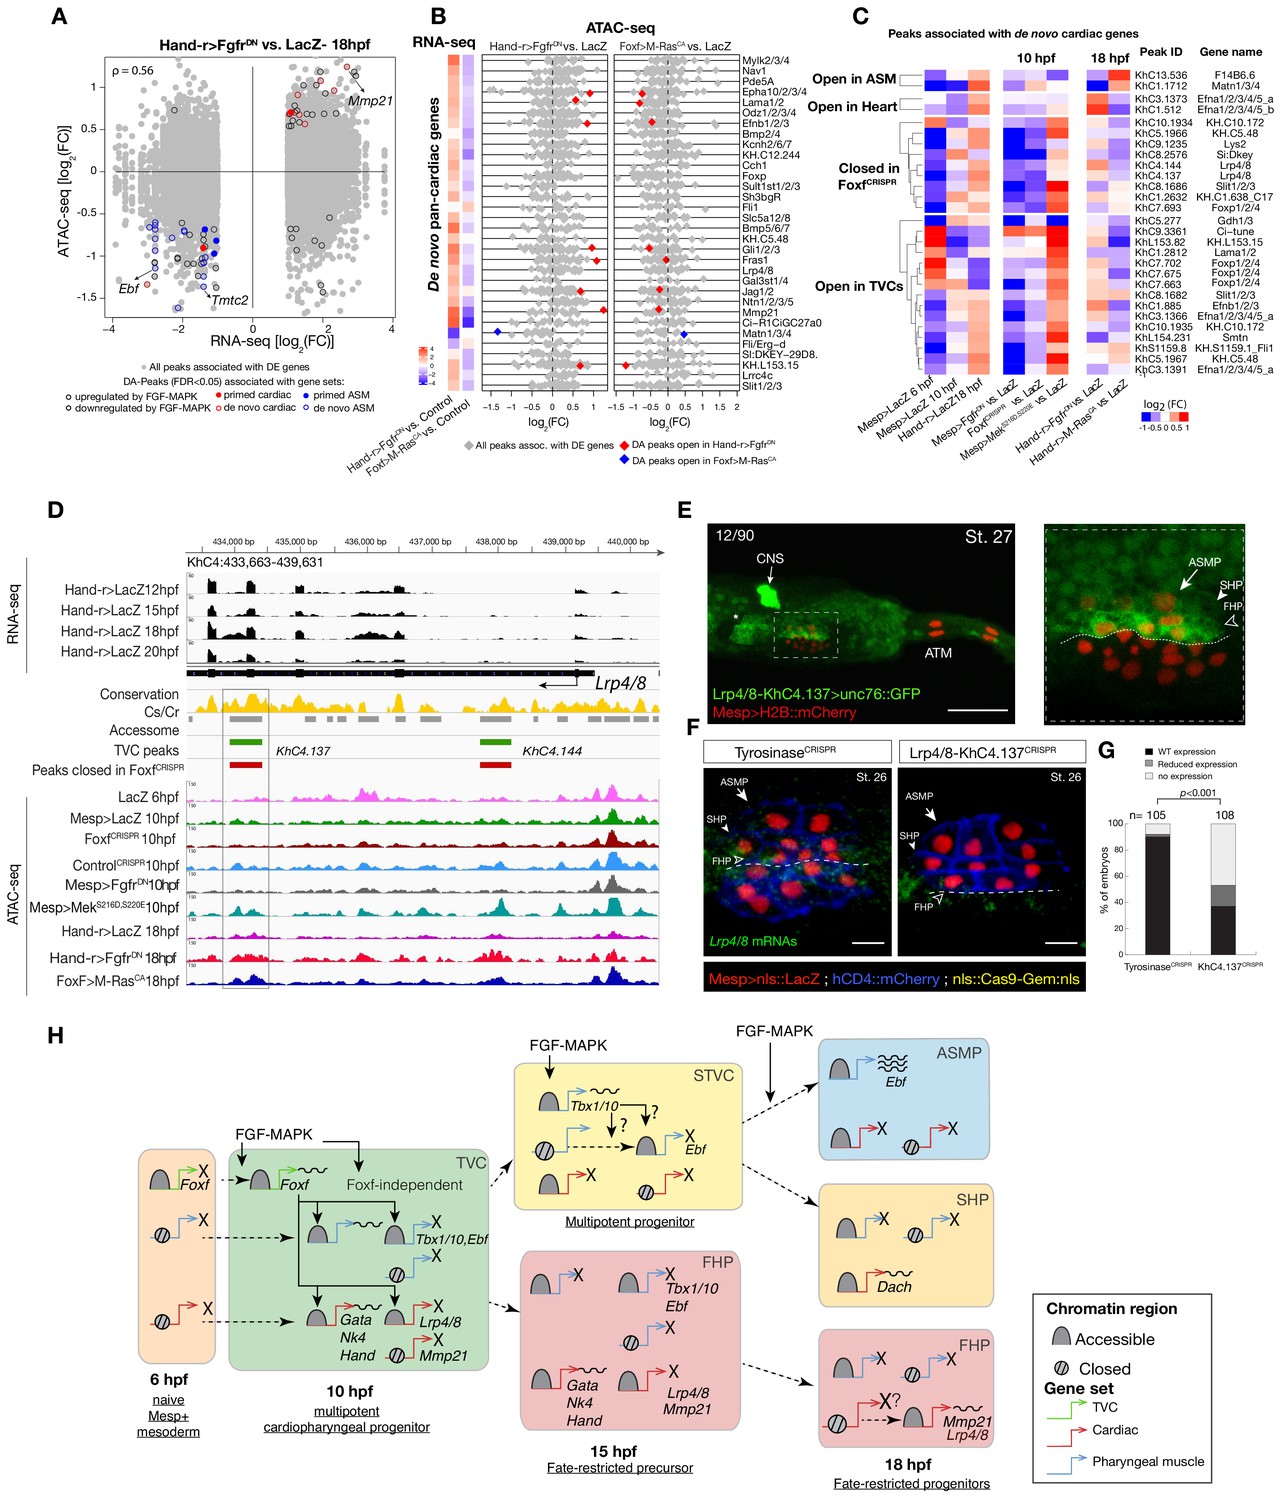
(A) Differentially expressed (DE) genes vs. differentially accessible (DA) peaks in response to FGF-MAPK perturbation in the fate-restricted cells. ρ is the Spearman correlation of expression and accessibility for DA peaks associated with DE genes. (B) Relationship between accessibility and expression of de novo pan-cardiac genes as in Figure 2C. DE genes in either condition are shown on the left. (C) Time-dependent ATAC-seq peaks associated with de novo expressed pan-cardiac genes. The accessibility of these peaks is shown for 6, 10 and 18 hpf vs. the average accessibility in the controls (LacZ) and upon FGF-MAPK perturbations at either 10 or 18 hpf. Peaks were classified as ‘Open in ASM’ (less accessible in FgfrDN vs. M-RasCA or LacZ at 18 hpf), ‘Open in Heart’ (less accessible in M-RasCAvs. FgfrDNor LacZ at 18 hpf), ‘Closed in FoxfCRISPR’ (less accessible in FoxfCRISPR vs. ControlCRISPR), or ‘Open in TVC’ (less accessible in FgfrDN vs. MekS216D,S220E or LacZ at 10 hpf). Only regions changing accessibility between 6 and 10 hpf, or 10 and 18 hpf are shown. (D) A 6 kb region on chromosome four displaying expression profiles of RNA-seq and chromatin accessibility profiles of ATAC-seq normalized tag count. Peak ID refers to elements tested for reporter assay in vivo. The newly identified enhancer in Lrp4/8 locus is in the boxed region. (E) Enhancer-driven in vivo reporter expression (green) of tested ‘KhC4.137’ peak. TVCs marked with Mesp>H2B::mCherry (red). Numbers indicate observed/total of half-embryo scored. Zoom on cardiopharyngeal cell lineage (panel on the right). (F) Endogenous expression of Lrp4/8 visualized by in situ (green) in TyrosinaseCRISPR and upon CRISPR/Cas9-induced deletion of ATAC-seq peaks. Nuclei of B7.5 lineage cells are labelled by Mesp>nls::LacZ and revealed with an anti beta-galactosidase antibody (red). Mesp-driven hCD4::mCherry accumulates at the cell membrane as revealed by anti mCherry antibody (Blue). Experiment performed in biological replicates. Scale bar = 10 μm. (G) Fisher exact test; n is the total number of individual embryo halves scored per condition. (H) Summary model: patterns of chromatin accessibility dynamics and gene expression during early cardiopharyngeal fate specification.
Figure 4—figure supplement 1
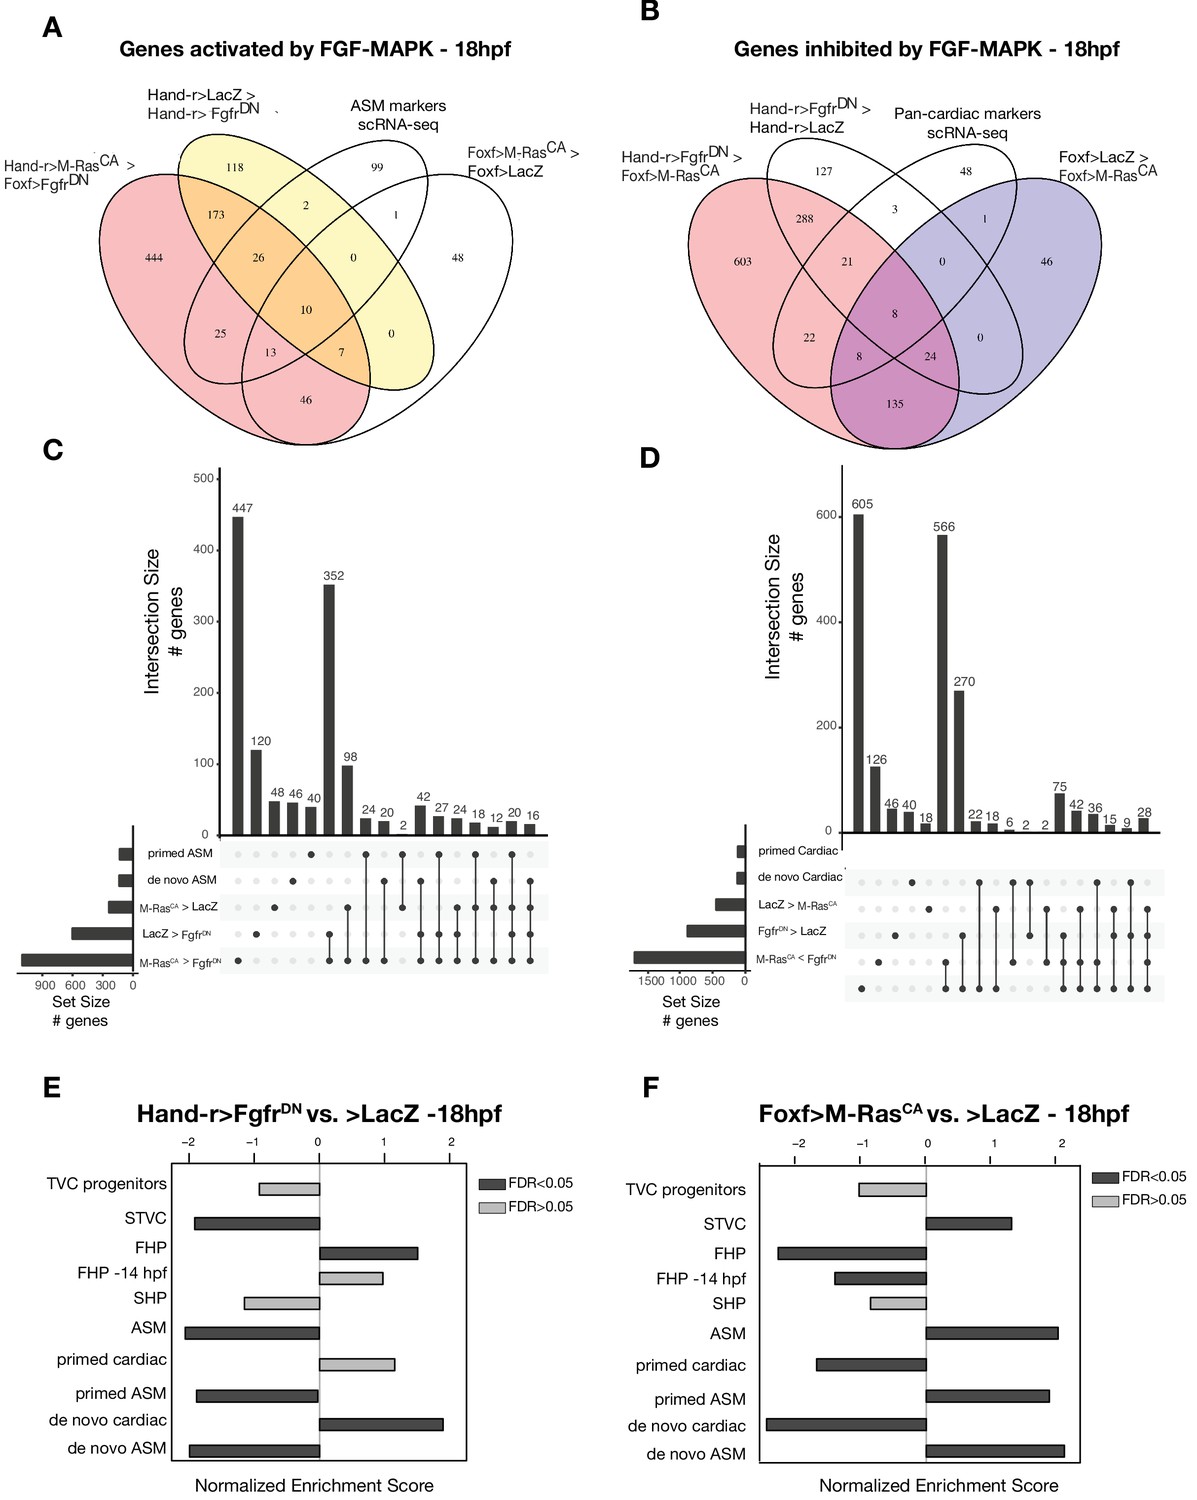
General characterization of FGF-MAPK perturbation.
(A–D) Intersections of differentially expressed genes from bulk RNA-seq and scRNA-seq (Wang et al., 2019) comparisons in cardiopharyngeal restricted cells using Venn Diagram (A–B) and UpSet plots (C–D). FGF-MAPK activated genes at 18 hpf are defined as the intersection of genes downregulated in FgfrDN vs. LacZ at 18 hpf and genes downregulated in FgfrDNvs. M-RasCA at 18 hpf (A). FGF-MAPK inhibited genes at 18 hpf are defined as the intersection of genes downregulated in M-RasCA vs. LacZ at 18 hpf and genes downregulated in M-RasCA vs. FgfrDN at 18 hpf (FDR < 0.05 and |log2(FC)| > 1). (E–F) GSEA of significantly enriched gene sets shows opposite trends in FgfrDN vs. control and M-RasCAvs. control (LacZ). Dark gray bars indicate significant enrichment. Light gray bars are not significant (FDR < 0.05).
Figure 4—figure supplement 2
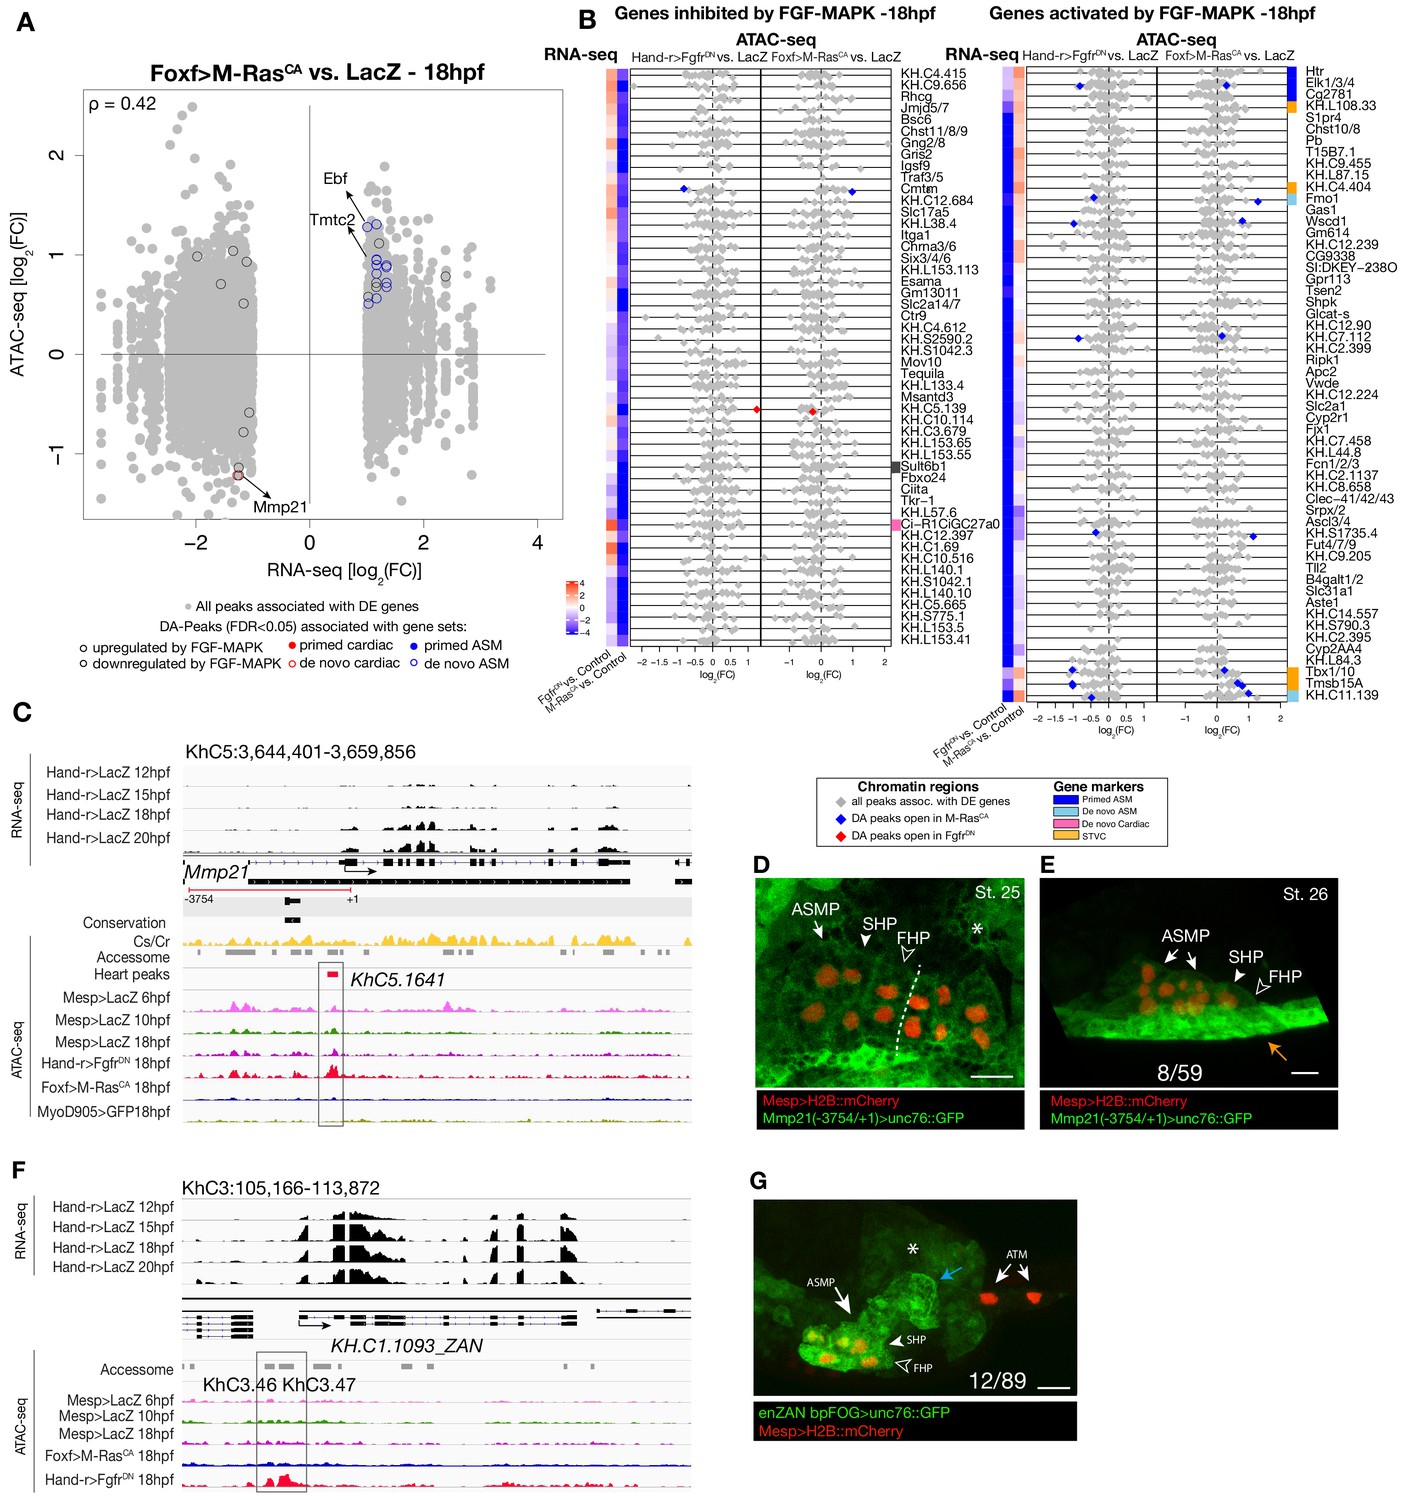
Differential accessibility in response to FGF/MAPK perturbation at 18 hpf.
(A) Differentially expressed (DE) genes vs. differentially accessible (DA) peaks using bulk RNA-seq and ATAC-seq in Foxf>M RasCA vs. LacZ at 18 hpf. (B) Relationship between expression and accessibility of DE genes associated with DA peaks. The top axis shows the scale for log2(FC) of bulk RNA-seq (black dots). The bottom axis shows the log2(FC) scale for ATAC-seq (colored diamonds). Top 50 genes inhibited and activated by FGF-MAPK (based on log2(FC)) along with STVC genes. Heatmaps show gene expression over time. (C) A 15 kb region on chromosome five displaying expression profiles from RNA-seq and chromatin accessibility profiles from ATAC-seq (normalized by total sequencing depth). Transcript model is indicated as black bars, percentage of conservation score between C. savignyi and C. robusta obtained obtained from WASHU browser (Brozovic et al., 2018) (yellow peaks), accessome (light grey bars), TVC- (green bar) and ATM-specific peaks (dark gray bars). Peak accessible specifically in the heart (KhC5.1641) of Mmp21 locus is in the boxed region. (D–E) Enhancer-driven in vivo reporter expression (green) of a ~ 3 kb region upstream the coding ATG and including the DA peak (KhC5.1641). (D) dorsal view, (E) lateral view; GFP is detected in the mesenchyme (asterisk) surrounding the cardiopharyngeal progenitors (D) and in the epidermis (orange arrow) (E). B7.5 cells are marked with Mesp>H2B::mCherry (red). Dotted line: ventral midline. Numbers indicate observed/total of half-embryos scored. Scale bar = 25 µm.
Figure 4—figure supplement 3
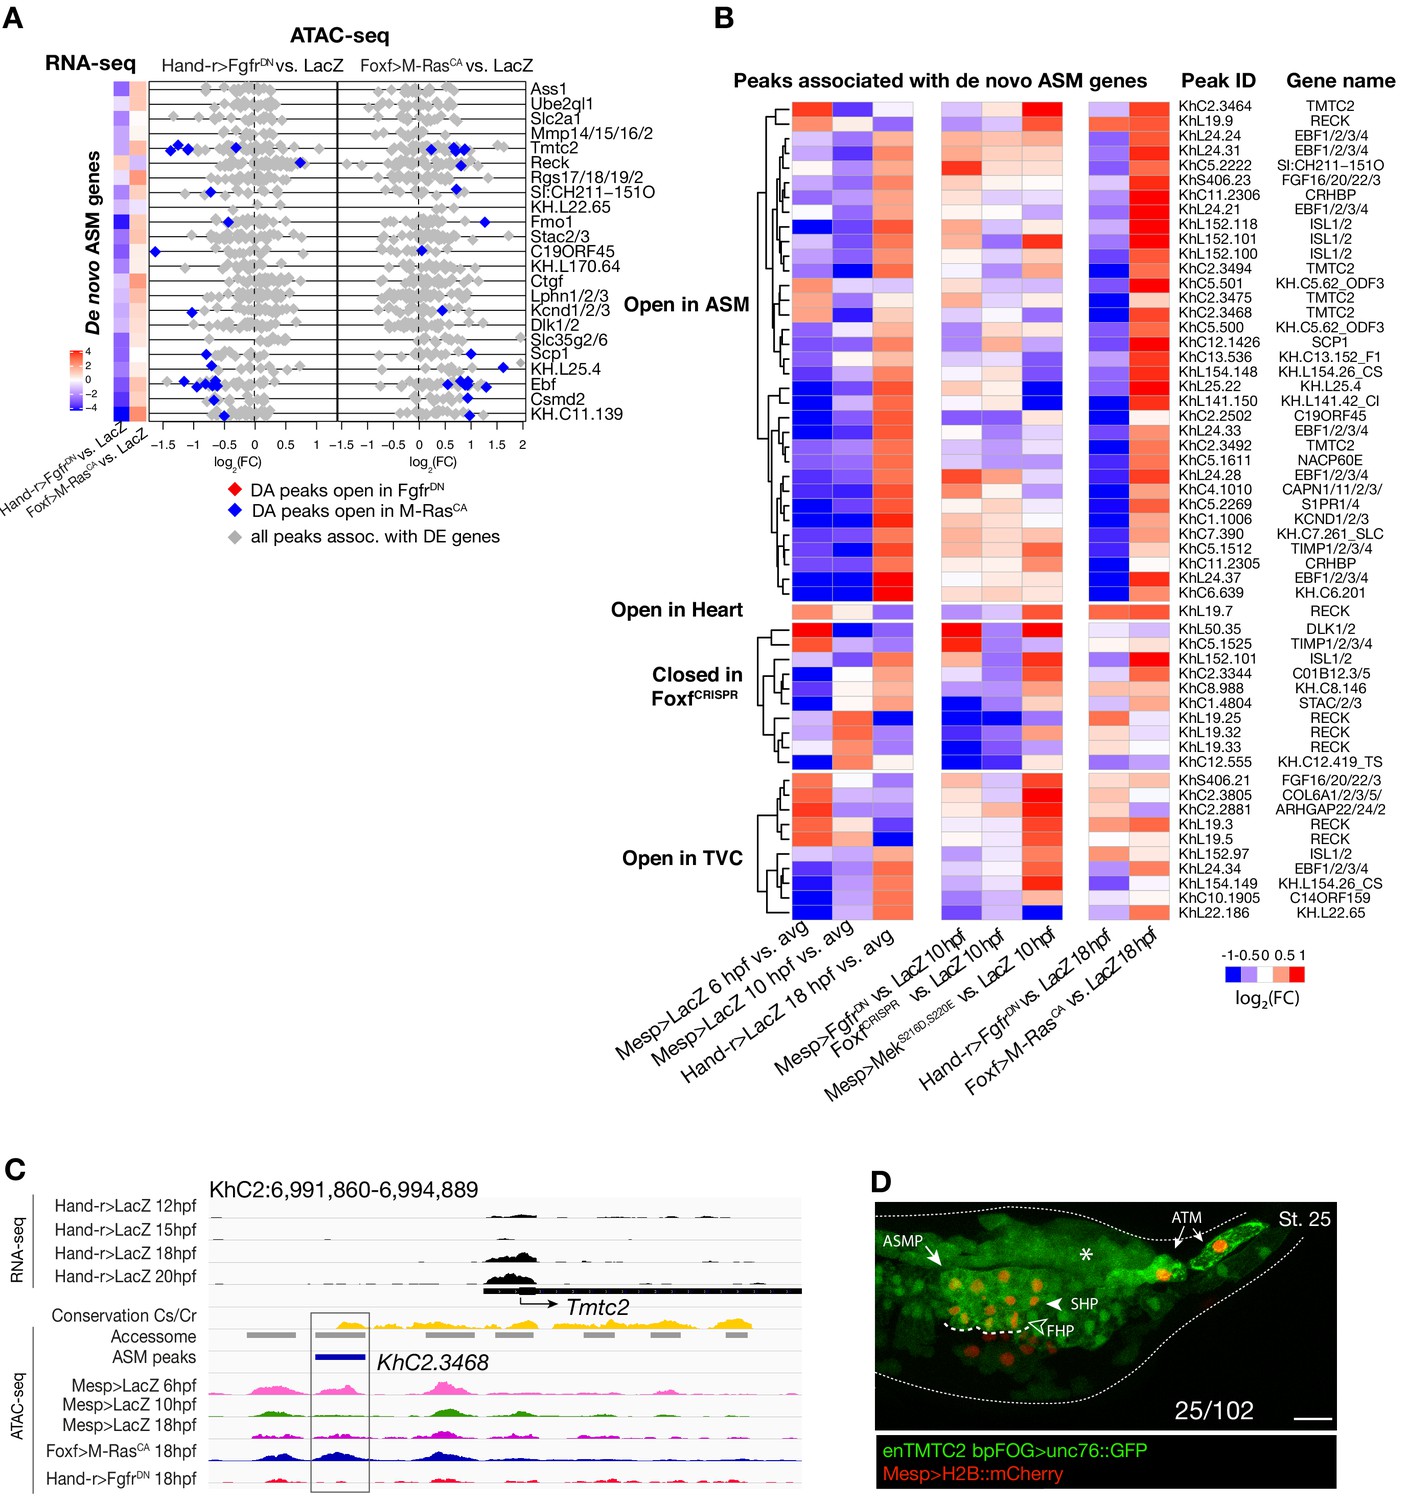
Accessibility of elements annotated to de novo ASM genes.
(A) Relationship between accessibility and expression of de novo ASM genes in either condition indicated. (B) Time-dependent ATAC-seq peaks associated with de novo expressed ASM genes. The accessibility of these peaks is shown for 6, 10 and 18 hpf vs. the average (avg.) accessibility in the controls and upon FGF-MAPK perturbation either at 10 and 18 hpf. Peaks are clustered based on their accessibility as ‘Open in ASM’ less accessible in Hand-r>FgfrDN vs. Foxf>M RasCA or Hand-r>LacZ at 18 hpf, ‘Open in Heart’ less accessible in Foxf>M RasCA vs. Hand-r>FgfrDN or Hand-r>LacZ at 18 hpf, ‘Closed in FofxCRISPR’ less accessible in FoxfCRISPR vs. ControlCRISPR, ‘Open in TVC’ less accessible in Mesp>FgfrDN vs. Mesp>MekS216D,S220E or Mesp>LacZ at 10 hpf. Only peaks changing accessibility between 6 hpf and 10 hpf or 10 hpf and 18 hpf are shown.
Figure 4—figure supplement 4
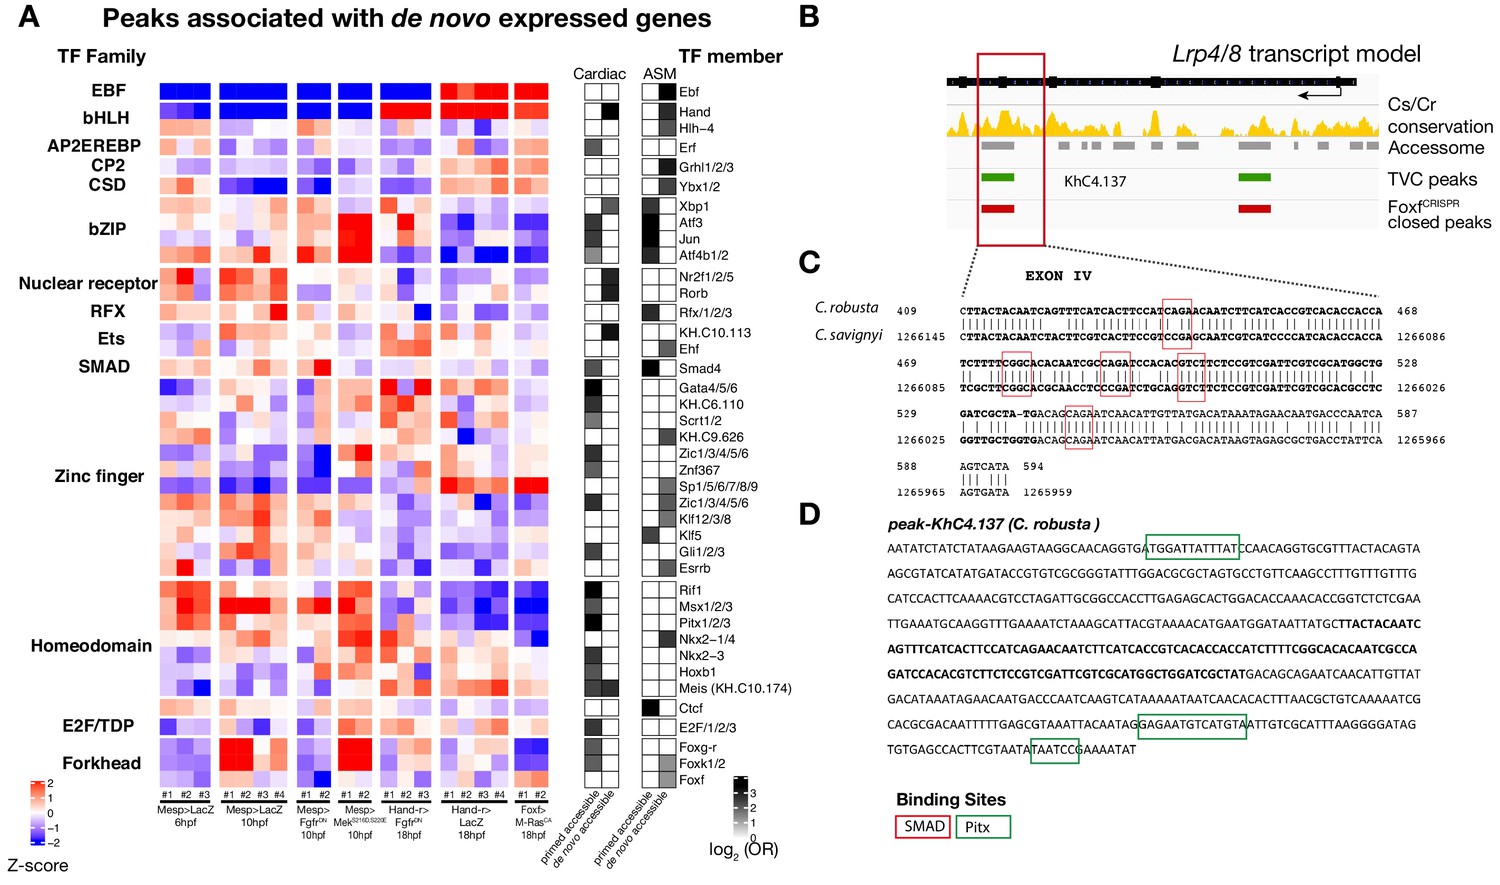
Accessibility of binding motifs over time for elements annotated to de novo-expressed genes.
(A) TF binding motifs enriched in peaks associated with de novo cardiac and pharyngeal expressed genes parsed based on primed and de novo accessibility (see Material and methods). log2(OR) (see Materials and methods) are shown for motifs significantly enriched (one-tailed hypergeometric test, p < 0.05) in the indicated peak classes. Motif accessibility from chromVAR (Schep et al., 2017) is shown for all peaks associated with a de novo-expressed cardiac or ASM gene. Only the motif with the highest log2(OR) for each TF is shown. (B) Conservation of TVC-accessible peaks closed in FoxfCRISPR in Lrp4/8 locus between C. savignyi and C. robusta. The gene body is shown in black. Conservation score was obtained from WASHU browser (Brozovic et al., 2018). (C) Alignment of conserved region of ‘KhC8.137’ peak between C. robusta and C. savignyi. (D) C. robusta Hand locus, exon IV sequence highlighted in bold and black. Only the core nucleotides are shown for candidate Pitx binding sites.
Figure 5 with 4 supplements
Combinations of cis-regulatory elements with distinct chromatin accessibility profiles are required for Ebf transcription in pharyngeal-muscle precursors.
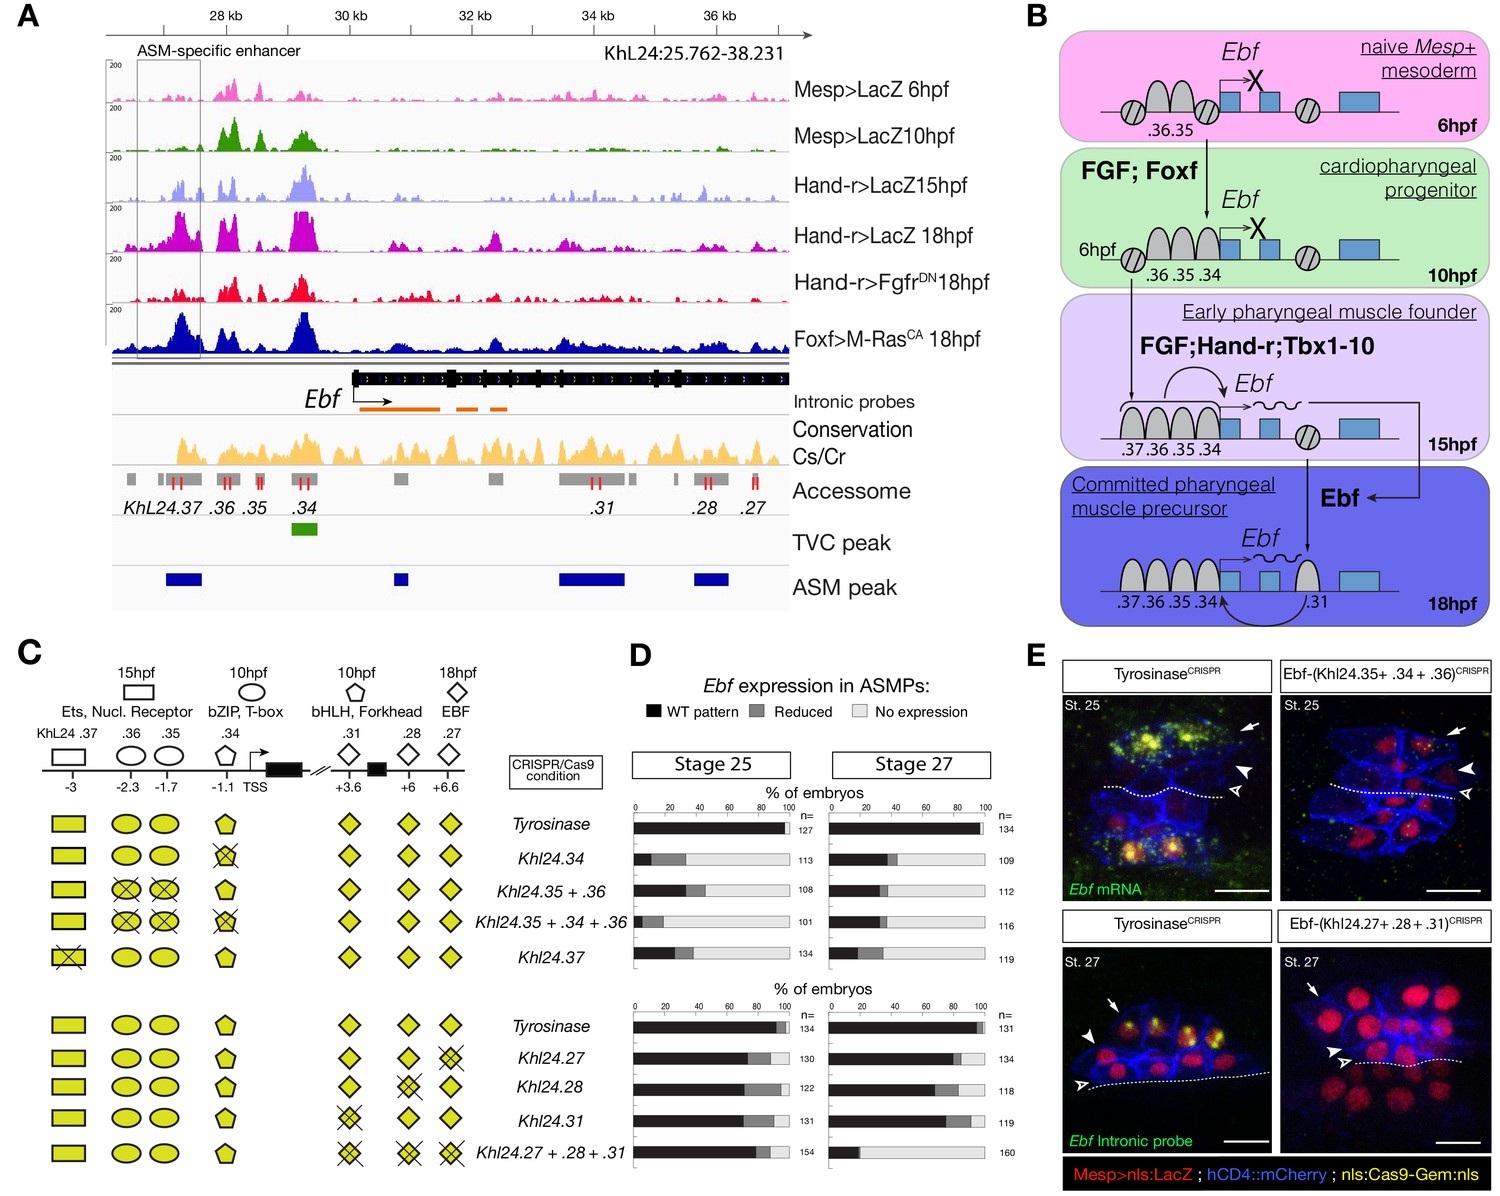
(A) A 12 kb region of the scaffold L24 displaying expression profiles of RNA-seq and chromatin accessibility profiles of ATAC-seq (normalized tag count) in the Ebf locus. sgRNAs used to target ATAC-seq peaks are shown in red; intronic antisense riboprobes are shown in orange (B) Schematic representation showing sequential opening of cis-regulatory elements required for Ebf activation in pharyngeal muscle founder cells, and maintenance by auto-regulation in committed precursor. (C) Schematic representation of Ebf cis-regulatory elements targeted for CRISPR/Cas9-mediated deletions. Shapes represent binding sites located in the regulatory elements and differentially accessible over time. (D) Proportions of larva halves showing the indicated Ebf transcription patterns, in indicated experimental conditions; all the treatments were significant versus Tyrosinase (Fisher exact test, p < 0.001). (E) Endogenous expression of Ebf visualized by in situ (green) in TyrosinaseCRISPR and upon CRISPR/Cas9-induced deletion of ATAC-seq peaks as indicated, at stage 25 (E) and 27 (F) based on Hotta et al. (2007). For stage 25, an anti-sense riboprobe for the full length cDNA was used, whereas for stage 27 an intronic anti-sense riboprobe targeting the first three introns of Ebf transcript (orange lines) as previously used in Wang et al. (2013). Nuclei of B7.5 lineage cells are labelled by Mesp>nls::LacZ and revealed with an anti beta-galactosidase antibody (red). Mesp-driven hCD4::mCherry accumulates at the cell membrane as revealed by anti mCherry antibody (Blue). Scale bar = 10 µm.
Figure 5—figure supplement 1
Combinations of cis-regulatory elements with distinct chromatin accessibility profiles are required for Tbx1/10 transcription in pharyngeal-muscle precursors.
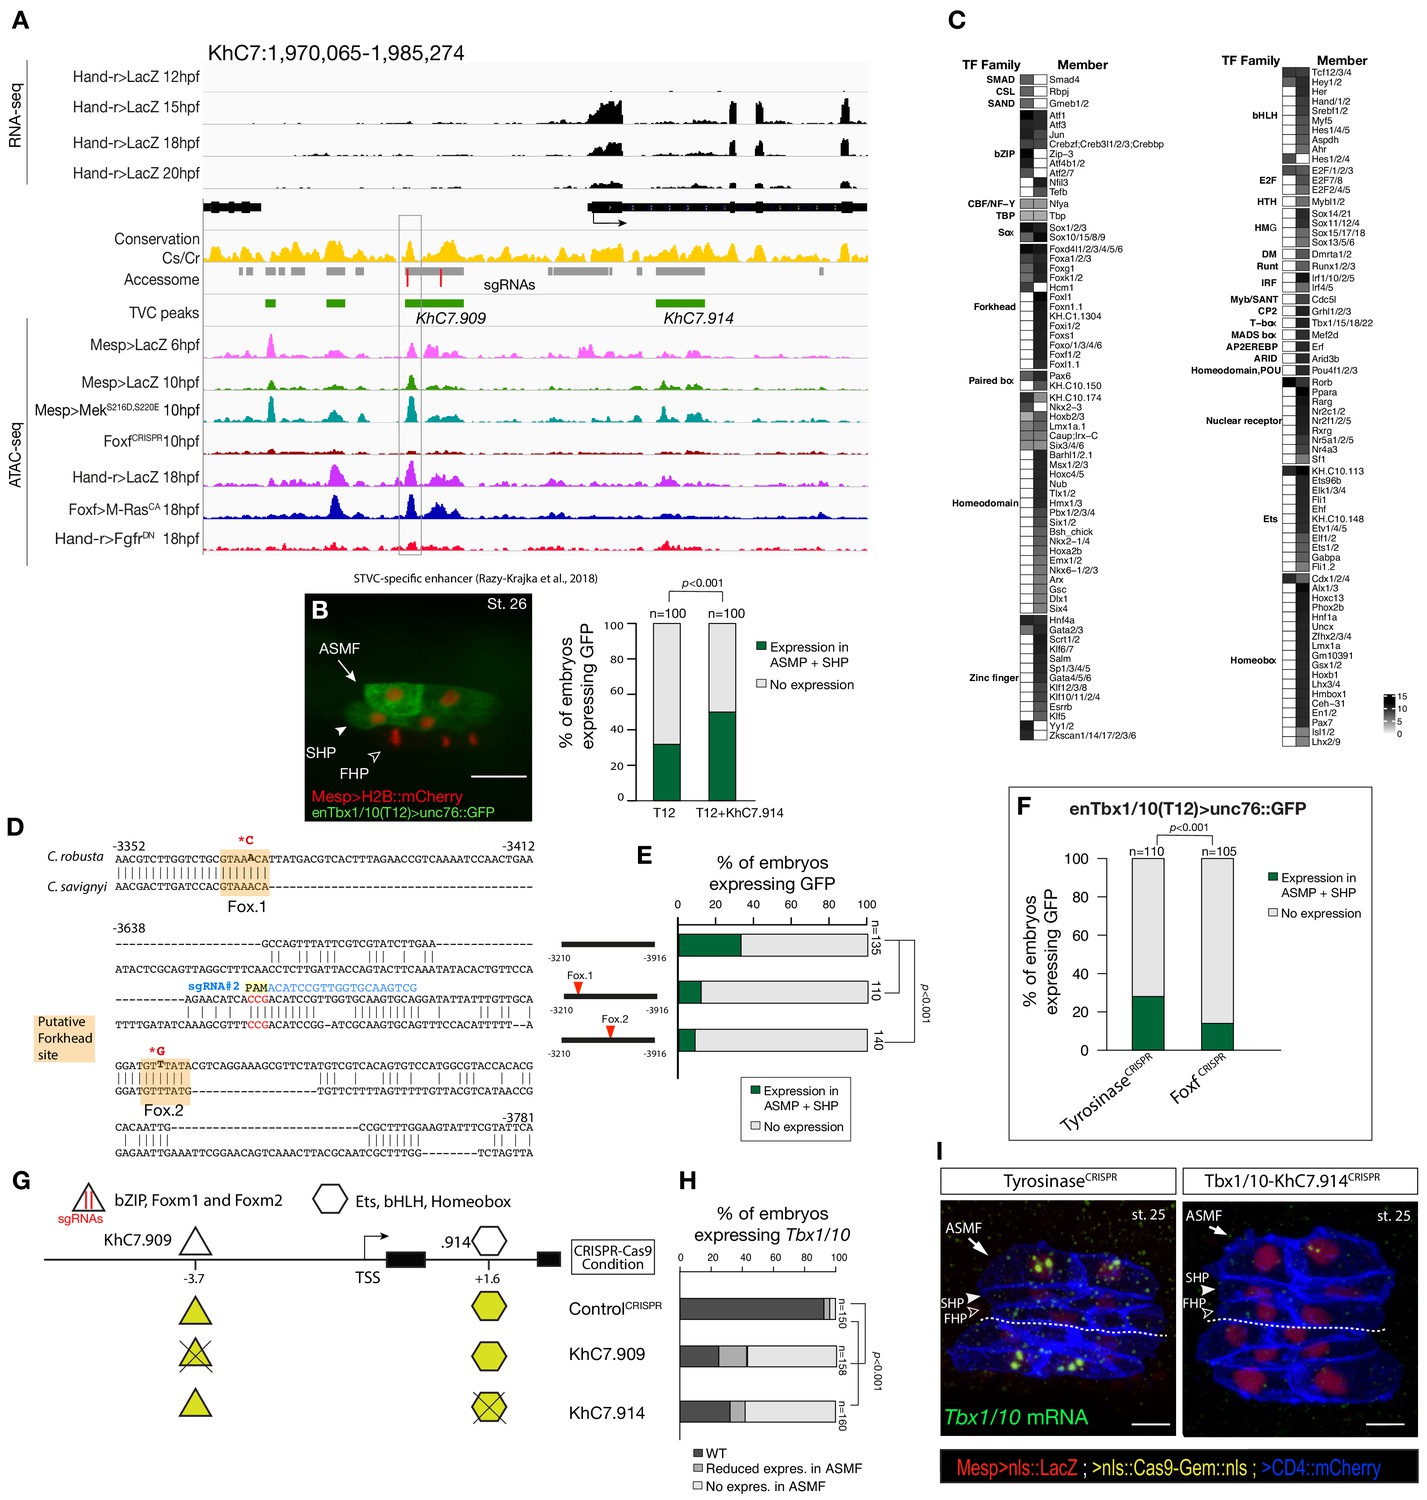
(A) An 11 kb region on chromosome seven displaying expression profiles of RNA-seq and chromatin accessibility profiles ATAC-seq normalized tag count in Tbx1/10 locus. (B) STVC-specific enhancer (T12) (Razy-Krajka et al., 2018) driven in vivo reporter expression (green) in ASMFs and SHPs at stage 26 (Hotta et al., 2007). Nuclei of B7.5 lineage cells are labelled by Mesp>H2B::mCherry (red). Scale bar, 20 μm. T12 enhancer tested alone or fused to the intronic element (T12+KhC7.914). Statistical significance of the difference in reporter expression was tested using a Fisher exact test (p < 0.001) (C) Motif scores in each experimentally validated peak in the Tbx1/10 locus. Only the highest match score is shown for each motif. (D) Sequence alignment of Tbx1/10 enhancer (T12) between Ciona robusta/Ciona savignyi. Conserved blocks in the orange boxes with putative Forkhead binding sites. In blue is highlighted the single guide RNA (sgRNA#2) used to target CRISPR/Cas9 system, with the PAM domain in red; the point mutations induced in two conserved putative Forkhead binding sites (Fox1 and Fox2) are in bold and red after the asterisks. (E) Proportion of larvae expressing both GFP and mCherry in the STVC progeny when co-electroporated wild-type and mutant Tbx1/10 reporters lacking the indicated putative Forkhead binding sites and Mesp>H2B::mCherry in comparison to the control. (F) Proportions of larvae halves showing GFP expressed in the ASMFs and SHPs in embryos electroporated with Mesp>Cas9 along with single guide RNAs targeting Tyrosinase (controlCRISPR) as well as Foxf (FoxfCRISPR). (G) Schematic representation of regulatory elements in Tbx1/10 locus as displayed in ATAC-seq profiles targeted for CRISPR/Cas9-mediated deletions. (H) Proportions of larvae halves showing the indicated Tbx1/10 transcription patterns, in indicated experimental conditions (Fisher exact test, p < 0.001). (I) Endogenous expression of Tbx1/10 visualized by in situ (green) in TyrosinaseCRISPR (left panel) and upon CRISPR/Cas9-induced deletion of TVC-specific peaks (right panel) at stage 25 according to Hotta et al. (2007). Nuclei of B7.5 lineage cells are labelled by Mesp>nls::LacZ and revealed with an anti beta-galactosidase antibody (red). Nuclei of B7.5 lineage cells are labelled by Mesp>nls::LacZ and revealed with an anti beta-galactosidase antibody (red). Scale bar = 10 µm. Experiment performed in biological replicates. Total numbers of individual halves scored per condition are shown in 'n='. All the treatments were significant versus Control (Tyrosinase) (Fisher exact test, p < 0.001).
Figure 5—figure supplement 2
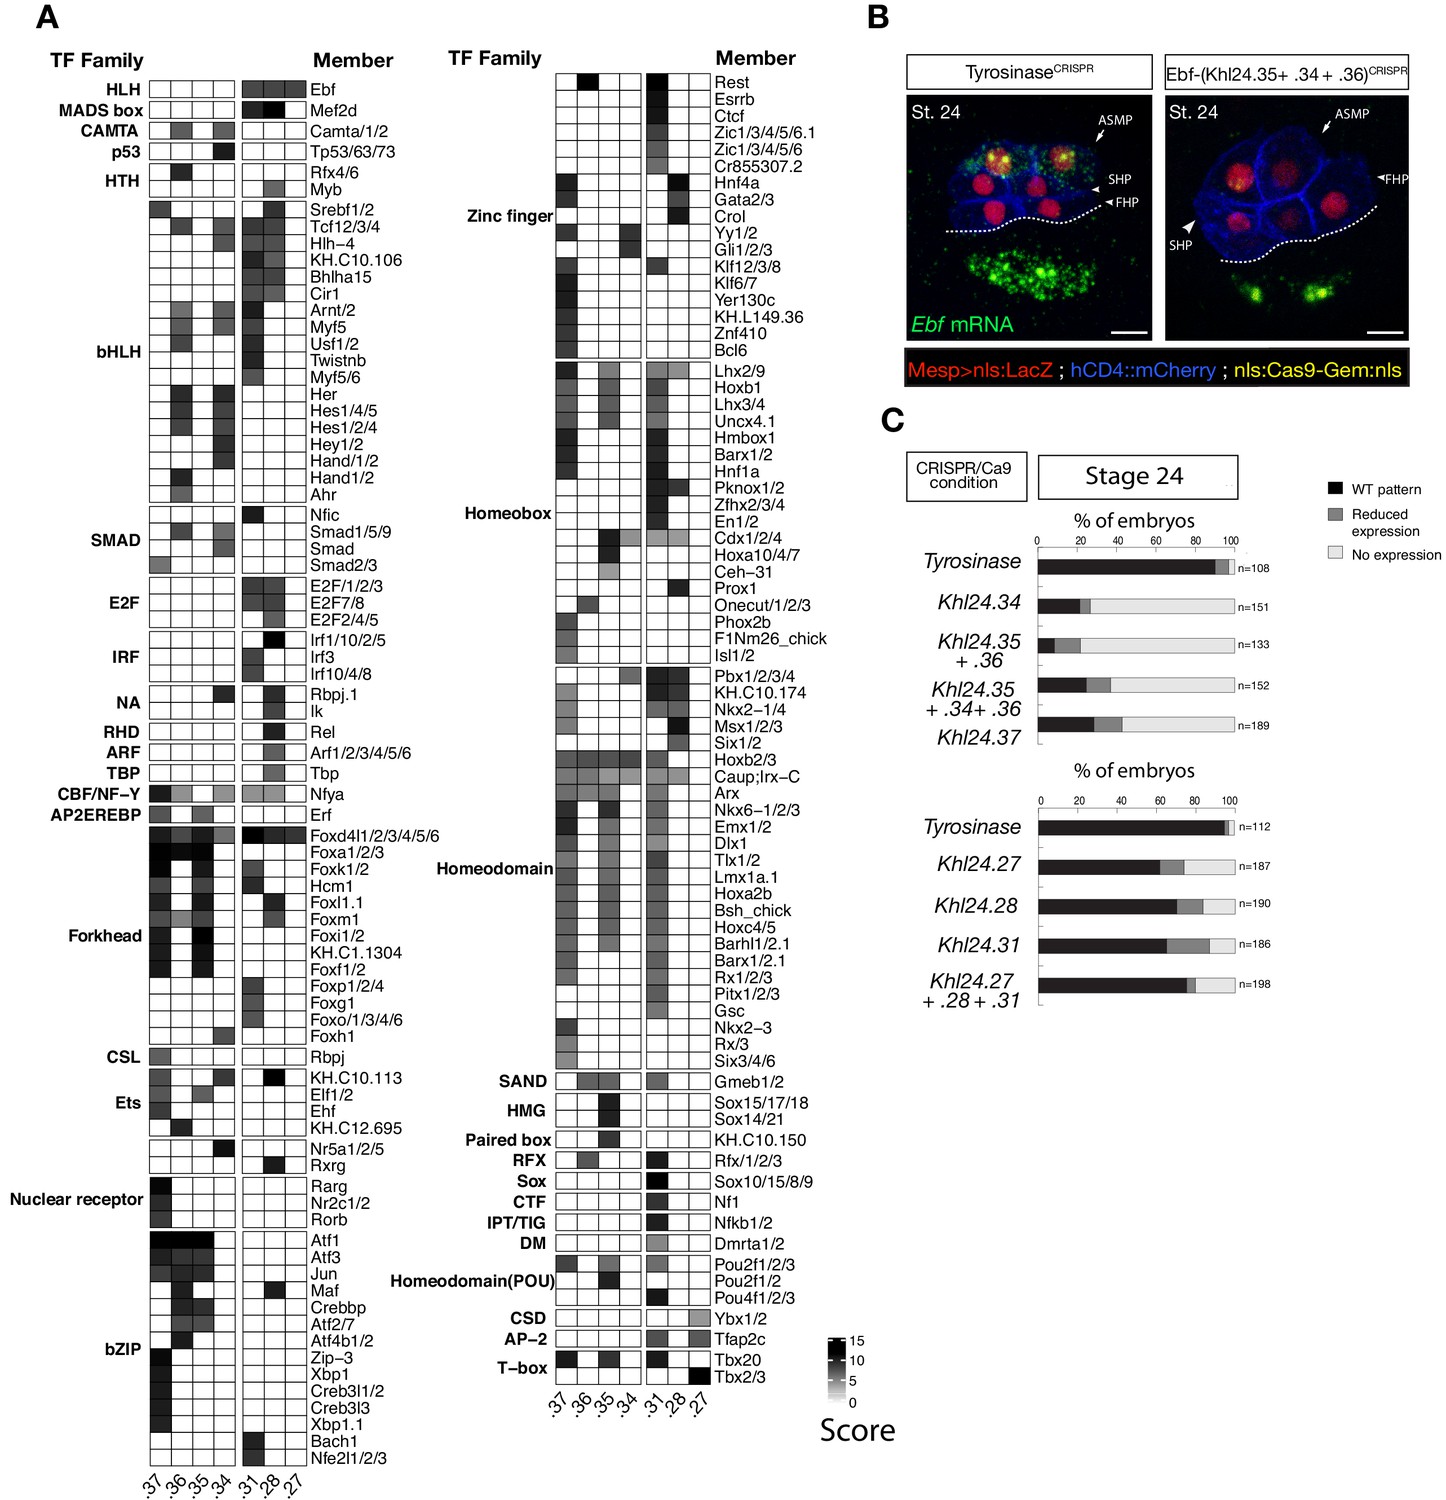
Ebf regulatory regions showing differentially accessibility over time contain distinct binding motifs.
(A) Motif scores in each experimentally validated peak in the Ebf locus. Only the highest match score is shown for each motif. (B) Endogenous expression of Ebf visualized by in situ (green) in TyrosinaseCRISPR and upon CRISPR/Cas9-induced deletions of TVC-specific peaks at stage 24 according to Hotta et al. (2007). Nuclei of B7.5 lineage cells are labelled by Mesp>nls::LacZ and revealed with an anti beta-galactosidase antibody (red). Nuclei of B7.5 lineage cells are labelled by Mesp>nls::LacZ and revealed with an anti beta-galactosidase antibody (red). Scale bar = 10 µm. (C) Proportions of larvae halves showing the indicated Ebf transcription patterns, in indicated experimental conditions. Experiment performed in biological replicates. All the treatments were significant versus Control (Tyrosinase) (Fisher exact test, p < 0.001).
Figure 5—figure supplement 3
CRISPR/Cas9-mediated deletions on individual accessible elements upstream of Ebf caused phenotypic impact on pharyngeal muscle precursors morphogenesis.
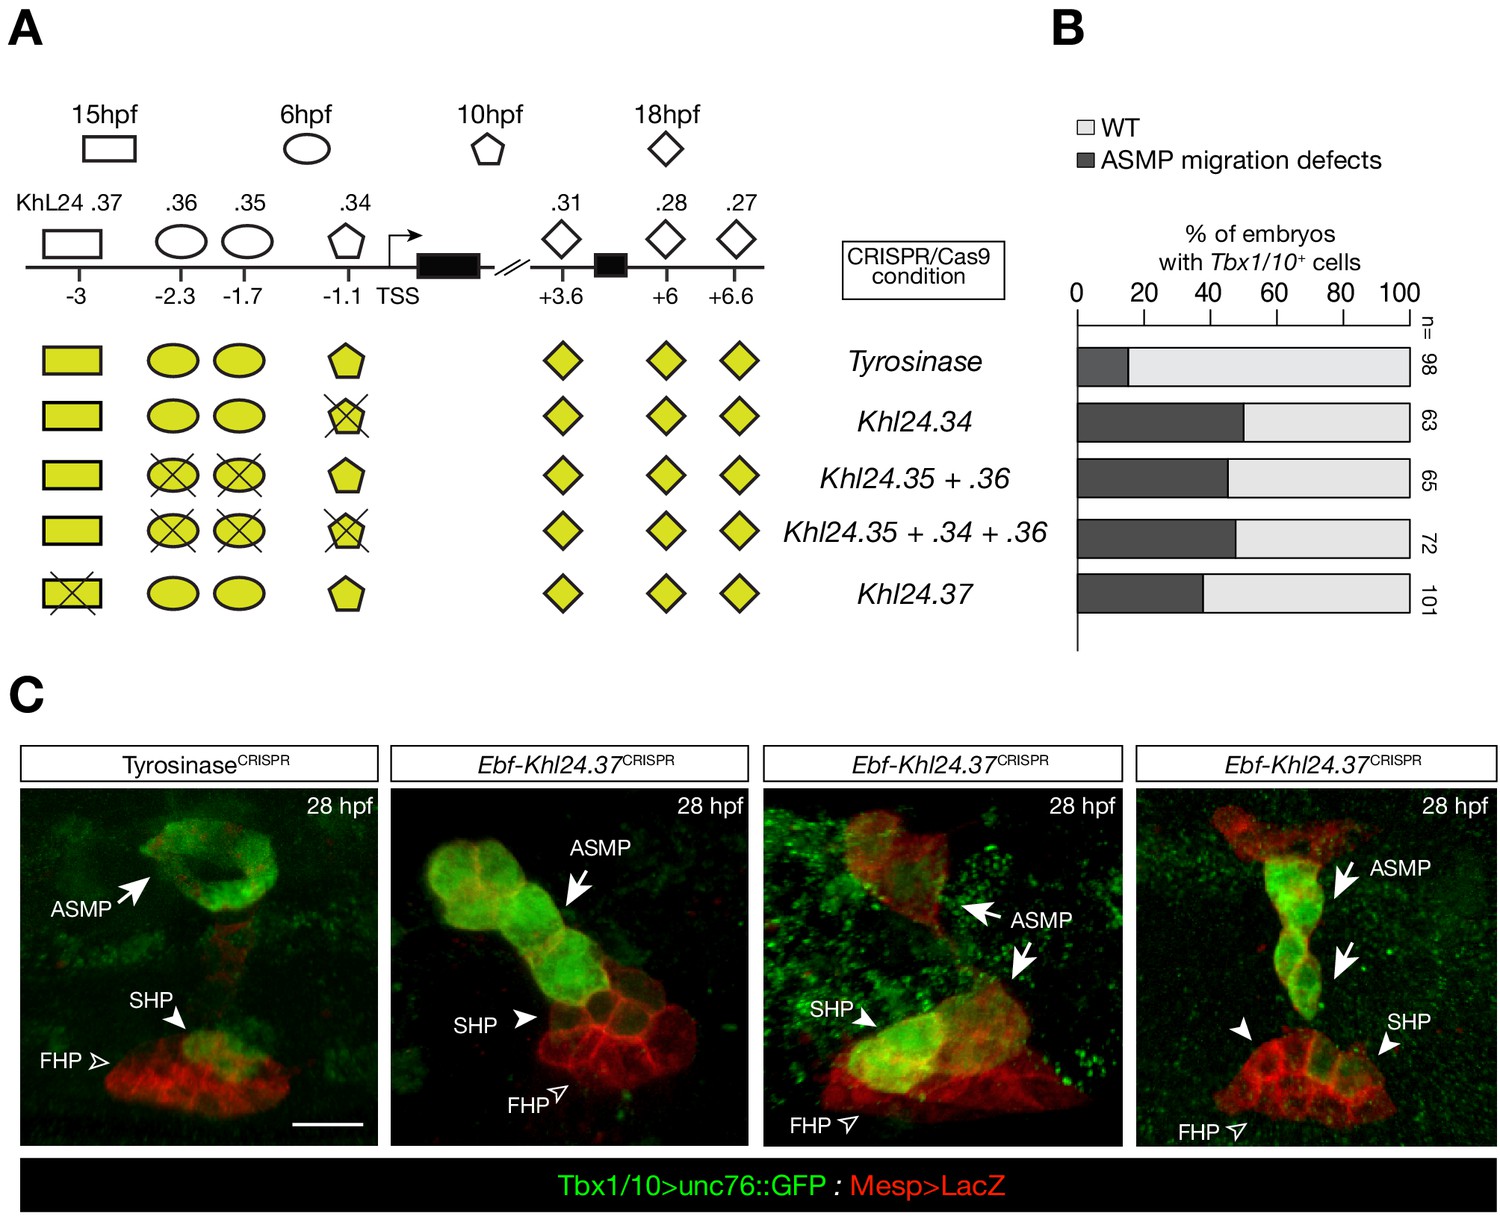
(A) Schematic representation of Ebf cis-regulatory elements targeted for CRISPR/Cas9-mediated deletions; the shapes of the distinct cis-regulatory elements are as in Figure 5C. (B) Proportions of larva halves showing GFP-driven STVC-specific enhancer of Tbx1/10 in indicated experimental conditions; all the treatments were significant versus Tyrosinase (Fisher exact test, p < 0.001; ‘n’ is the total number of individual halves scored per condition.). (C) Example of an embryo at 28 hpf showing GFP expression only in the ASM (solid arrowhead) and SHP (arrow) but not in the FHP (open arrowheads), where Tbx1/10 enhancer is not active (TyrosinaseCRISPR, first panel on the left). Targeted deletions in KhL24.37 peak induced ASMP cell migration defects. B7.5 lineage cells are labelled by Mesp>LacZ. Scale bar = 10 µm.
Figure 5—figure supplement 4
Intronic and distal enhancer accessibility in the Tbx1/10 locus tested by dCas9-KRAB.
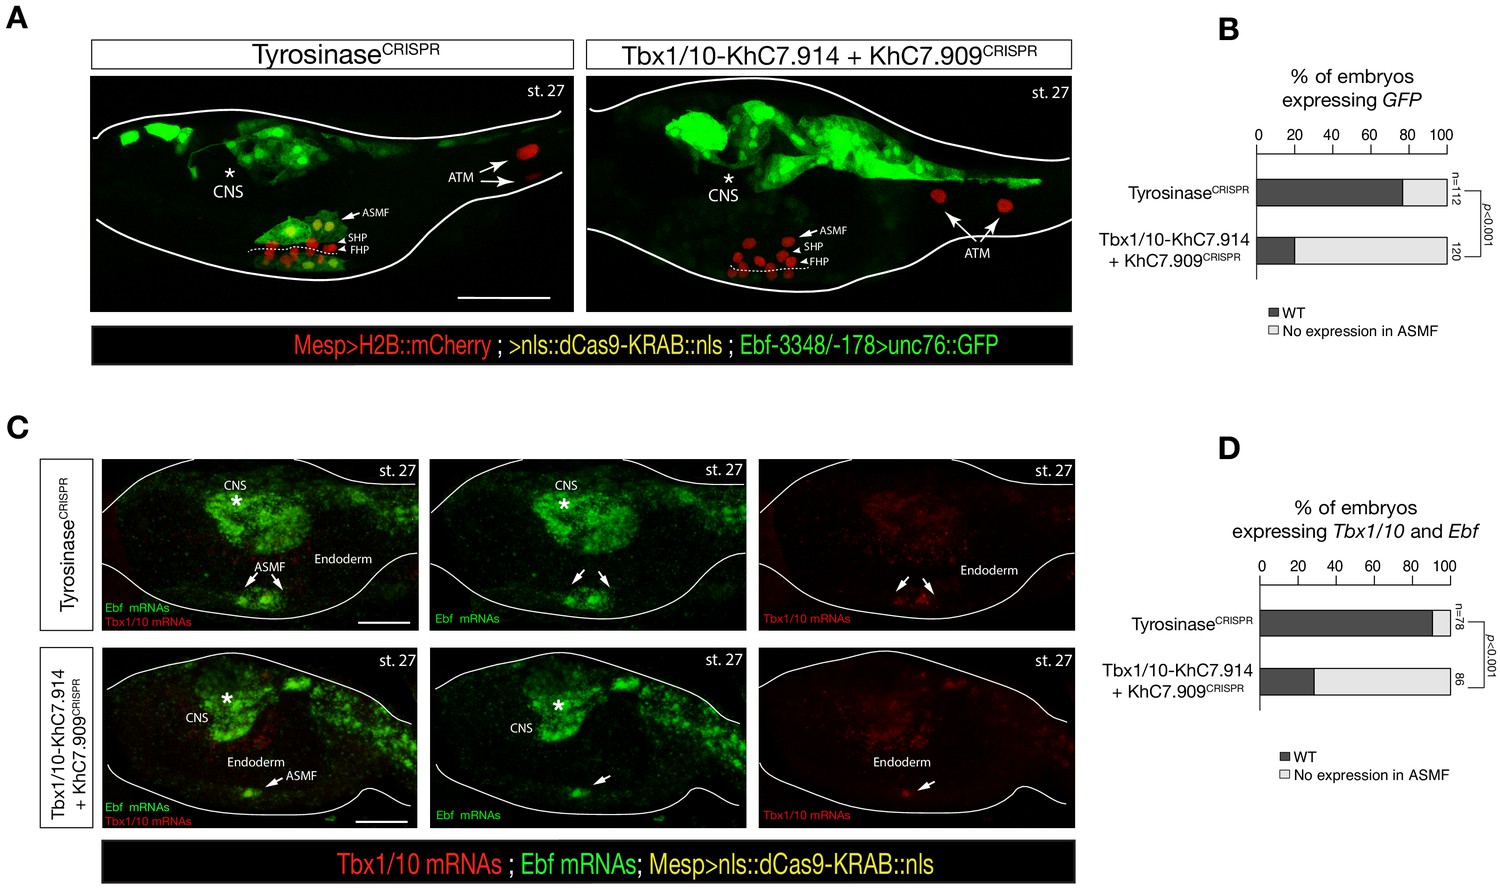
(A) ASM-specific enhancer of Ebf (Ebf-3348/–178) (Wang et al., 2013) driven in vivo reporter expression (green) in embryos at stage 27 (Hotta et al., 2007) electroporated with Mesp>dCas9 KRAB along with single guide RNAs targeting Tyrosinase (control, left panel) as well as intronic (KhC7.914) and distal (KhC7.909) of Tbx1/10 locus (right panel) as in Figure 5—figure supplement 1G. Nuclei of B7.5 lineage cells are labelled by Mesp>H2B::mCherry (red). White asterisk indicated central nervous system (CNS). Scale bar, 50 μm. (B) Proportions of larvae halves showing GFP expressed in the ASMFs in indicated experimental conditions (Fisher exact test, p < 0.001). (C) Double in situ hybridization of Ebf (green) and Tbx1/10 (red) on embryos at stage 27 electroporated with Mesp>dCas9 KRAB along with single guide RNAs targeting Tyrosinase (control, left panel) as well as intronic (KhC7.914) and distal (KhC7.909) of Tbx1/10 locus. White asterisk indicated central nervous system (CNS). Scale bar, 20 μm. (D) Proportions of larvae halves expressing both Tbx1/10 and Ebf in the ASMFs in indicated experimental conditions. Experiment performed in biological replicates. Total numbers of individual halves scored per condition are shown in 'n='. All the treatments were significant versus Control (Tyrosinase) (Fisher exact test, p < 0.001).
Figure 6
Multiple copies of a weak Ebf enhancer drive ectopic reporter gene expression.
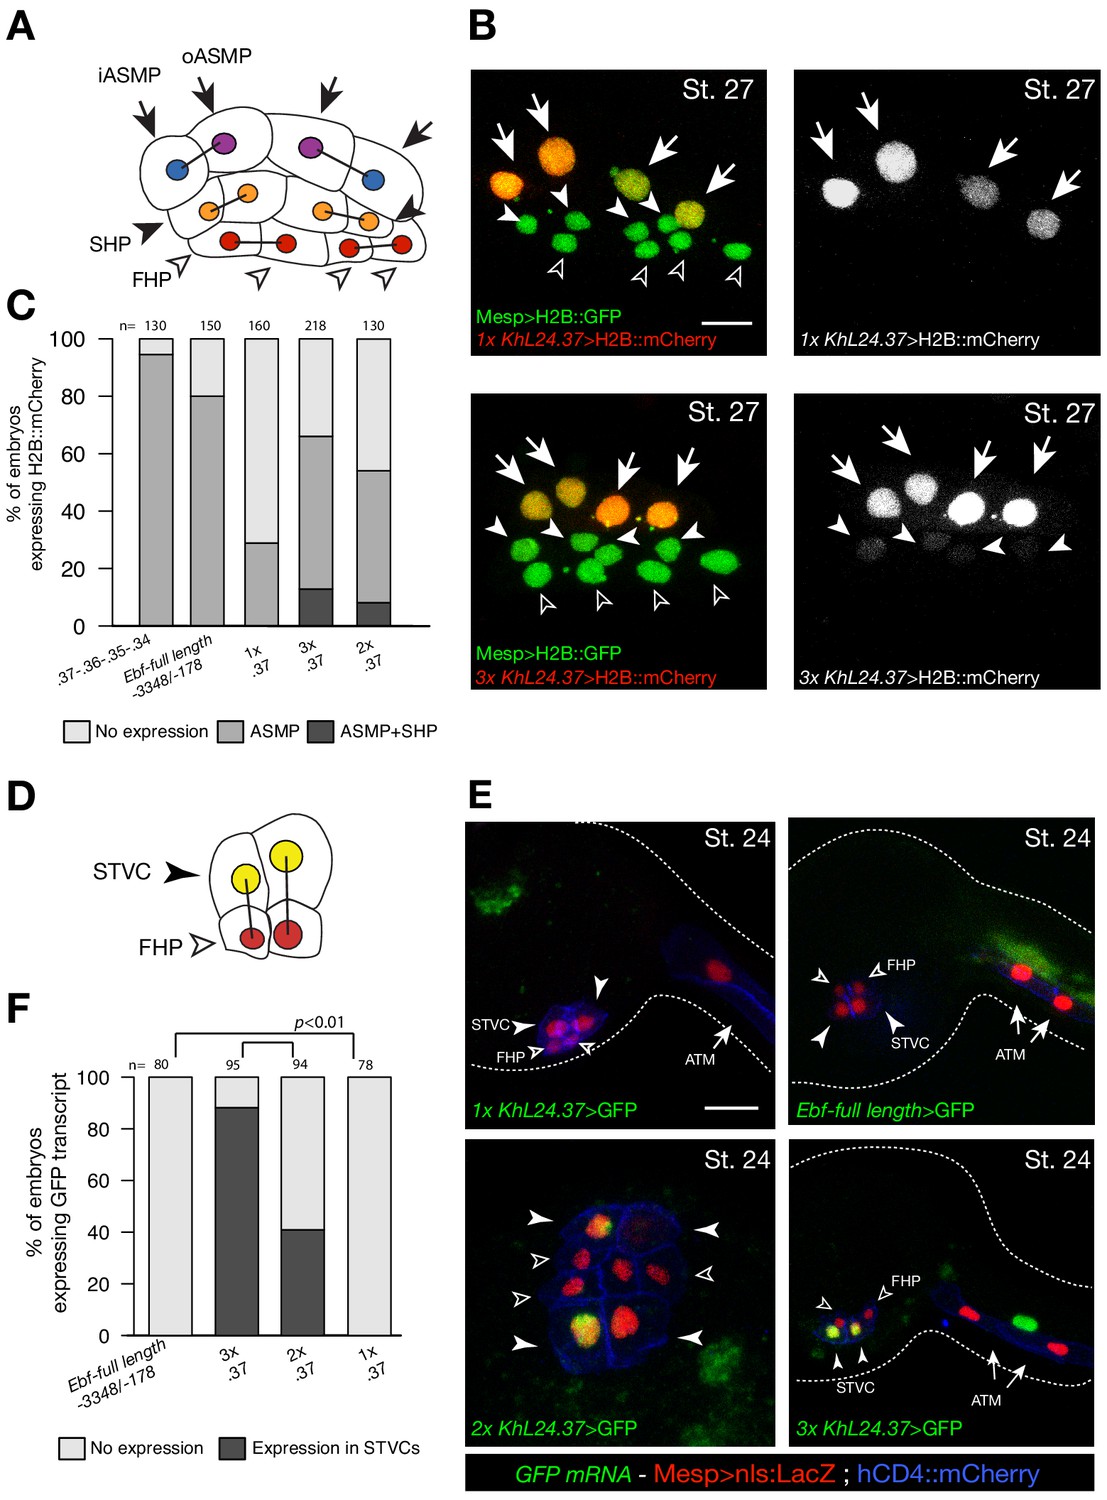
(A) Schematic representation of cardiopharyngeal lineage cells at Stage 27 (Hotta et al., 2007); First heart precursors (FHPs, red and open arrowheads), second heart precursors (SHPs, orange and arrows), inner ASM precursors and derivatives (iASMPs, violet and solid arrowhead), outer ASM precursors and derivatives (oASMPs, dark blue and solid arrowhead) (see (Razy-Krajka et al., 2014); black bars link sister cells. (B) Lineage tracing in individual larvae expressing single (1x) and multiple copy (3x) of Ebf cis-regulatory element, KhL24.37, driving H2B::mCherry (red) in cardiopharynegal progenitors at stage 27; B7.5 lineage is marked with Mesp>H2B::GFP (green). The single copy of KhL24.37 element drives H2B::mCherry reporter expression specifically in the ASMPs (upper left panel, in white); three copies of KhL24.37 (3x L24.37) drives expression in ASMPs and induces ectopic expression SHPs (lower left panel, in white). Experiment performed in biological replicate. Scale bar = 30 µm. (C) Proportions of embryos expressing H2B::mCherry in indicated cell-type progenitors by the indicated cis-regulaory elements. The ‘full length’ upstream region encompassing all combined enhancers with endogenous spacing (Ebf-full length −3348 /- 178) (Wang et al., 2013) as well as the concatemer of KhL24.37, .36, .35, and .34 elements, lacking endogenous spacer sequences were used as controls. Statistical analysis using a Fisher exact test showed all comparisons with either control to be significant (p < 0.01); ‘n’ is the total number of individual halves scored per condition. (D) Schematic representation of cardiopharyngeal lineage cells at Stage 24 (Hotta et al., 2007); First heart precursors (FHPs, red and open arrowheads), secondary TVC (arrows). (E) Expression of GFP visualized by in situ hybridization on embryos at Stage 24 electroporated with single, multi copies and full-length of Ebf cis-regulatory element. Nuclei of B7.5 lineage cells are labelled by Mesp>nls::LacZ and revealed with an anti beta-galactosidase antibody (red). Mesp-driven hCD4::mCherry accumulates at the cell membrane as revealed by anti mCherry antibody (Blue). Scale bar = 10 µm. (F) Proportions of embryos showing GFP-driven by the indicated Ebf cis-regulatory element (Fisher exact test, p < 0.01).
Figure 7
Multimer of one weak Ebf enhancer drives ectopic pharyngeal muscle fate specification.
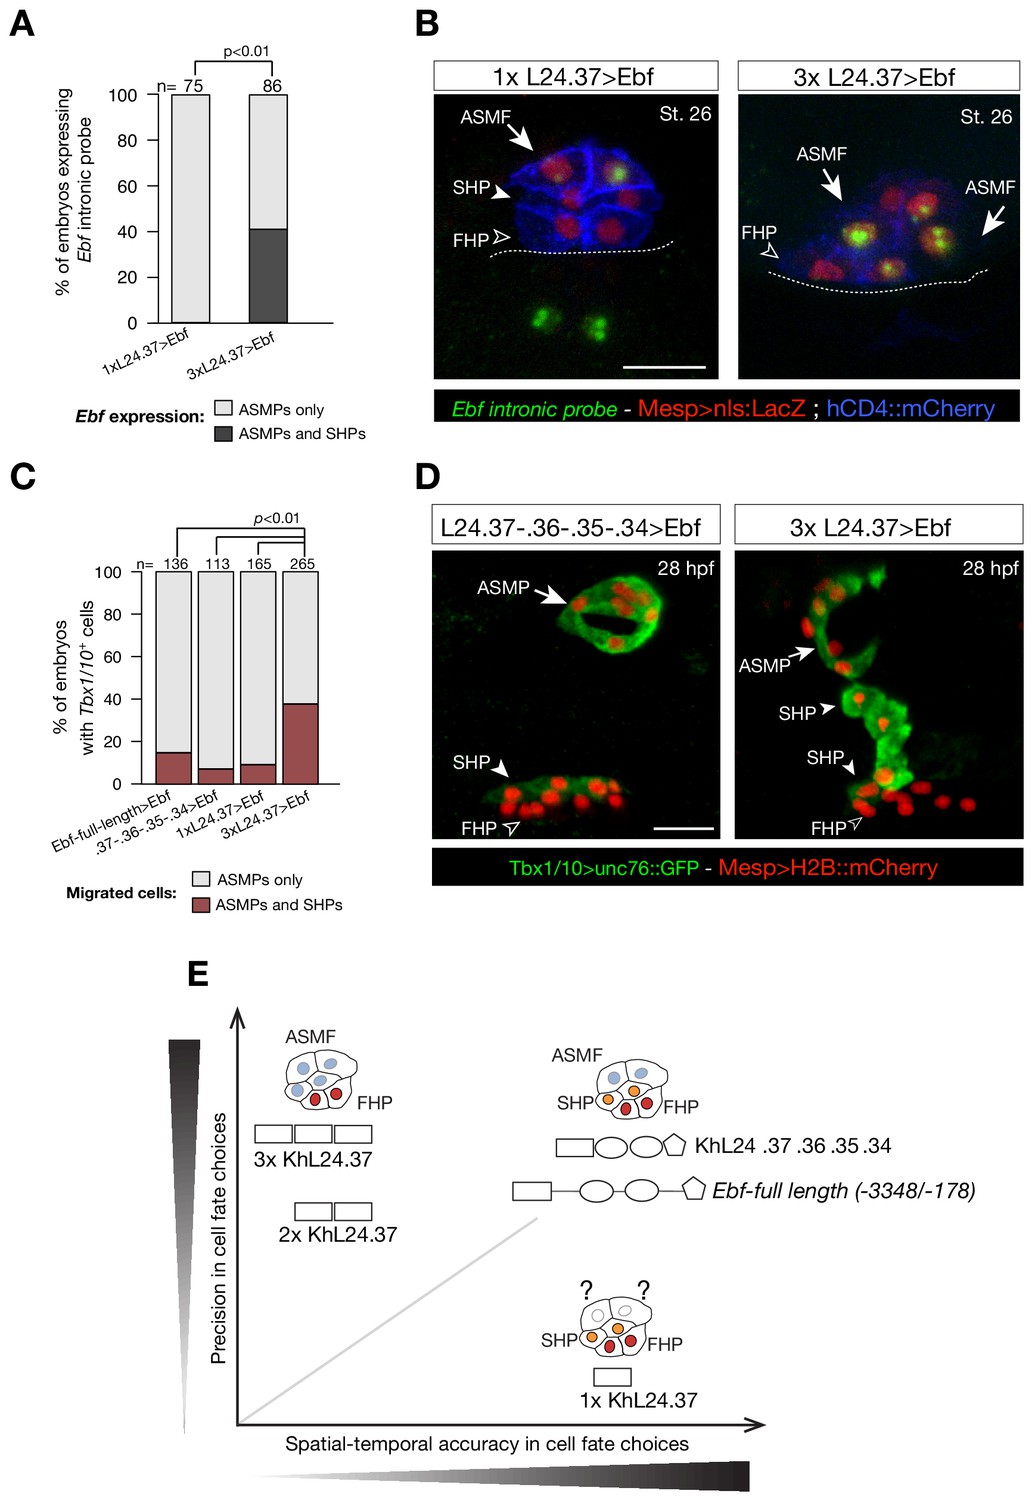
(A) Targeted expression of an Ebf cDNA by three copies of KhL24.37 element induces expression of endogenous Ebf in four cells compared to the control where Ebf is detected only in the two ASMPs. Proportions of embryos expressing Ebf in ASMPs only or in ASMPs and SHPs in the indicated conditions. The single KhL24.37 cis-regulatory was used as control. (B) Expression of Ebf visualized by in situ hybridization on embryos at Stage 26 electroporated with single or three copies KhL24.37 element driving Ebf cDNA. Intron-specific probes show nascent Ebf transcripts in ASMPs. Nuclei of B7.5 lineage cells are labelled by Mesp>nls::LacZ and revealed with an anti beta-galactosidase antibody (Red). Mesp-driven hCD4::mCherry accumulates at the cell membrane as revealed by anti mCherry antibody (Blue). Scale bar = 10 µm. (C) Proportions of embryos showing GFP-driven STVC-specific enhancer of Tbx1/10 (Fisher exact test, p < 0.01). The ‘full length’ upstream element encompassing all combined enhancers with endogenous spacing (Ebf-full length −3348 / -178) as well as the ‘full length’ without endogenous spacing (KhL24.37, .36, .35, .34) and the single copy KhL24.37 element driving Ebf were used as a positive controls. (D) Example of an embryo at 28 hpf showing GFP expression only in the ASMP (solid arrowhead) and SHP (arrow) but not in the FHP (open arrowheads), where Tbx1/10 enhancer is not active. Targeted expression of Ebf cDNA by three copies of KhL24.37 element induces cells that normally form the second heart lineage to migrate alongside the pharyngeal muscle. Nuclei of B7.5 lineage cells are labelled by Mesp>H2B::mCherry. Scale bar = 15 µm. (E) Proposed role of combinatorial logics in fostering both precision and spatial and temporal accuracy of cell fate choices. The Ebf-full length, with or without endogenous spacers, fosters spatial/temporal accurate and precise cell fate choice, whereas the single copy of KhL24.37 (1x L24.37) gives spatiotemporally accurate reporter expression but is likely insufficient to induce a precise ASM fate. Multiple copies of KhL24.37 cis-regulatory element rescue a high reporter activity that reflects precise pharyngeal fate at the expense of spatial and temporal accuracy. The shapes of the distinct cis-regulatory elements are as in Figure 5C. Statistical analysis using a Fisher exact test (p < 0.01); ‘n’ is the total number of individual halves scored per condition.
Additional files
-
Supplementary file 1
Description of ATAC-seq dataset, with sample name, conditions, type of cells, number of mapped reads for all the biological replicates.
- https://cdn.elifesciences.org/articles/49921/elife-49921-supp1-v2.xlsx
-
Supplementary file 2
Differentially FGF-MAPK-regulated genes (microarray) associated with differentially accessible peaks (ATAC-seq) in the pairwise comparison Mesp>FgfrDN vs. Mesp>LacZ – 10 hpf; genomic coordinates of each peak are reported.
- https://cdn.elifesciences.org/articles/49921/elife-49921-supp2-v2.xlsx
-
Supplementary file 3
Known enhancers for TVC-specific genes characterized in previous studies; genomic coordinates of each peak are reported.
- https://cdn.elifesciences.org/articles/49921/elife-49921-supp3-v2.xlsx
-
Supplementary file 4
Primer sequences used for cloning putative regulatory regions for functional enhancer assay.
- https://cdn.elifesciences.org/articles/49921/elife-49921-supp4-v2.xlsx
-
Supplementary file 5
Primer sequences of single guide RNAs used to induce CRISPR/Cas9-mediated deletions in ATAC-seq peak as well as in Foxf (FoxfCRISPR) and to induce point mutations in Tbx1/10 STVC-specific enhancer; genomic coordinates and peak IDs are reported for each peak validated.
- https://cdn.elifesciences.org/articles/49921/elife-49921-supp5-v2.xlsx
-
Supplementary file 6
ATM gene selected based on expression data deposited in ANISEED (https://www.aniseed.cnrs.fr).
- https://cdn.elifesciences.org/articles/49921/elife-49921-supp6-v2.xlsx
-
Supplementary file 7
Differentially expressed genes from RNA-seq on FACS-purified cells following CRISPR/Cas9-induced loss of function of Foxf.
- https://cdn.elifesciences.org/articles/49921/elife-49921-supp7-v2.xlsx
-
Supplementary file 8
Differentially accessible peaks from ATAC-seq on FACS-purified cells following CRISPR/Cas9-induced loss of function of Foxf (FoxfCRISPR vs. ControlCRISPR at 10 hpf).
Sheet1: closed in FoxfCRISPR log2(FC) < −0.5 and FDR < 0.05); sheet2: open in FoxfCRISPR log2(FC) > 0.5 and FDR < 0.05.
- https://cdn.elifesciences.org/articles/49921/elife-49921-supp8-v2.xlsx
-
Supplementary file 9
Differentially accessible peaks from ATAC-seq, closed in the founder cells (LacZ 6 hpf < LacZ 10 hpf) and closed in FoxfCRISPR vs. ControlCRISPRat 10 hpf.
- https://cdn.elifesciences.org/articles/49921/elife-49921-supp9-v2.xlsx
-
Supplementary file 10
Differentially accessible peaks closed in FgfrDN at 10 hpf and associated with de novo cardiac (sheet 1) and pharyngeal muscle (sheet 2) expressed genes.
- https://cdn.elifesciences.org/articles/49921/elife-49921-supp10-v2.xlsx
-
Supplementary file 11
Differentially FGF-MAPK-regulated genes associated with differentially accessible peaks in MAPK activated −18 hpf (sheet1) and MAPK inhibited −18 hpf (sheet 2); genomic coordinates of each peak are reported.
- https://cdn.elifesciences.org/articles/49921/elife-49921-supp11-v2.xlsx
-
Supplementary file 12
FGF-MAPK-regulated genes associated with ATAC-seq peaks that are non-differentially accessible in MAPK activated −18 hpf and MAPK inhibited −18 hpf.
- https://cdn.elifesciences.org/articles/49921/elife-49921-supp12-v2.xlsx
-
Supplementary file 13
Accessible elements associated with de novo expressed heart and pharyngeal muscle markers into pre-accessible/primed or de novo accessible elements; genomic coordinates of each peak are reported.
- https://cdn.elifesciences.org/articles/49921/elife-49921-supp13-v2.xlsx
-
Supplementary file 14
FASTA sequences including the Foxf proteins (with their accession numbers) used for Figure 3—figure supplement 2.
- https://cdn.elifesciences.org/articles/49921/elife-49921-supp14-v2.fa
-
Transparent reporting form
- https://cdn.elifesciences.org/articles/49921/elife-49921-transrepform-v2.docx
Download links
A two-part list of links to download the article, or parts of the article, in various formats.
Downloads (link to download the article as PDF)
Open citations (links to open the citations from this article in various online reference manager services)
Cite this article (links to download the citations from this article in formats compatible with various reference manager tools)
Combinatorial chromatin dynamics foster accurate cardiopharyngeal fate choices
eLife 8:e49921.
https://doi.org/10.7554/eLife.49921


