Interferon-β-induced miR-1 alleviates toxic protein accumulation by controlling autophagy
- Monash University, Australia
- University of Copenhagen, Denmark
- University of Cambridge, United Kingdom
Figures
Figure 1 with 4 supplements
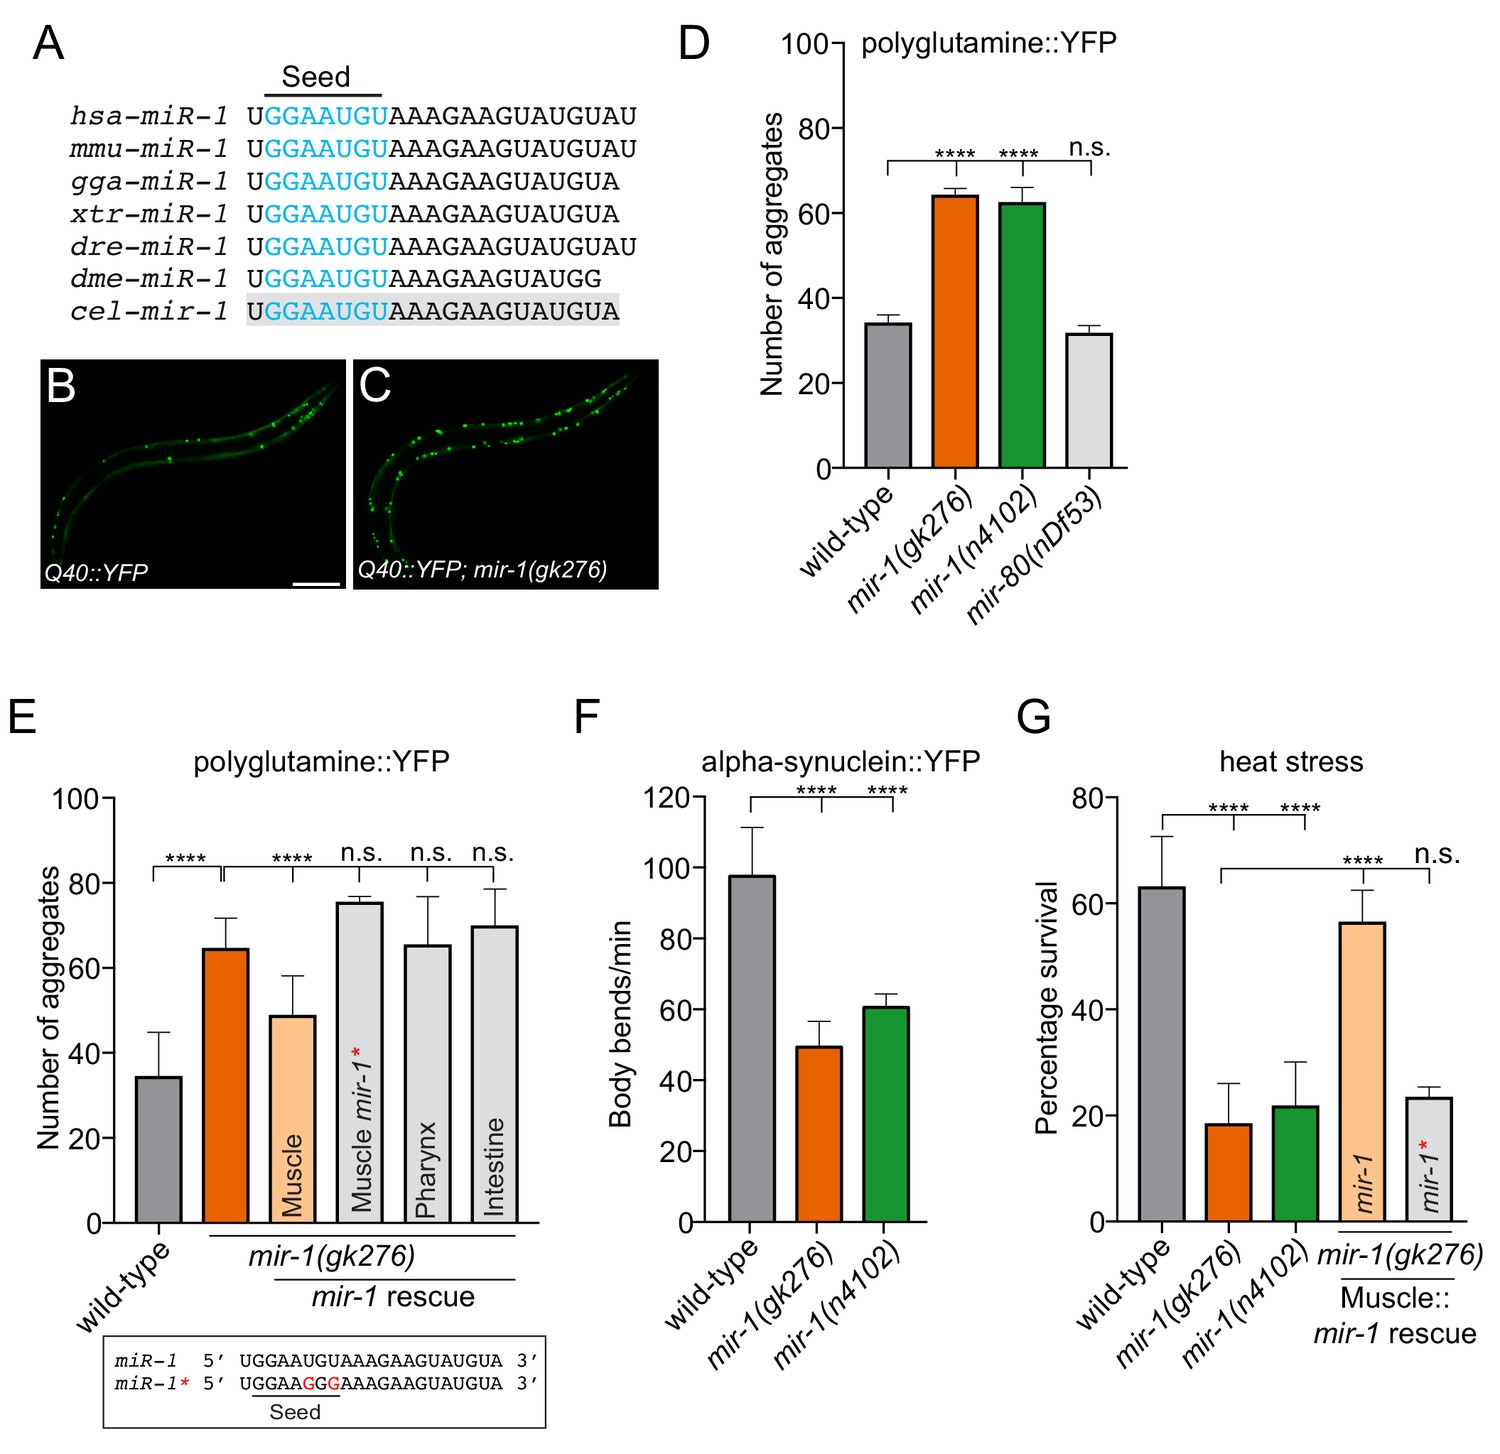
mir-1 protects against proteotoxic stress.
(A) Alignment of mature miR-1 sequences indicates deep conservation. The seed sequence of each miR-1 family member is highlighted in blue and the conservation of C. elegans mir-1 is highlighted in gray. hsa = Homo sapiens, mmu = Mus musculus, gga = Gallus gallus, xtr = Xenopus tropicalis, dre = Danio rerio, dme = Drosophila melanogaster, cel = Caenorhabditis elegans. (B–C) Visualization of Q40::YFP aggregates (green foci) in (B) wild-type and (C) mir-1(gk276) animals. Scale bar, 50 μm. (D) Quantification of Q40::YFP aggregation in wild-type, mir-1(gk276), mir-1(n4102) and mir-80(nDf53) animals. (E) Quantification of Q40::YFP aggregates in wild-type, mir-1(gk276) and mir-1(gk276) animals transgenically-expressing the mir-1 hairpin in body wall muscle (myo-3 promoter), pharynx (myo-2 promoter) or intestine (ges-1 promoter). Mutation of the mir-1 seed sequence (Muscle mir-1*) abrogates rescue from body wall muscle. Mature mir-1 sequences (wild-type mir-1 or mutated mir-1*) used for rescue experiments are shown (box). Red nucleotides indicate the mutations in the seed sequence used in mir-1* rescue experiments, which are predicted to hinder interactions with mir-1 targets. (F) Body bends in wild-type, mir-1(gk276) and mir-1(n4102) mutant animals expressing α-synuclein::YFP. (G) Survival of wild-type, mir-1(gk276) and mir-1(n4102) animals after exposure to 4 hr of 35°C heat stress. Transgenic expression of wild-type mir-1 hairpin, but not mutated mir-1*, in body wall muscle rescues mir-1(gk276) heat stress sensitivity. All experiments were performed in triplicate and at least 10 animals were scored per experiment. Error bars show standard error of the mean (SEM). ****p<0.0001, n.s. not significant to the control (one-way ANOVA analysis, followed by Dunnett’s multiple comparison test).
Figure 1—figure supplement 1
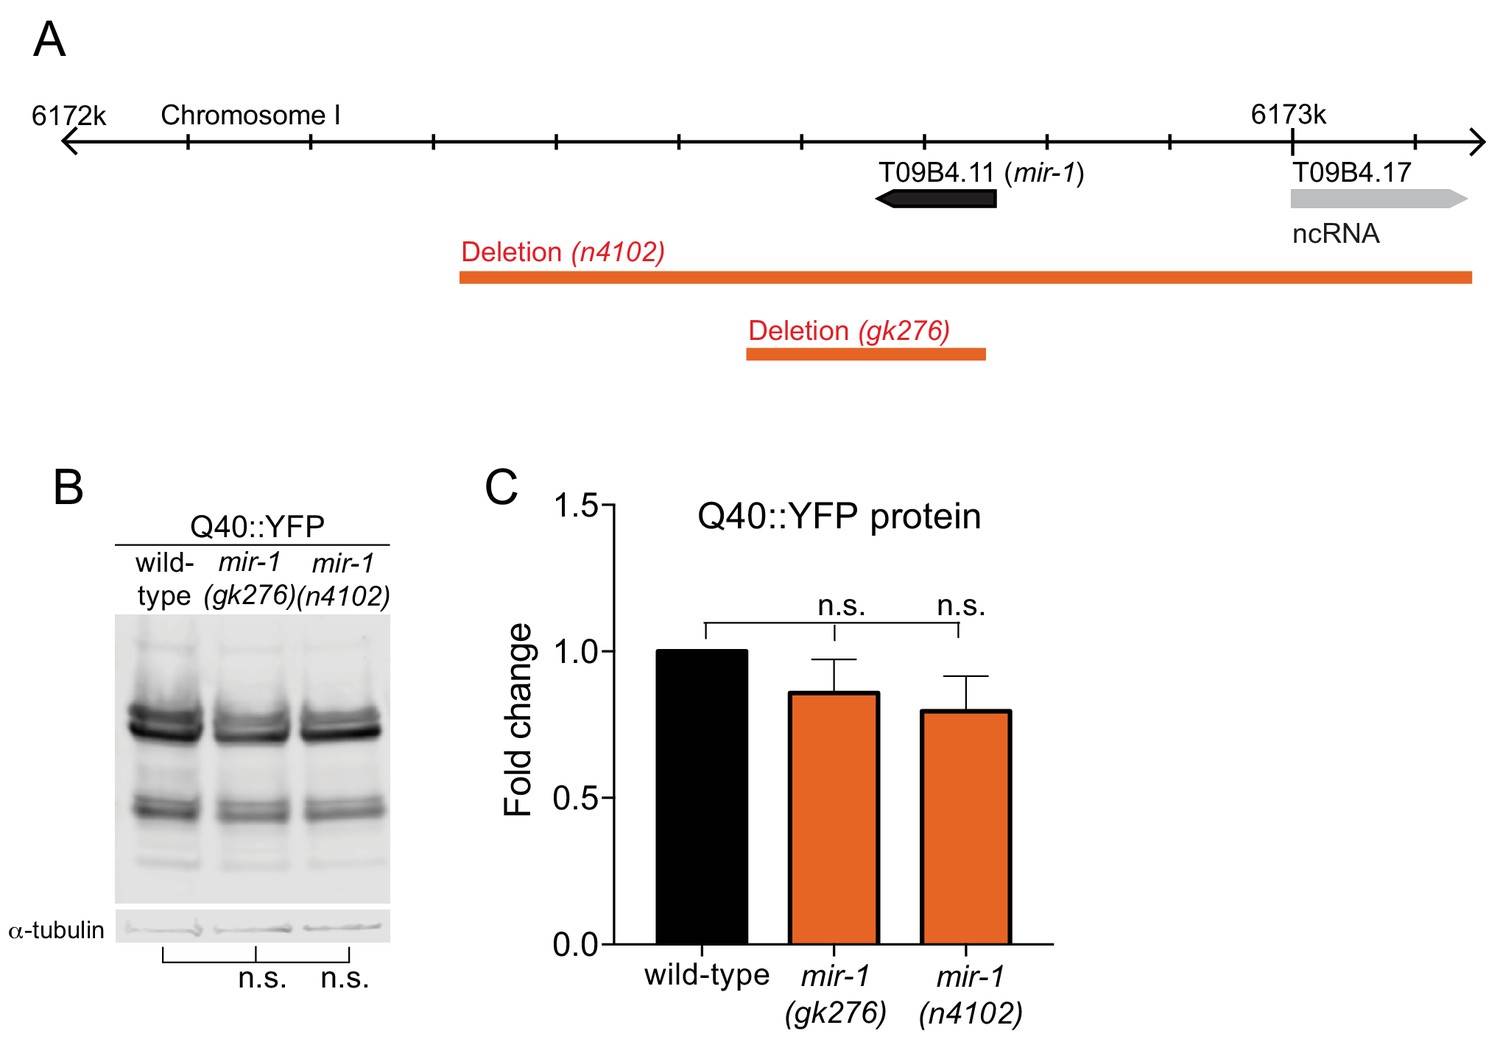
Quantification of Q40::YFP Expression.
(A) Location of mir-1(T09B4.11) on chromosome I, reverse strand of assembly; http://www.wormbase.org, WS258, showing the two deletion strains used in this study, gk276 and n4102 (orange bars). (B–C) WB analysis (B) and quantification (C) of Q40::YFP protein lysates from wild-type, mir-1(gk276) and mir-1(n4102) animals for YFP expression using an α-GFP antibody and α-tubulin antibody as a loading control (n = 3). n.s. not significant (one-way ANOVA analysis, followed by Dunnett’s multiple comparison test).
Figure 1—figure supplement 2
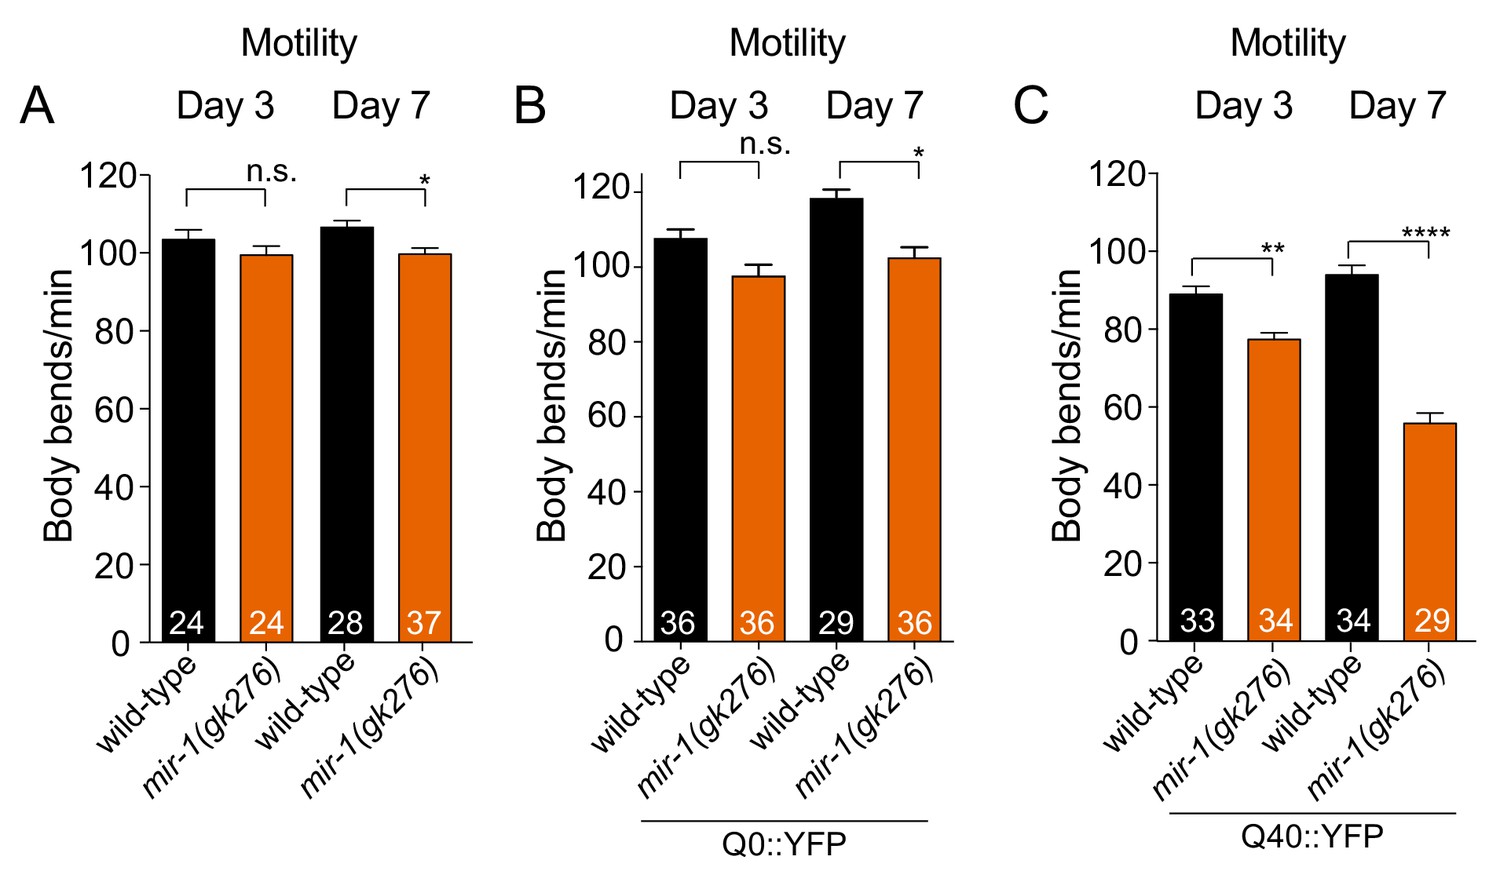
Motility Analysis.
(A–C) Quantification of body bends in wild-type and mir-1(gk276) mutant animals without a transgene (A), expressing the Q0::YFP transgene (B) or expressing the Q40::YFP transgene (C). All experiments were performed in triplicate (number of animals scored are shown in each bar). ± SEM. *p<0.05, **p<0.01, ****p<0.0001, n.s. not significant (one-way ANOVA analysis, followed by Dunnett’s multiple comparison test).
Figure 1—figure supplement 3
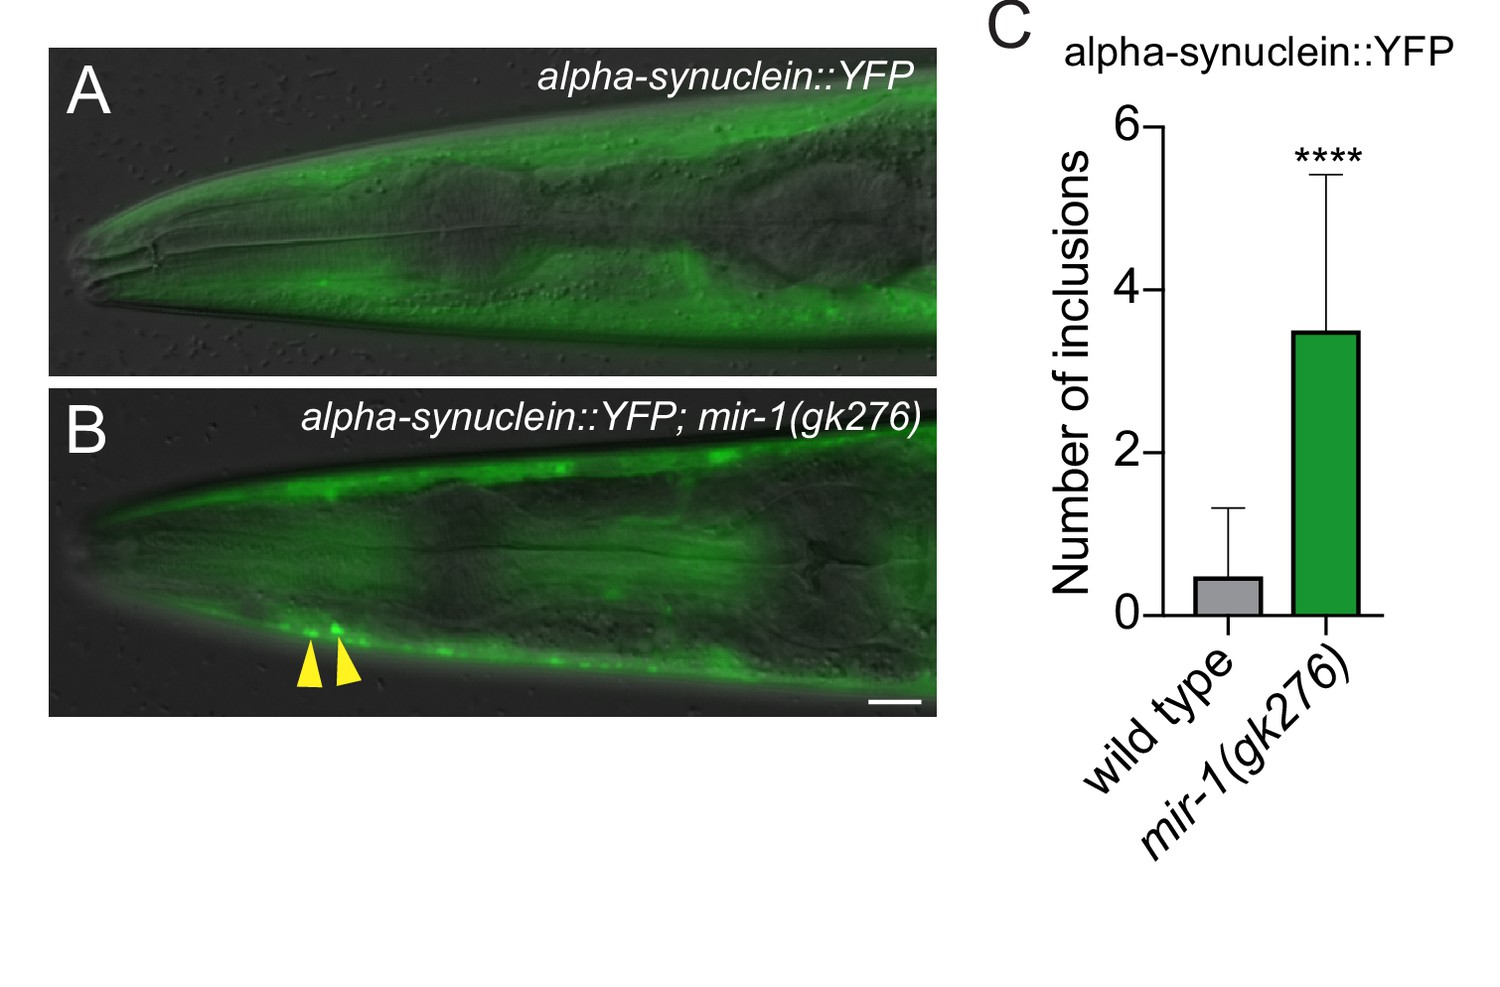
mir-1 prevents the formation of α-synuclein inclusions.
(A–B) Visualization of α-synuclein::YFP inclusions (yellow arrowheads) in (A) wild-type and (B) mir-1(gk276) animals in the first day of adulthood. Scale bar, 50 μm. (C) Quantification of α-synuclein::YFP inclusions in wild-type and mir-1(gk276) animals. n > 25. ± SEM ****p<0.0001 (Welch's t-test).
Figure 1—figure supplement 4
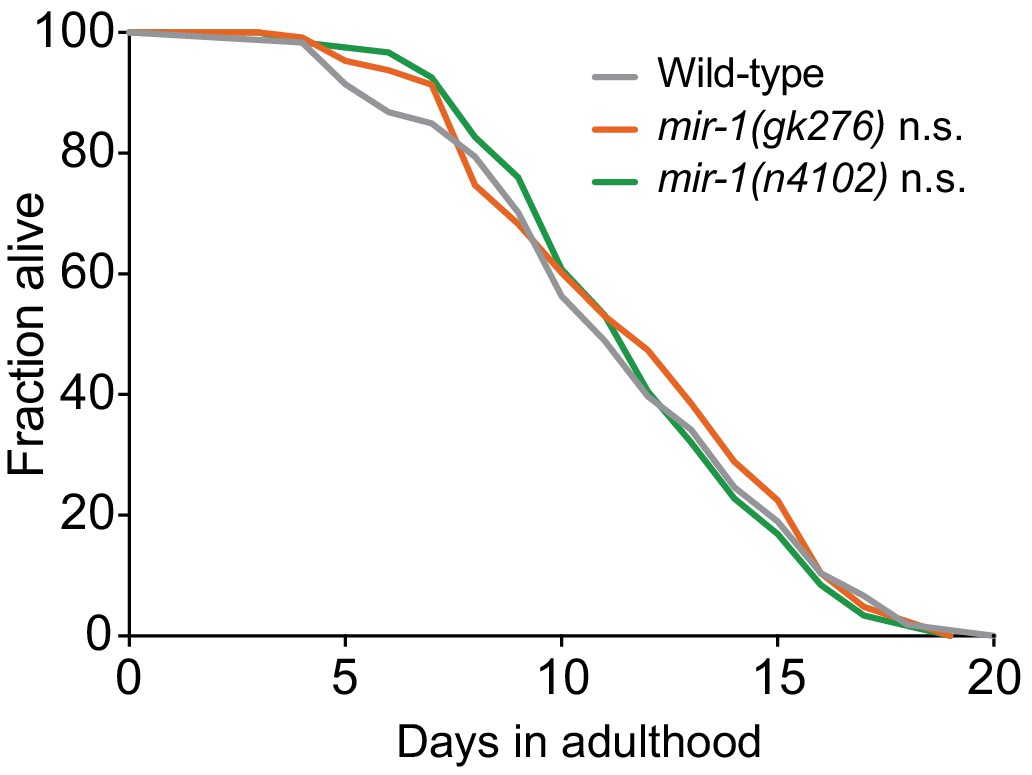
mir-1 Lifespan Analysis.
(A) Lifespan analysis of wild-type (n = 121), mir-1(gk276) (n = 131) and mir-1(n4102) (n = 125) animals. Log-rank (Mantel-Cox) test - n.s. not significant.
Figure 2 with 5 supplements

miR-1 directly regulates TBC 3′UTRs in C. elegans and mammals.
(A) Relative tbc-7 mRNA levels measured by quantitative real-time PCR in L4 larvae. Data normalized to values for wild-type worms. Two independent reference genes (pmp-3 and cdc-42) were used. Error bars show standard error of the mean (SEM) obtained from n = 3 biological replicates and three technical replicates each. **p<0.001, *p<0.005 (one-way ANOVA analysis, followed by Dunnett’s multiple comparison test). (B) Survival of wild-type and mir-1(gk276) animals (incubated on control (L4440) or tbc-7 RNAi bacteria) after exposure to 4 hr of heat stress (35°C) (n = 30). ***p<0.001, n.s. not significant (one-way ANOVA analysis, followed by Dunnett’s multiple comparison test). (C) Predicted mir-1 binding site on the 3′UTR of tbc-7 mRNA (green) and seed sequence in mir-1 (blue). Mutated nucleotides in the tbc-7 3′UTR for experiments (E–F) are in red. (D) Indicated DNA constructs were co-transformed as multi-copy extrachromosomal arrays for experiments in (E–F). (E) Expression of heterologous reporter transgenes for control unc-54 3′UTR (gfp) and wild-type and mutated tbc-7 3′UTR (mCherry) constructs in body wall muscle. (F) Quantification of gfp and mCherry fluorescence of transgenic animals calculated as CTF/total area of fluorophore (n = 30). ****p<0.0001, n.s. not significant (one-way ANOVA analysis, followed by Dunnett’s multiple comparison test). (G) WB of TBC1D15 and α-tubulin and (H) quantified bands from HeLa cells transfected with scrambled (Scr) or miR-1 mimics (n = 5). Data are mean fluorescence intensities ± SEM. **p<0.01 (Students t-test). (I) Predicted miR-1 binding site on the 3′UTR of TBC1D15 mRNA (green) and seed sequence in miR-1 (blue). Mutated nucleotides in the TBC1D15 3′UTR for experiments (L–M) are in red. (J–K) Quantification of flow cytometry analysis of HeLa cells co-expressing scrambled (Scr) or miR-1 mimic together with (J) GFPd2-3′UTR TBC1D15 (n = 4) or (K) mutated GFPd2-3′UTR TBC1D15mutant (n = 5). Data are mean fluorescence intensities ± SEM, **p<0.01 (Students t-test).
Figure 2—figure supplement 1
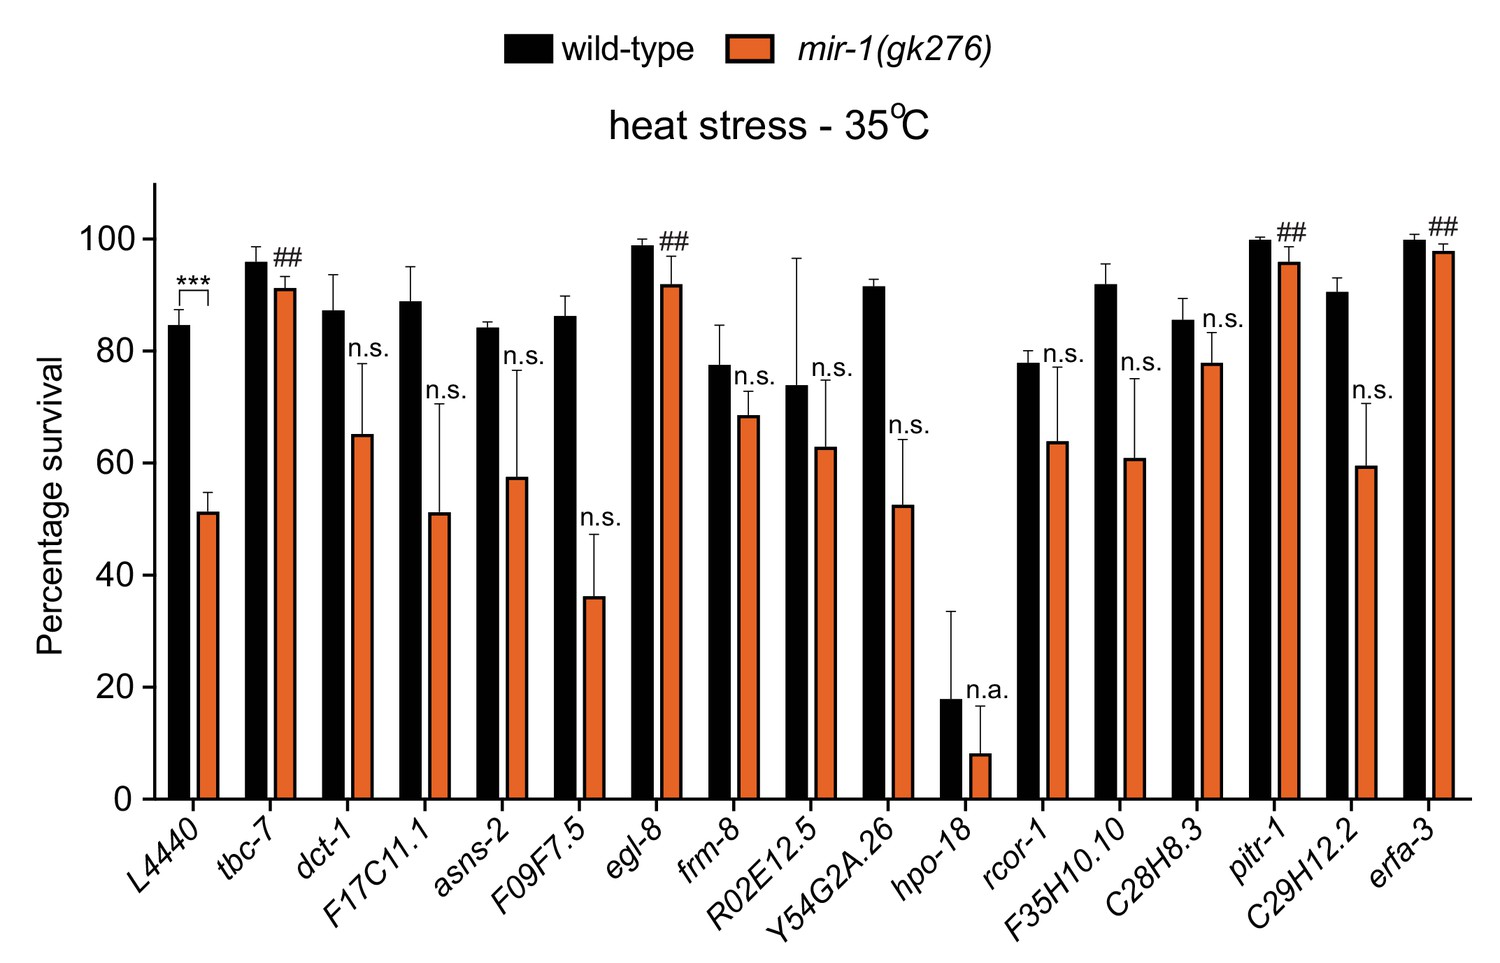
RNAi screen to identify mir-1 targets important for the heat stress response.
Survival of wild-type and mir-1(gk276) animals after exposure to 4 hr of 35°C heat stress. Animals were incubated on RNAi bacteria to reduce expression of predicted mir-1 targets (TargetScanWorm release 6.2). L4440 = control RNAi bacteria. n = 30. ***p<0.001, wild-type compared to mir-1(gk276) on control RNAi bacteria. ##p<0.001 and n.s. not significant when comparing knockdown of predicted mir-1 target to control RNAi in mir-1(gk276) animals (one-way ANOVA analysis, followed by Dunnett’s multiple comparison test). n.a. - hpo-18 RNAi causes lethality in wild-type and mir-1(gk276) animals. All experiments were performed in triplicate.
Figure 2—figure supplement 2
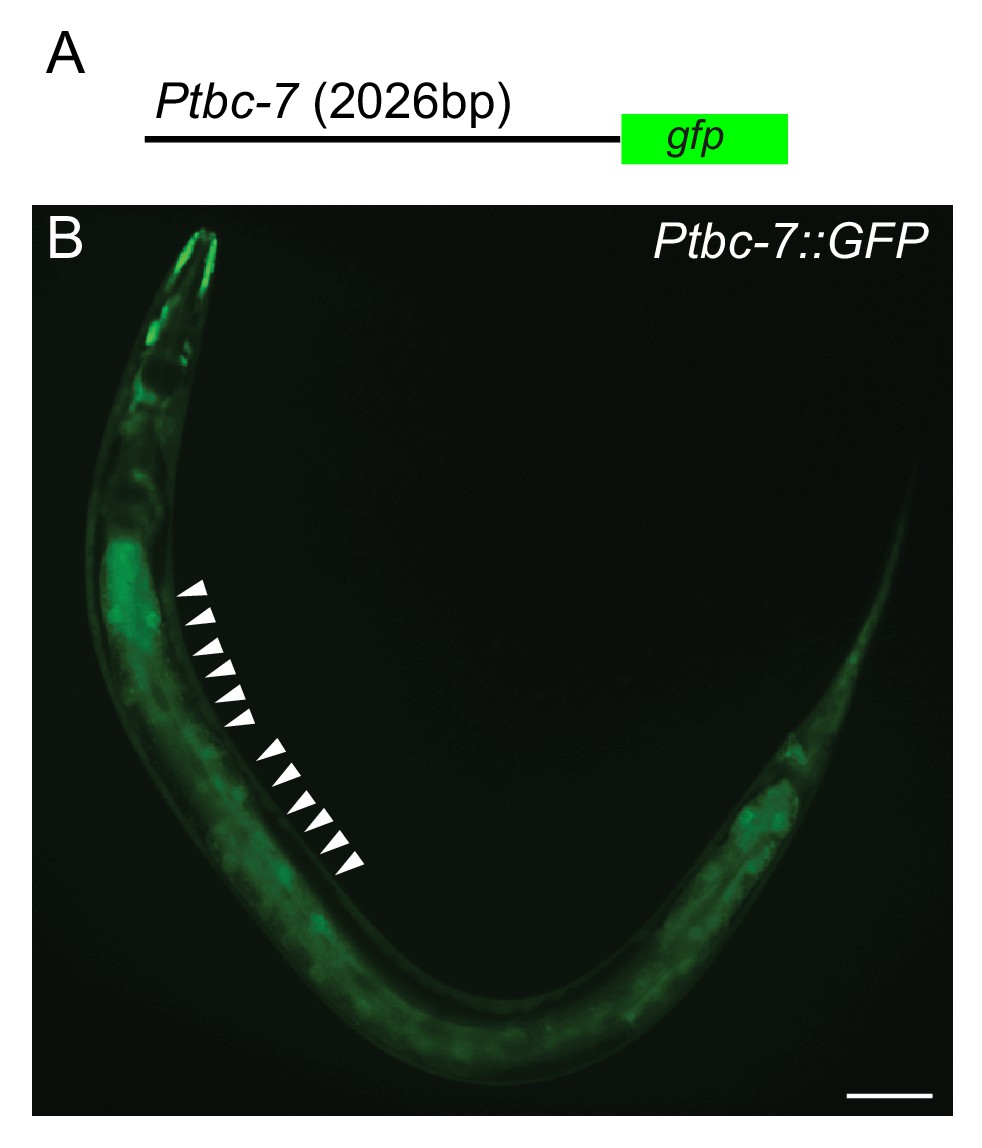
tbc-7 expression pattern.
(A) DNA construct containing a 2026 bp tbc-7 promoter upstream of gfp coding sequence was used to generate an extrachromosomal array to report tbc-7 expression. (B) Expression of gfp controlled by the tbc-7 promoter is detected in the intestine, unidentified head cells and BWM cells (white arrowheads). Scale bar, 20 μm.
Figure 2—figure supplement 3
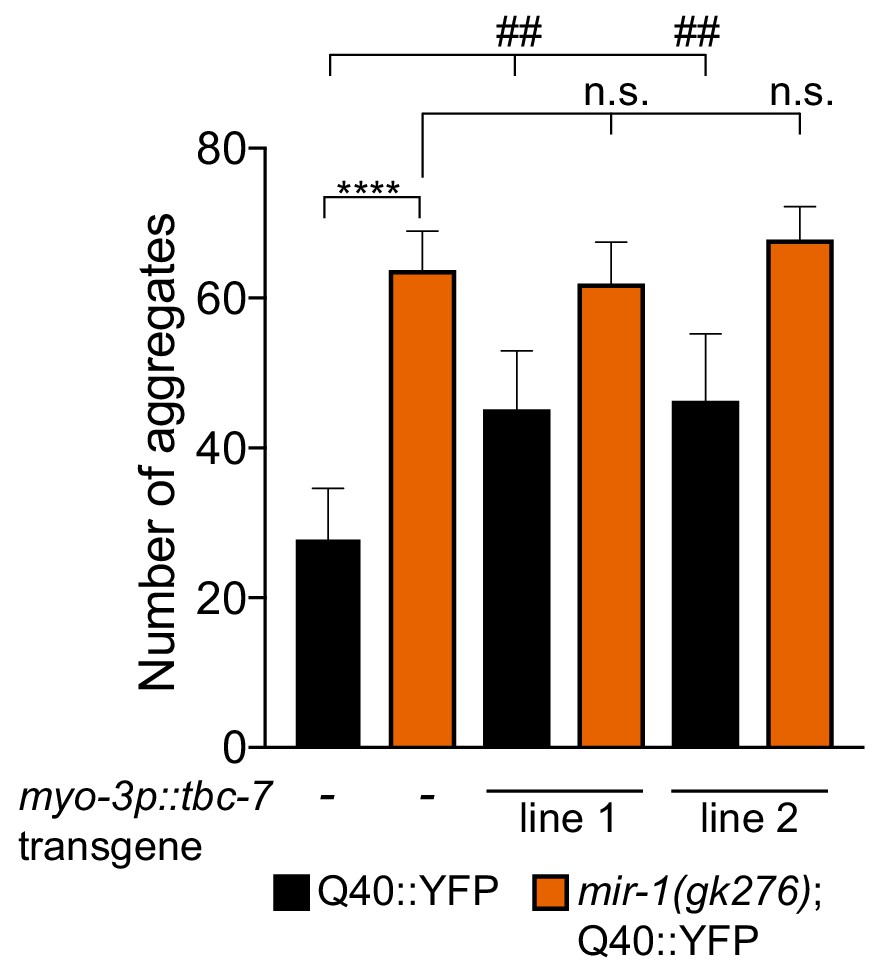
Overexpression of tbc-7 causes Q40::YFP aggregation.
Quantification of Q40::YFP aggregates in wild-type and mir-1(gk276) animals transgenically-expressing tbc-7 cDNA in body wall muscle (myo-3 promoter). Experiments were performed in triplicate (n = 30). Error bars show standard error of the mean (SEM). ****p<0.0001, ## p<0.001 compared to the control and n.s. not significant compared to mir-1(gk276) (one-way ANOVA analysis, followed by Dunnett’s multiple comparison test).
Figure 2—figure supplement 4
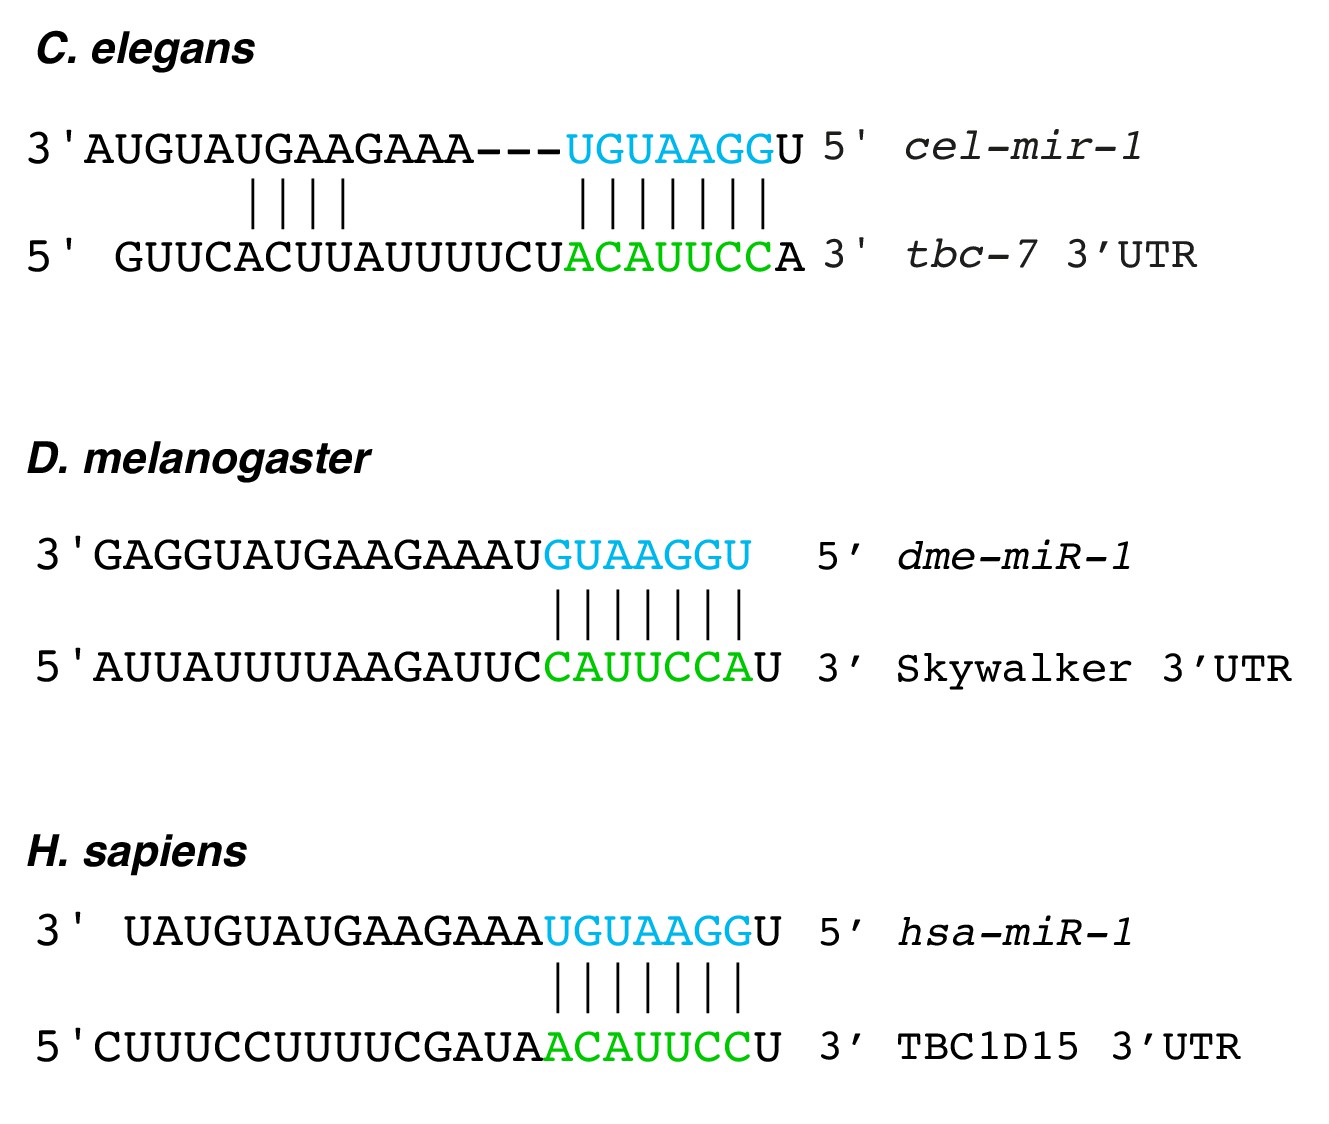
miR-1 targeting of TBC proteins is conserved.
Predicted mir-1 binding sites are found in the 3′UTRs of mRNAs that encode TBC proteins in C. elegans (tbc-7), D. melanogaster (Skywalker) and humans (TBC1D15). This conservation is found in all vertebrate species examined (Targetscan). The mir-1 seed sequences are shown in blue and the predicted tbc-7-related 3′UTRs are shown in green.
Figure 2—figure supplement 5
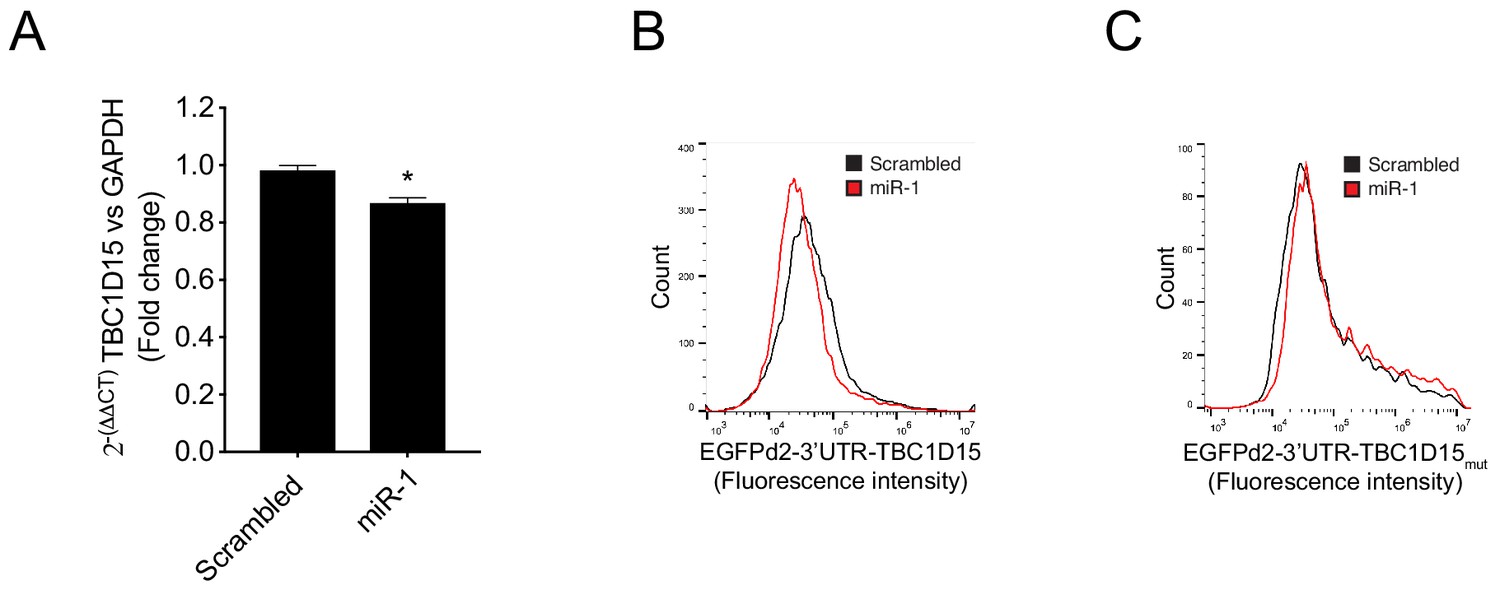
TBC1D15 3′UTR analysis.
(A) Relative TBC1D15 mRNA levels normalized to GAPDH measured by qRT-PCR from HeLa cells expressing scrambled miRNA or miR-1 mimic. Bar graph show fold changes compared to scrambled control ± SEM (n = 3). (B–C) Representative fluorescence intensity histograms from flow cytometry analysis of HeLa cells expressing scrambled miRNA (Scr) or miR-1 mimic together with (B) GFPd2-3′UTR-TBC1D15 or (C) GFPd2-3’UTR-TBC1D15 containing mutated miR-1 target sequence. Quantification of these histogram data is shown in Figure 2J–K. Wild-type hsa TBC1D15 3’UTR = 5′-CUUUCCUUUUCGAUAACAUUCCU-3′ and mutated hsa TBC1D15 3’UTR = 5′-CUUUCCUUUUCGAUAAAAUUACU-3′.
Figure 3 with 1 supplement
mir-1 and tbc-7 control stress-induced autophagy.
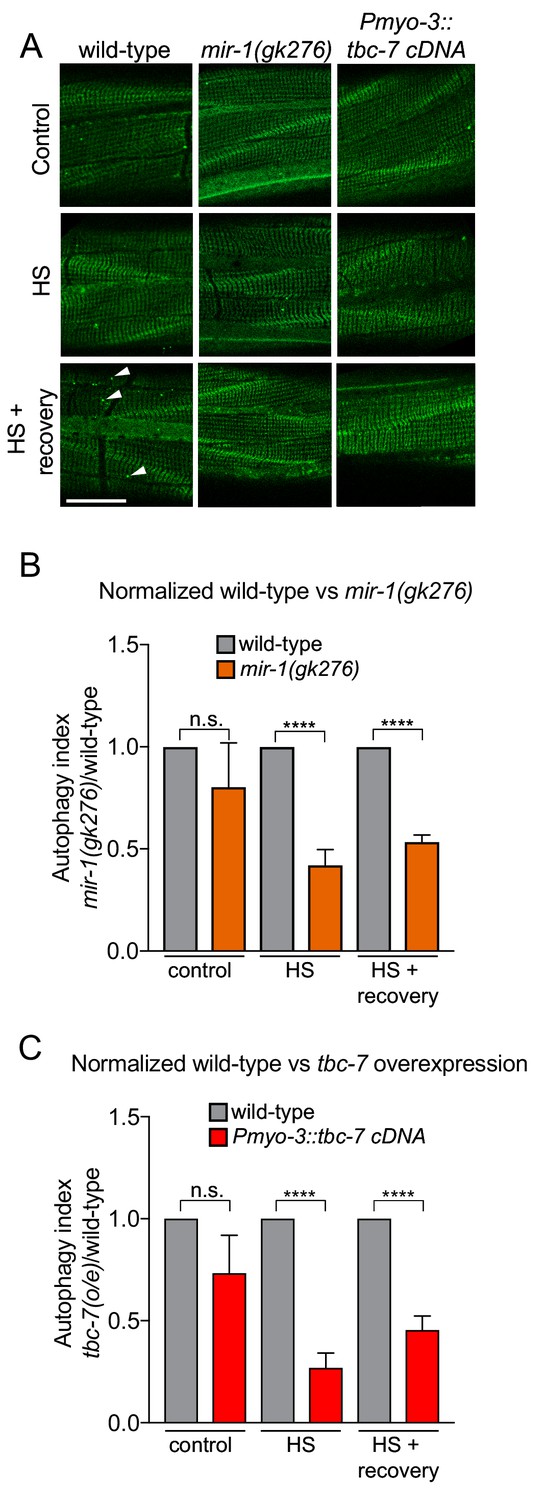
(A) Fluorescent images of BWM expressing GFP::LGG-1/Atg8 in wild-type, mir-1(gk276) and Pmyo-3::tbc-7 overexpressing animals under control conditions, immediately after heat shock for 1 hr at 35°C (HS) or 1 hr after recovery from heat shock at 15°C (HS + recovery). GFP::LGG-1 puncta = arrowheads. Scale bar, 10 μm. (B–C) Quantification of GFP::LGG-1/Atg8 puncta in BWM of animals and conditions shown in (A). The values represent the number of green puncta in mir-1(gk276) (B) and Pmyo-3::tbc-7 overexpressing (C) animals normalized to one green puncta in wild-type animals for each condition. n > 15. ± SEM ****p<0.0001, n.s. not significant (Welch's t-test).
Figure 3—figure supplement 1
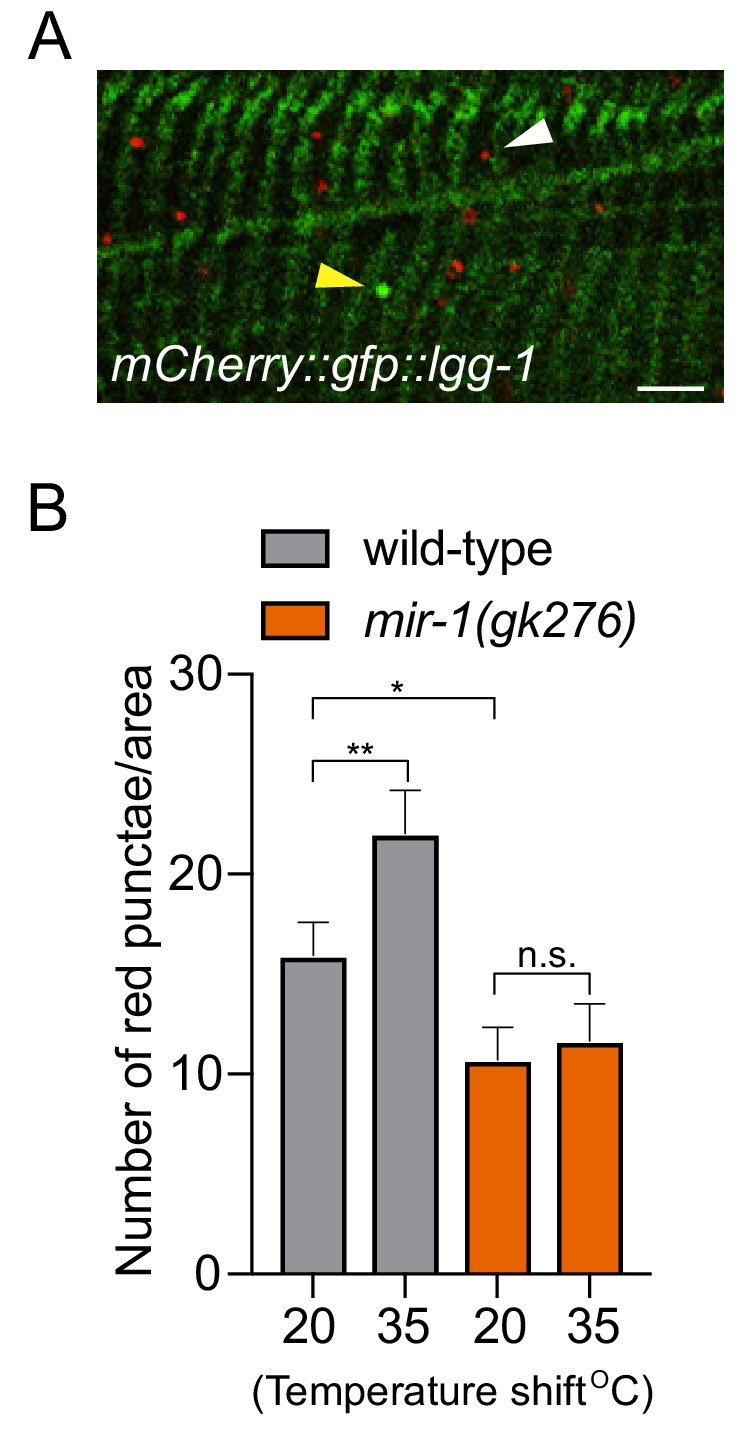
mir-1 controls stress-induced autophagy.
(A) Fluorescent image of BWM expressing mCherry::GFP::LGG-1 in wild-type animals. Yellow arrowhead = autophagosome and white arrowhead = autolysosome. Scale bar, 10 μm. (B) Quantification of autolysosomes in BWM of wild-type and mir-1(gk276) animals incubated at 20°C and then shifted for 1 hr at 35°C. The values represent the mean number of red puncta (autolysosomes). n > 15. ± SEM ****p<0.0001, n.s. not significant (Welch's t-test).
Figure 4 with 2 supplements
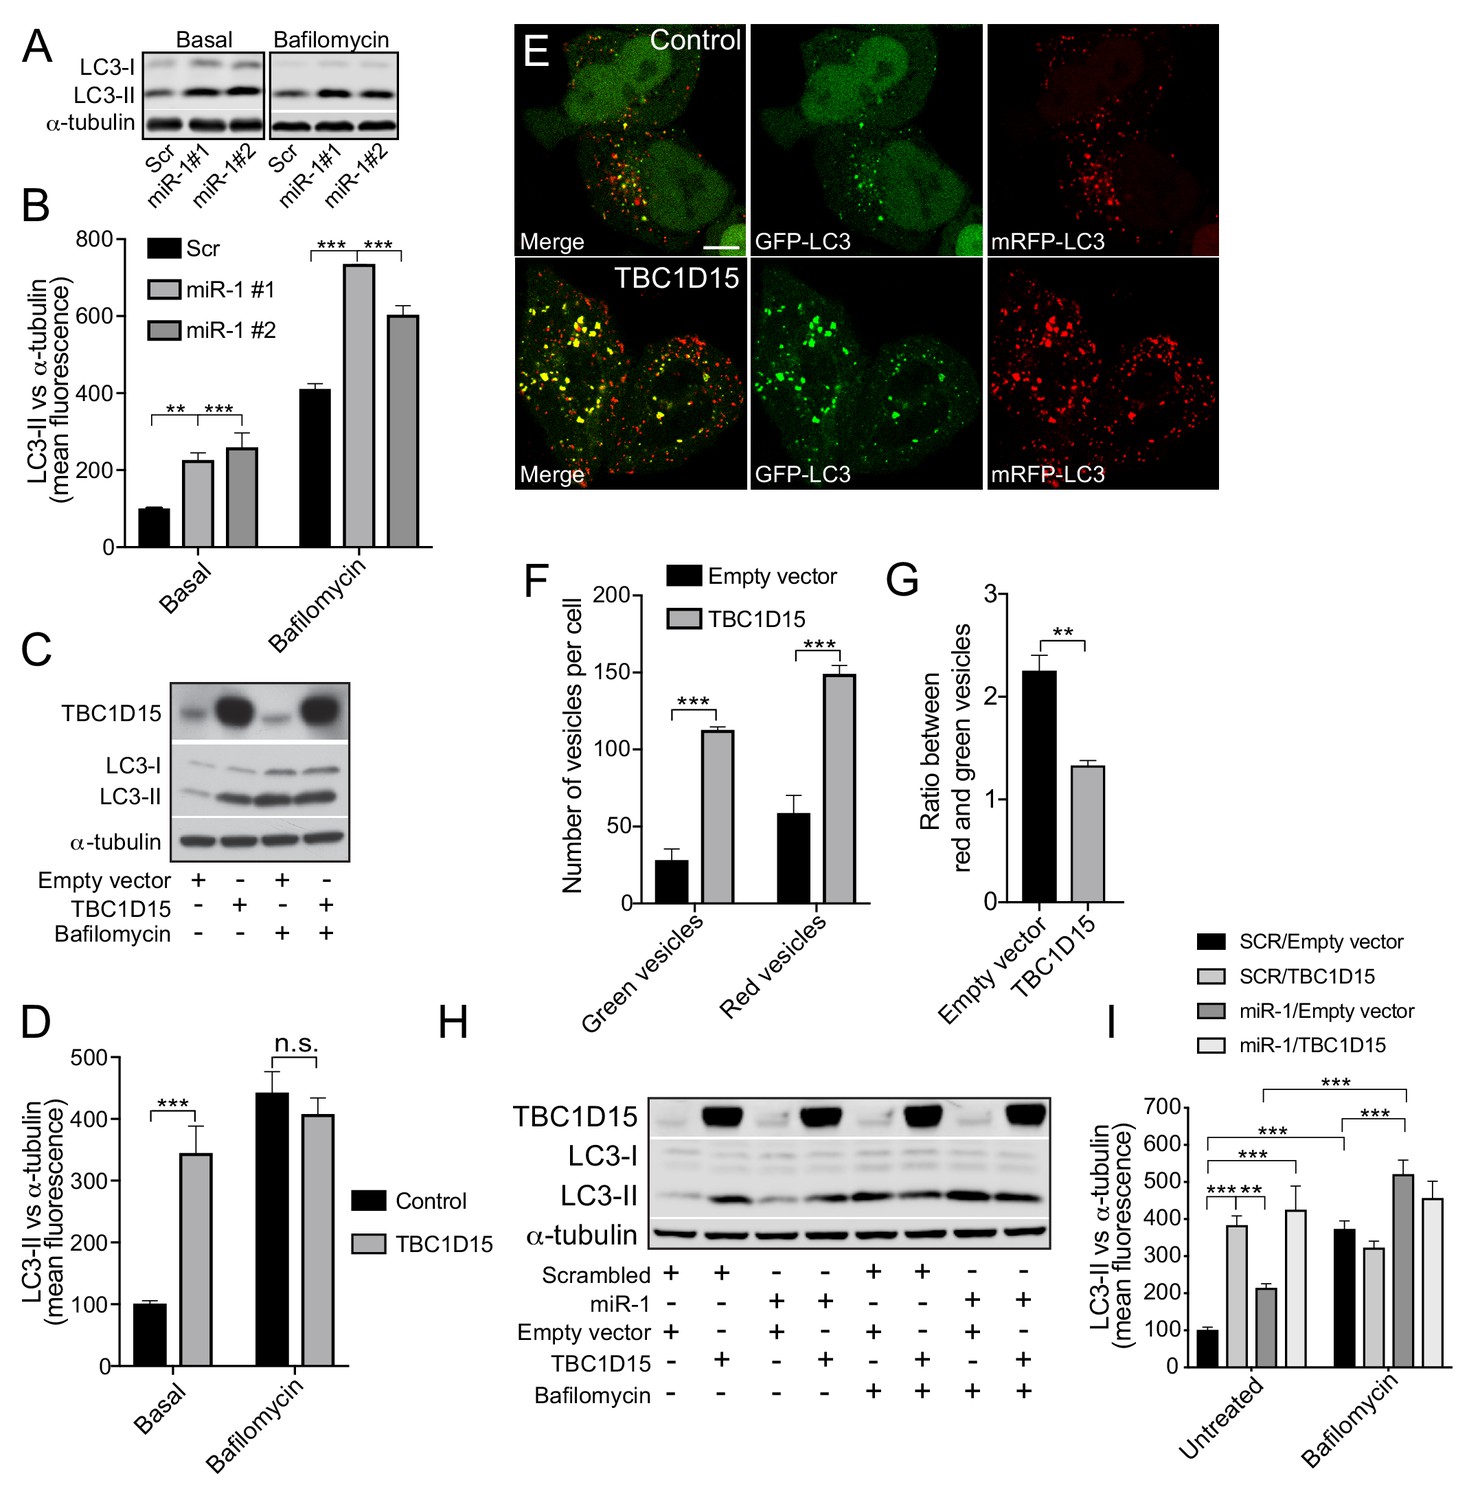
Human miR-1 regulates autophagy by controlling TBC1D15 expression.
(A) WB and (B) quantification of LC3-II normalised to α-tubulin from HeLa cells expressing Scr or miR-1 mimics +/- bafilomycin. Data are mean fluorescence intensities of bands ± SEM (n = 3–5). **p<0.01, ***p<0.001 (one-way ANOVA with Dunnett’s correction). (C) WB and (D) quantification of LC3-II normalised to α-tubulin from HeLa cells expressing empty vector (control) or TBC1D15 overexpression vector +/- bafilomycin. Data are mean fluorescence intensities of bands ± SEM normalised to α-tubulin (n = 5). n.s. not significant to the control, ***p<0.001 (two-way ANOVA with Bonferroni correction). (E) IF images of HeLa cells stably expressing mRFP-GFP-LC3 and transfected with empty vector (control) or TBC1D15 overexpression vector. Scale bar, 10 μm. (F) Quantification of green and red vesicles and (G) red/green vesicle ratio from (E) ± SEM (n = 3, 12–14 cells per replicate). **p<0.01, ***p<0.001 (Student’s t-test). (H) WB and (I) quantification of HeLa cells co-transfected with Scr or miR-1 mimic together with empty vector or TBC1D15 overexpression vector +/- bafilomycin. Data are mean fluorescence intensities of LC3-II bands normalized to α-tubulin ± SEM (n = 7). **p<0.01, ***p<0.001 (two-way ANOVA with Bonferroni correction).
Figure 4—figure supplement 1
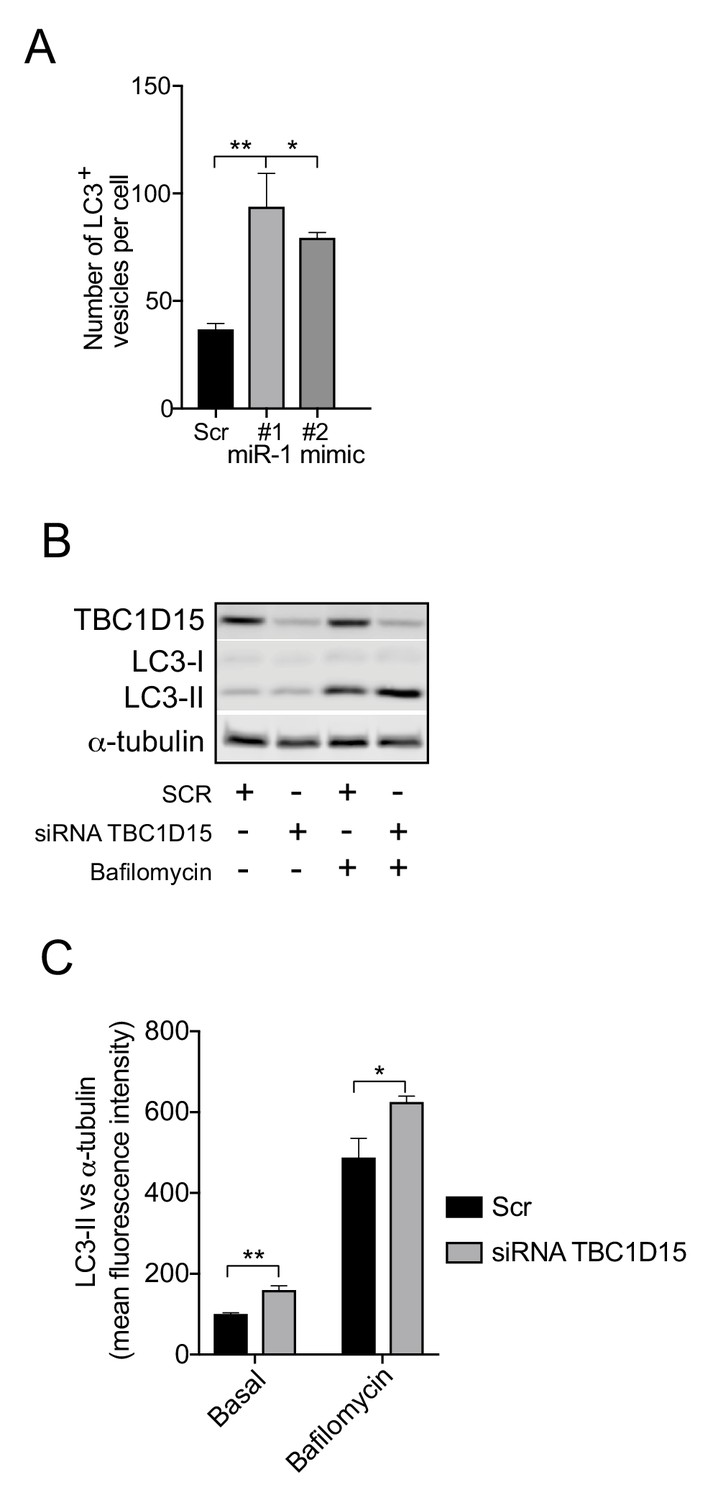
miR-1 and TBC1D15 control autophagy.
(A) Quantification of the mean number of LC3-positive vesicles per HeLa cell ± SEM expressing scrambled miRNA (Scr) or independent miR-1 mimics immunostained with antibodies against LC3 (n = 3). *p<0.05, **p<0.01 (one-way ANOVA with Dunnett’s correction). (B) WB of HeLa cells transfected with Scr siRNA or siRNA against TBC1D15 in the presence or absence of bafilomycin (400 nM for 4 hr). (C) Mean fluorescence intensities of LC3-II WB bands ± SEM normalized to α-tubulin (n = 4). *p<0.05, **p<0.01 (Student’s t-test).
Figure 4—figure supplement 2

miR-1 overexpression induces autophagy flux.
(A) IF images of HeLa cells stably expressing mRFP-GFP-LC3 and transfected with scrambled miRNA (Scr) or miR-1 mimic. Scale bar, 10 μm. (B) Quantification of mean number of green and red vesicles per cell and (D) the red/green vesicle ratio ± SEM (n = 4). **p<0.01, ***p<0.001 (Student’s t-test).
Figure 5 with 1 supplement

miR-1 reduces mutant Huntingtin aggregation through the autophagy pathway.
(A) Quantification of the percentage of cells containing HTT-positive aggregates co-expressing scrambled (Scr) or miR-1 mimics with EGFP-HTTQ74 for 48 hr ± SEM (n = 3, 200–400 cells per replicate). ***p<0.001 (one-way ANOVA). (B) CRISPR/Cas9 ATG16L1 knockout HeLa cells co-expressing scrambled (Scr) or miR-1 mimics with EGFP-HTTQ74 for 48 hr. Quantification of the percentage of cells containing HTT-positive aggregates ± SEM (n = 3, 200–400 cells per replicate). *p<0.05 (Student’s t-test), n.s. not significant (one-way ANOVA). (C–E) Quantification of the percentage of cells containing HTT-positive aggregates in HeLa cells co-expressing EGFP-HTTQ74 with (C) scrambled (Scr) or siRNA against TBC1D15 for 48 hr (n = 4, 200–400 cells per replicate), (D) empty or TBC1D15 overexpression vector for 24 hr (n = 3, 200–400 cells per replicate), or (E) a combination of Scr or miR-1 mimic together with empty or TBC1D15 overexpression vector for 48 hr (n = 6, 200–400 cells per replicate) ± SEM. (C–D) *p<0.05, **p<0.005, n.s. not significant (Student’s t-test) or (E) (two-way ANOVA with Dunnett’s correction).
Figure 5—figure supplement 1

miR-1 overexpression reduces HTTQ74 accumulation IF images of HeLa cells co-expressing scrambled miRNA (Scr) or independent miR-1 mimics with EGFP-HTTQ74 stained with antibodies against LC3 (red), phalloidin (blue), and DAPI (gray).
Scale bar, 10 μm.
Figure 6 with 3 supplements
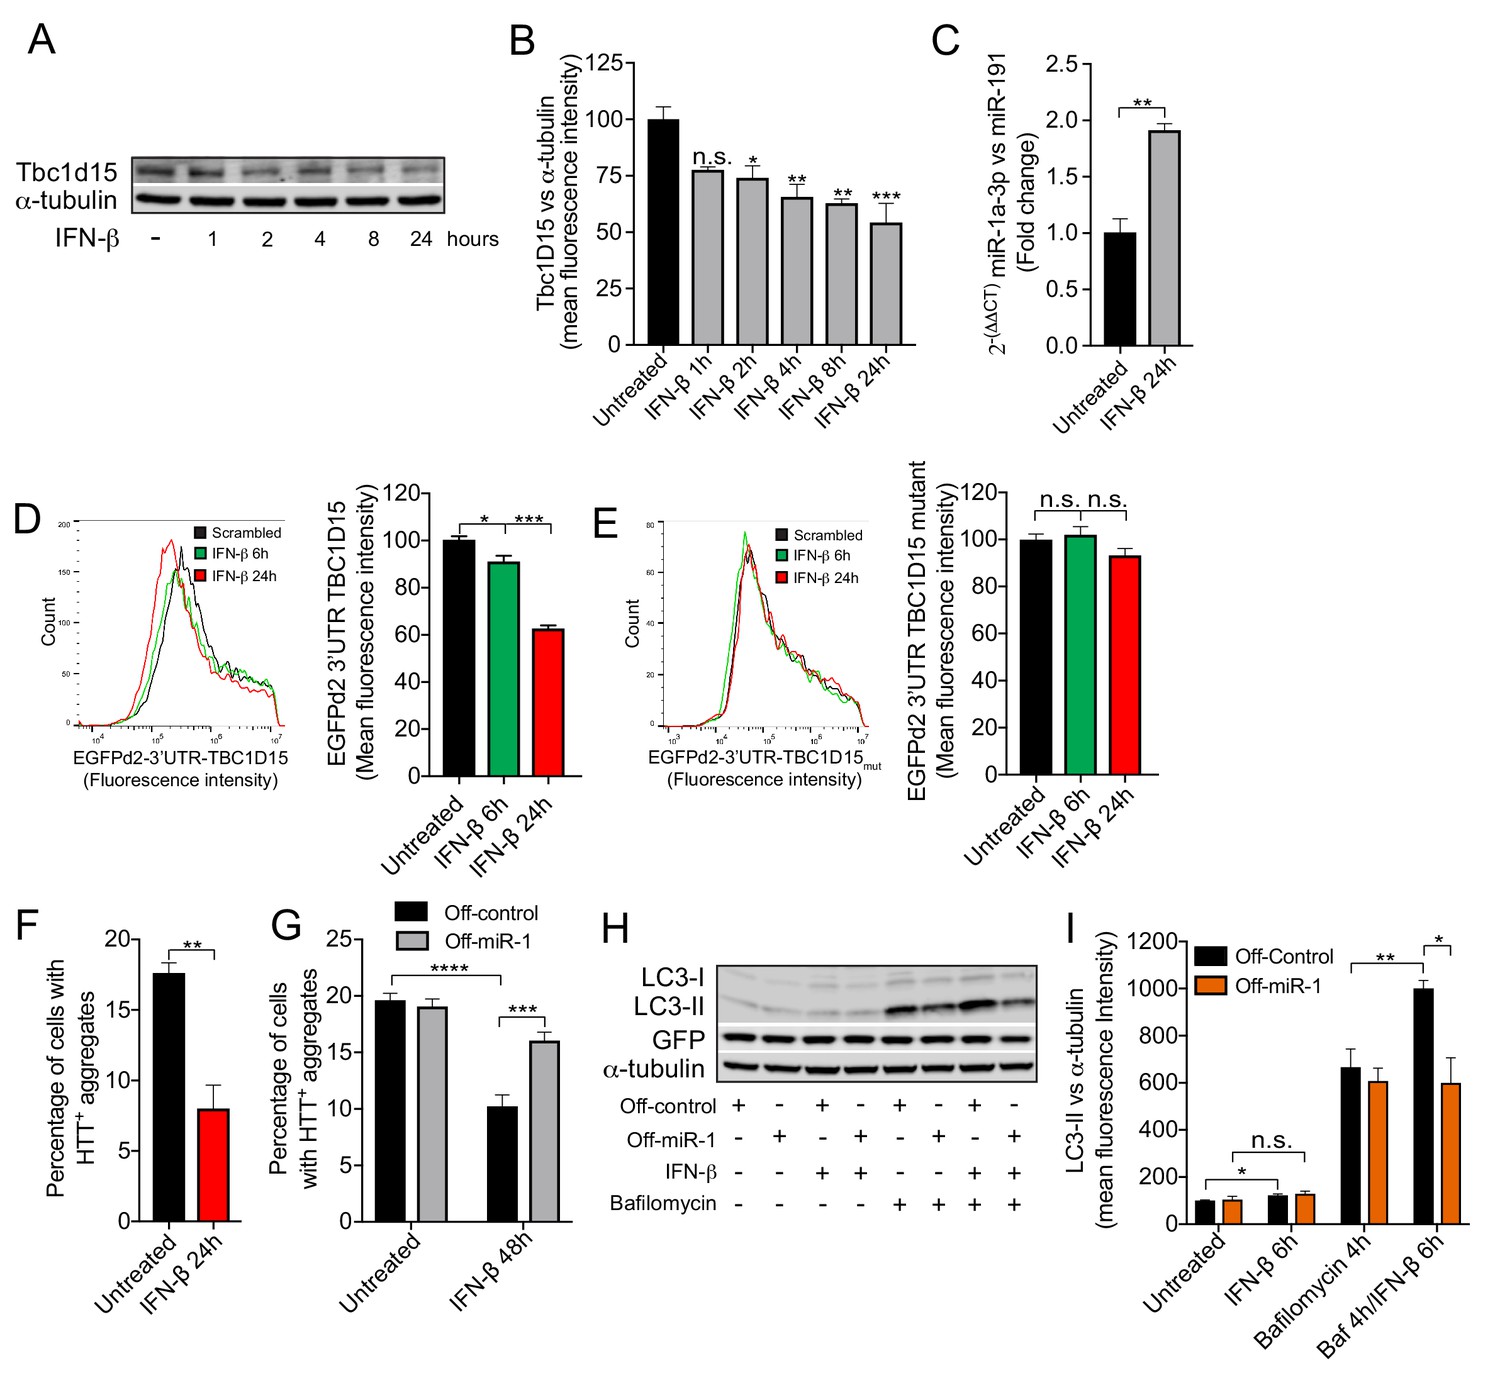
IFN-β induction of miR-1 controls mutant Huntingtin aggregation.
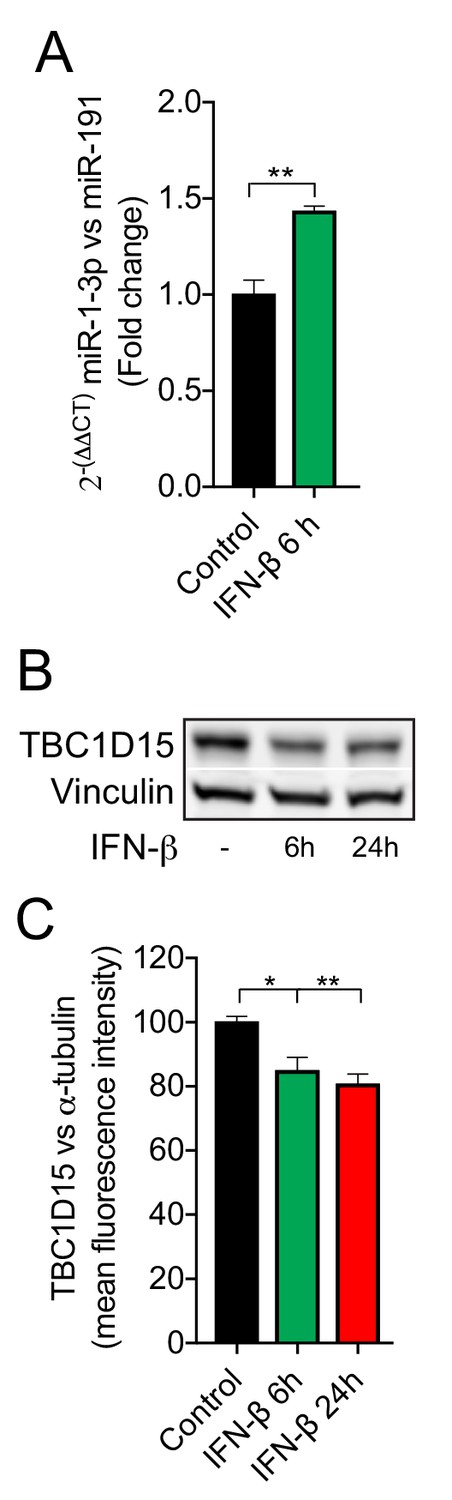
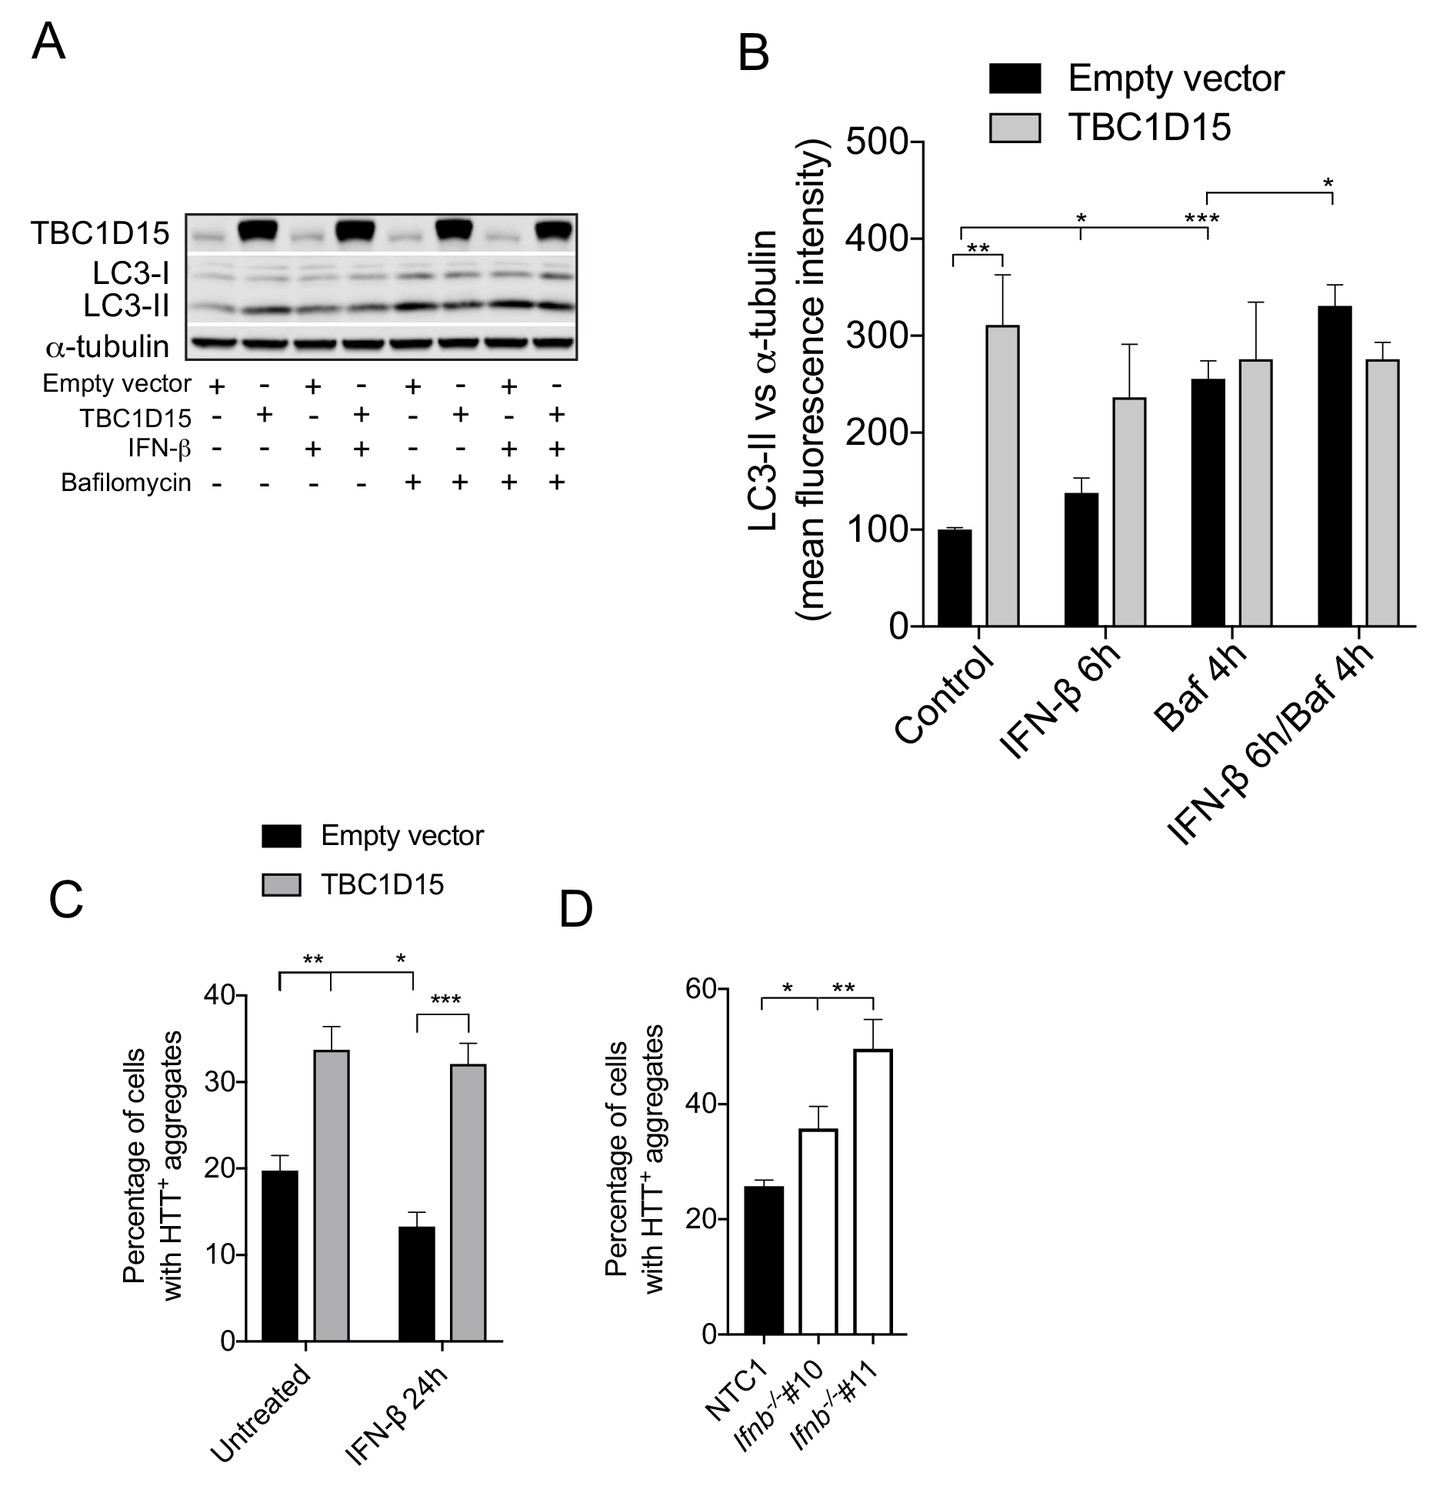
(A) WB and (B) quantification of Tbc1d15 normalized to α-tubulin of cortical neurons from mice treated with recombinant mouse IFN-β (100 U/ml) for 1–24 hr (n = 4). Data are mean fluorescence intensities of bands ± SEM. n.s. not significant to the control, *p<0.05, **p<0.01, ***p<0.001 (one-way ANOVA). (C) RT-PCR of miR-1a-3p normalized to miR-191 from mouse cortical neurons treated with recombinant mouse IFN-β (100 U/ml) for 24 hr (n = 3). **p<0.01 (Student’s t-test). (D–E) Flow cytometry analysis of HeLa cells expressing (D) GFPd2-3′UTR TBC1D15 (n = 4) or (E) mutated GFPd2-3′UTR TBC1D15mutant (n = 5) treated with recombinant human IFN-β (1000 U/ml) for 6 or 24 hr. Data are presented as fluorescence intensity histograms and bar graphs showing mean fluorescence intensities ± SEM. *p<0.05, ***p<0.0001 (one-way ANOVA). (F) Quantification of HTTQ74 aggregates in HeLa cells expressing EGFP-HTTQ74 treated with recombinant human IFN-β (1000 U/ml) for 24 hr. Graph shows percentage of cells containing EGFP-HTTQ74-positive aggregates (n = 4, 400 cells per replicate) ± SEM. **p<0.01 (Student’s t-test). (G) Quantification of HTTQ74 aggregates in HeLa cells expressing GFP-Off-control or GFP-Off-miR-1 (miR-1 hairpin inhibitor) with EGFP-HTTQ74 and treated with recombinant human IFN-β (1000 U/ml) for 48 hr. Graph represents percentage of cells containing EGFP-HTTQ74-positive aggregates (n = 5, 400 cells per replicate) ± SEM. ***p<0.001, ****p<0.0001 (two-way ANOVA with Bonferroni correction). (H) WB of LC3, GFP and α-tubulin and (I) quantification of LC3-II normalized to α-tubulin from HeLa cells stably expressing GFP-Off-Control and GFP-Off-miR-1 treated with recombinant human IFN-β (1000 U/ml) for 6 hr, bafilomycin (400 mM) for 4 hr or in combination (n = 4) ± SEM. *p<0.05, **p<0.01, n.s. not significant (Student’s t-test).
Figure 6—figure supplement 1
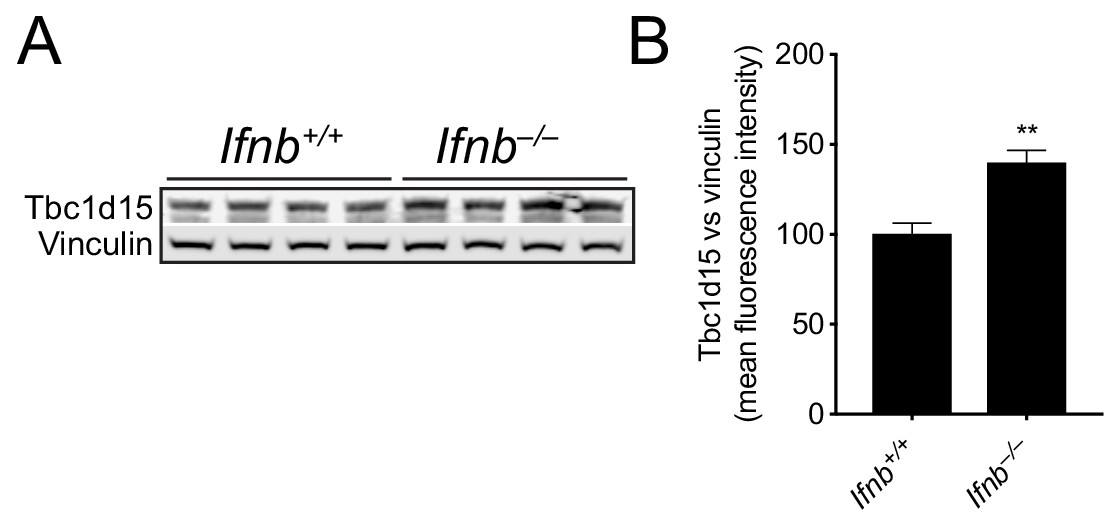
IFN-β regulates TBC1D15 expression the mouse brain.
(A) WB and (B) quantification of Tbc1d15 (normalized to vinculin) in the brain of wild-type (Ifnb+/+) and Ifnb–/– 3 month old male mice (n = 4). Data are mean fluorescence intensities of bands ± SEM. **p<0.01 (Student’s t-test).
Figure 6—figure supplement 2
IFN-β regulates miR-1 and TBC1D15 expression in HeLa cells.
(A) RT-PCR of miR-1–3 p normalized to miR-191 from HeLa cells treated with recombinant human IFN-β (1000 U/ml) for 6 hr (n = 3). **p<0.01 (Student’s t-test). (B) WB and (C) quantification of TBC1D15 bands normalised to vinculin from HeLa cells treated with recombinant human IFN-β for 6 or 24 hr (n = 4). Data are mean fluorescence intensities ± SEM. *p<0.05, **p<0.01 (one-way ANOVA).
Figure 6—figure supplement 3
TBC1D15 overexpression abrogates IFN-β-induced reduction of HTTQ74 aggregates.
(A) WB of TBC1D15, LC3 and α-tubulin in HeLa cells expressing empty or TBC1D15 overexpression vector, treated with recombinant human IFN-β (1000 U/ml) for 6 hr, bafilomycin (400 mM) for 4 hr, or a combination of both. (B) Quantification of mean fluorescence intensities of LC3-II bands from (A) (n = 4) ± SEM. *p<0.05, **p<0.01 ***p<0.001 (Student’s t-test). (C) HeLa cells co-expressing EGFP-HTTQ74 with either empty or TBC1D15 overexpression vector with or without recombinant human IFN-β treatment (1000 U/ml) for 24 hr. Graph represents percentage of cells containing EGFP-HTTQ74-positive aggregates ± SEM. *p<0.05, **p<0.01 ***p<0.001 (Student’s t-test). (D) Neuronally differentiated N2A cells with non-targeting control-1 (NTC1) or Ifnb CRISPR/Cas9 knockout co-expressing EGFP-HTTQ74. Graph represents percentage of cells containing EGFP-HTTQ74-positive aggregates (n = 3) ± SEM. *p<0.01, **p<0.001 (Student’s t-test).
Figure 7
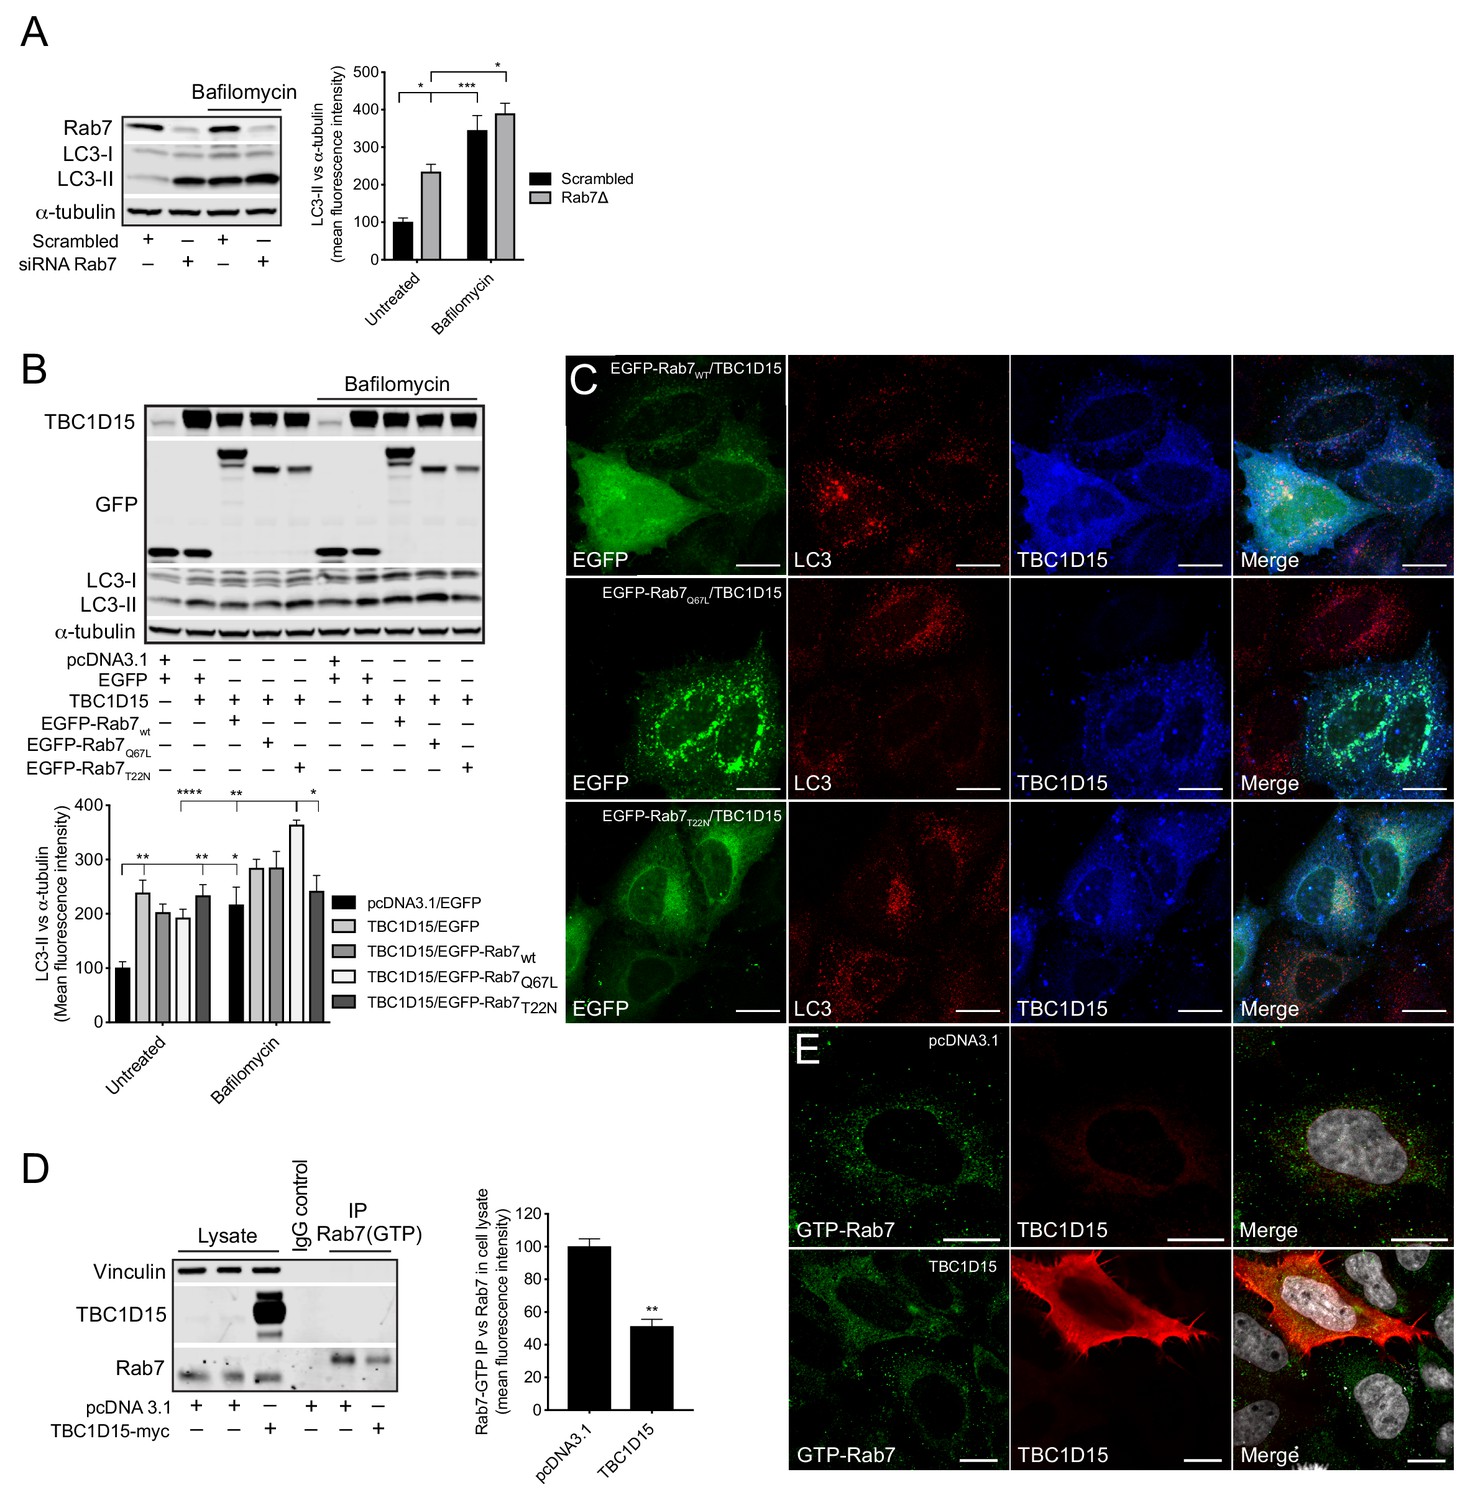
TBC1D15 reduces GTP-bound Rab7.
(A) WB and quantification of LC3-II from HeLa cells transfected with scrambled siRNA or siRNA against Rab7 (Rab7Δ) +/- bafilomycin (4 hr, 400 nM). Data are mean fluorescence intensities of bands ± SEM normalised to α-tubulin (n = 3). *p<0.05, ***p<0.001 (two-way ANOVA). (B) WB and quantification of LC3-II normalised to α-tubulin from HeLa cells co-expressing pcDNA3.1 and EGFP, or TBC1D15 with either EGFP, pIRESneo-myc--Rab7wt, EGFP-Rab7Q67L, or EGFP-Rab7T22N for 24 hr before treatment with bafilomycin (4 hr, 400 nM). Data are mean fluorescence intensities of bands ± SEM normalised to α-tubulin (n = 6). *p<0.05, **p<0.01, ***p<0.001 (two-way ANOVA). (C) Immunofluorescence (IF) images of HeLa cells co-expressing TBC1D15 with pIRESneo-myc-Rab7wt, EGFP-Rab7Q67L or EGFP-Rab7T22N stained with antibodies against LC3 and TBC1D15. Scale bars, 10 μm. (D) WB showing immunoprecipitation (IP) of GTP-bound (active) Rab7 from HeLa expressing pcDNA3.1 or TBC1D15. Data are mean fluorescence intensities of GTP-bound Rab7 (IP) normalized to the endogenous level of Rab7 (cell lysate) ± SEM (n = 3). **p<0.01 (Student’s t-test). (E)IF of HeLa cells expressing empty vector or TBC1D15 stained with antibodies against GTP-bound Rab7, TBC1D15 and DAPI. Scale bar, 10 μm.
Author response image 1

HeLa expressing scrambled or miR-1.
(A) WB of SQSTM1/p62 and (B) qPCR of SQSTM1/p62.
Videos
Video 1
Autophagy flux in cells expressing an empty (control) vector.
HeLa cells stably expressing mRFP-GFP-LC3 were transfected with empty vector (Video 1) or TBC1D15 overexpression vector (Video 2) and live cell imaging was conducted the following day. Notice the presence of large immobile mRFP- and GFP-positive autophagosomes in TBC1D15 overexpressing cells, implying a block in autophagosome maturation. Cells were imaged once every second for a period of 2 min and the movies are displayed at a speed of 10 frames per second.
Video 2
TBC1D15 overexpression causes large stationary autophagosomes.
Additional files
-
Supplementary file 1
Predicted C. elegans mir-1 target genes.
Predicted mir-1 target genes (TargetScanWorm release 6.2) showing the number and type of putative conserved mir-1 binding sites in their 3′UTRs. Aggregate PCT = probability of conserved targeting.
- https://cdn.elifesciences.org/articles/49930/elife-49930-supp1-v2.xlsx
-
Supplementary file 2
RNA sequencing data.
Differentially expressed genes in mir-1(gk276) animals compared to wild-type for each of the three biological replicate samples. Raw counts and counts per million reads (CPM) are shown. The false discovery cut-off was set at 0.1 and absolute log fold change set to 0.3 (1.2x change in expression). Full dataset is located at NCBI - GSE128968.
- https://cdn.elifesciences.org/articles/49930/elife-49930-supp2-v2.xls
-
Transparent reporting form
- https://cdn.elifesciences.org/articles/49930/elife-49930-transrepform-v2.docx
Download links
A two-part list of links to download the article, or parts of the article, in various formats.
Downloads (link to download the article as PDF)
Open citations (links to open the citations from this article in various online reference manager services)
Cite this article (links to download the citations from this article in formats compatible with various reference manager tools)
Interferon-β-induced miR-1 alleviates toxic protein accumulation by controlling autophagy
eLife 8:e49930.
https://doi.org/10.7554/eLife.49930


