Har-P, a short P-element variant, weaponizes P-transposase to severely impair Drosophila development
- Boston University School of Medicine, Boston University, United States
- Brandeis University, United States
- Genome Science Institute, Boston University School of Medicine, United States
Figures
Figure 1

No correlation between paternally-induced gonadal dysgenesis (GD) rate and P-element copy number.
(A) Illustration of the P-element-induced GD phenomenon, where two different types of crosses with one parent lacking P-elements while the other parents containing P-elements can result in genetically identical daughters having very different gonadal phenotypes. (B) GD rates from paternal genome strains mated with ISO1 females; at least 100 F1 daughters per cross were assayed. (C) Genomic quantitative PCR assessment of P-element load of strains, normalized to Har at 100%. (D) Scatterplot comparing TIDAL counts of P-element insertions to the GD rate reflects the lack of correlation.
-
Figure 1—source data 1
Spreadsheets with the tabulation of gonadal dysgenesis assays and raw values from the qPCR experiments.
- https://cdn.elifesciences.org/articles/49948/elife-49948-fig1-data1-v1.xlsx
Figure 2 with 2 supplements
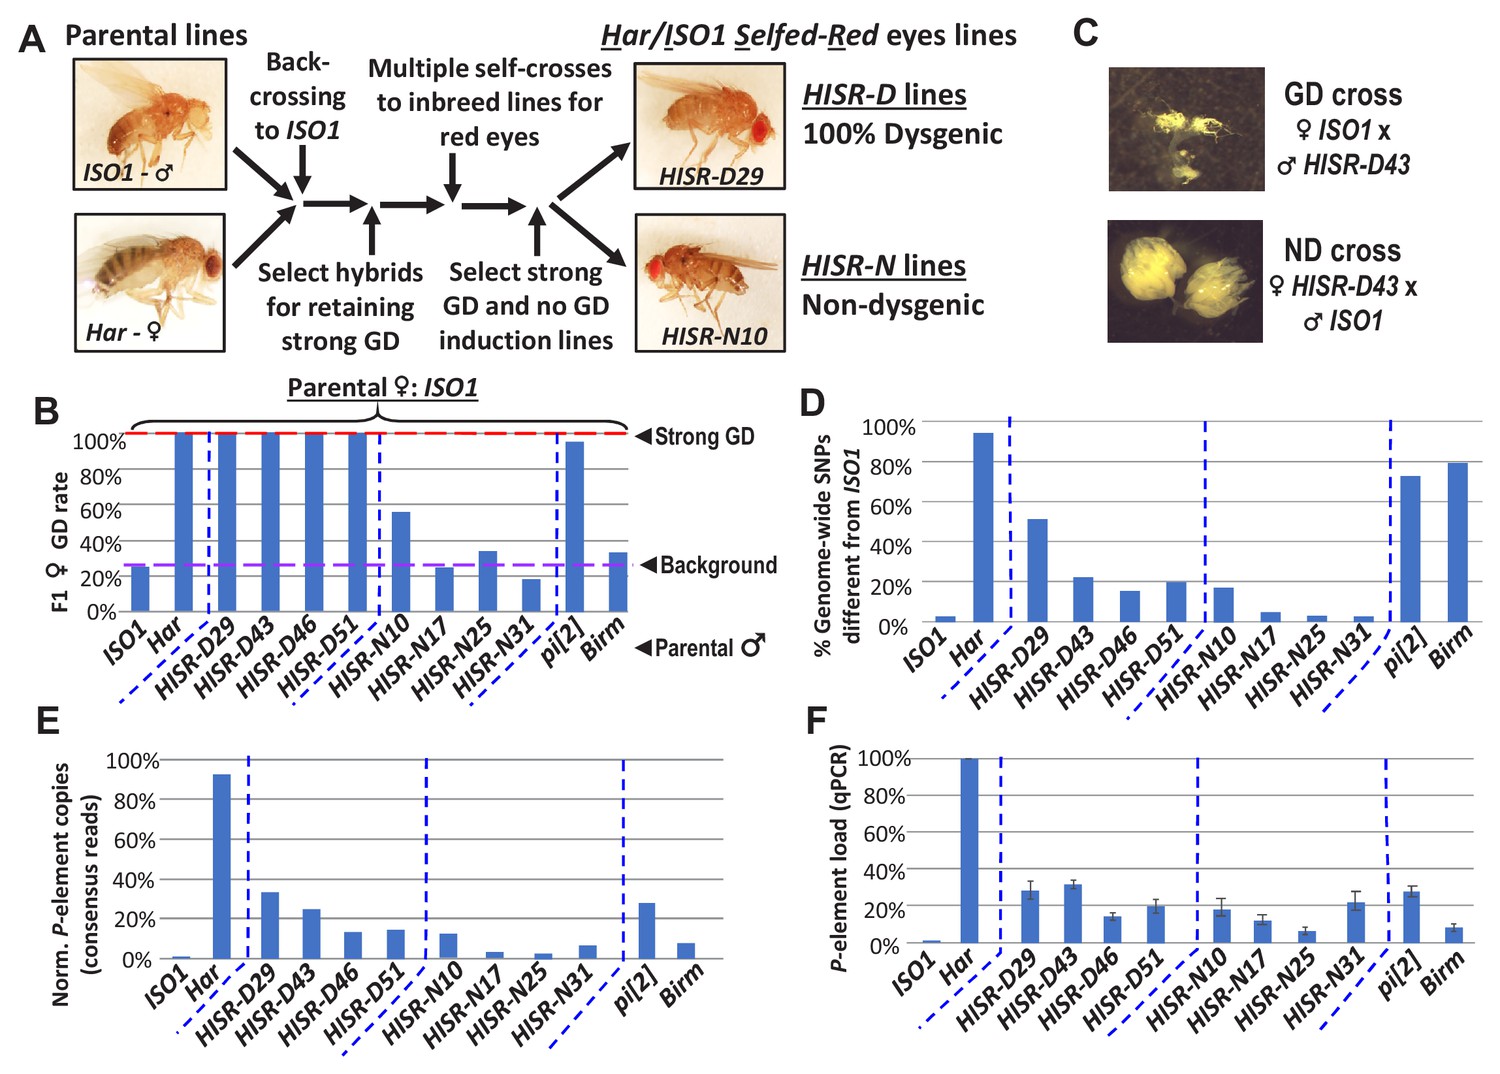
HISR lines retaining or losing strong gonadal dysgenesis (GD) induction.
(A) Abridged scheme for generating hybrid lines retaining a small fraction of the Har genome in the ISO1 background. Full scheme is Figure 2—figure supplement 1. (B) GD rates from paternal genome lines and strains mated with ISO1 females. (C) Ovarian atrophy phenotype only observed from paternal induction of GD. (D) Genome-wide single nucleotide polymorphism profile differences distinct from ISO1 genome. (E) Normalized counts of P-element copies by consensus read mapping of genomic libraries. (F) qPCR assessment of total genomic P-element load.
-
Figure 2—source data 1
Spreadsheets with the tabulation of gonadal dysgenesis assays, quantitation of genomewide SNP profiles, calculations of P-element genomic loads, and raw values from the qPCR experiments.
- https://cdn.elifesciences.org/articles/49948/elife-49948-fig2-data1-v1.xlsx
Figure 2—figure supplement 1
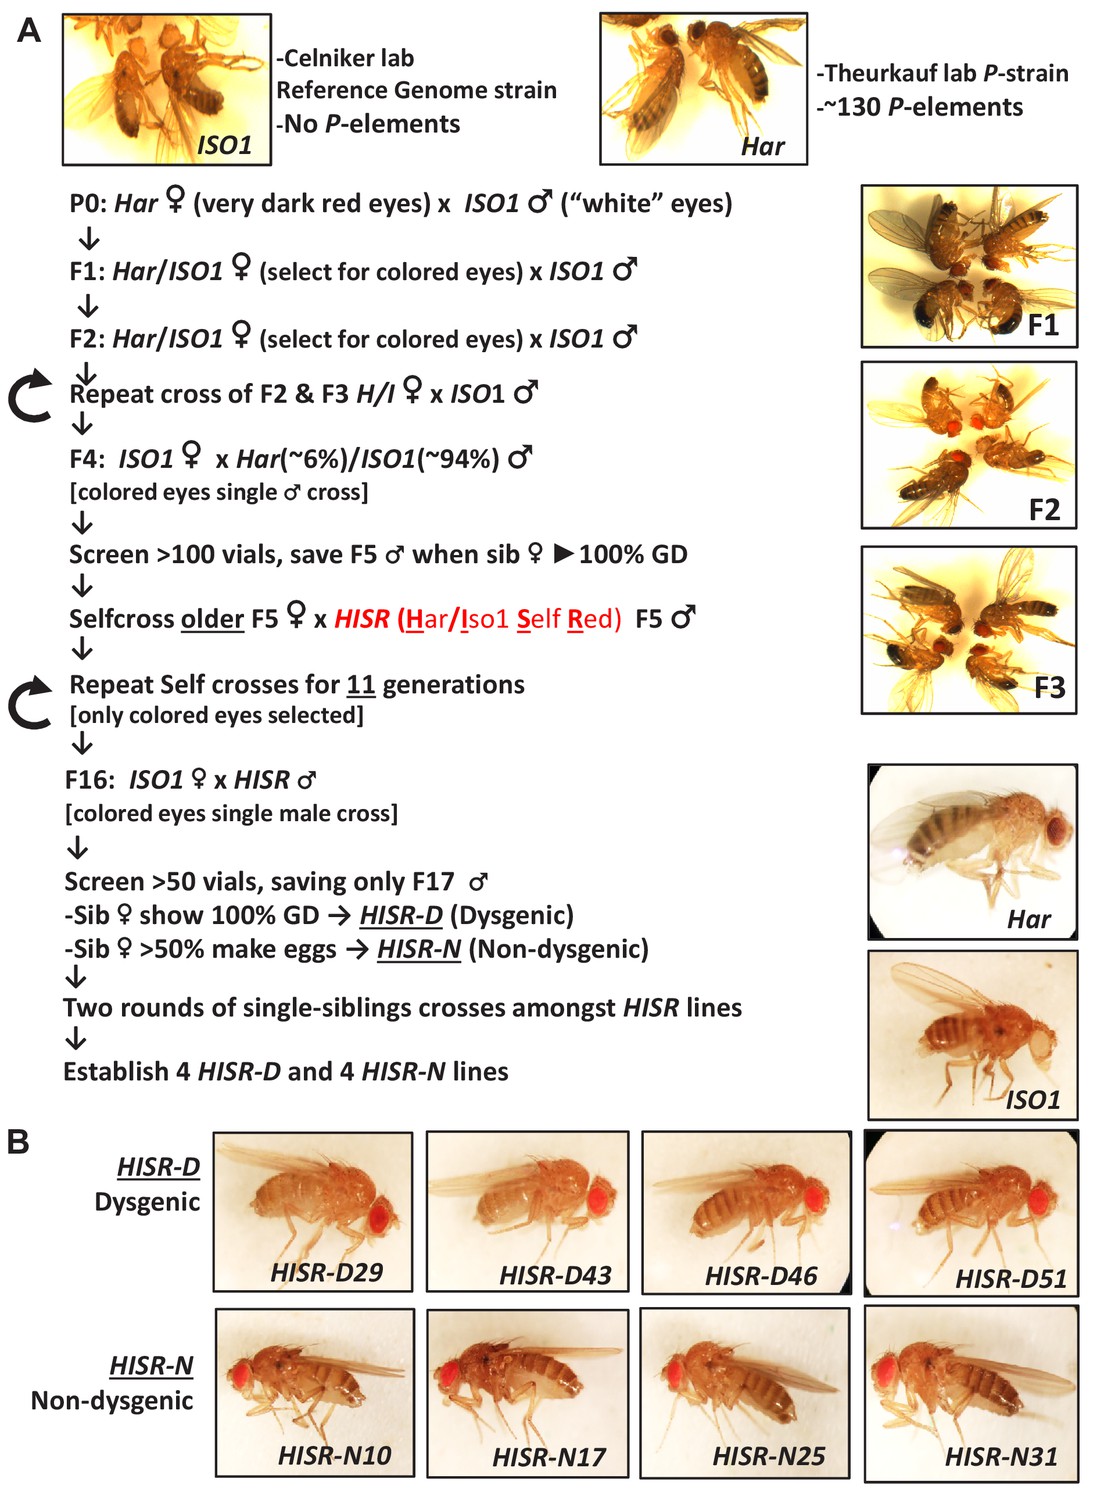
Detailed scheme for generating hybrid strains of reduced Har genome within the ISO1 background.
(A) Genetic crossing scheme to generate Har/Iso1 Selfed Red (HISR) lines based on the tracking of eye color and retention of strong gonadal induction during a paternal cross to the ISO1 strain. (B) Eight independently-selected lines that either retained or lost strong gonadal dysgenesis, with comparison to the parental lines above.
Figure 2—figure supplement 2
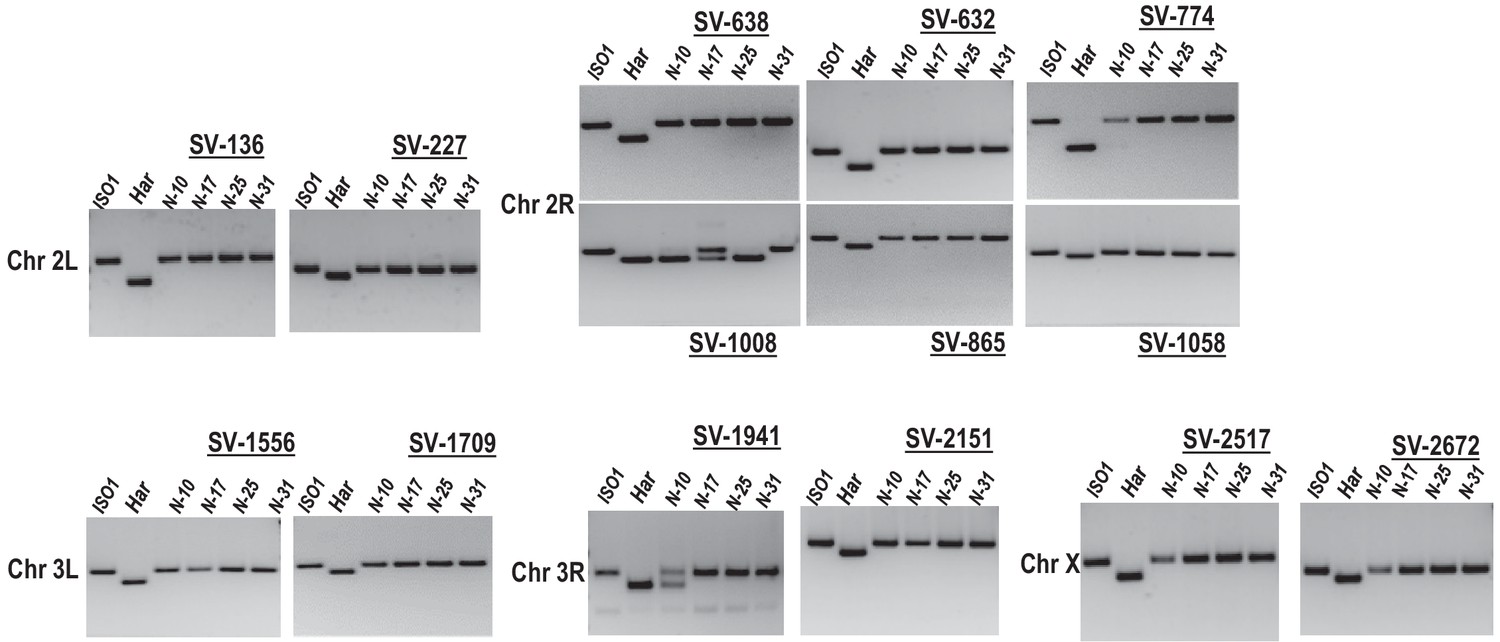
Genomic PCR genotyping of HISR strains.
PCR amplicons of several loci in HISR-N strains are consistently homozygous for the ISO1 allele. PCR conditions and primers are detailed in Supplementary file 1 .
Figure 3 with 2 supplements
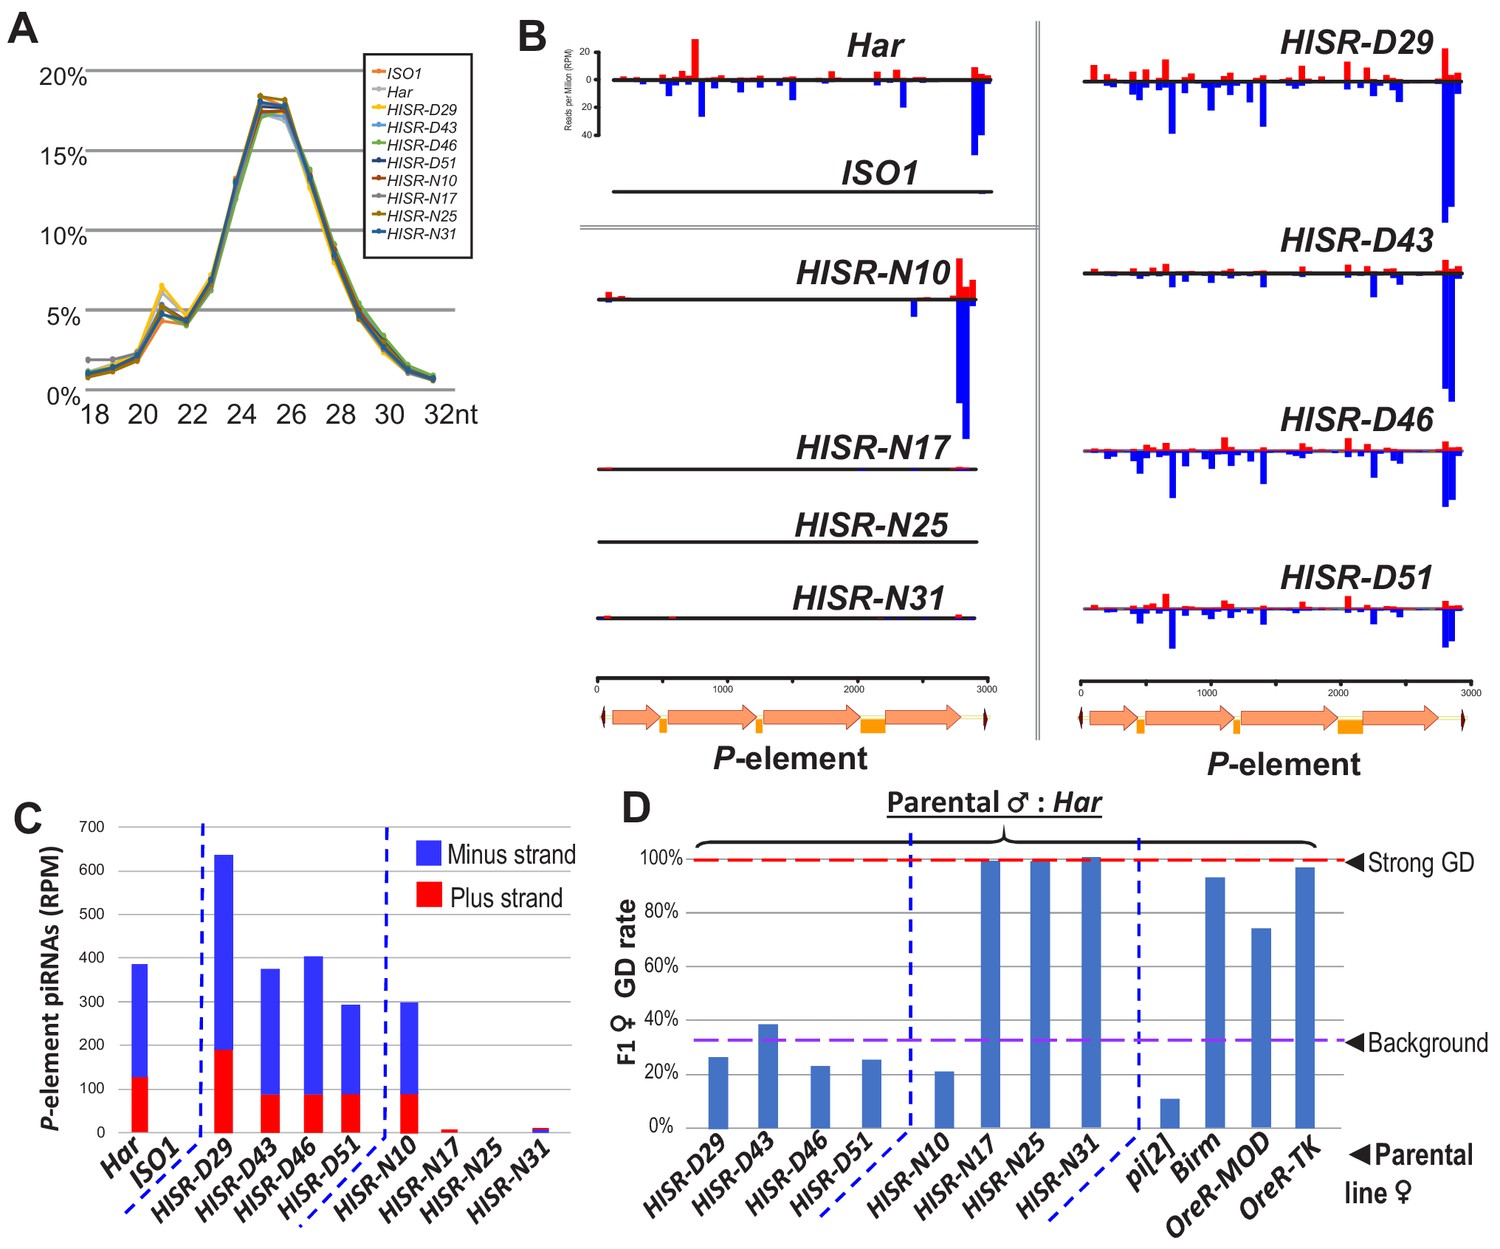
P-element directed piRNA production in HISR strains ovaries.
(A) Nearly identical size distributions of small RNAs from parental and HISR ovaries. (B) P-element piRNAs coverage plots and (C) quantitation of the P-element piRNAs mapping to plus and minus strands, in reads per million (RPM). (D) Assays for repression of P-element induced GD for HISR strains (N ≥ 100 females) are a good proxy for production of piRNAs silencing P-elements.
-
Figure 3—source data 1
Spreadsheets with the calculations for P-element piRNA coverage and tabulation of gonadal dysgenesis assays.
- https://cdn.elifesciences.org/articles/49948/elife-49948-fig3-data1-v1.xlsx
Figure 3—figure supplement 1
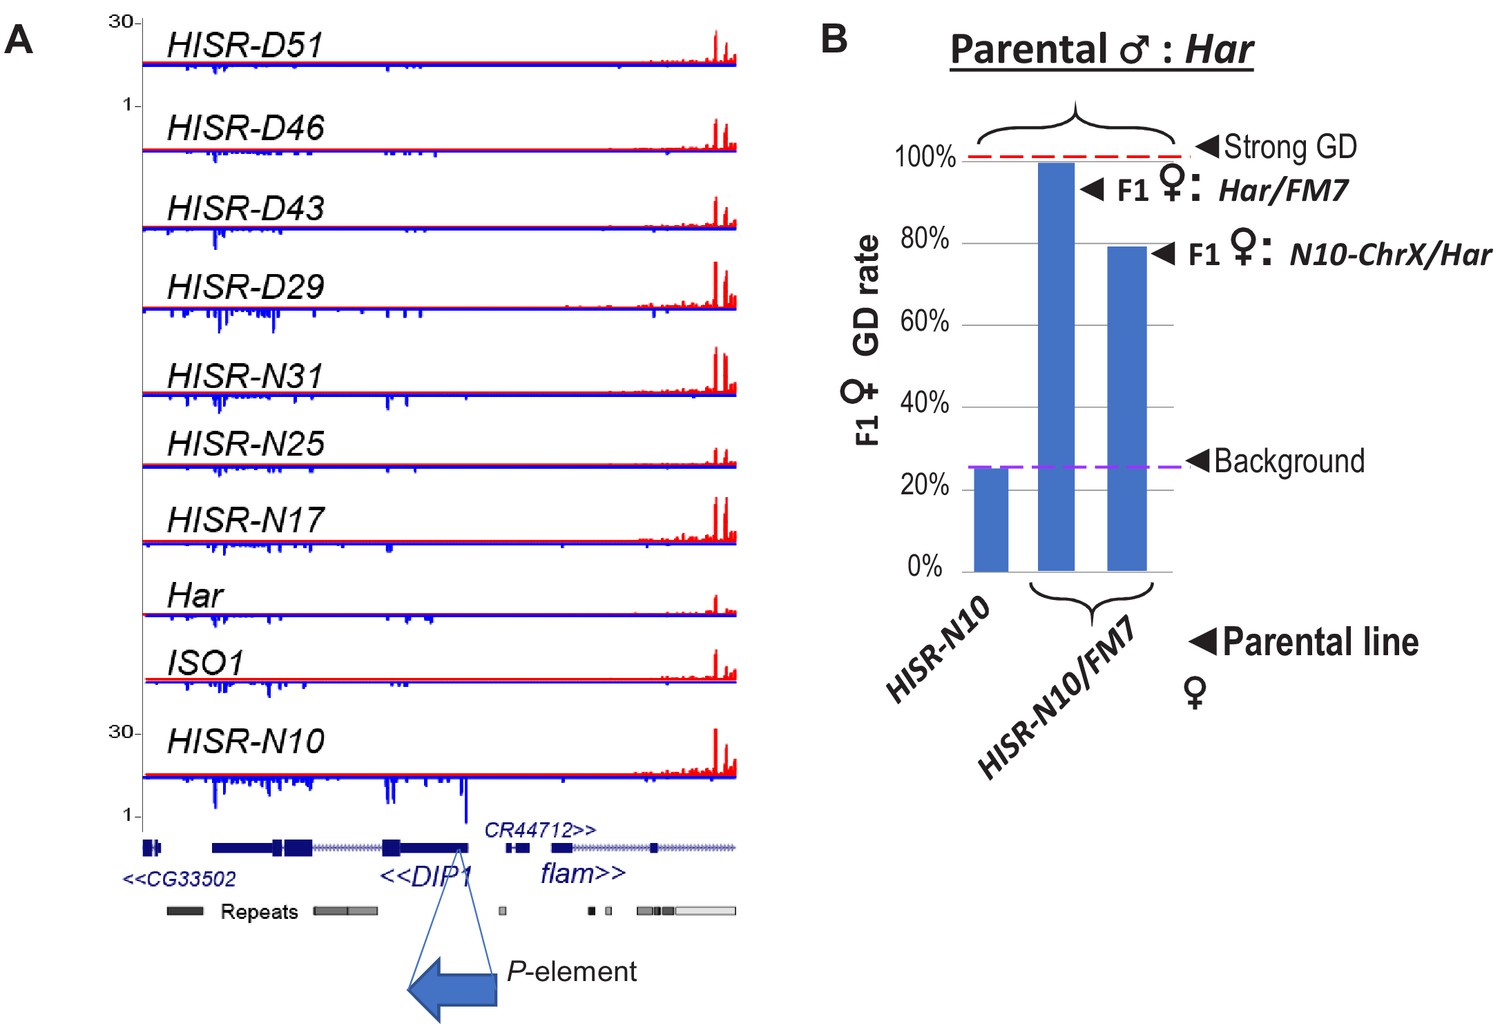
Candidate locus for P-element directed piRNA production in HISR-N10 ovaries.
(A) Genome browser plots of small RNAs mapping to the DIP1 locus, adjacent to Flamenco piRNA locus, where only HISR-N10 has a novel P-element insertion at this region that is causing increased piRNAs at this locus. (B) A parental female of HISR-N10 with the FM7 balancer chromosome for X are then crossed with Har males to test for GD repression as in Figure 3C.
-
Figure 3—figure supplement 1—source data 1
Spreadsheet with the tabulation of gonadal dysgenesis assays.
- https://cdn.elifesciences.org/articles/49948/elife-49948-fig3-figsupp1-data1-v1.xlsx
Figure 3—figure supplement 2
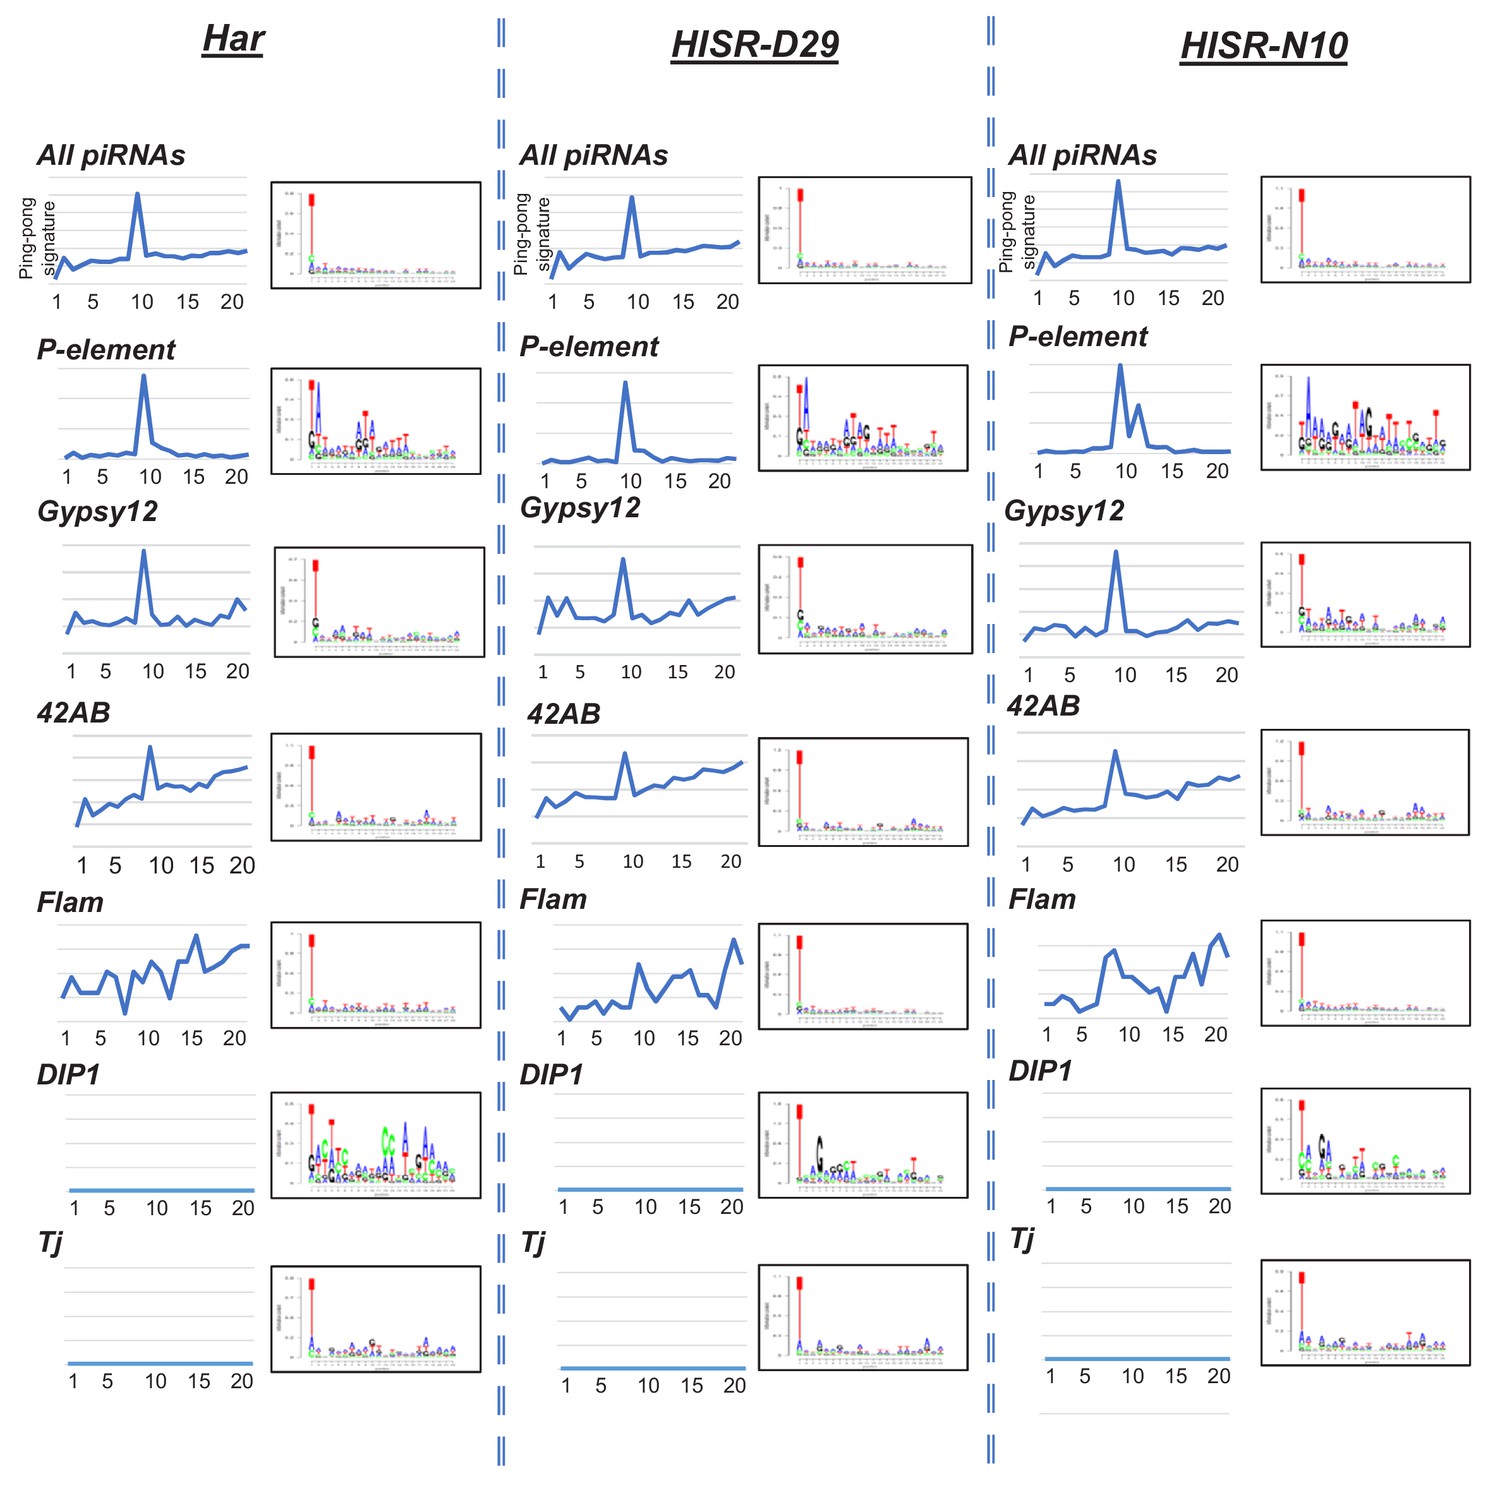
Analysis of piRNA ping-pong signatures on the P-element versus ovarian total small RNAs and specific transposons and somatic piRNA cluster loci.
Register analysis can clearly detect a ping-pong signature peak at Position 10 for all piRNAs and the 42AB germline piRNA cluster, as well as ping-pong piRNA targeting of Gypsy12 and P-element. No ping-pong signature for somatic ovarian follicle cell piRNA clusters such as Flamenco, DIP1, and Tj. Sequence logos mainly show the bulk of nucleotide compositions of PIWI and A piRNAs bias for 5' U, while the 10A bias is masked by the low abundance of AGO3. Nevertheless, a small 10A and 9T is observable in P-element-directed piRNAs.
Figure 4 with 1 supplement

P-elements are mobilized de novo during generation of HISR lines.
(A) TIDAL program counts of novel P-element insertions, left Y-axis and colored bars. Right Y-axis, black dots and dashed line are the total distinct transposon insertions in the unique-mapping portion of genome. (B) Lineage analysis of the Har P-elements retained in the HISR lines, colored by the major chromosomal segments. (C) Comparison of shared P-elements between Har and HISR lines, with total number of P-elements called by TIDAL in the top row and first column. Color shade reflects degree of shared P-elements between the two strains being compared.
-
Figure 4—source data 1
Spreadsheets with the calculations of P-element locus comparisons amongst the HISR strains and the records of the de novo P-element insertions amongst the HISR strains.
- https://cdn.elifesciences.org/articles/49948/elife-49948-fig4-data1-v1.xlsx
Figure 4—figure supplement 1
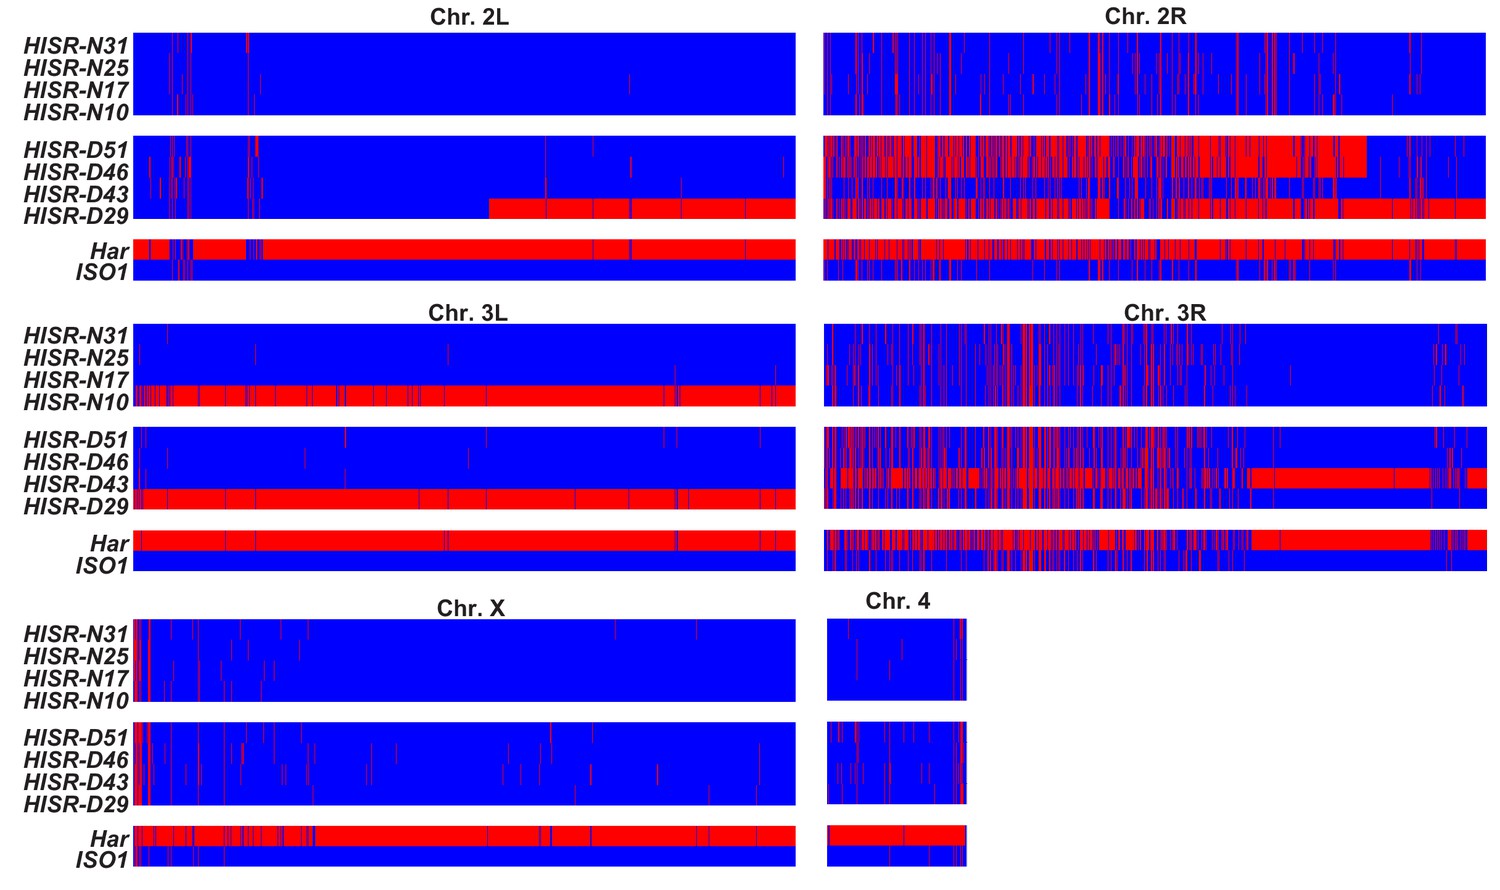
Genome-wide SNP profiling of HISR strains.
Single nucleotide polymorphism (SNP) profiles comparisons between HISR strains and parental strains. For each 5 kb interval, red marks a SNP distinct from the ISO1 reference genome, whereas blue marks identity with reference genome sequence.
Figure 5 with 2 supplements
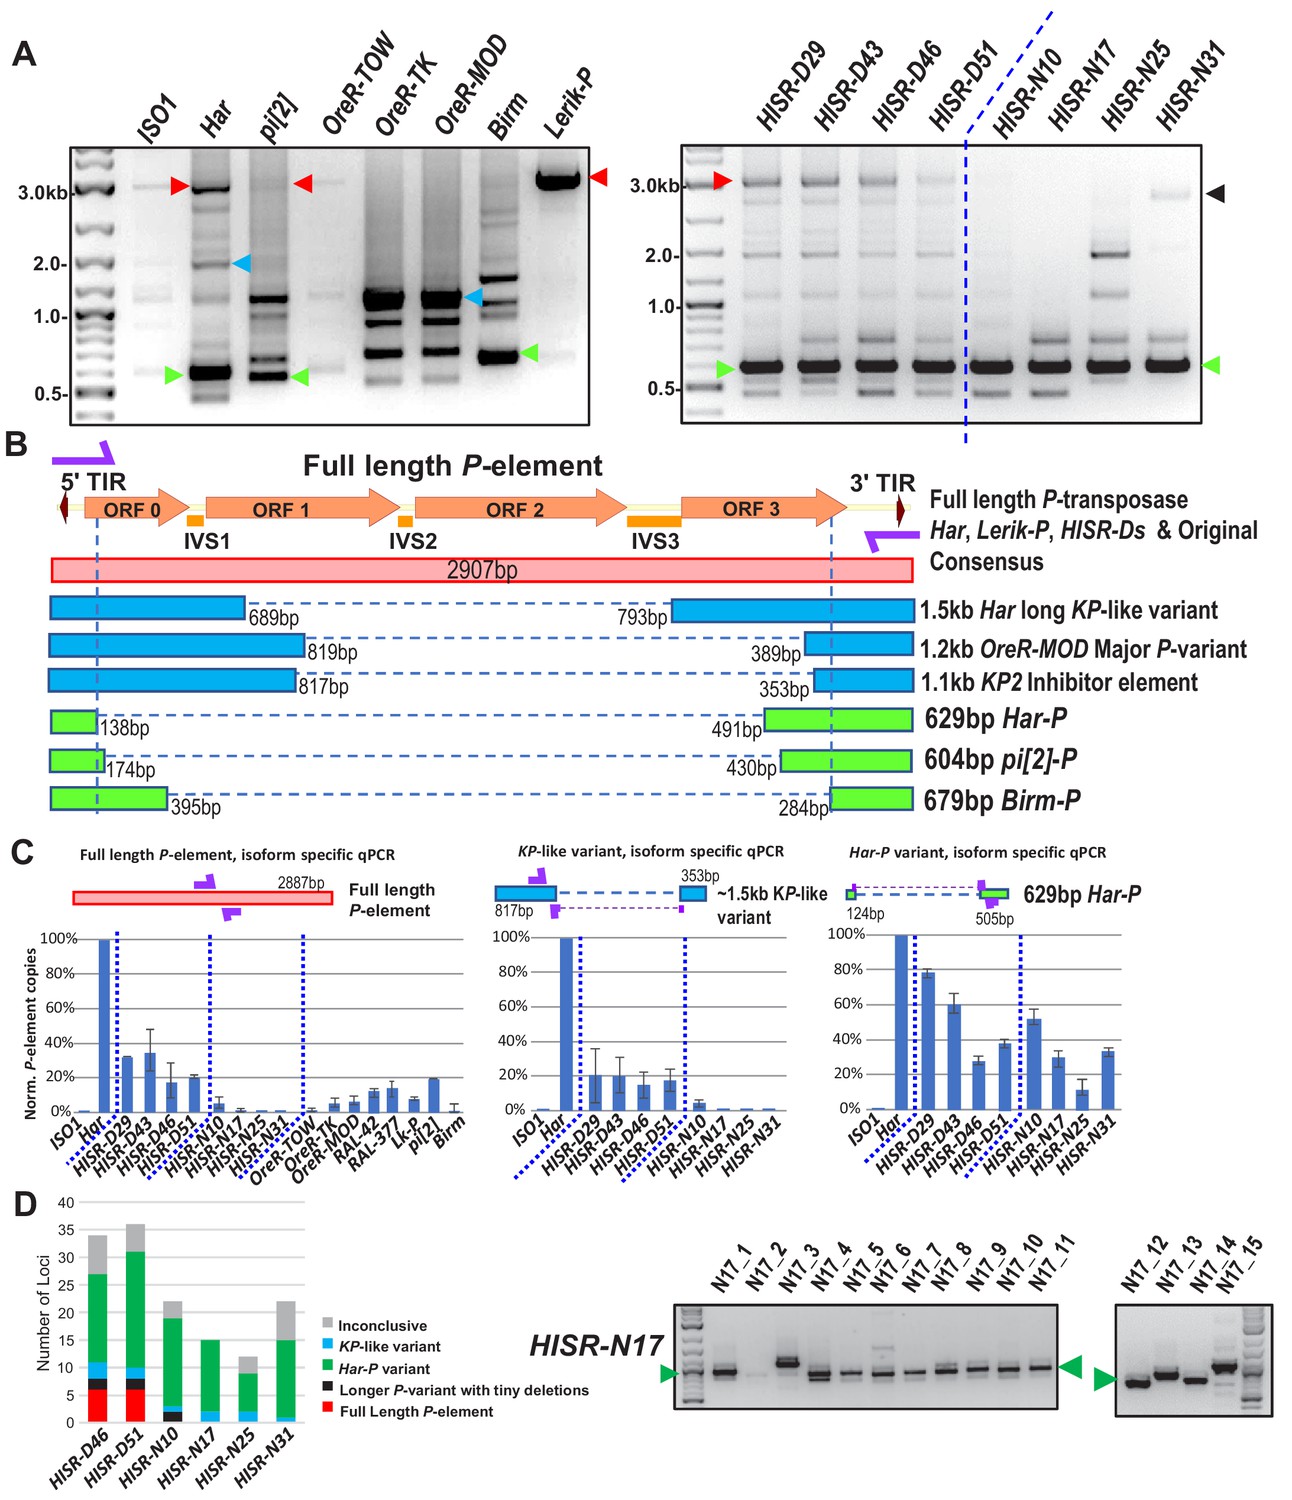
Har-P is a short and highly mobile P-element variant in strains used in P-element GD assays.
(A) P-element variant amplicons generated with TIR primers were cloned and sequenced as marked by colored arrows for the sequenced diagrams in (B). (B) Diagram of P-element variants cloned and sequenced from genomic PCR amplicons shown above. (C) Genomic qPCR quantifications of three P-element variants in Harwich and Harwich-derived HISR lines. Relative quantifications (in percentage) were calculated from ΔΔCt with rp49 as reference gene. (D) Proportions of the P-element variants verified by locus-specific PCR from TIDAL predictions of all HISR-N and HISR-D strains with <40 P-element insertions. The gel for HISR-N17 is on the right, while remaining gels are in Figure 5—figure supplement 1.
-
Figure 5—source data 1
Spreadsheets with the raw values from the qPCR experiments and calculations of the percentage of the insertions corresponding to the three P-element variant types.
- https://cdn.elifesciences.org/articles/49948/elife-49948-fig5-data1-v1.xlsx
Figure 5—figure supplement 1
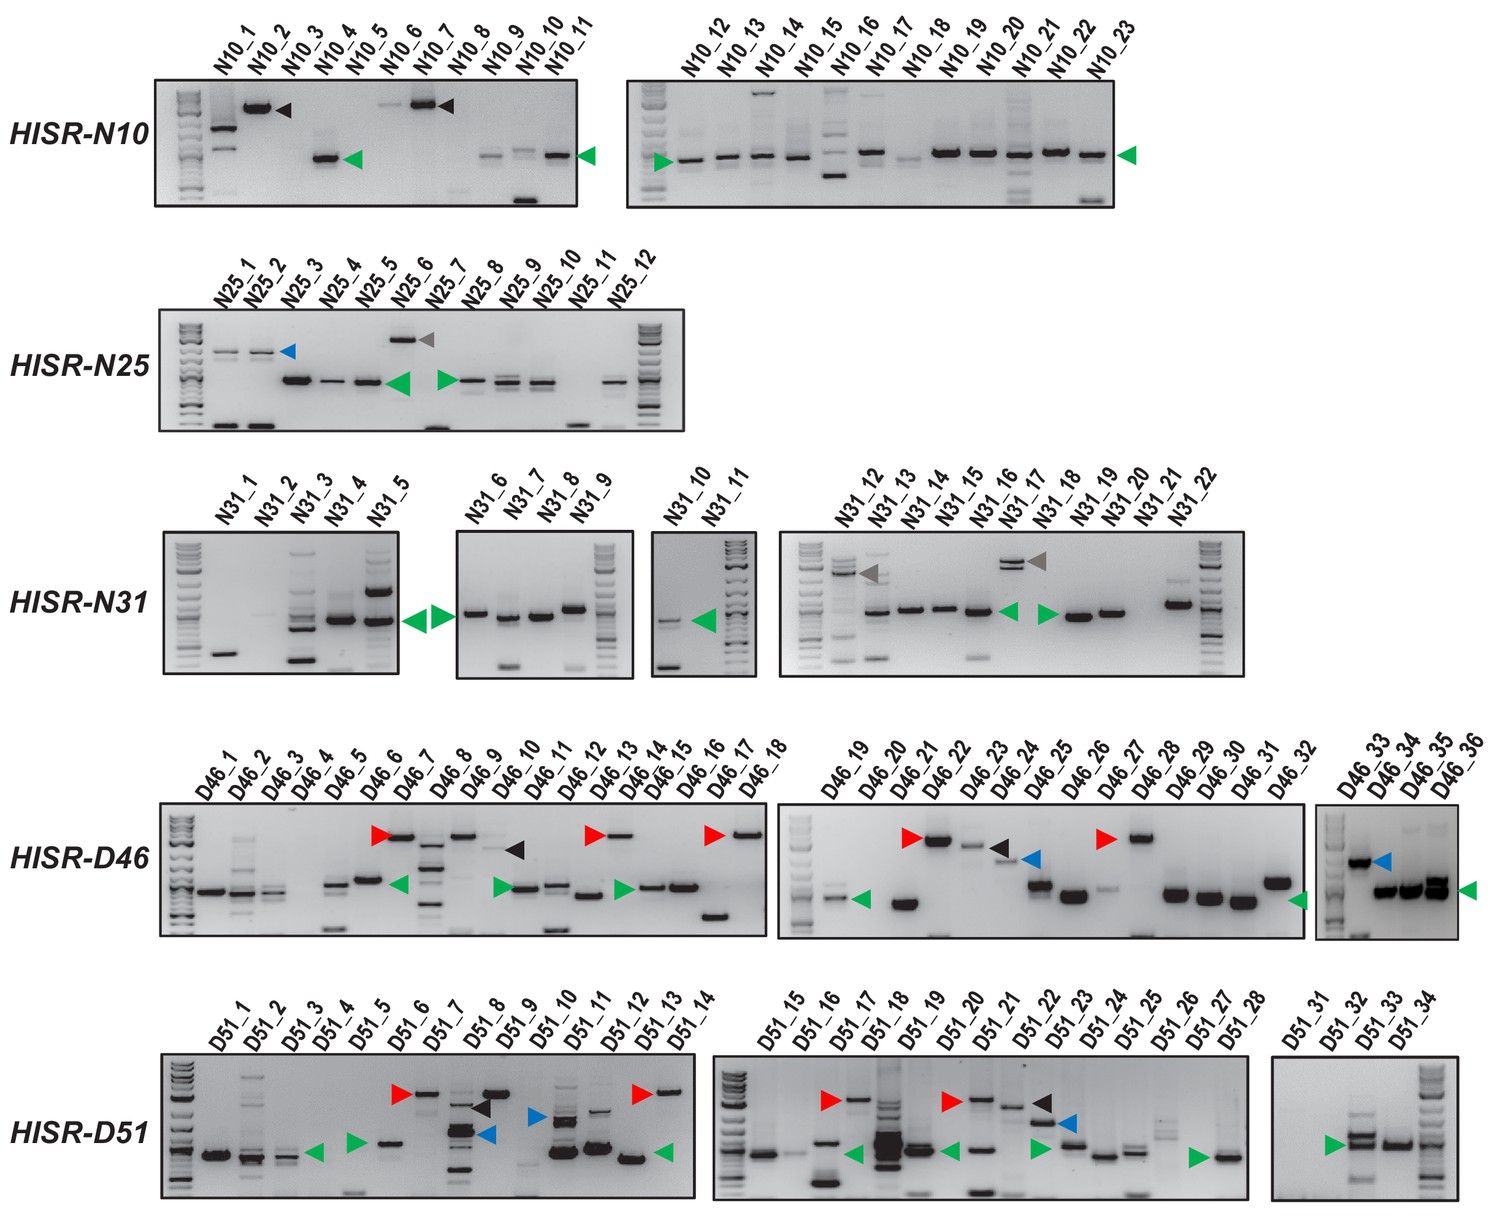
Genomic PCR amplifications of P-element insertion loci in HISR-N and HISR-D lines.
Characterizing variant distributions among P-element insertions predicted in all HISR-N and two HISR-D genomes (-D29 and -D43 strains were omitted because >40 P-element insertions were predicted by TIDAL, Figure 4). Loci number represents the predicted P-element insertion sites from TIDAL analysis of Illumina whole genome sequencing. Green arrowheads mark ~0.6 kb Har-P variants, blue arrowheads mark the likely KP-like variant, red arrowheads mark full-length P-elements, and black arrowheads mark full length or uncharacterized P-variants. Quantitation of variants proportions shown in Figure 5D. The similar patterns of amplicons between –D46 and -D51 strains is expected since a majority of the new P-element insertions are shared between these two strains (Figure 4C).
Figure 5—figure supplement 2
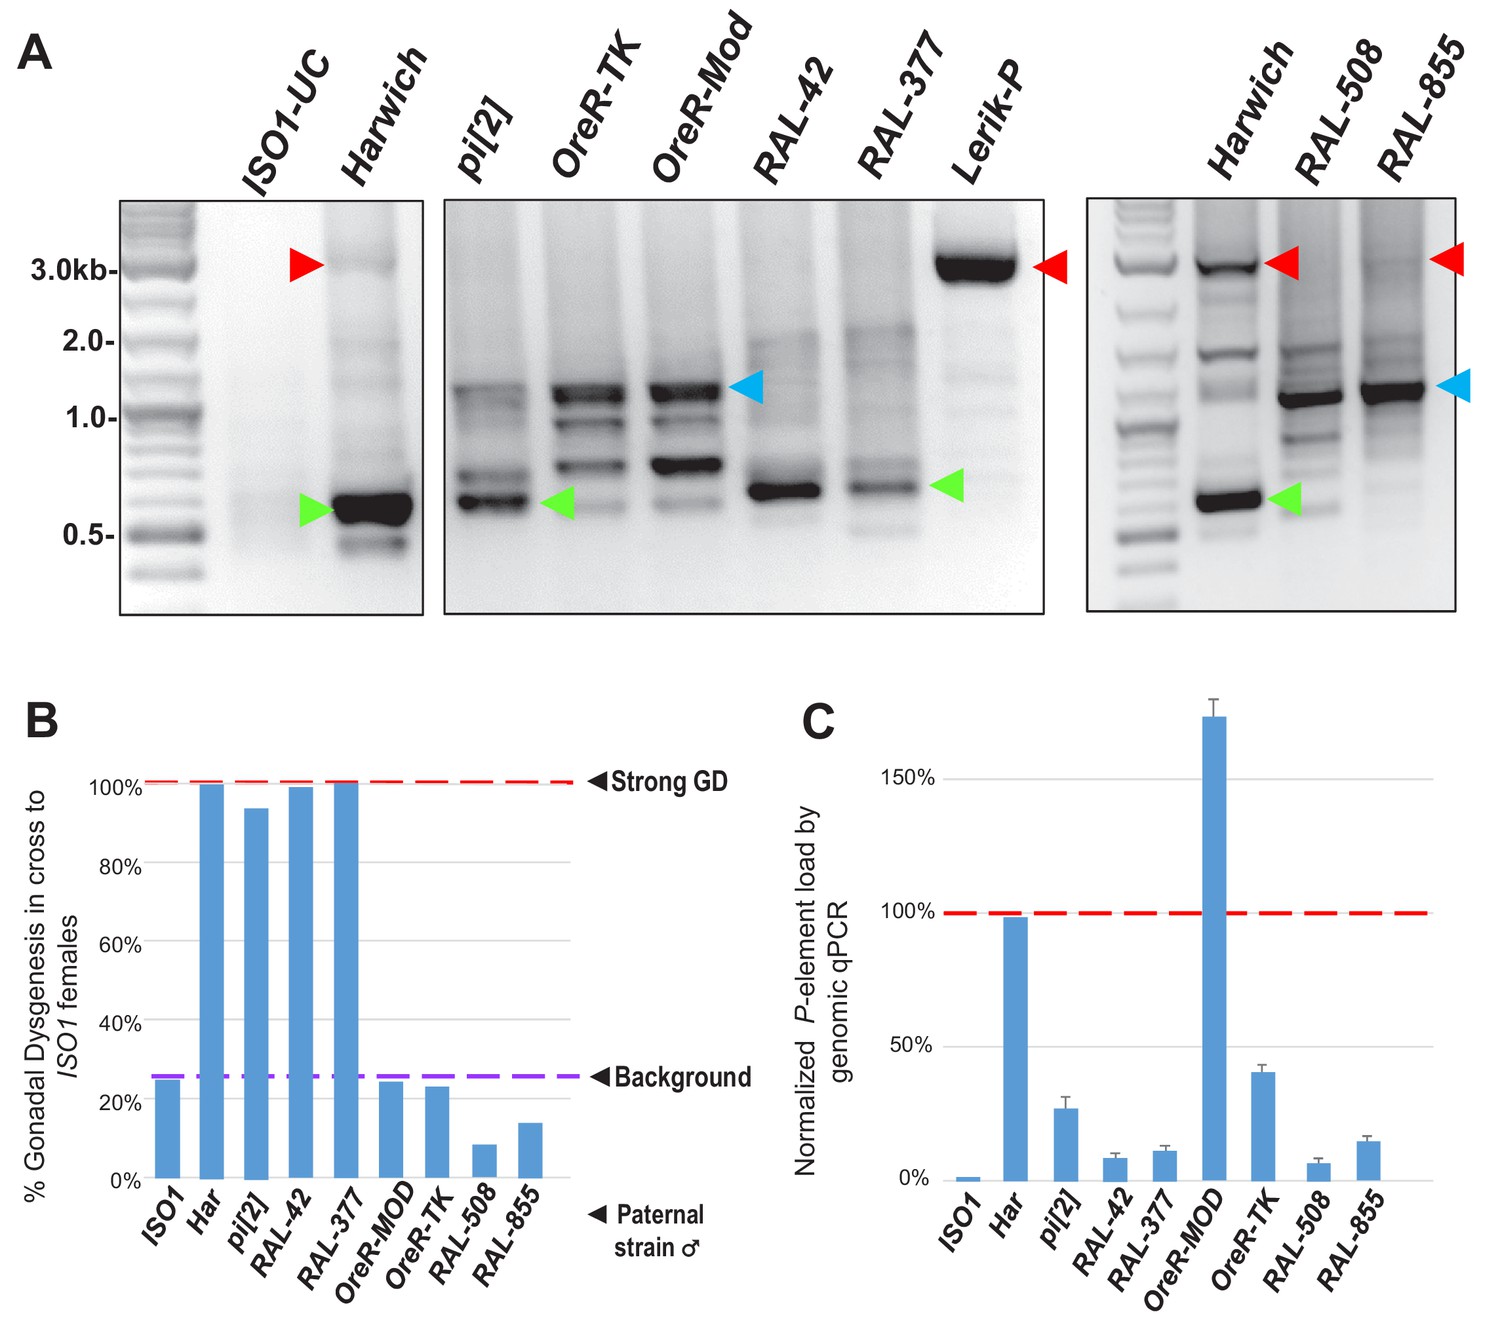
Further examinations of P-element variants amongst distinct Drosophila strains that strongly induce GD only when possessing the very short variants similar in length to Har-P.
(A) Adapted from Figure 5A, P-element variant amplicons generated with TIR primers were cloned and sequenced as marked by colored arrows for the sequenced diagrams in Figure 5B. Right most panel shows to additional RAL strains with significant P-element copy number, but they are similar to the KP variants in OreR strains. (B) Adapting from Figure 1B but now including two additional RAL strains, the GD rates from paternal genome strains mated with ISO1 females; at least 100 F1 daughters per cross were assayed. (C) Adapting from Figure 1C but now including two additional RAL strains, genomic quantitative PCR assessment of P-element load of strains, normalized to Har at 100%.
-
Figure 5—figure supplement 2—source data 1
Spreadsheets with the tabulation of gonadal dysgenesis assays and raw values from the qPCR experiments.
- https://cdn.elifesciences.org/articles/49948/elife-49948-fig5-figsupp2-data1-v1.xlsx
Figure 6 with 1 supplement
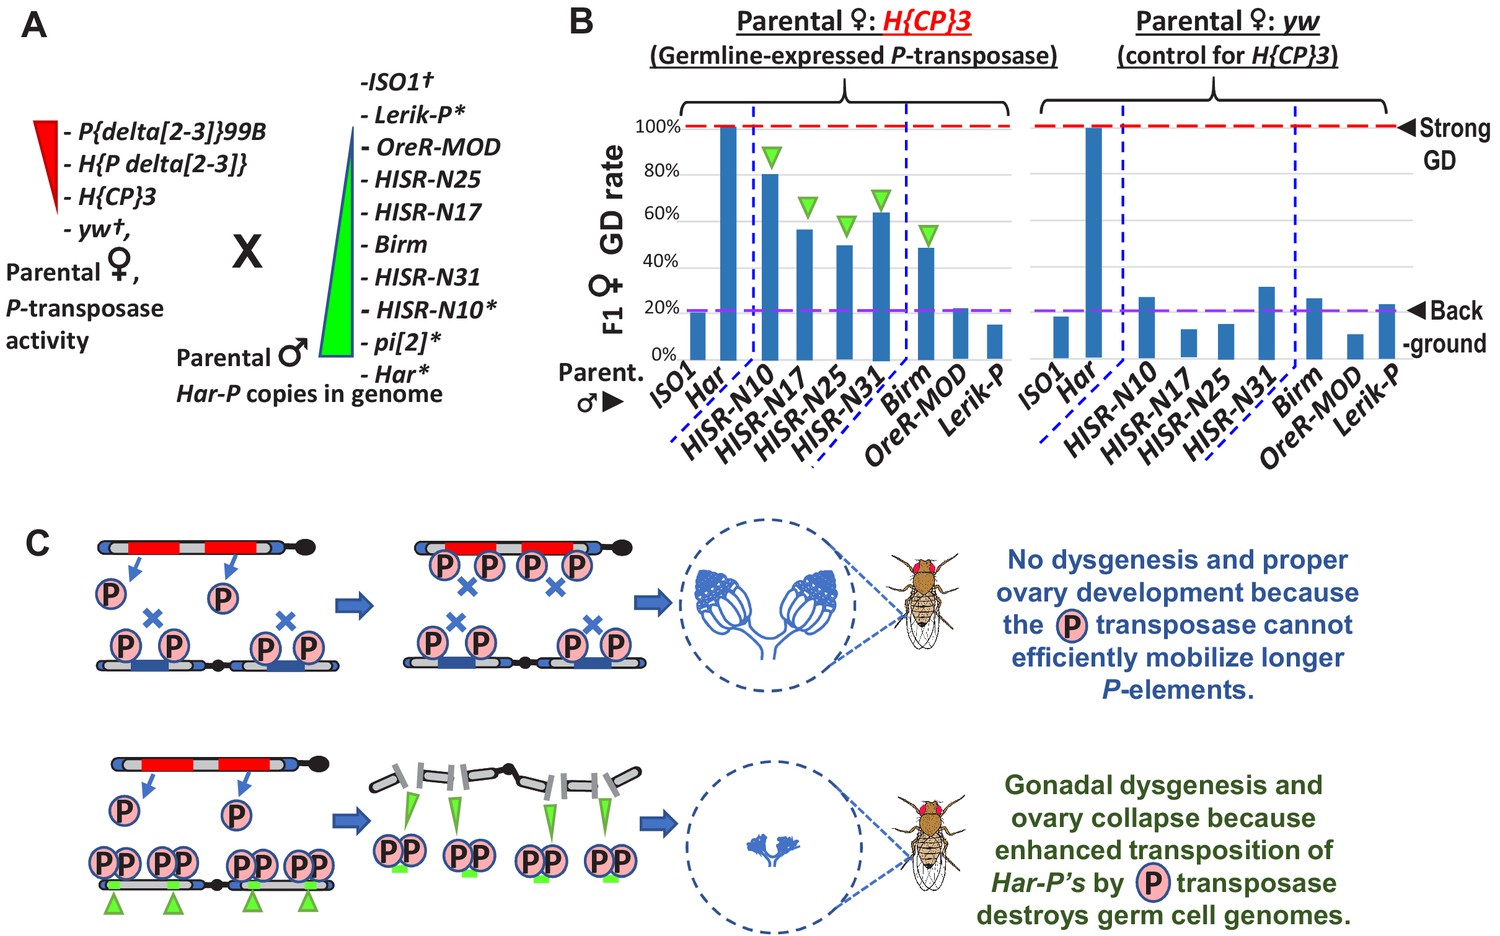
In absence of piRNA silencing, Har-P crossed with P-transposase restores severe GD.
(A) Strains for testing Har-P genetic interaction with P-transposase activity. *-strains with piRNA silencing; †-strains lacking any P-elements. (B) The H{CP}3 strain’s moderately-expressed maternal dose of P-transposase crossed with paternal HISR-N strains and Birm strain restores GD in F1 daughters, but strains with longer and full-length P-elements like OreR-MOD and Lerik-P lack the GD phenotype. (C) Model for P-transposase mobilizing Har-Ps to cause catastrophic transposition.
-
Figure 6—source data 1
Spreadsheet with the tabulation of gonadal dysgenesis assays.
- https://cdn.elifesciences.org/articles/49948/elife-49948-fig6-data1-v1.xlsx
Figure 6—figure supplement 1
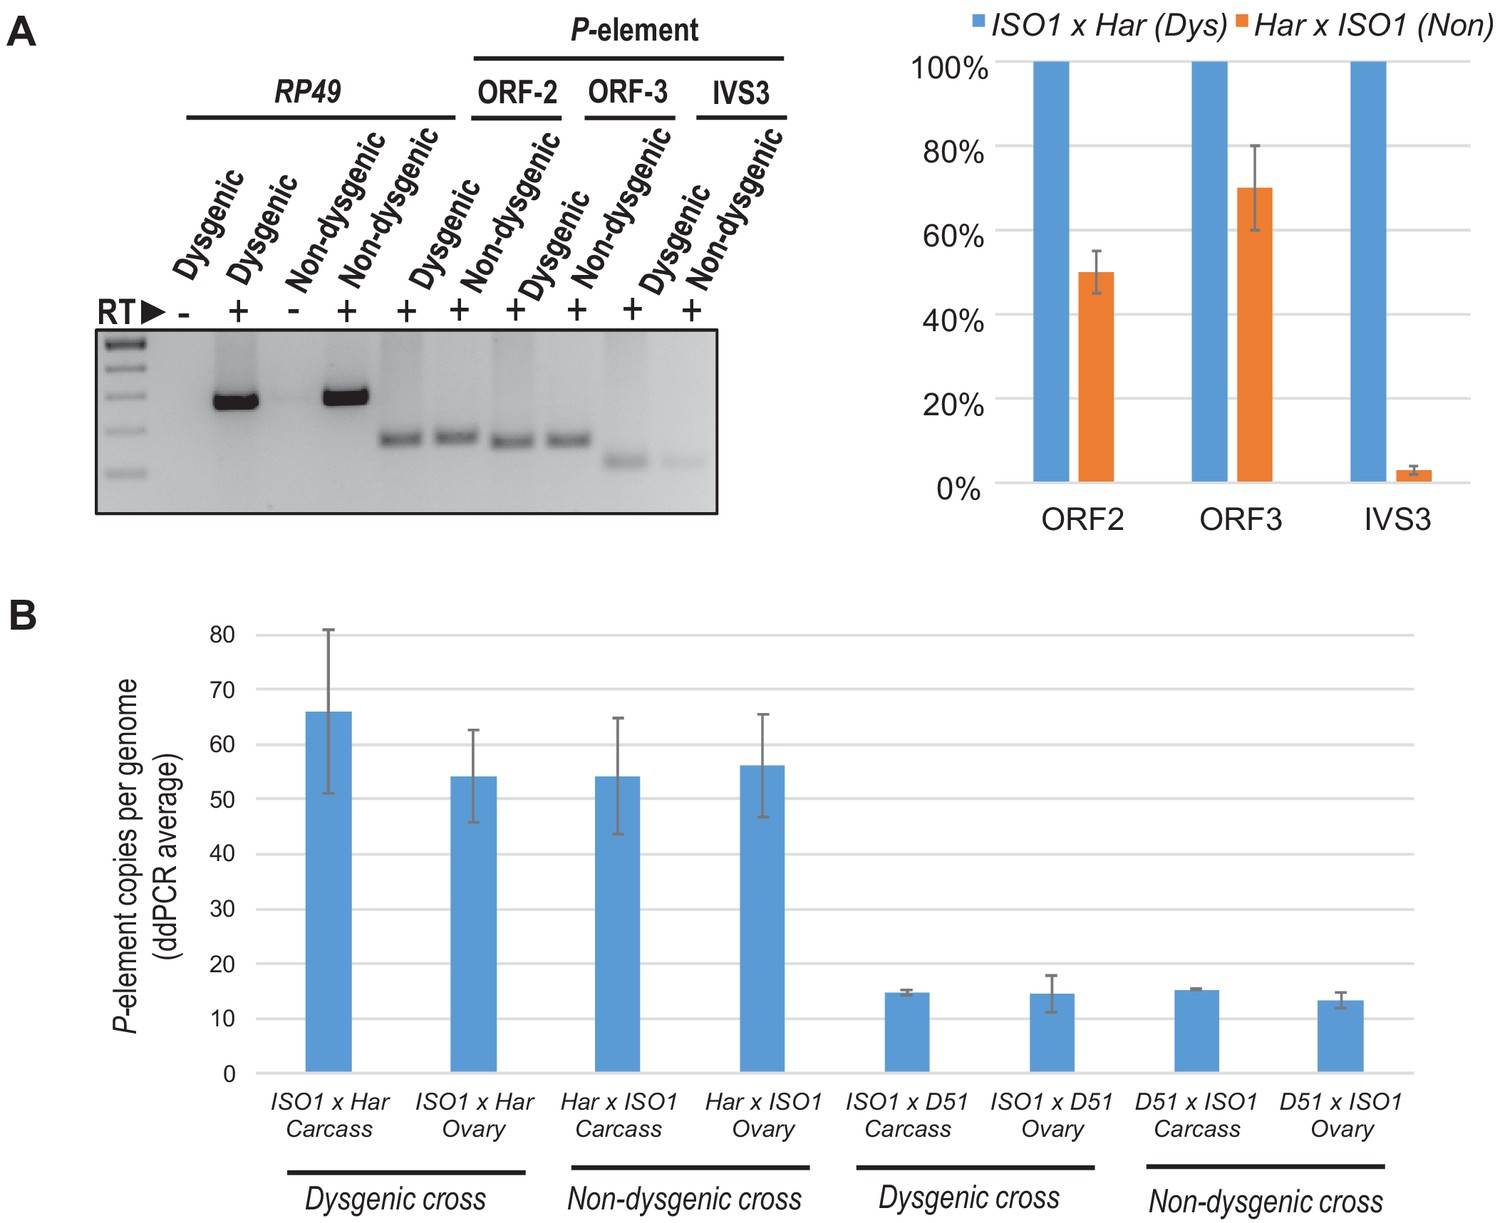
P-transposase RNA expression and P-copy number load is largely similar between Dysgenic and Non-dysgenic cross daughters.
(A) P-element RNA expression in 3–5 days old F1 ovaries, ISO1 x Har (Dysgenic) versus Har x ISO1 (Non-dysgenic). Primers are specific to the ORF2 and ORF3 regions of the P-element, while the primers for IVS3 measure only the spliced product of IVS3 intron removal from the P-element mRNA. Relative quantifications of qPCR measurements were calculated from ΔΔCt with RP49 as reference gene. (B) Digital droplet PCR quantitation of genomic P-element loads in daughter ovaries and carcasses from Dysgenic versus Non-dysgenic crosses. Error bars are standard deviation of 3 biological replicates of crosses.
-
Figure 6—figure supplement 1—source data 1
Spreadsheets with the calculations of P-element RNA levels in progeny of crosses and droplet digital PCR counts of P-element copy numbers in progeny ovaries and carcasses.
- https://cdn.elifesciences.org/articles/49948/elife-49948-fig6-figsupp1-data1-v1.xlsx
Figure 7 with 2 supplements

Somatic expression of P-transposase triggers pupal lethality with Har-P loci that are not silenced by P-element piRNAs.
(A) Green triangles denote crosses showing pupal lethality from stronger somatic expression of P-transposase acting on Har-Ps in HISR-N and Birm strains lacking P-element piRNAs. Red hexagons denote crosses with strains expressing P-element piRNAs that suppress pupal lethality through a paternally transmitted epigenetic imprint. (B) The paternal P-element piRNA imprinting on Har-Ps in Har and HISR-N10 cannot suppress GD in F1 daughters, as marked by green triangles. The longer P variants in OreR-MOD do not result in GD with the delta[2-3] P-transposase. (C) Revised P Dysgenesis paradigm proposing a paternally-transmitted piRNA-directed epigenetic mark that resists P-transposase activity in the soma, but this mark is erased during oogenesis.
-
Figure 7—source data 1
Spreadsheets with the tabulation of pupal lethality and gonadal dysgenesis assays.
- https://cdn.elifesciences.org/articles/49948/elife-49948-fig7-data1-v1.xlsx
Figure 7—figure supplement 1
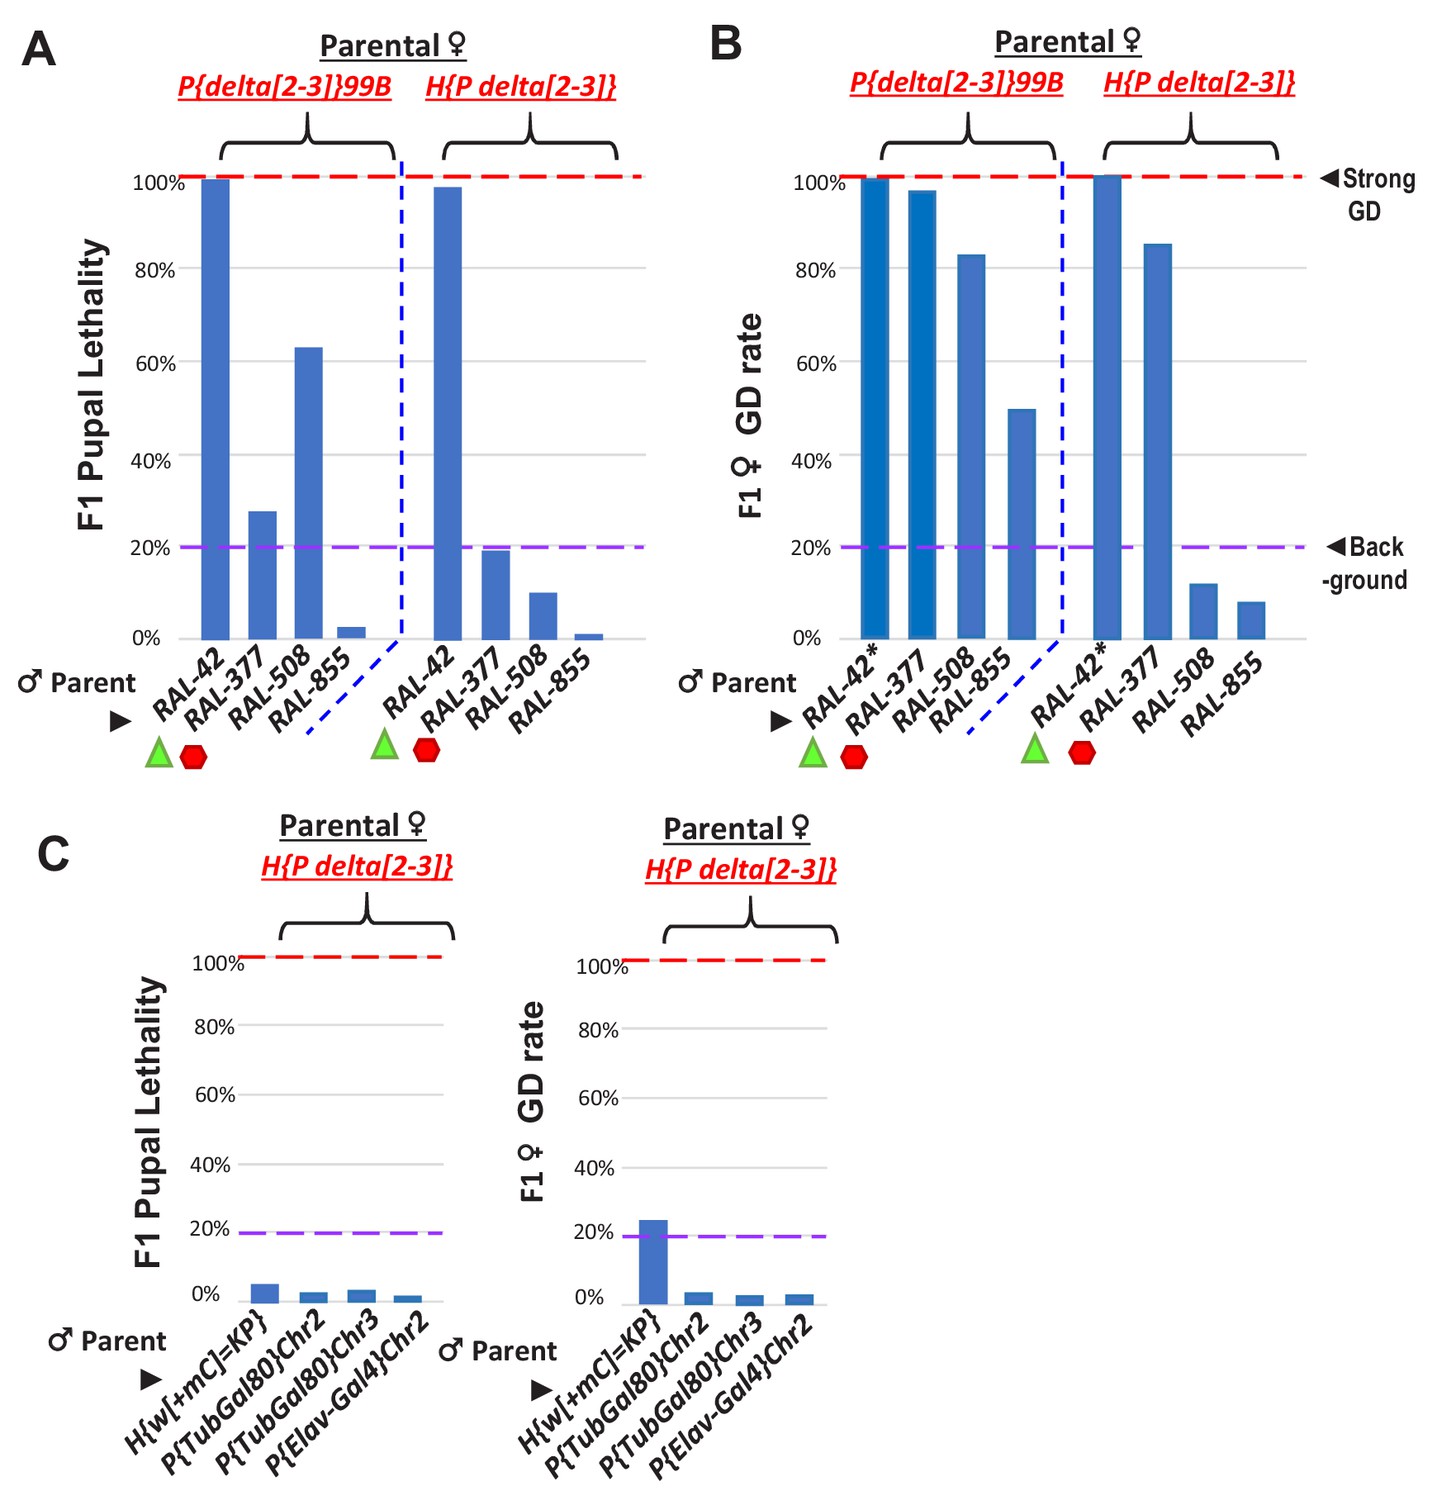
Further tests of somatic pupal lethality and GD in crosses between RAL lines and delta[2-3] P-transposase lines.
(A) Green triangles denote crosses showing pupal lethality from strong somatic expression of P-transposase acting on Har-Ps in RAL-42 strain, likely because this strain lacks P-element piRNAs. Red hexagons denote crosses with RAL-377 strain that has Har-P’s but may have suppressed pupal lethality by possible P-element piRNAs. (B) However, in ovaries there is elevated GD observed in RAL-377 females. The asterisks for RAL-42 indicates complete GD in the few eclosing female F1 progeny (~<2%) in the cross of RAL-42 to delta[2-3] where most pupae have died. The P{delta[2-3]}99B strain may be triggering additional negative genetic interactions beyond Har-P transposition that is tempered by the H{P delta[2-3]} strain that also expresses P-transposase in the soma but at a different strength of expression. (C) Negligible pupal lethality and GD rate from H{P delta[2-3]} crossed with other strains containing longer P-elements that were created from P-element transgenesis. These negative controls support the notion that P-transposase hypermobilizes short P-element variants to cause GD and pupal lethality. Except for the GD assay for RAL-42*, all other assays measured N > 100 individual animals.
-
Figure 7—figure supplement 1—source data 2
Spreadsheets with the tabulation of pupal lethality and gonadal dysgenesis assays.
- https://cdn.elifesciences.org/articles/49948/elife-49948-fig7-figsupp1-data2-v1.xlsx
Figure 7—figure supplement 2
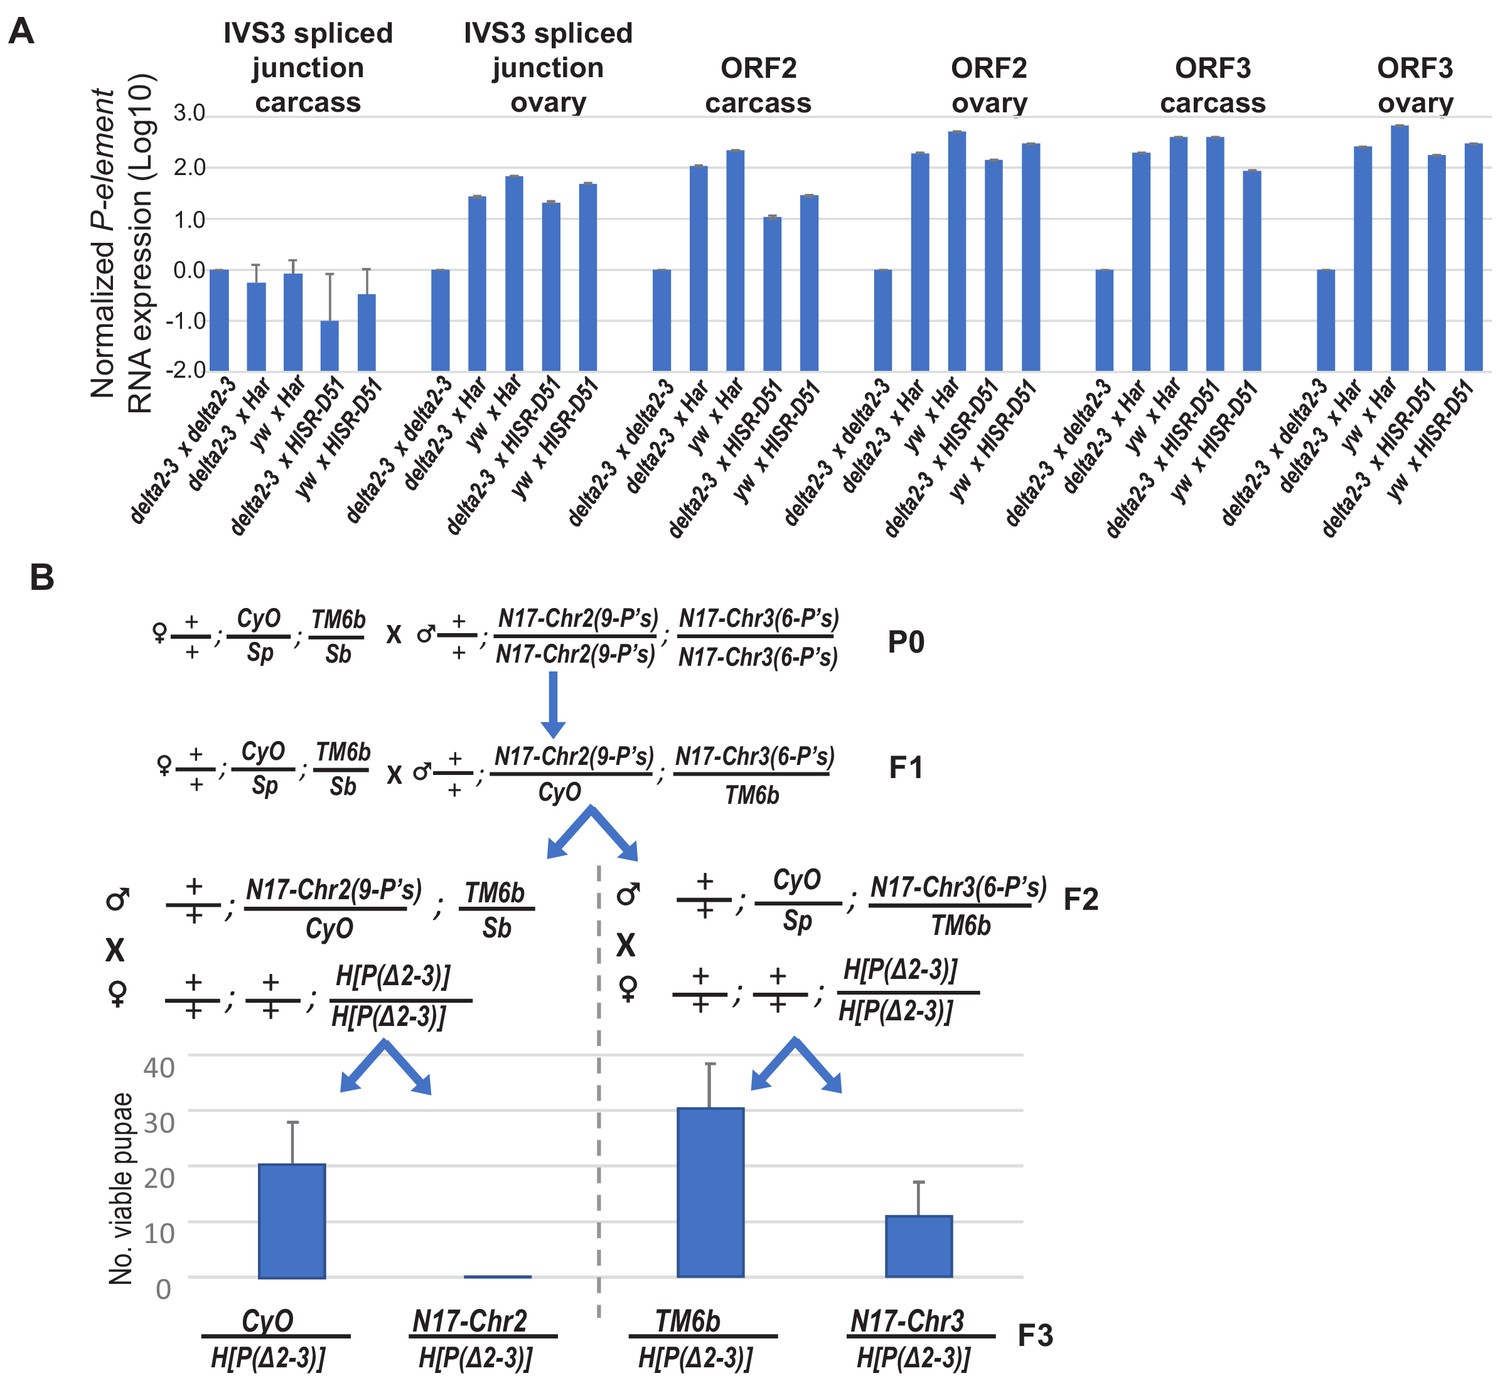
Further examinations of delta[2-3] P-transposase RNA expression and delta[2-3] P-transposase capacity to cause pupal lethality with lower copy numbers of Har-P’s.
(A) The P-transposase mRNA expression is not silenced in the progeny of crosses between mothers expressing delta[2-3] P-transposase (and yw control) with fathers that came from mothers expressing P-element-directed piRNAs. Relative quantifications of qPCR measurements was calculated from ΔΔCt with RP49 as reference gene. (B) A genetic cross to assay how Har-P copy number and composition impacts the strong pupal lethality phenotype in a cross with the delta[2-3] P-transposase. The HISR-N17 strain was first crossed to the double-balancer line +/+; CyO/Sp; TM6b/Sb to generate to males selected for CyO and TM6b that were then crossed again to the double-balancer to select F2 males with Sb or Sp traits. These F2 males were then each crossed to H[P(Δ2–3)] to generate viable pupae which emerged as F3 adult flies and were assessed for CyO and TM6b. The average and standard deviation of three biological replicates are plotted.
-
Figure 7—figure supplement 2—source data 1
Spreadsheets with the raw values from the qPCR experiments and the tabulation of pupal lethality.
- https://cdn.elifesciences.org/articles/49948/elife-49948-fig7-figsupp2-data1-v1.xlsx
Tables
Key resources table
| Reagent type (species) or resource | Designation | Source reference | Identifier | Additional information |
|---|---|---|---|---|
| Strain, strain background (Drosophila melanogaster) | ISO1 | Susan Celnicker Lab | PMID: 25589440 | iso-1 : y[1]; Gr22b[1] Gr22d[1] cn[1] CG33964[R4.2] bw[1] sp[1]; LysC[1] MstProx[1] GstD5[1] Rh6[1] |
| Strain, strain background (Drosophila melanogaster) | Harwich | William Theurkauf Lab | PMID: 22196730 | |
| Strain, strain background (Drosophila melanogaster) | HISR-D29 | Created in Lau Lab | This paper | |
| Strain, strain background (Drosophila melanogaster) | HISR-D43 | Created in Lau Lab | This paper | |
| Strain, strain background (Drosophila melanogaster) | HISR-D46 | Created in Lau Lab | This paper | |
| Strain, strain background (Drosophila melanogaster) | HISR-D51 | Created in Lau Lab | This paper | |
| Strain, strain background (Drosophila melanogaster) | HISR-N10 | Created in Lau Lab | This paper | |
| Strain, strain background (Drosophila melanogaster) | HISR-N17 | Created in Lau Lab | This paper | |
| Strain, strain background (Drosophila melanogaster) | HISR-N25 | Created in Lau Lab | This paper | |
| Strain, strain background (Drosophila melanogaster) | HISR-N31 | Created in Lau Lab | This paper | |
| Strain, strain background (Drosophila melanogaster) | H{KP} | BDSC | Stock No. 64175 | y[1] w[67c23]; H{w[+mC]=KP}H |
| Strain, strain background (Drosophila melanogaster) | pi[2] | BDSC | Stock No.2384 | |
| Strain, strain background (Drosophila melanogaster) | OreR-MOD | BDSC | Stock No.25211 | |
| Strain, strain background (Drosophila melanogaster) | OreR-TK | BDSC | Stock No.2376 | |
| Strain, strain background (Drosophila melanogaster) | OreR-TOW | Terry Orr-Weaver's Lab | PMID: 21177974 | |
| Strain, strain background (Drosophila melanogaster) | RAL-42 | BDSC | Stock No.28127 | |
| Strain, strain background (Drosophila melanogaster) | RAL-377 | BDSC | Stock No.28186 | |
| Strain, strain background (Drosophila melanogaster) | RAL-508 | BDSC | Stock No.28205 | |
| Strain, strain background (Drosophila melanogaster) | RAL-855 | BDSC | Stock No.28251 | |
| Strain, strain background (Drosophila melanogaster) | H{CP}3 | BDSC | Stock No.64160 | y[1] w[67c23]; H{w[+mC]=hsp/CP}3 PMID: 12019234 |
| Strain, strain background (Drosophila melanogaster) | yw | John Abrams's Lab | PMID: 26701264 | |
| Strain, strain background (Drosophila melanogaster) | P{delta[2-3]}99B | BDSC | Stock No.3629 | w[*]; wg[Sp-1]/CyO; ry[506] Sb[1] P{ry[+t7.2]=Delta2-3}99B/TM6B, Tb[+] PMID: 3000622 |
| Strain, strain background (Drosophila melanogaster) | H{P delta[2-3]} | BDSC | Stock No.64161 | y[1] w[67c23]; H{w[+mC]=w[+].Delta2- 3.M}6 |
| Strain, strain background (Drosophila melanogaster) | P{TubGal80}Chr2 | BDSC | Stock No.7108 | |
| Strain, strain background (Drosophila melanogaster) | P{TubGal80}Chr3 | BDSC | Stock No.7017 | |
| Strain, strain background (Drosophila melanogaster) | P{Elav-Gal4}Chr2 | BDSC | Stock No.8765 | |
| Strain, strain background (Drosophila melanogaster) | Sp/CyO;TM6b/Sb | Michael Rosbash's Lab | ||
| Strain, strain background (Drosophila melanogaster) | Lerik-P | Stephane Ronsseray's Lab | PMID: 1660427 | Lk-P(1A)-SL2 |
| Strain, strain background (Drosophila melanogaster) | Birm | BDSC | Stock No. 2359 | Birm Chr2; PMID: 2835286 |
| software, algorithm | QuantaSoft Analysis Pro | Bio-Rad | ||
| software, algorithm | Applied Biosystems 7500/7500 Fast Real-Time PCR System v2.0 | Applied Biosystems | ||
| software, algorithm | BWA MEM | Li and Durbin, 2010 | PMID: 20080505 | |
| software, algorithm | TIDAL-Fly | Rahman et al., 2015 | PMID: 26578579 | |
| software, algorithm | GATK | McKenna et al., 2010 | PMID: 20644199 | |
| commerical assay or kit | TOPO PCR Cloning Kit | ThermoFischerSci | Cat No. 450031 | |
| commerical assay or kit | Luna Universal qPCR master mix | New England Biolabs Inc | Cat No. M3003 | |
| commerical assay or kit | NEB Ultra II FS DNA library prep | New England Biolabs Inc | Cat No. E7805 | |
| commerical assay or kit | First Strand cDNA Synthesis Kit using ProtoScript II | New England Biolabs Inc | Cat No. M0368 | |
| commerical assay or kit | NEBNext Small RNA Library Prep Set for Illumina | New England Biolabs Inc | Cat No. E7330 | |
| commerical assay or kit | QX200 ddPCR EvaGreen Supermix | Bio-Rad | Cat No. 1864034 | |
| Chemical compound, drug | Tri-reagent | Molecular Research Center Inc,OH | ||
| Chemical compound, drug | Q Sepharose Fast Flow, 300 mL | GE HealthCare | Cat No. 17051001 |
Additional files
-
Supplementary file 1
Oligonucleotides used in this study.
- https://cdn.elifesciences.org/articles/49948/elife-49948-supp1-v1.xls
-
Supplementary file 2
Whole genome sequencing and small RNA sequencing metadata.
- https://cdn.elifesciences.org/articles/49948/elife-49948-supp2-v1.xlsx
-
Transparent reporting form
- https://cdn.elifesciences.org/articles/49948/elife-49948-transrepform-v1.docx
Download links
A two-part list of links to download the article, or parts of the article, in various formats.
Downloads (link to download the article as PDF)
Open citations (links to open the citations from this article in various online reference manager services)
Cite this article (links to download the citations from this article in formats compatible with various reference manager tools)
Har-P, a short P-element variant, weaponizes P-transposase to severely impair Drosophila development
eLife 8:e49948.
https://doi.org/10.7554/eLife.49948


