A structural mechanism for phosphorylation-dependent inactivation of the AP2 complex
- Cornell University, United States
- School of Medicine, University of California, San Diego, United States
- University of California, San Diego, United States
Figures
Figure 1 with 3 supplements

NECAP PHear domain binds phosphorylated AP2 core.
(A) AP2 comprises four subunits: alpha (α), beta (β), mu (μ), and sigma (σ). The complex also comprises a structured ‘core’ (dashed box) connected by flexible linkers to appendages on the alpha and beta subunits. Binding sites for AP2 substrates are indicated. PIP2, PhosphatidylInositol-4,5-bisPhosphate. (B) (Top) NECAP domain organization (numbers are for human NECAP2). (Center) Conservation scores of NECAP residues calculated using the ConSurf server (Ashkenazy et al., 2010; Celniker et al., 2013). (Bottom) Truncation constructs used in this work. (C) Binding analysis of NECAP truncations compared to HaloTag control (-). HT, HaloTag; phosphoAP2, phosphorylated AP2 core. Representative image of three technical replicates. (D) Cryo-EM map of the phosphoAP2-NECAP complex (PDB 6OWO). Red: NECAP; Blue: AP2 mu; Gray: AP2 alpha, beta, sigma. See also Figure 1—figure supplement 1 and Figure 1—figure supplement 2.
Figure 1—figure supplement 1
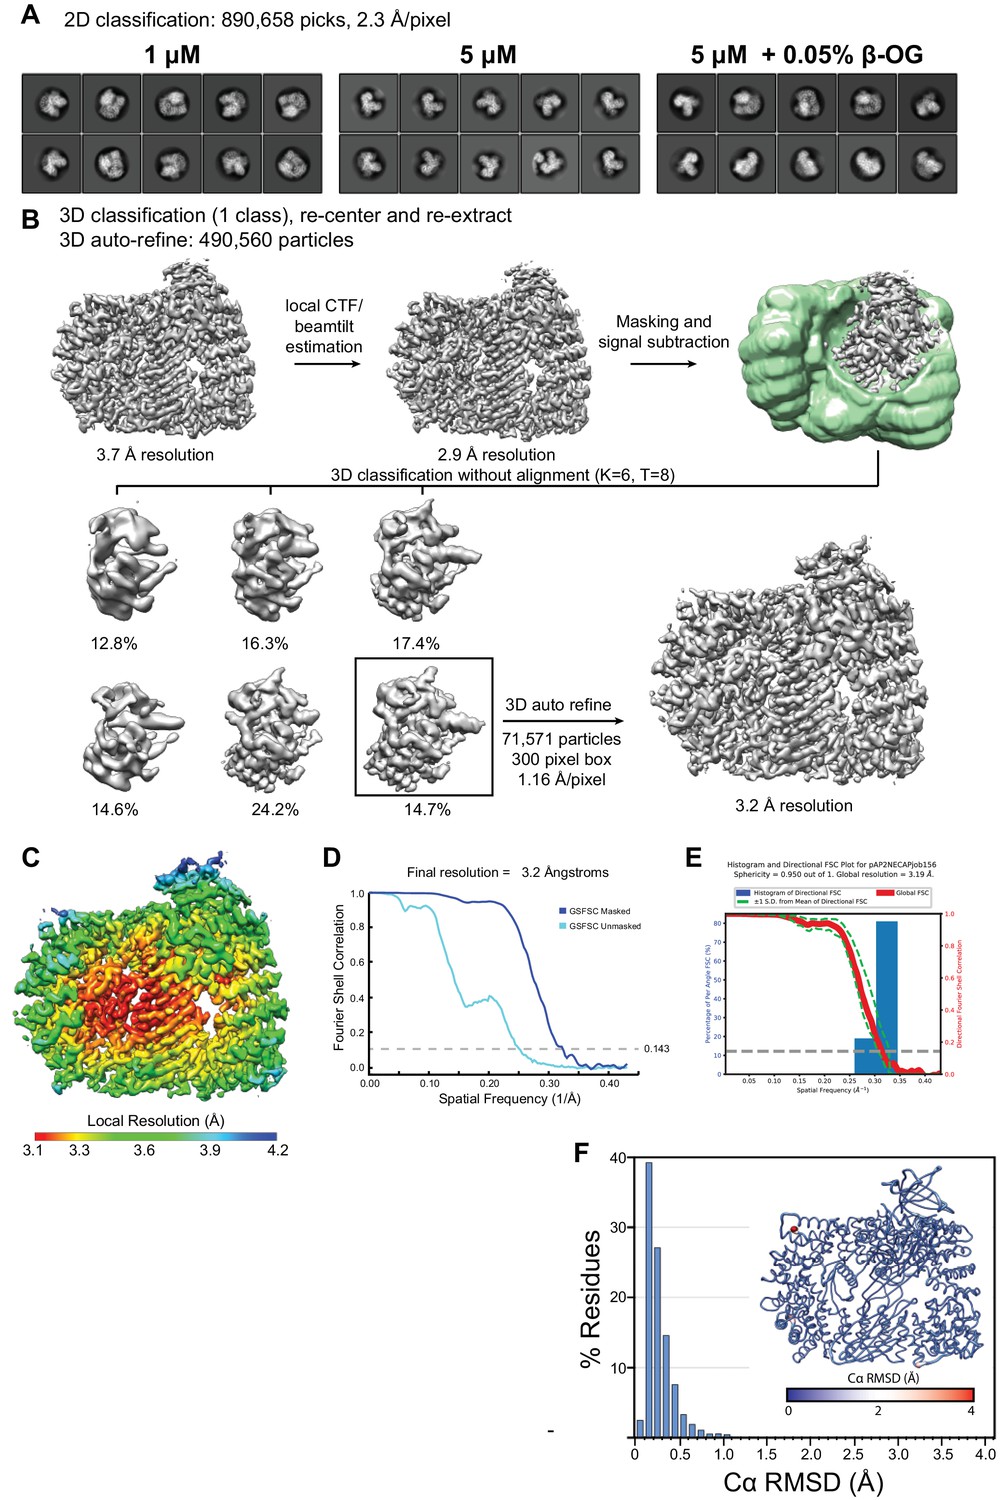
Classification, signal subtraction, and refinement of phosphoAP2 bound to NECAP.
(A) Representative 2D class averages demonstrating different particle orientation preferences under different grid preparation conditions. (B) Processing workflow for 3D classification and refinement of phosphoAP2-NECAP using the Relion three software suite. (C) Cryo-EM map colored by local resolution (Relion 3). (D) Fourier Shell Correlation (FSC) plot. (E) 3D FSC plot. An overall sphericity of 0.95 shows that resolution is nearly uniform in three dimensions. (F) Histogram plot of Cα RMSD of top ten molecular models from Rosetta refinement. Inset shows molecular model colored and scaled by RMSD.
Figure 1—figure supplement 2
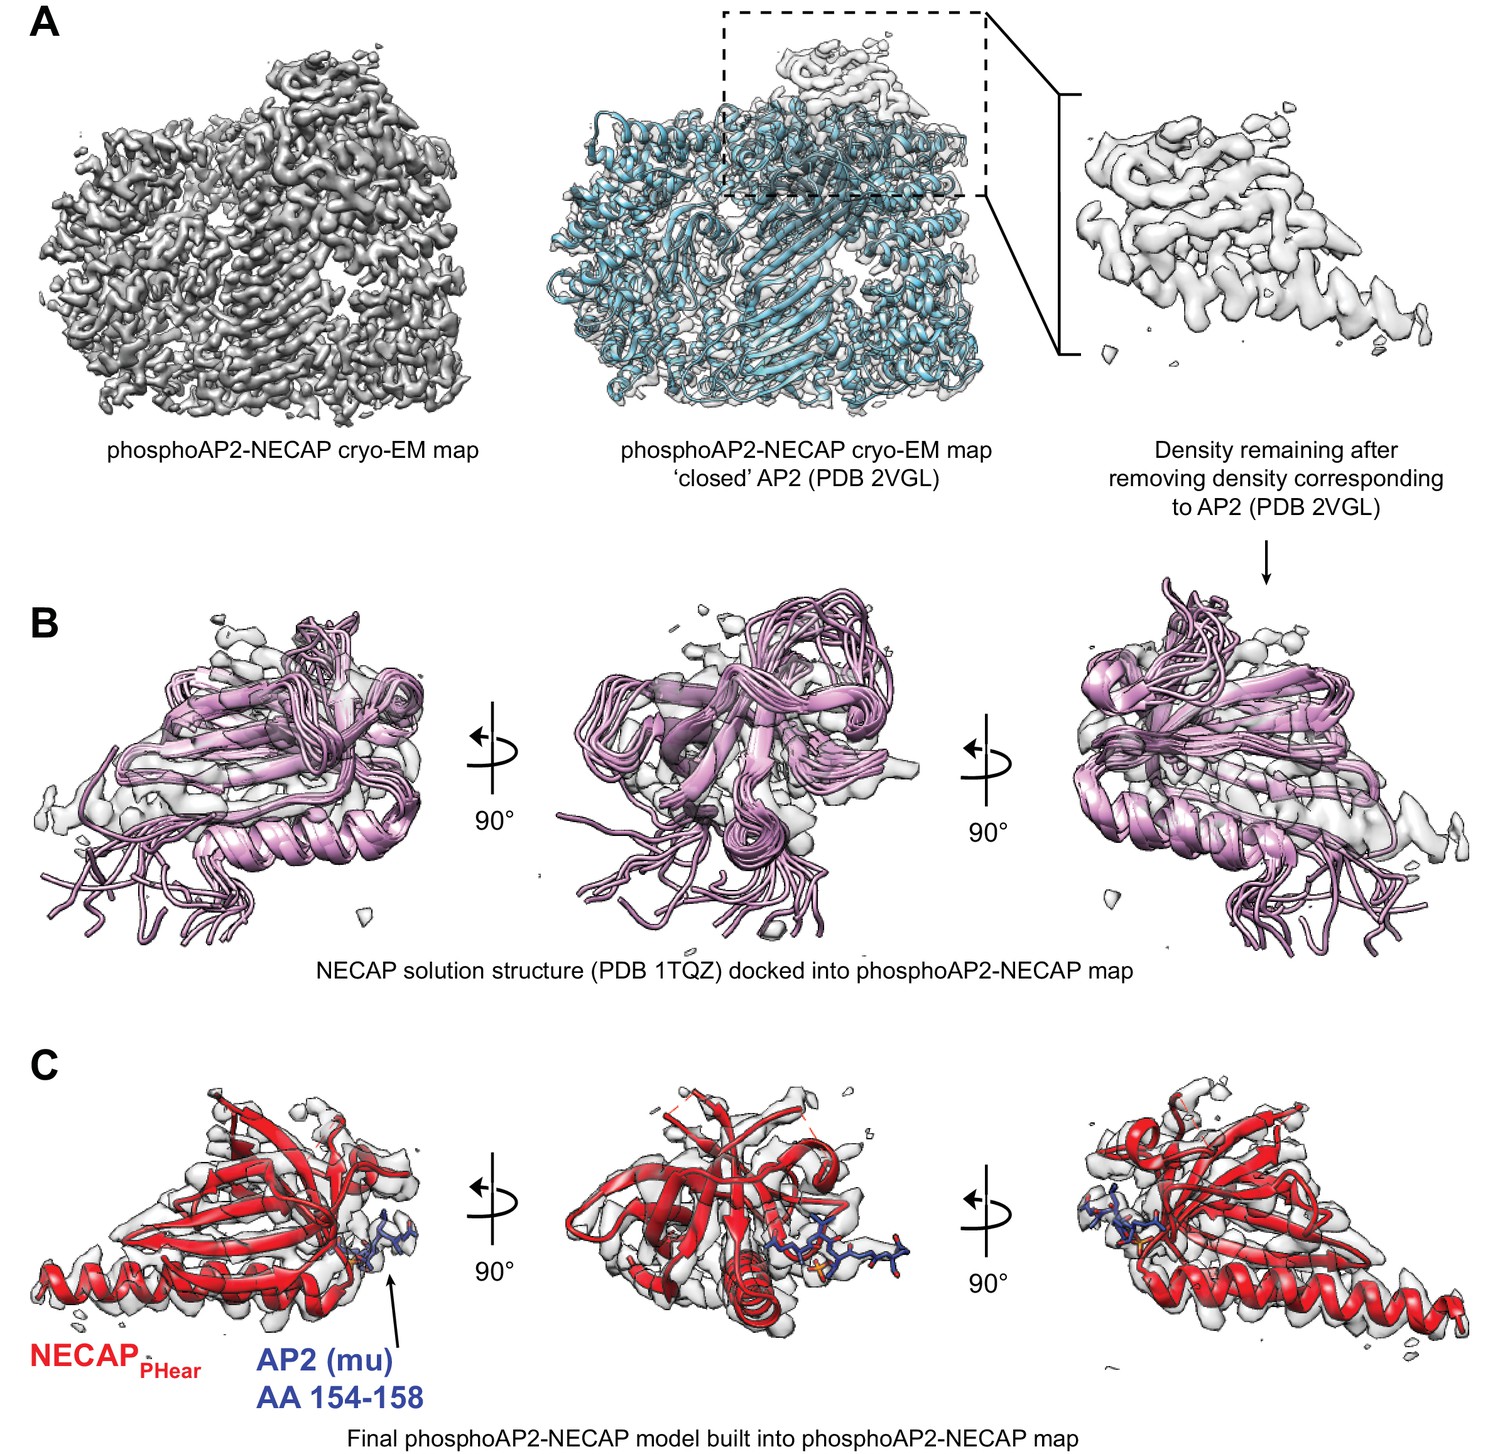
Comparison of NECAP solution structure and phosphoAP2-NECAP cryo-EM structure.
(A) Cryo-EM map of phosphoAP2-NECAP is shown with a solid surface (left) and with a transparent surface with the closed AP2 crystal structure docked (middle). Masking the region corresponding to AP2 and subtracting this density from the full map gives a psuedo difference density map (right). (B) Solution structure of NECAPPHear (PDB 1TQZ) docked into the difference density from (A). NECAPPHear comprises a single alpha helix and beta sheet, which can be clearly seen in the cryo-EM density. However, the solution structure has some conformational differences compared to the AP2-bound cryo-EM structure. (C) The molecular model for NECAPPHear and AP2 mu (AA 154–158) are shown in the cryo-EM density. PDB 1TQZ was used as a starting model to manually rebuild in Coot and refine using Rosetta.
Figure 1—figure supplement 3
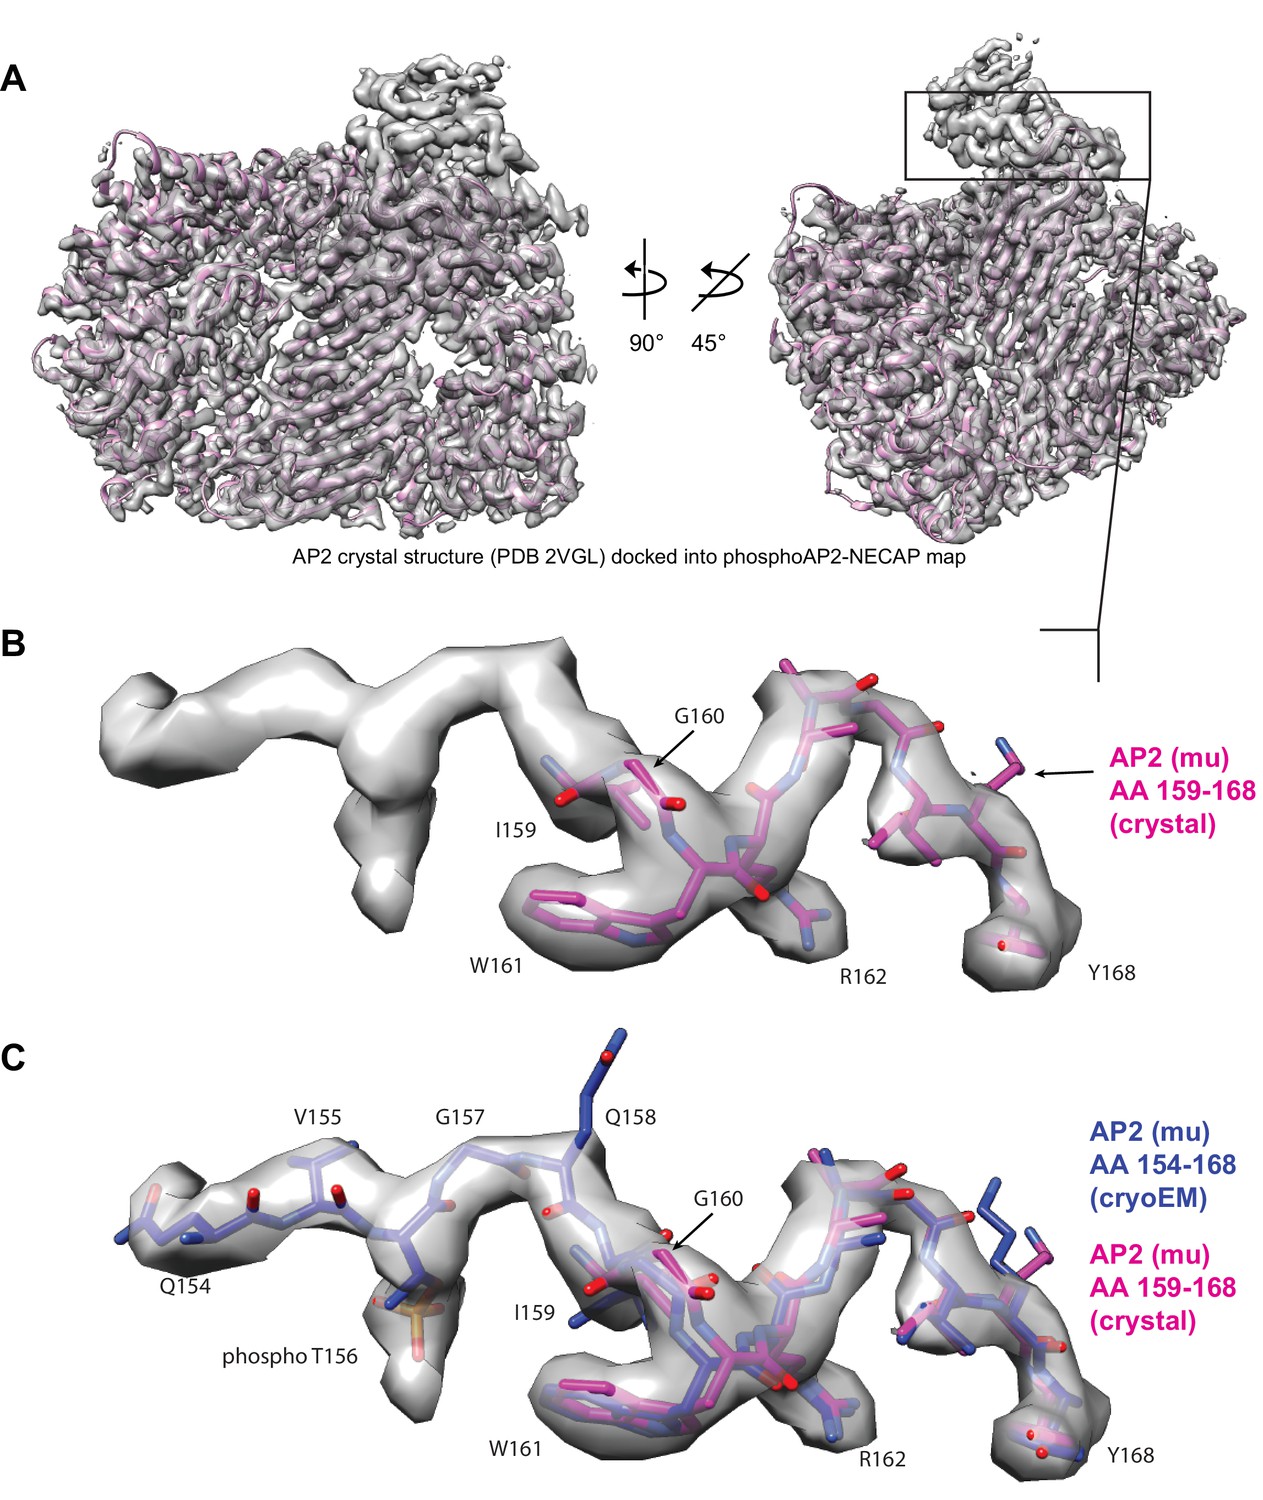
Model building for mu pT156 linker region.
(A) Cryo-EM map of phosphoAP2-NECAP is shown with a crystal structure of ‘closed’ AP2 docked (2VGL.pdb) (B) The mu linker, which contains the phosphoryalted T156 residue, is shown in closer detail. In the crystal structure, T156 is unmodified and the model ends in this region at residue 159. (C) The mu linker region (AA 154–168) from the molecular model for phosphoAP2-NECAP is shown overlaid with the same region from the AP2 crystal structure (2VGL.pdb). Our map contains additional density in this linker region, and residues 154–158 were built extending from the N-terminus of the 2VGL model at residue 159. The model was built manually in Coot and refined using Rosetta CM.
Figure 2
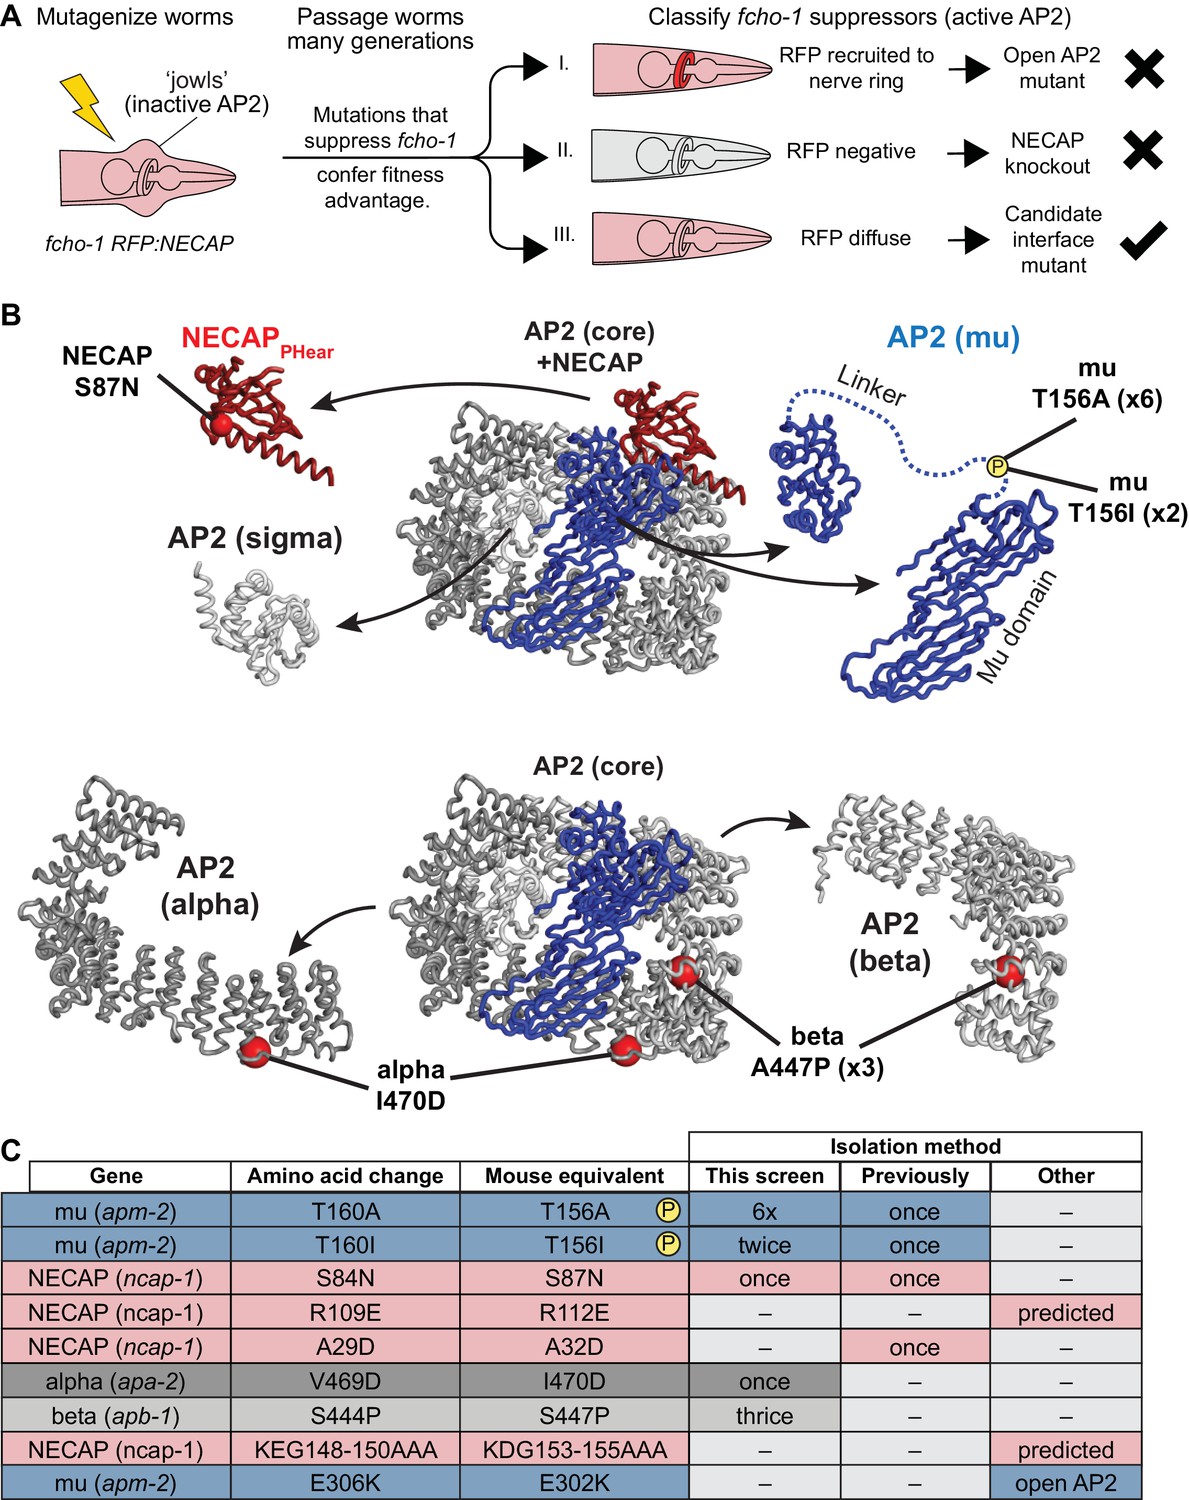
Genetic screen for NECAP-AP2 interface mutations.
(A) Schematic of genetic screen to identify residues important for AP2-NECAP binding. FCHo mutants (fcho-1) exhibit growth defect and ‘jowls’ phenotype due to inactive AP2 (cartoon is anterior of worm). Fluorescent tag on NECAP (RFP:NECAP) enables visual categorization of suppressor mutations that restore AP2 activity. (B) Mutations identified in (A) mapped as red spheres onto the subunits of the closed AP2 crystal structure (2VGL) and our NECAPPHear cryo-EM structure (PDB 6OWO). (C) Table of C. elegans mutations and their vertebrate equivalents referenced in this manuscript.
Figure 3 with 1 supplement
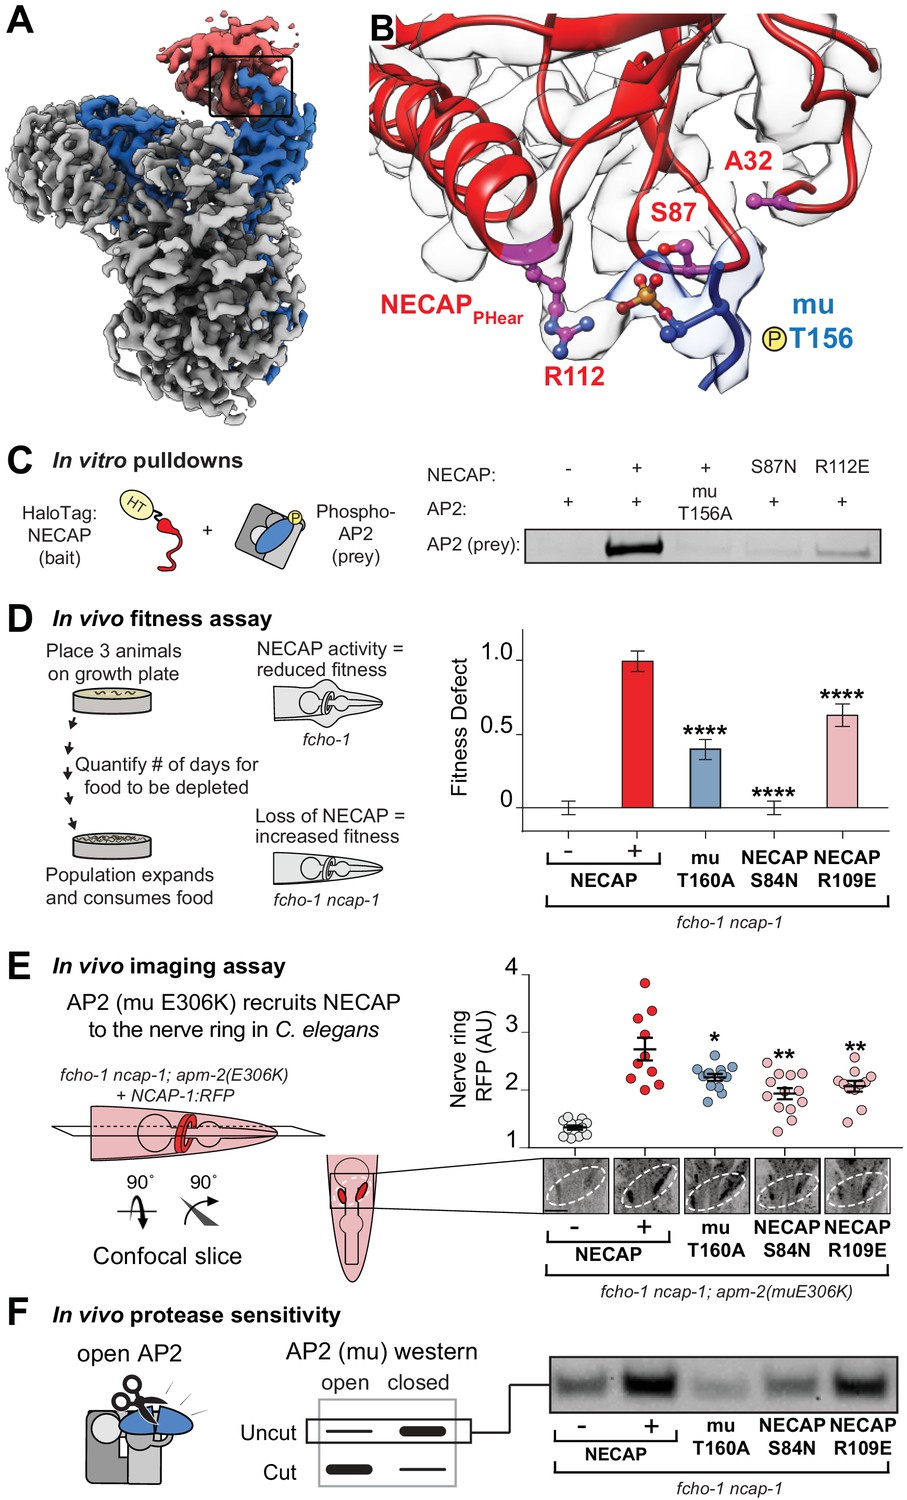
Coordination of phosphorylated AP2 by NECAP is required for inactivation.
(A) Cryo-EM of phosphoAP2-NECAP complex, boxed region shown in (B). (B) phosphoAP2-NECAP interface as a ribbon diagram inside a transparent rendering of the cryo-EM map with ball-and-stick representation of relevant NECAP side chains and mu pT156. Red: NECAP; Blue: AP2-mu. See also Figure 3—figure supplement 1. (C) Binding analysis of interface mutants compared to HaloTag control (–). HT, HaloTag. Representative image of two technical replicates. (D) In the absence of NECAP (–), fcho-1 mutants take about 4 days to proliferate and consume a bacterial food source (fitness defect = 0). Expression of NECAP (+) increases the number of days to about 8 (fitness defect = 1). Data for interface mutants were normalized to this fitness defect; n = 10 biological replicates. (E) (Left) In fcho-1; apm-2 (E306K) mutant worms, NECAP is recruited to the nerve ring. Interface mutants disrupt nerve ring recruitment, as quantified by in vivo confocal microscopy. (Right) Normalized RFP intensities plotted above representative confocal nerve ring images of ten biological replicates. (D–E) Error bars indicate mean ± SEM. Significance compared to NECAP (+); Student’s t-test performed on raw data (D) or normalized data (E). *p<0.05, **p<0.01, ***p<0.001, ****p<0.0001. (F) In vivo protease sensitivity assay to probe AP2 conformation in genetic backgrounds indicated. In the absence of NECAP (–), AP2 is protease sensitive (open). Expression of wild type NECAP (+) results in protease resistant AP2 (closed). All strains lack fcho-1.
Figure 3—figure supplement 1
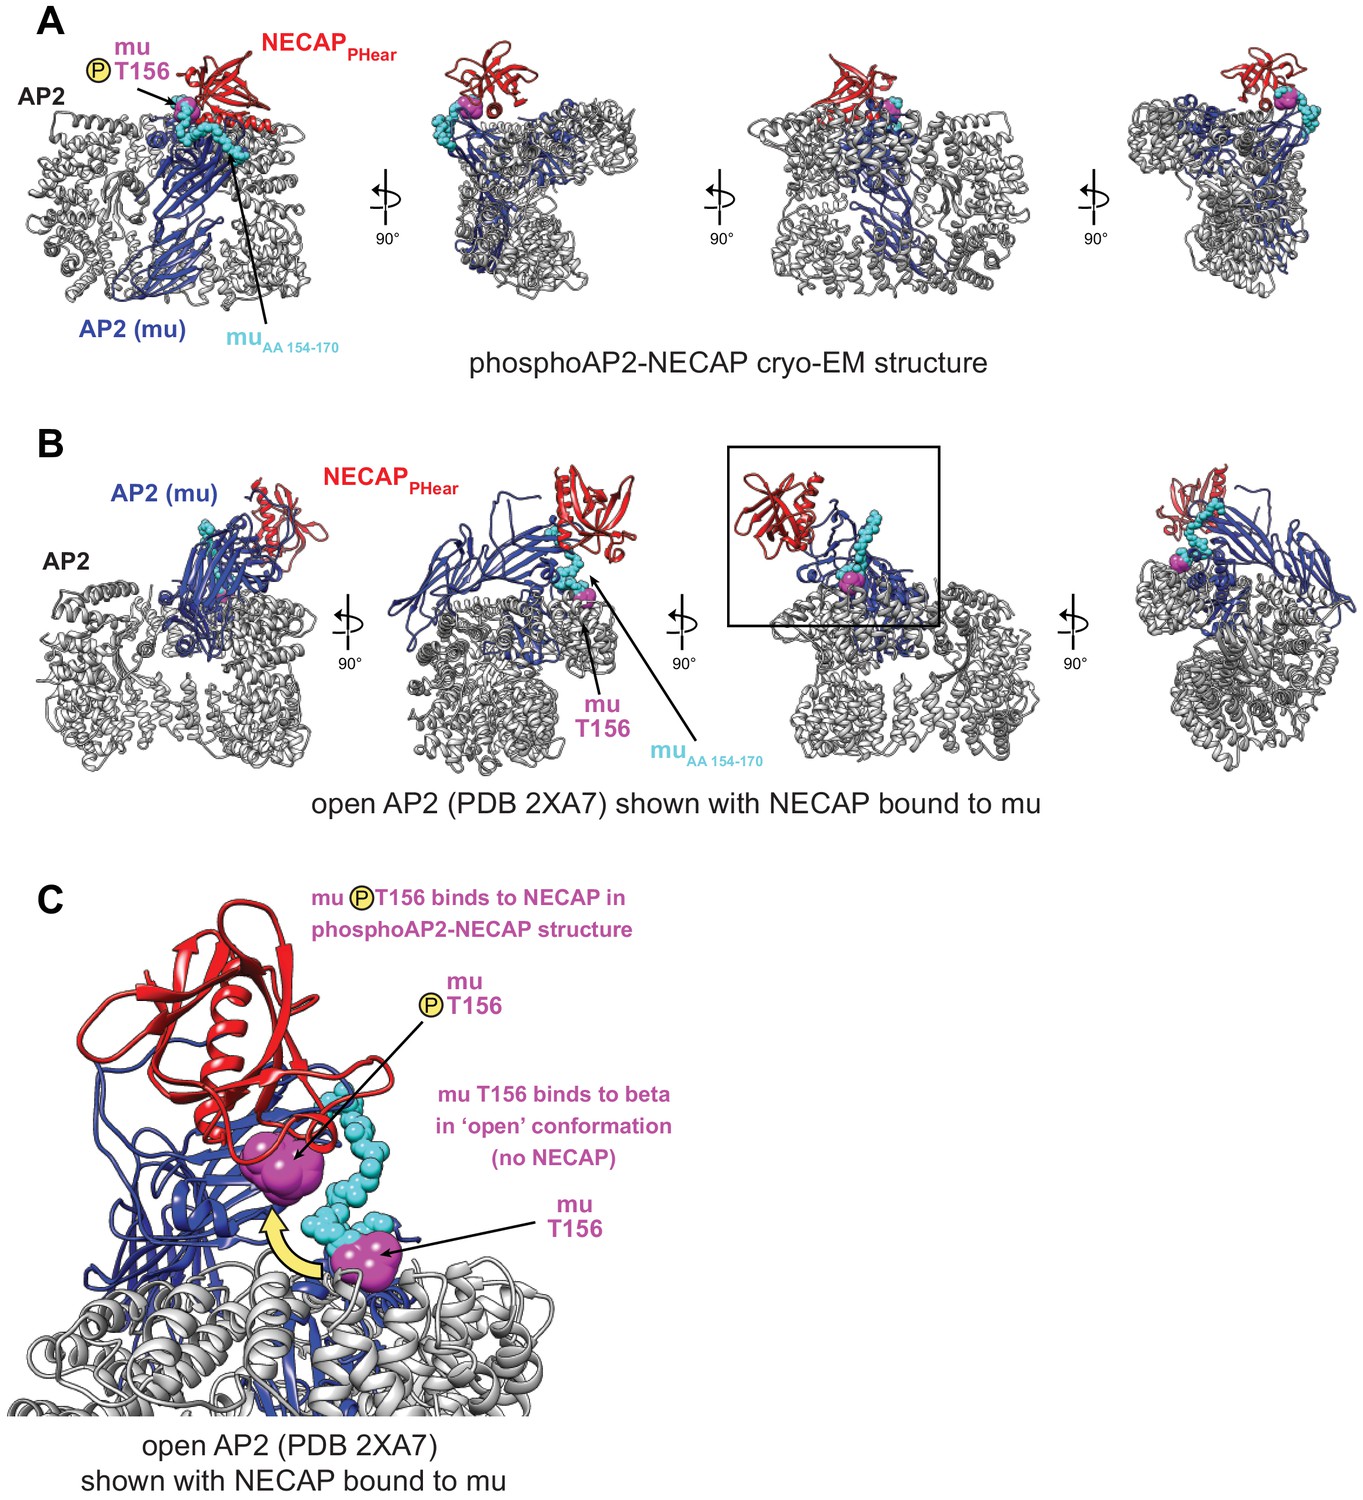
Comparison of NECAP binding site in open and closed AP2 conformations.
(A) phosphoAP2-NECAP structure. The mu subunit is colored blue, with residues 154–170 colored cyan, and pT156 colored magenta. NECAPPHear is colored red. (B) Model of open AP2 bound to NECAPPHear colored as in (A). NECAPPHear was docked onto the open AP2 conformation (PDB 2XA7) by aligning the mu homology domain (AA 160–435) of the two models. The NECAPPHear binding site on the mu subunit is solvent exposed in both structures, except the mu linker packs against beta in the open conformation, including T156. (C) Model of open AP2 bound to NECAP as shown boxed in (B). The location of muT156 is highlighted for the phosphoAP2-NECAP structure and the open AP2 structure. While there are no steric clashes preventing NECAP binding to open AP2, access to and phosphorylation of muT156 is a key determinant of NECAP binding.
Figure 4 with 1 supplement
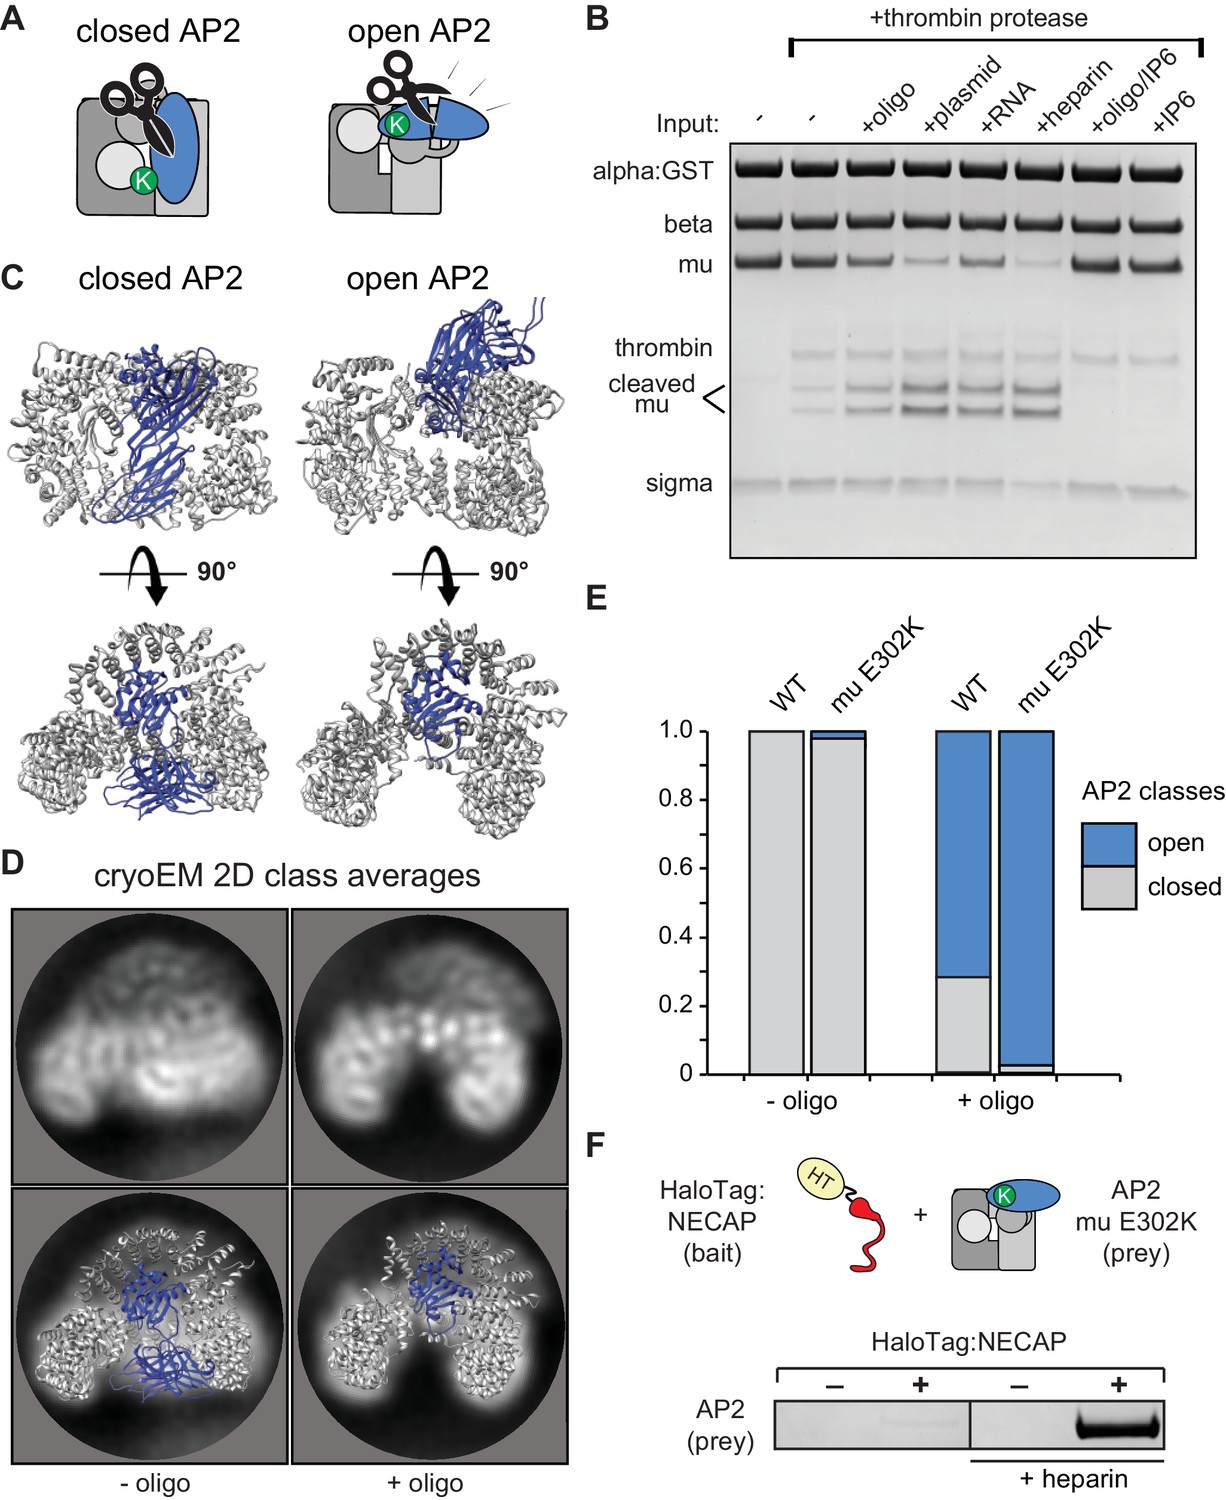
Membrane mimetics stimulate opening of AP2.
(A) Schematic of protease sensitivity assay. Open AP2 exposes thrombin site on mu. K, mu E302K mutation. (B) Protease sensitivity of AP2 (mu E302K) in the presence of anionic polymers. Oligo, 60 nucleotide single-stranded DNA; plasmid, double-stranded DNA; RNA, total yeast RNA; IP6: inositol hexakisphosphate. (C) AP2 crystal structures (left, PDB 2VGL; right, PDB 2XA7) (D) (Top) Representative AP2 cryo-EM 2D class averages in the absence (left) or presence of oligo (47 nucleotide single-stranded DNA, right). (Bottom) Images from above overlaid with closed (left) or open (right) AP2 crystal structures. Blue: AP2 mu. The C-terminal domain of mu was omitted from the open crystal structure, as it is disordered in our cryo-EM class averages. (E) Proportion of AP2 particles assigned to either closed (gray) or open (blue) class averages. Data represents ten technical replicates (see definition of technical replicates for this assay in methods). See also Figure 4—figure supplement 1. (F) Binding analysis of NECAP to AP2 (mu E302K) in the presence or absence of heparin. HT, HaloTag; K, mu E302K mutation. HaloTag control (-). Representative image of three technical replicates.
Figure 4—figure supplement 1
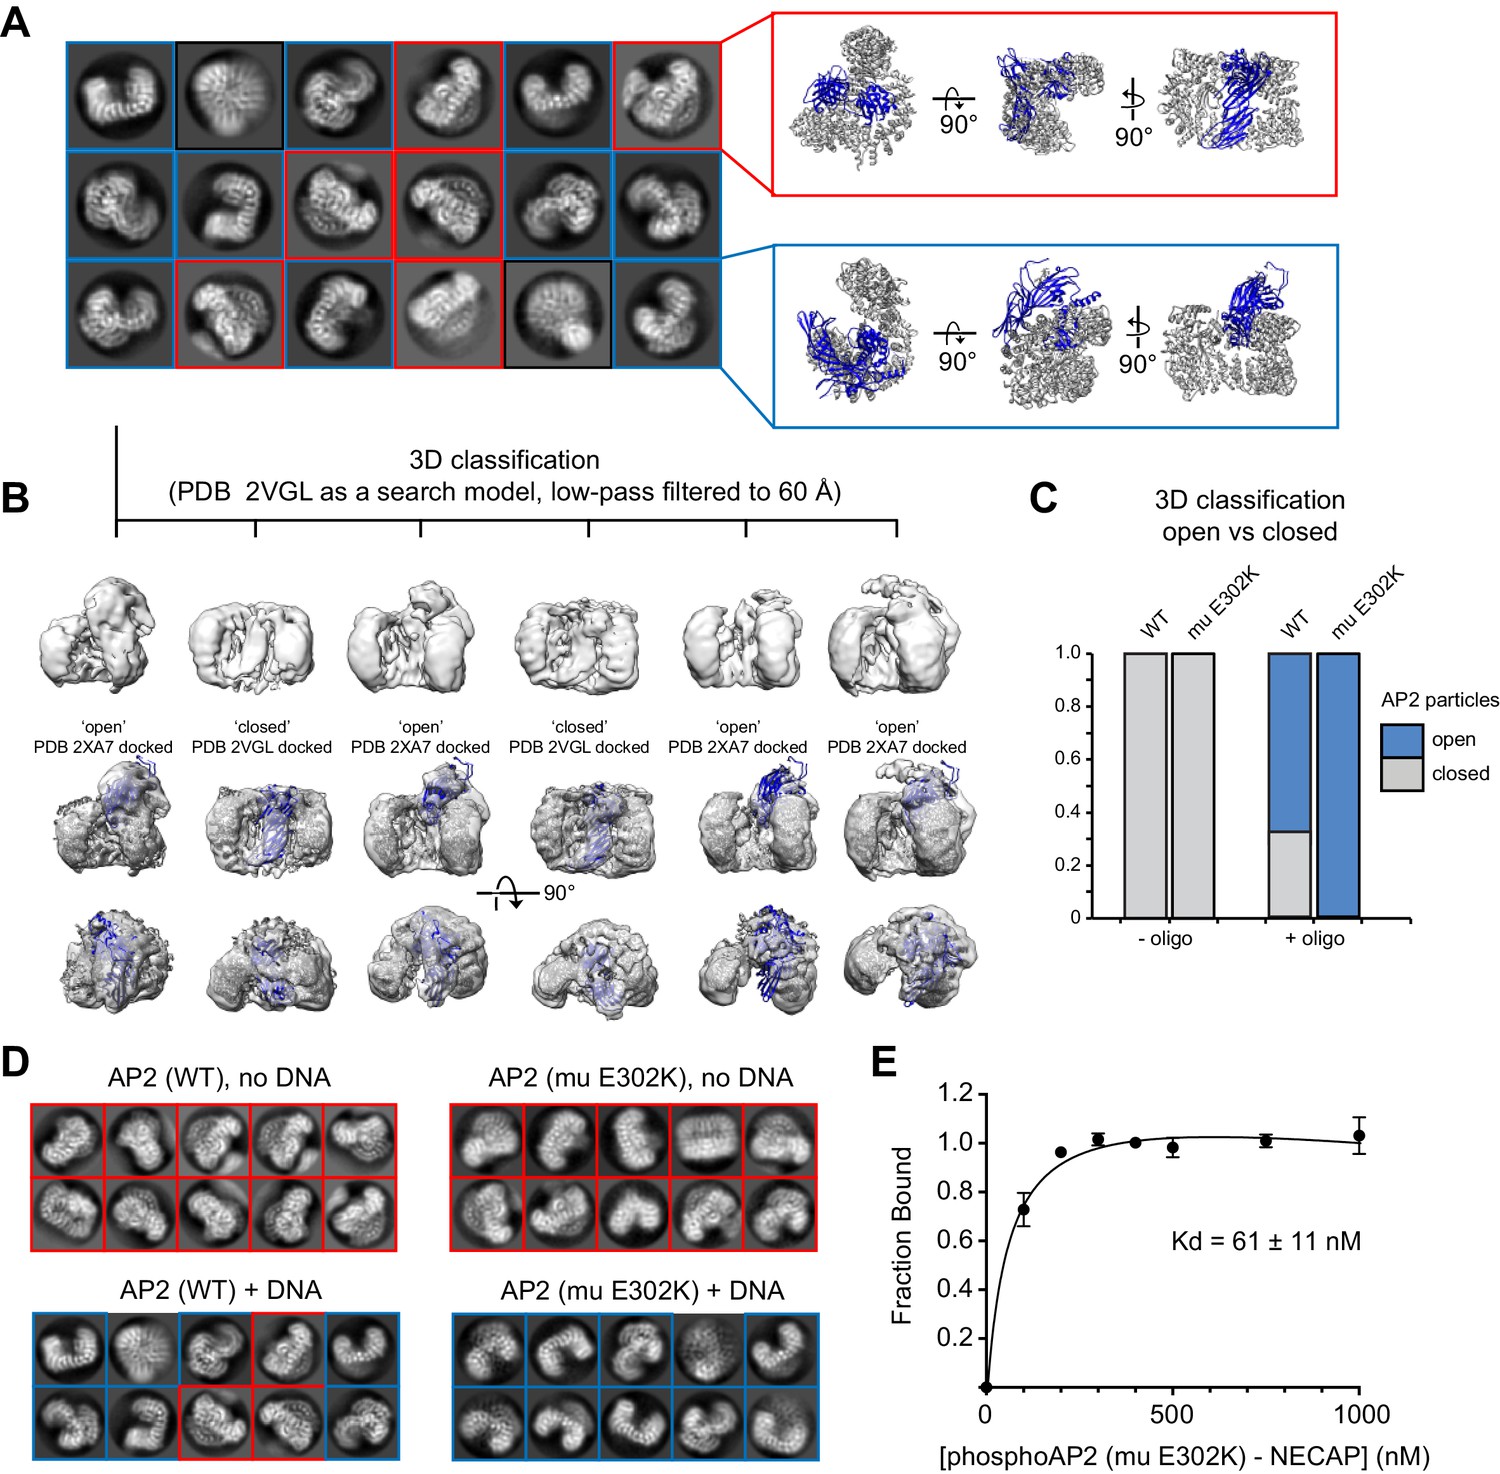
Cryo-EM analysis of AP2 in the presence of an anionic polymer (DNA).
(A) 2D class averages for WT AP2 + DNA are shown. Averages corresponding to the closed conformation (red inset) and open conformation (blue inset) are shown next to their respective molecular models (PDB 2VGL; PDB 2XA7). (B) 3D classification shows that the dataset contains a mixture of open and closed conformations. Classification was performed in Relion 3. Resolution is limited for all open structures because of an extreme preferred orientation in the cryo-EM grids. (C) Quantification of 3D classification. Four datasets were analyzed and the percentage of particles that classified into open or closed 3D classes were quantified and plotted. (D). Representative 2D class averages from AP2 samples. Mutations and the presence of DNA are labeled. DNA is in a 5-fold molar excess. Closed 2D classes are boxed in red, open 2D classes are boxed in blue. (E) Binding curve of phosphoAP2 (mu E302K)-NECAP and a 47 bp ssDNA oligo. 20 nM DNA was incubated with increasing amounts of phosphoAP2-NECAP. A native gel shift assay was used to measure binding. Data was plotted and analyzed using the Prism software package.
Figure 5 with 2 supplements
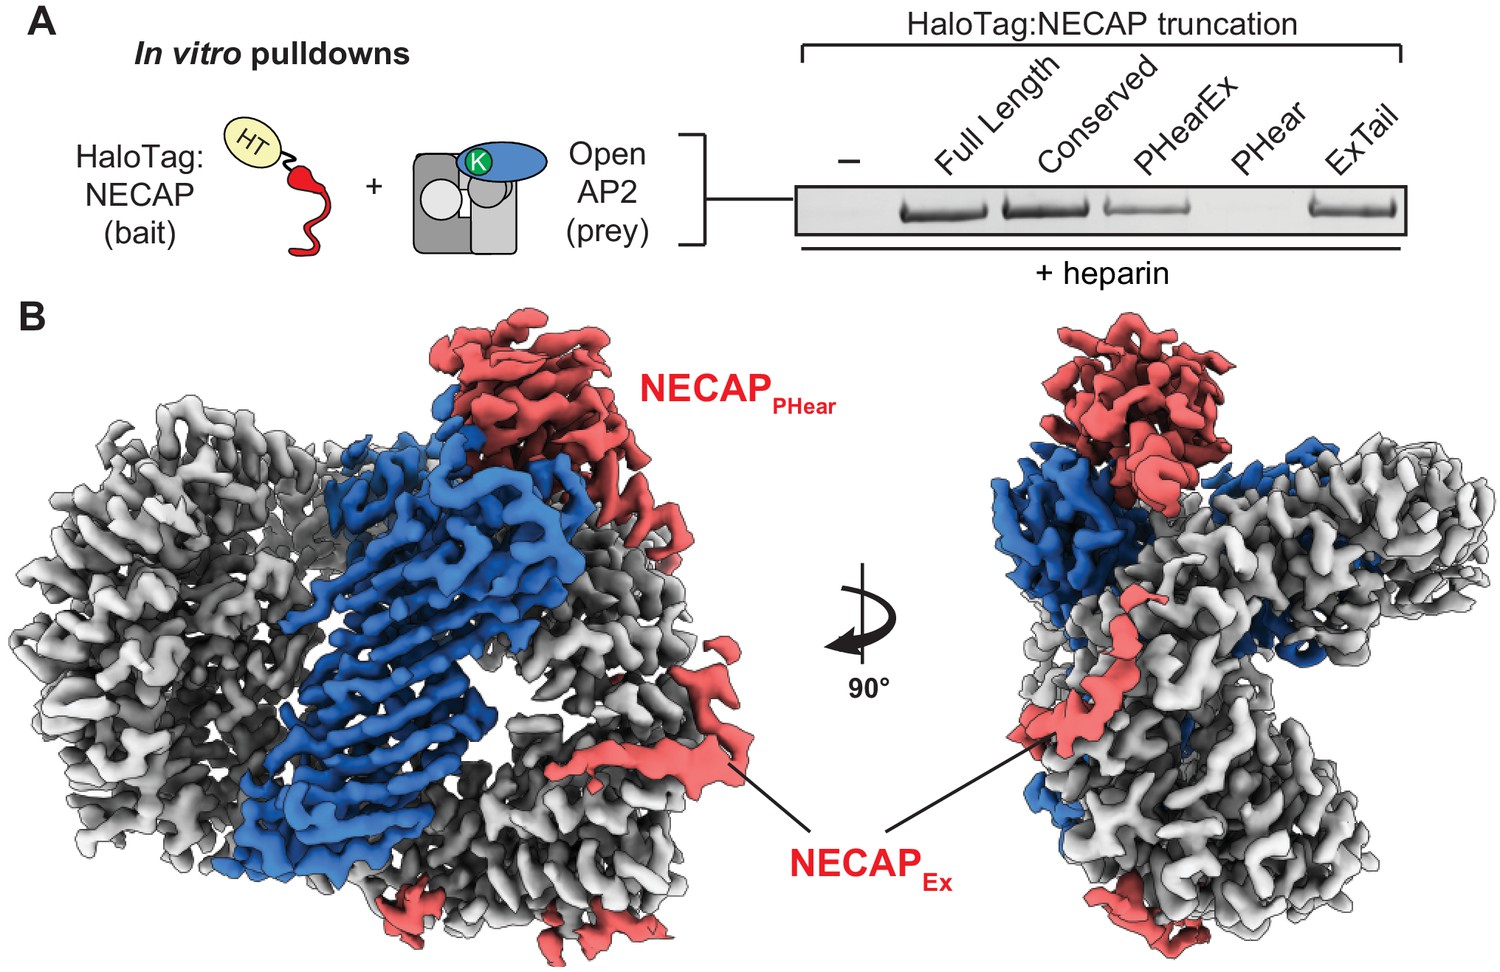
NECAPEx recognizes membrane-activated AP2.
(A) Binding analysis of NECAP truncations to AP2 (mu E302K) in the presence of heparin. HaloTag control (-). Representative image of two technical replicates. (B) Cryo-EM density of the phosphorylated AP2 (mu E302K)-NECAP complex in the presence of oligo (PDB 6OXL, 47 nucleotide single-stranded DNA, five molar excess). See also Figure 5—figure supplement 1, Figure 5—figure supplement 2.
Figure 5—figure supplement 1
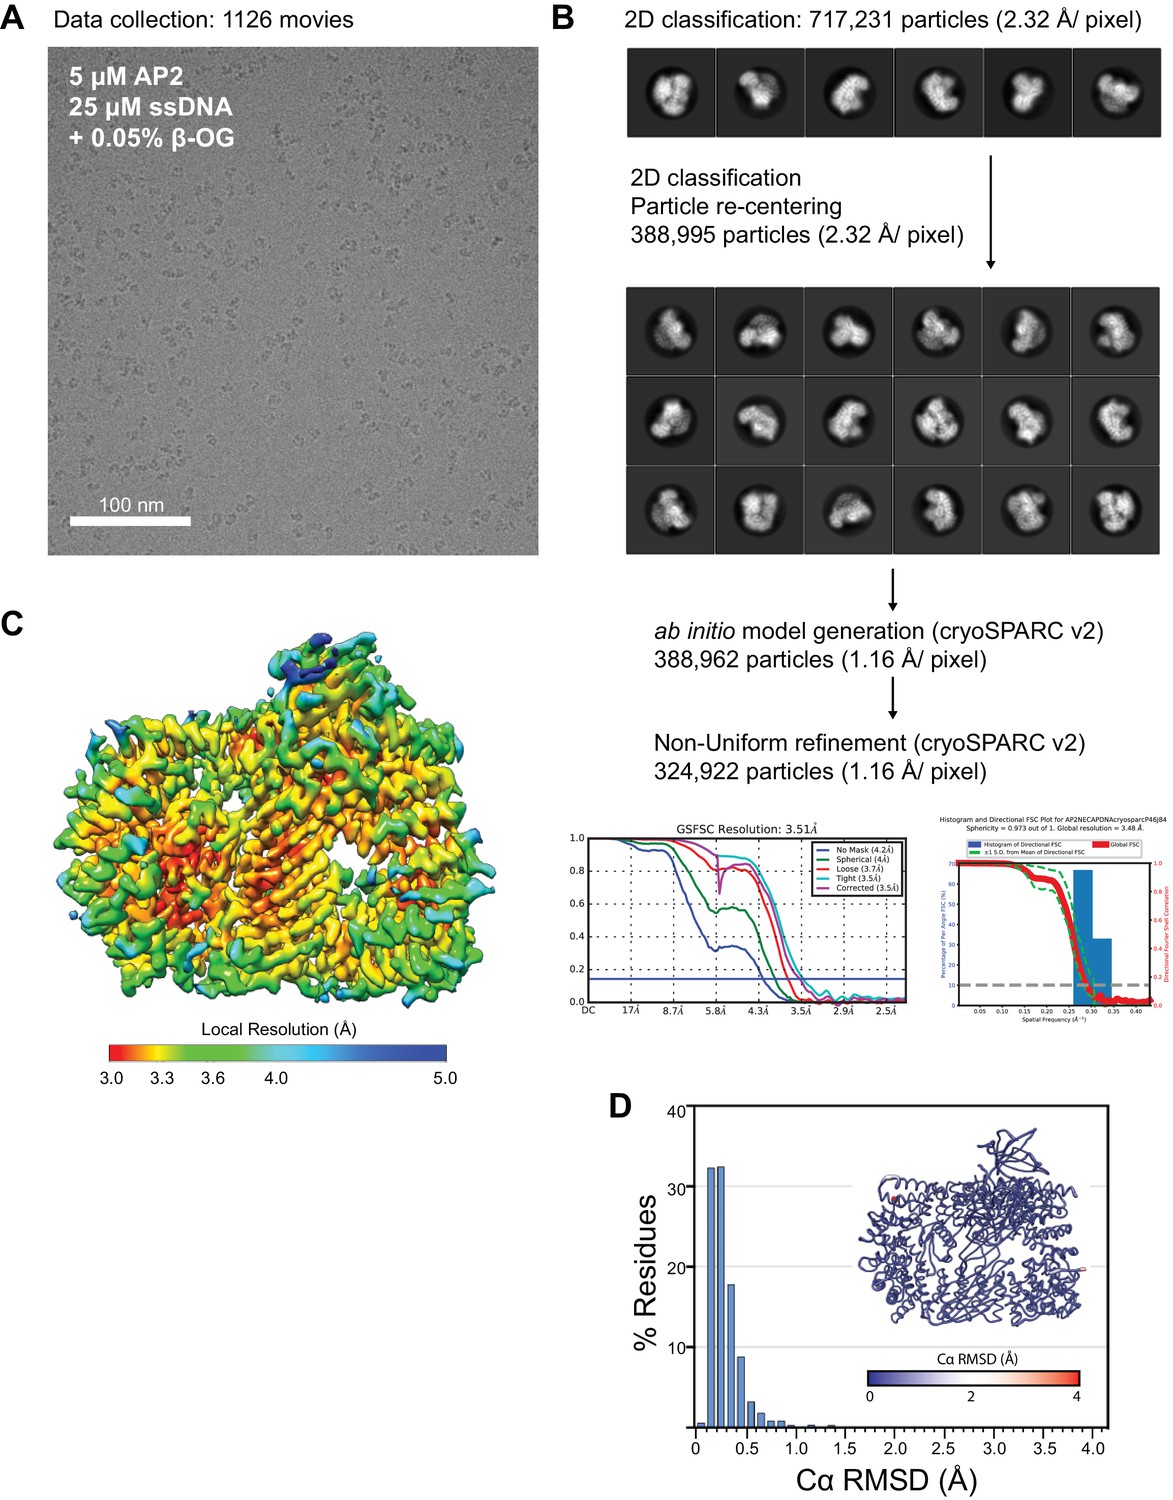
Cryo-EM data collection, processing, and model building for phosphoAP2-NECAP-DNA ‘clamped’ structure.
(A) Representative motion-corrected, dose-weighted cryo-EM micrographs of phosphoAP2-NECAP-DNA complex. (B) Classification and refinement pipeline used for structure determination. Particles were extracted and 2D classified in Relion3. ‘Clean’ particles were re-extracted and used for ab initio model generation and refinement in cryoSPARC v2. 2D and 3D FSC plots are shown for the final model. (C) Final cryo-EM structure colored by local resolution. (D) Histogram plot of Cα RMSD of top ten molecular models from Rosetta refinement. Inset shows molecular model colored and scaled by RMSD.
Figure 5—figure supplement 2
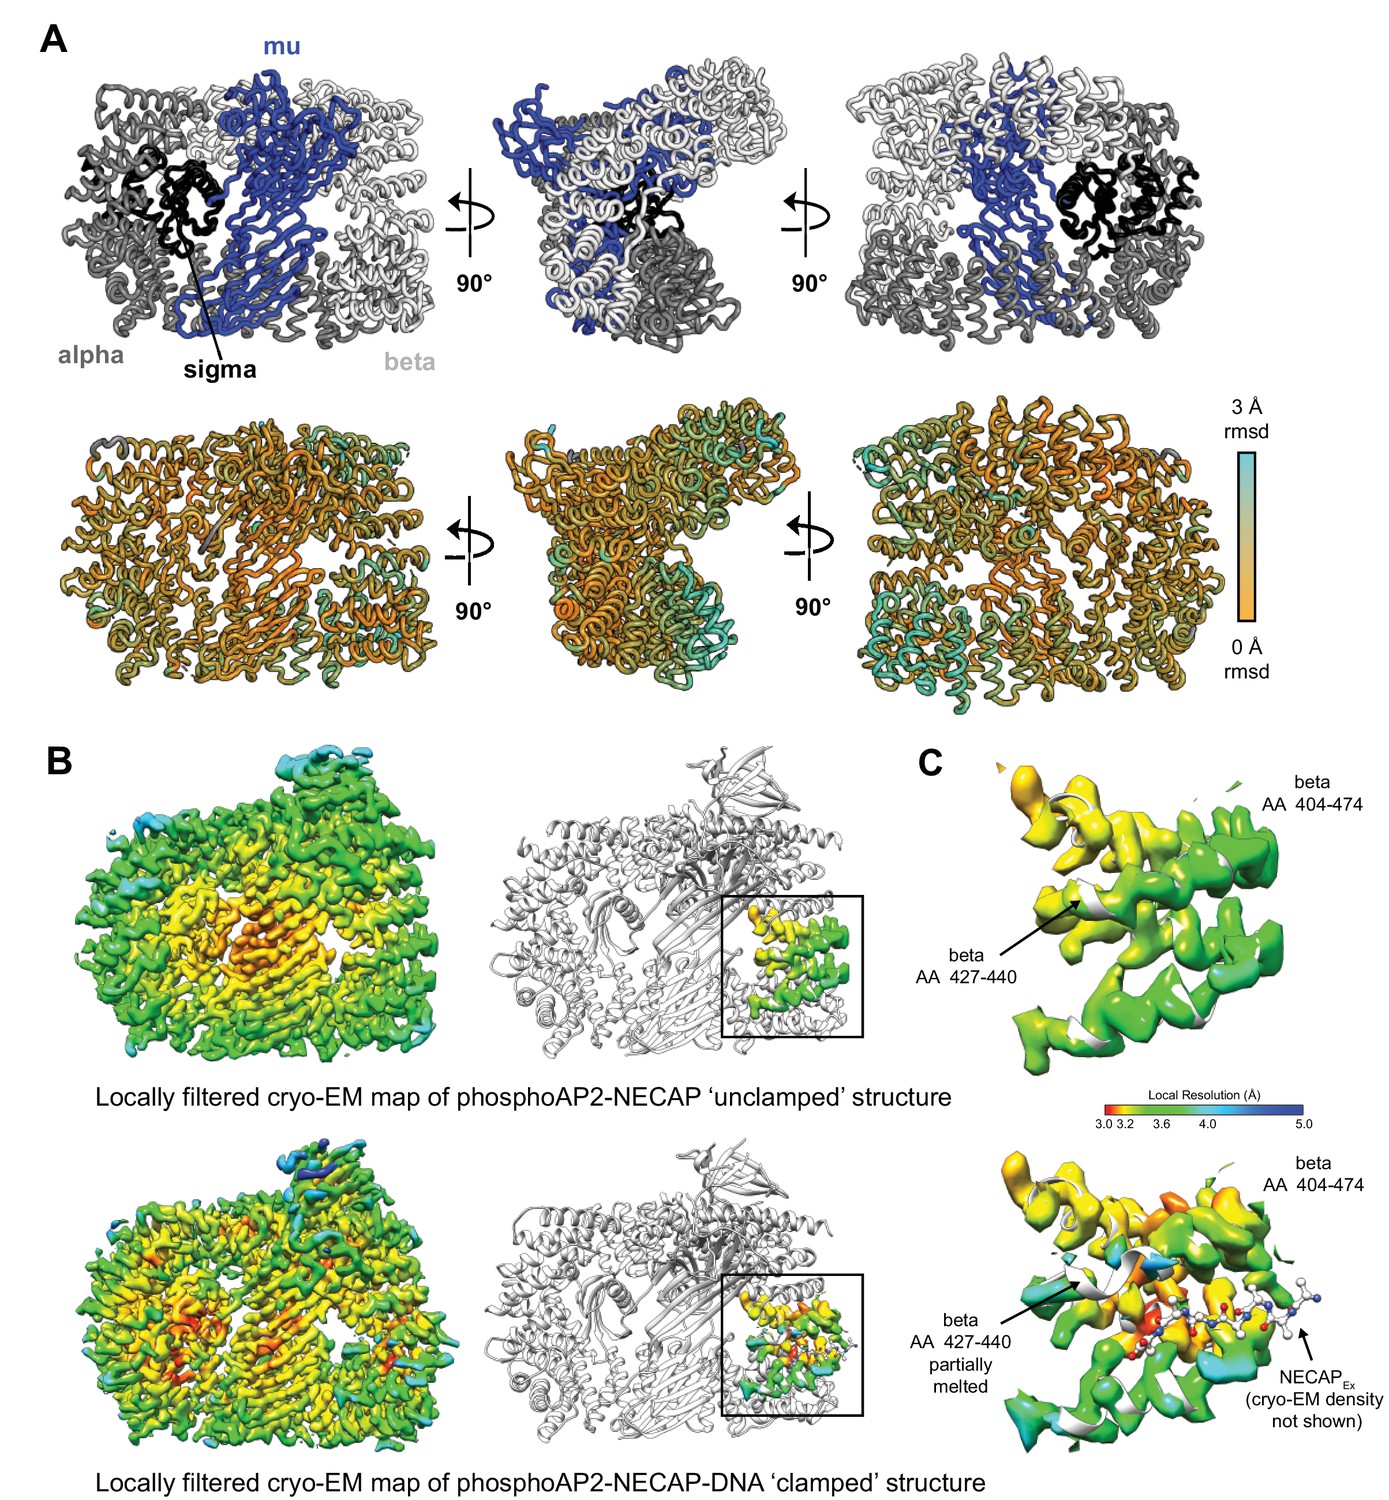
Structural comparison of ‘unclamped’ and ‘clamped’ phosphoAP2-NECAP structures.
(A) Cartoon diagram of phosphoAP2-NECAP ‘unclamped’ structure. NECAP is not shown. Top: AP2 subunits are colored as labeled. Bottom: AP2 is colored by per-residue RMSD. Values were calculated in PyMol using whole-molecule alignment of ‘unclamped’ vs ‘clamped’ phosphoAP2-NECAP. (B) Cryo-EM maps of ‘unclamped’ (top) and ‘clamped’ (bottom) phosphoAP2-NECAP structures. Maps were locally filtered by local resolution to Standardize comparison between maps. Cryo-EM density corresponding to beta AA 404–474 is shown (right). Both maps are colored by local resolution using the same color gradient (color key in (C)). (C) The NECAPEx binding site (beta AA 404–474) is shown for the ‘unclamped’ phosphoAP2-NECAP (top) and ‘clamped’ phosphoAP2-NECAP (bottom) structures. A small region of beta partially melts when the Ex domain is bound.
Figure 6 with 1 supplement
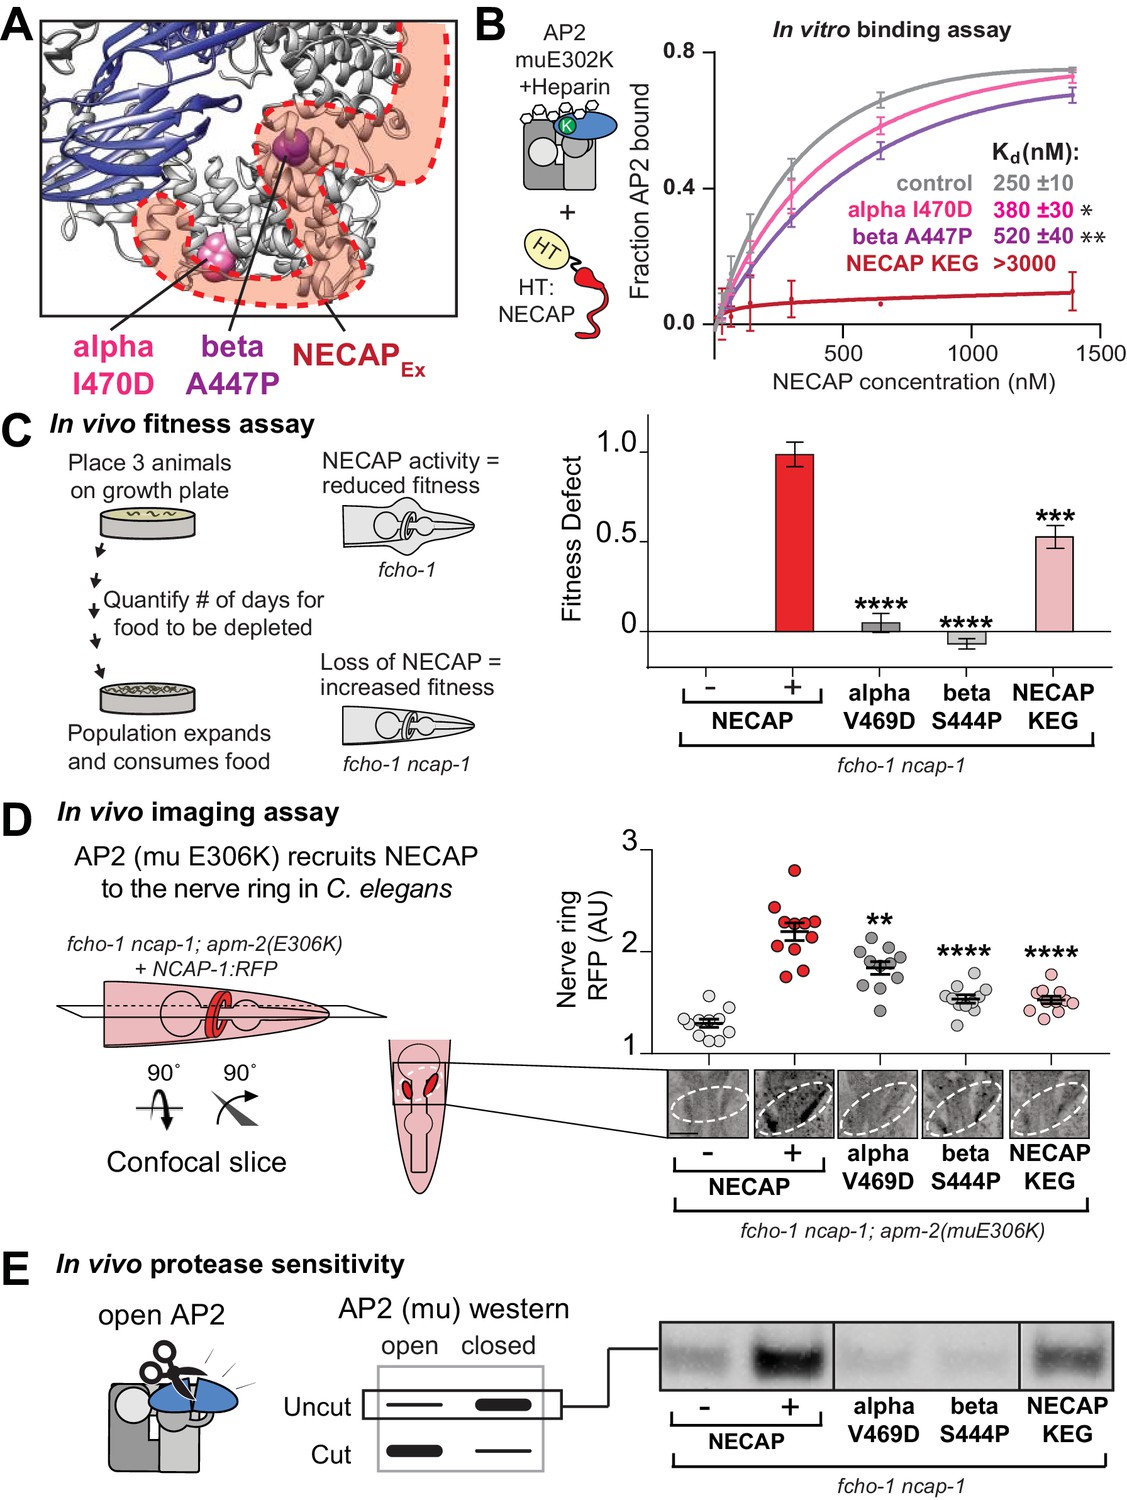
The AP2-NECAPEx interface is required for inactivation.
(A) Residues identified in our genetic screen (see Figure 2) shown as colored spheres on a ribbon diagram of AP2 with outline of NECAPEx density (red, low isosurface threshold, see Figure 6—figure supplement 1). (B) Binding curves generated from pulldown depletion assays. Error bars represent mean ± SEM from three technical replicates. Inset: Calculated Kd values, variance is SEM. *p<0.05, **p<0.01, relative to control. (C) In the absence of NECAP (–), fcho-1 mutants take about 4 days to proliferate and consume a bacterial food source (fitness defect = 0). Expression of NECAP (+) increases the number of days to about 8 (fitness defect = 1). Data for interface mutants were normalized to this fitness defect; n = 10 biological replicates. (D) In fcho-1; apm-2 (E306K) mutant worms, NECAP is recruited to the nerve ring. Interface mutants disrupt nerve ring recruitment. Normalized RFP intensities plotted above representative confocal nerve ring images of ten biological replicates. (C–D) Error bars indicate mean ± SEM. Significance compared to NECAP (+); Student’s t-test performed on raw data (C) or normalized data (D). *p<0.05, **p<0.01, ***p<0.001, ****p<0.0001. (E) In vivo protease sensitivity assay to probe AP2 conformation in genetic backgrounds indicated. In the absence of NECAP (–), AP2 is protease sensitive (open). Expression of wild type NECAP (+) results in protease resistant AP2 (closed). All strains lack fcho-1. See also Figure 6—figure supplement 1.
Figure 6—figure supplement 1
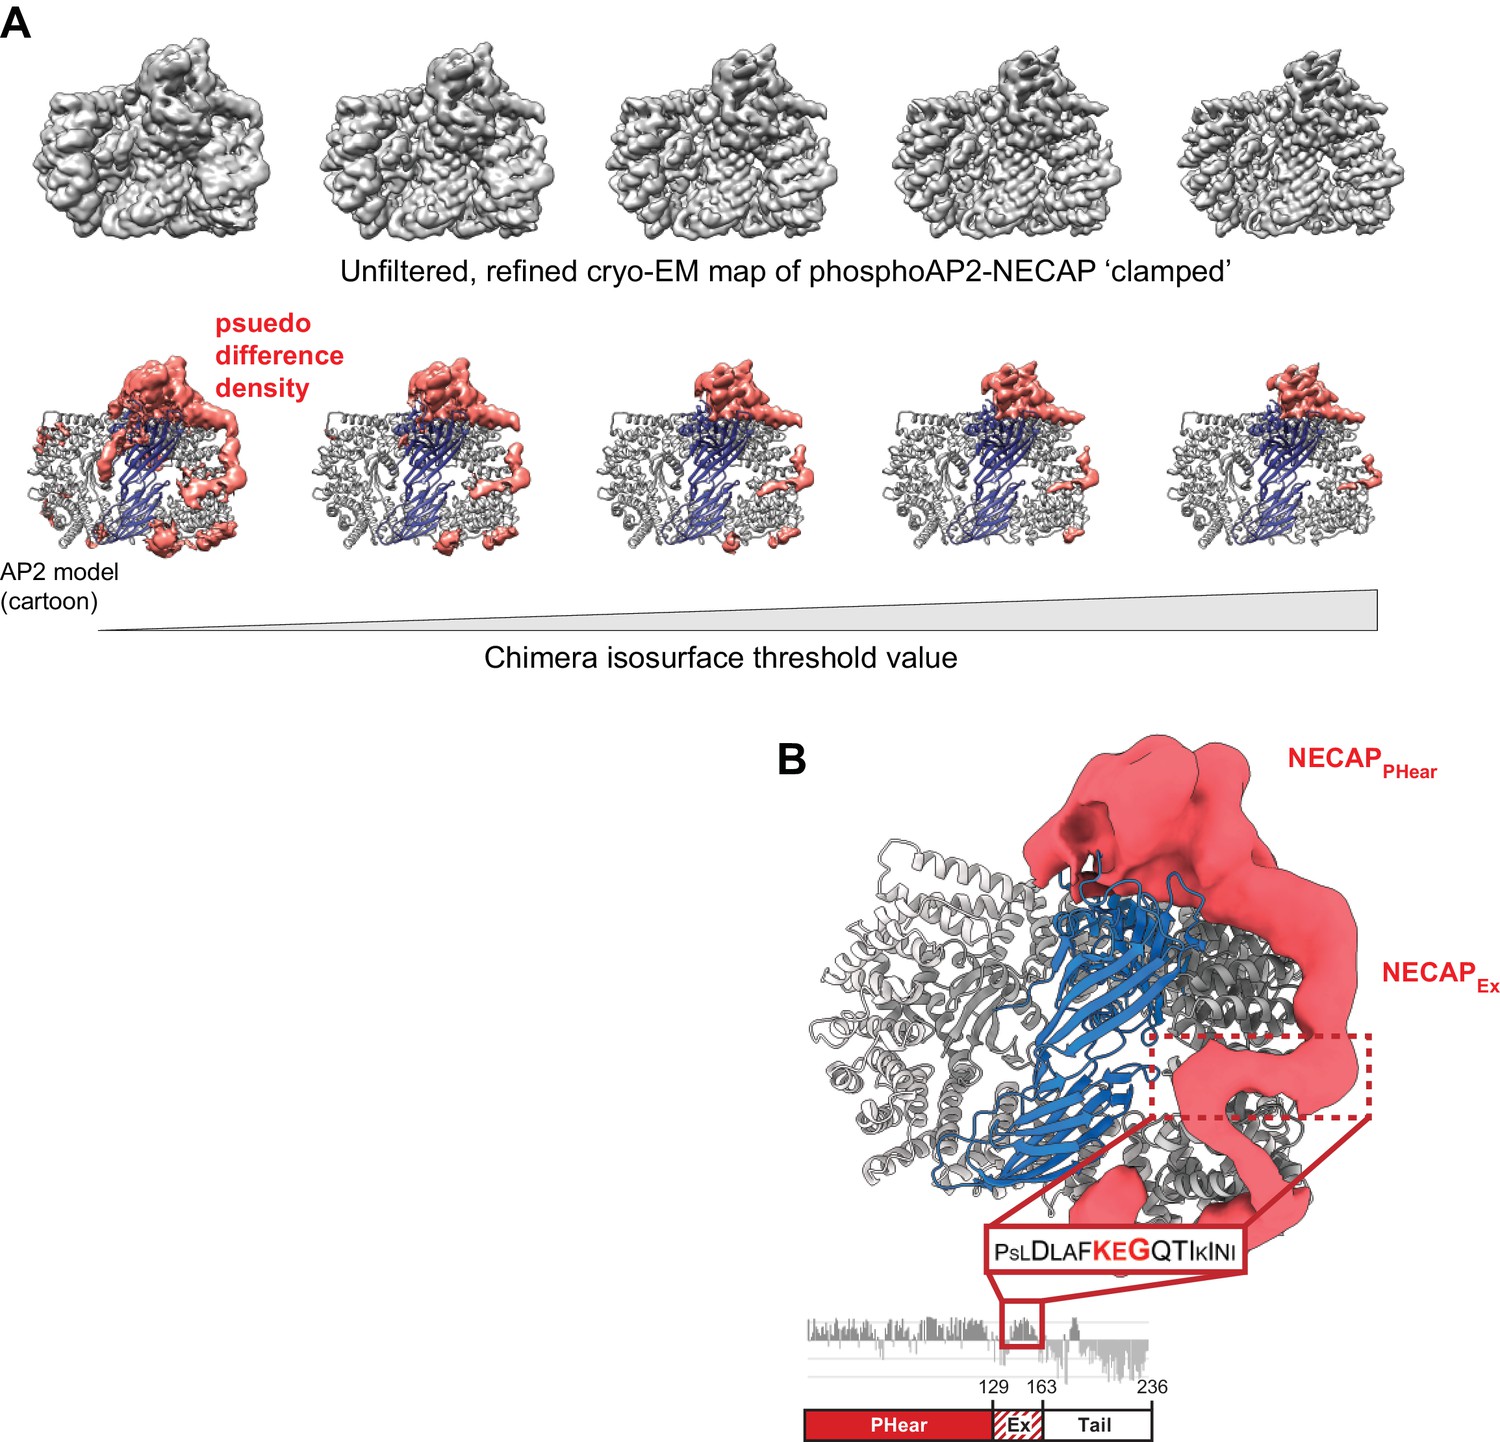
The NECAPEx domain binds along the surface of the beta subunit.
(A) The unfiltered, refined cryo-EM map of ‘clamped’ phosphoAP2-NECAP is shown at different isosurface threshold levels (top). A psuedo difference density map was made in Chimera by masking the region corresponding to AP2 and subtracting this map from the full map (bottom). The remaining density is shown colored salmon. The same threshold levels are shown top and bottom. (B) The psuedo difference density from (A) is shown at a low threshold level and with a Gaussian filter applied. Regions of the map corresponding to obvious AP2 features, such as loops omitted from our molecular model, were manually removed in Chimera. We hypothesize that a region of NECAPEx cryo-EM density (boxed in red) corresponds to a conserved region of the sequence called the KEG motif (AA 153–154). This is consistent with structural restraints based on the distance of this motif (16 residues) from the C-terminus of NECAPPHear in our molecular model (AA 8–137).
Figure 7
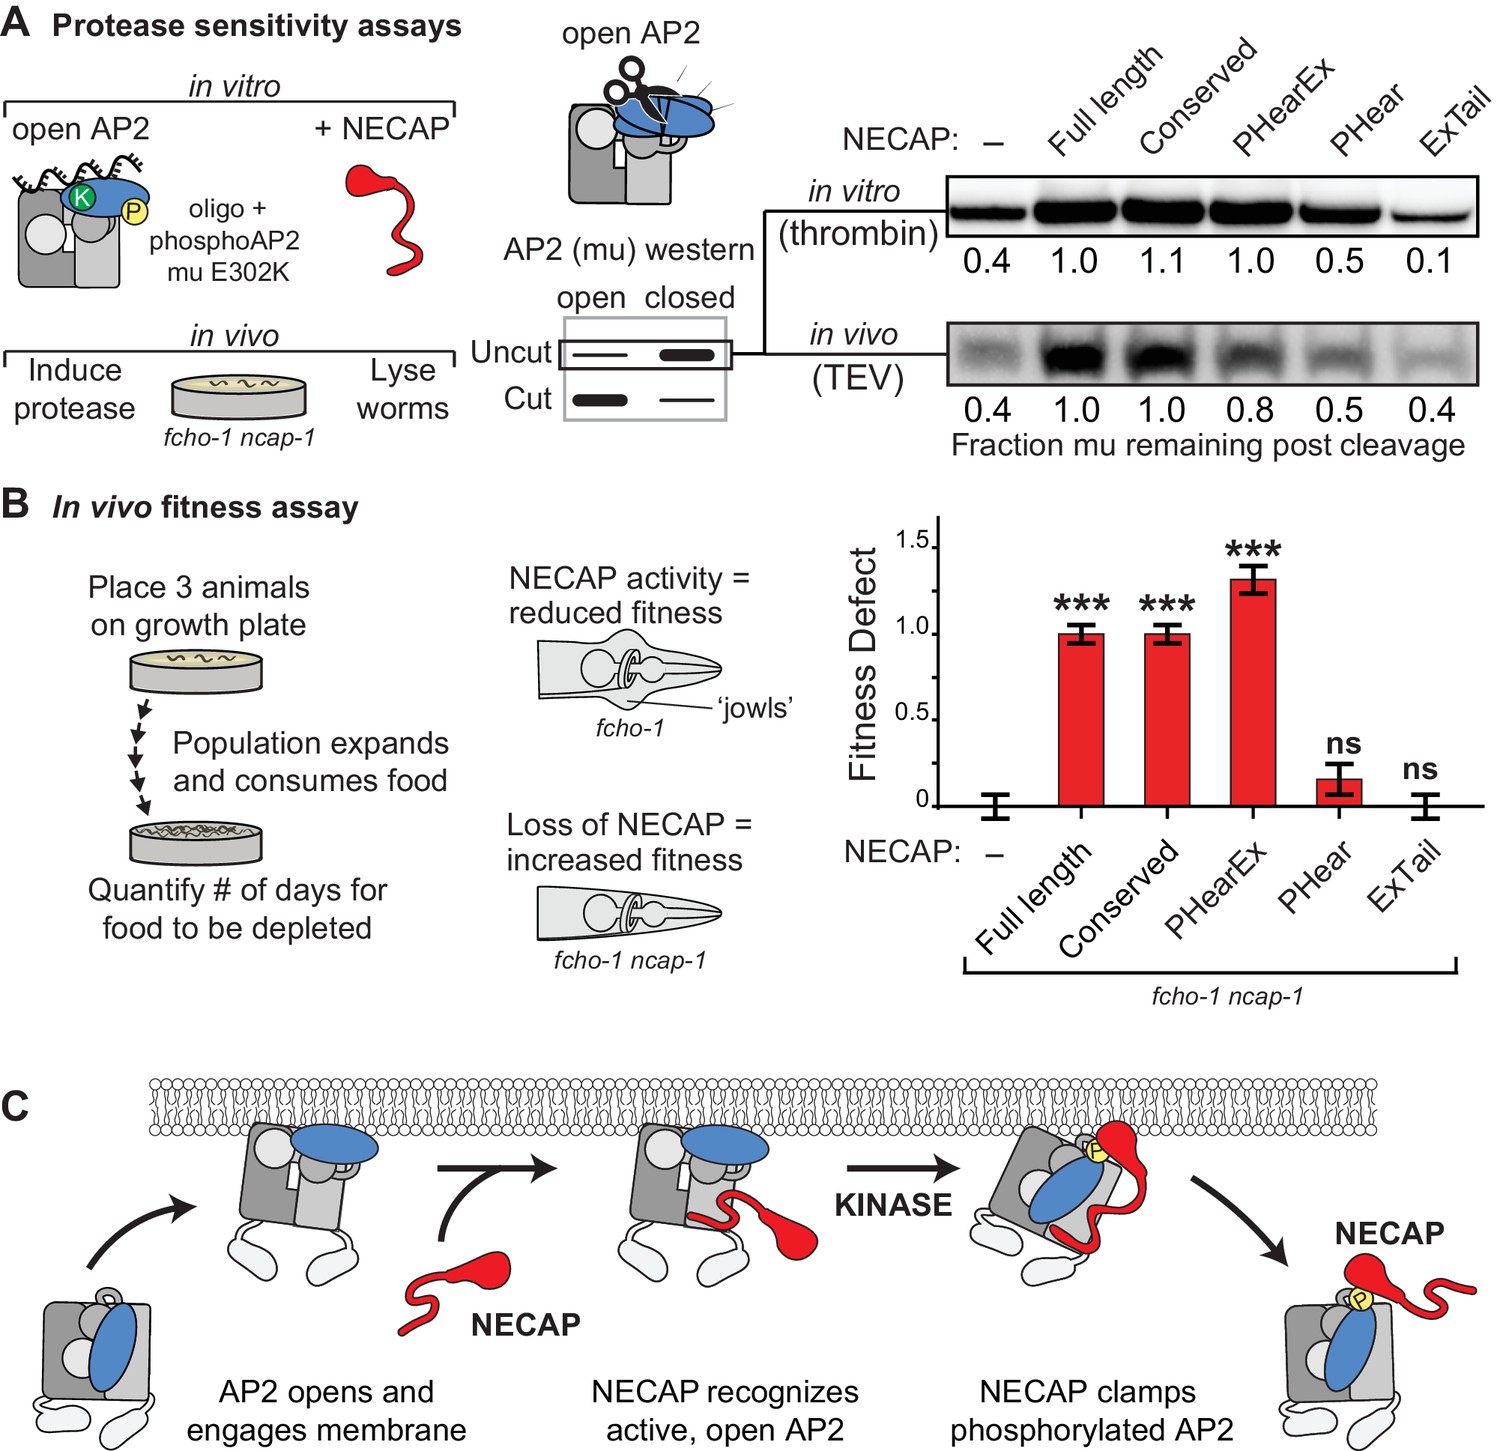
NECAP clamps AP2 in a closed, inactive conformation.
(A) Analysis of NECAP activity on AP2 protease sensitivity. (Left) Schematic of components. Oligo, 60 nucleotide single-stranded DNA. (Center) Samples analyzed by western blot to quantify cleavage of mu subunit. (Right) Western blots cropped to show uncut mu subunit after either addition of protease (in vitro, top) or protease expression via heat shock promoter (in vivo, bottom). Numbers represent normalized intensity of the uncut mu band, relative to the sample with full length NECAP. (B) In the absence of NECAP (–), fcho-1 mutants take about 4 days to proliferate and consume a bacterial food source (fitness defect = 0). Expression of NECAP (Full length) increases the number of days to about 8 (fitness defect = 1). Data for the truncations were normalized to this fitness defect; n = 10 biological replicates. ***p<0.001; ns, not significant; relative to NECAP knockout (-). N = 10 biological replicates. (C) Model of AP2 inactivation by NECAP.
Tables
Table 1
Cryo-EM data collection, refinement, and validation statistics.
https://doi.org/10.7554/eLife.50003.006| pAP2-NECAP ‘unclamped’ PDB ID: 6OWO EMDB ID: EMD-20215 | pAP2-NECAP ‘clamped’ PDB ID: 6OXL EMDB ID: EMD-20220 | |
|---|---|---|
| Data Collection | ||
| Microscope | Talos Arctica | Talos Arctica |
| Camera | K2 summit | K2 summit |
| Camera Mode | Super-Resolution | Counting |
| Magnification | 36,000 | 36,000 |
| Voltage (kV) | 200 | 200 |
| Total electron exposure (e-/Å2) | 60 | 50 |
| Exposure rate (e-/pixel/sec) | 6.67 | 6.43 |
| Defocus Range (um) | 0.6–2.5 | 0.6–2.5 |
| Pixel Size (Å/pixel) | 0.58 | 1.16 |
| Micrographs collected (no.) | 1092 | 1497 |
| Micrographs used (no.) | 944 | 1126 |
| Reconstruction | ||
| 3D Processing Package | Relion 3 | cryoSPARC v2 |
| Total Extracted picks (no.) | 890,658 | 717,231 |
| Refined particles (no.) | 490,560 | 388,962 |
| Final Particles (no.) | 71,571 | 324,922 |
| Symmetry | C1 | C1 |
| Resolution (global) (Å) | 3.2 | 3.5 |
| FSC 0.143 (unmasked/masked) | 4.1/3.2 | (4.2/3.5) |
| Local resolution range (Å) | 3.1–4.2 | 3.2–6.1 |
| Map sharpening B-factor | −29 | −160 |
| Refinement | ||
| Model refinement package | Rosetta, phenix.real_space_refine | Rosetta, phenix.real_space_refine |
| Model composition | ||
| Nonhydrogen atoms | 14,280 | 14,418 |
| Protein residues | 1785 | 1814 |
| B factors (Å2) | ||
| Protein residues | 62.53 | 62.72 |
| R.m.s. deviations | ||
| Bond Lengths (Å) | 0.009 | 0.01 |
| Bond angles (°) | 1.182 | 1.253 |
| Validation | ||
| MolProbity (score/percentile) | 1.4/97th | 1.75/87th |
| Clashscore (score/percentile) | 3.92/96th | 6.62/88th |
| Poor rotamers (%) | 0.25 | 0.06 |
| CaBLAM outliers (%) | 1.34 | 1.38 |
| Ramachandran plot | ||
| Favored (%) | 96.57 | 94.36 |
| Allowed (%) | 3.32 | 5.64 |
| Disallowed (%) | 0.11 | 0 |
| EMRinger score | 3.33 | 3.05 |
| Map CC (CCmask) | 0.857 | 0.815 |
Additional files
-
Supplementary file 1
Annotated Resources.
- https://doi.org/10.7554/eLife.50003.018
-
Supplementary file 2
Key Resources Table.
- https://doi.org/10.7554/eLife.50003.019
-
Transparent reporting form
- https://doi.org/10.7554/eLife.50003.020
Download links
A two-part list of links to download the article, or parts of the article, in various formats.
Downloads (link to download the article as PDF)
Open citations (links to open the citations from this article in various online reference manager services)
Cite this article (links to download the citations from this article in formats compatible with various reference manager tools)
A structural mechanism for phosphorylation-dependent inactivation of the AP2 complex
eLife 8:e50003.
https://doi.org/10.7554/eLife.50003


