Regulation of zebrafish melanocyte development by ligand-dependent BMP signaling
- University of Massachusetts Medical School, United States
Figures
Figure 1 with 1 supplement
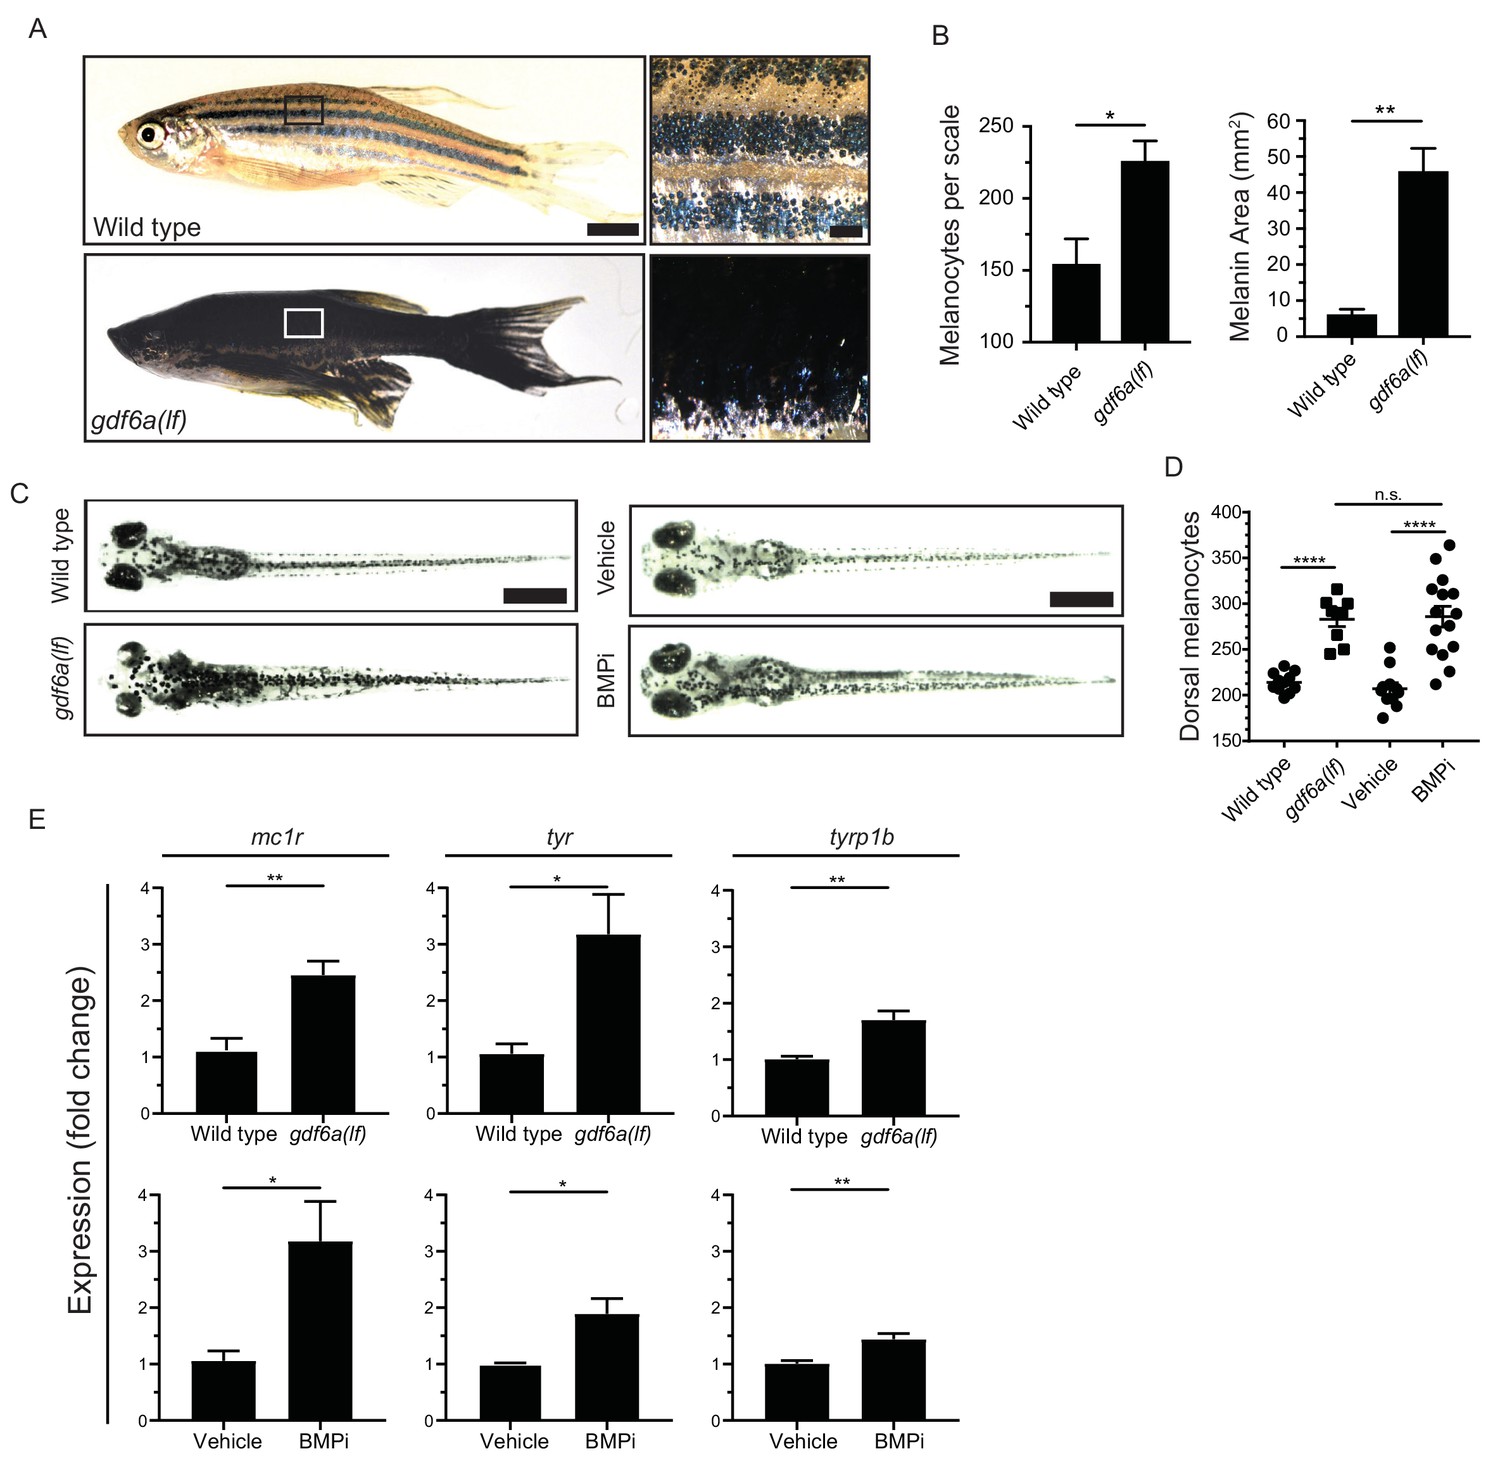
gdf6a loss or BMP inhibition causes the development of supernumerary melanocytes.
(A) Images of wild-type and gdf6a(lf) adult zebrafish, scale bar = 4 mm, inset scale bar = 1 mm. (B) Quantification of number of melanocytes (left) and scale pigmentation using melanin coverage (right), n = 3 scales per group. (C) Wild-type and gdf6a(lf) embryos imaged at 5 days post fertilization (DPF); vehicle- and BMPi-treated embryos imaged at 5 DPF. Scale bar = 1 mm. Animals were treated with epinephrine prior to imaging. (D) Quantification of dorsal melanocytes per animal in 5 DPF wild-type, gdf6a(lf) mutant, vehicle-, and BMPi-treated embryos. n = 11, 9, 11, and 15 embryos, respectively, from two independent experiments (N = 2). (E) Expression of melanocyte differentiation markers mc1r, tyr, and tyrp1b by qRT-PCR in wild-type, gdf6a(lf) mutant, vehicle-, and BMPi-treated embryos. n = 5–6 replicates across two independent experiments (N = 2) for each group. Expression was normalized to β-actin. Error bars represent mean + /- SEM. P-values were calculated using Student’s t-test in panel B and E, and one-way ANOVA with Tukey’s multiple comparisons test in panels D, *p<0.05, **p<0.01, ***p<0.001, ****p<0.0001, n.s., not significant.
-
Figure 1—source data 1
gdf6a loss or BMP inhibition causes the development of supernumerary melanocytes.
- https://cdn.elifesciences.org/articles/50047/elife-50047-fig1-data1-v2.xlsx
Figure 1—figure supplement 1
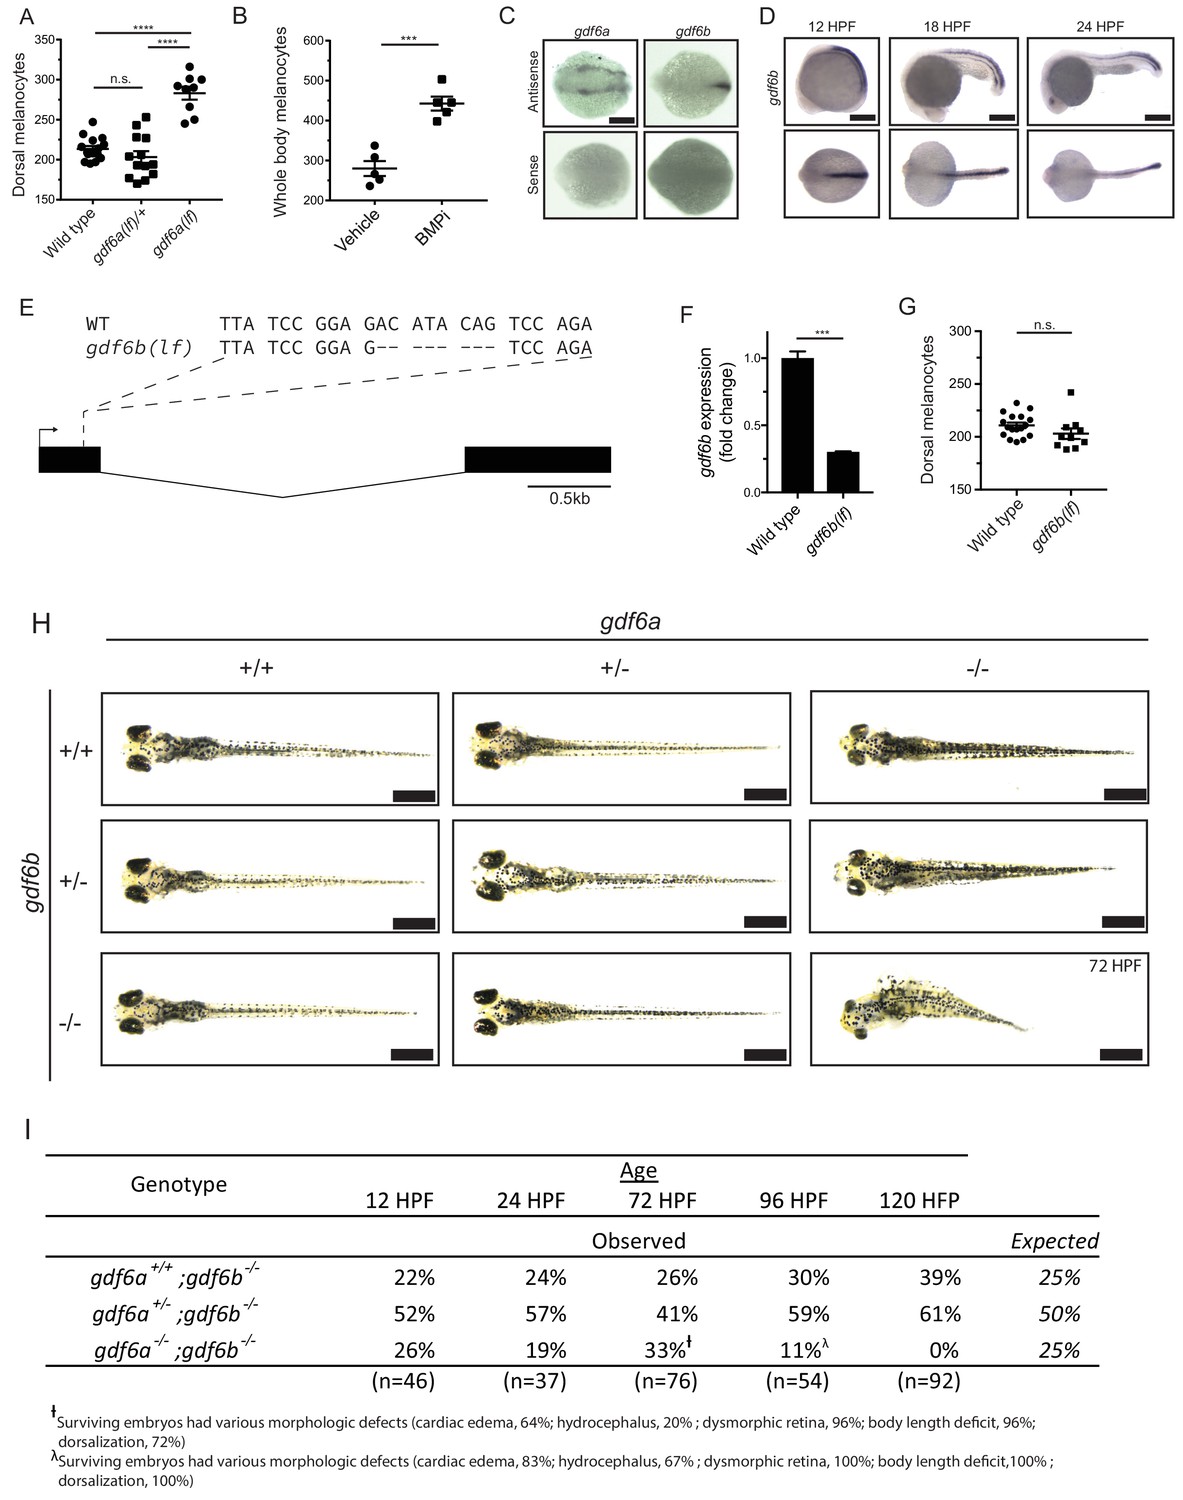
gdf6 paralogs are necessary for normal embryonic development.
(A) Quantification of dorsal melanocytes in gdf6a(lf/+) heterozygotes, gdf6a(lf) homozygotes and wild-type embryos. (B) Quantification of whole-body melanocytes in vehicle- and BMPi-treated embryos. (C) Verification of gdf6a and gdf6b probe specificity. (D) RNA in situ hybridization for gdf6b at 12-, 18-, and 24 hr post-fertilization, scale bar = 500 µm. (E) Sequence of gdf6b(lf) mutant indicating deletion and frameshift in exon 1. (F) Decreased gdf6b expression in gdf6b(lf) embryos. (G) Quantification of dorsal melanocytes in gdf6b(lf) mutants compared to wild-type embryos. (H) Images of gdf6a(lf) and gdf6b(lf) mutant combinations. gdf6b(lf) animals have no morphologic defects compared to wild-type embryos at 5 DPF, while gdf6a(lf) animals show pigmentation and eye morphology defects. gdf6a(lf);gdf6b(lf) double mutants show significant morphologic defects associated with gdf6a(lf) as well as decreased body length, cardiac edema and hydrocephalus. Scale bar = 1 mm. (I) Survival of gdf6b(lf) embryos with gdf6a(lf) mutations. †, surviving embryos had various morphologic defects (cardiac edema, 63%; hydrocephalus, 21%; dysmorphic retina, 96%; body length deficit, 96%; dorsalization, 71%). λ, surviving embryos had various morphologic defects (cardiac edema, 83%; hydrocephalus, 67%; dysmorphic retina, 100%; body length deficit, 100%; dorsalization, 100%). Error bars represent mean + /- SEM. P-values were calculated using one-way ANOVA with Tukey’s multiple comparison test for panel A and with Student’s t-test for panels B, F, and G. ***p<0.001, ****p<0.0001, n.s., not significant.
Figure 2 with 1 supplement
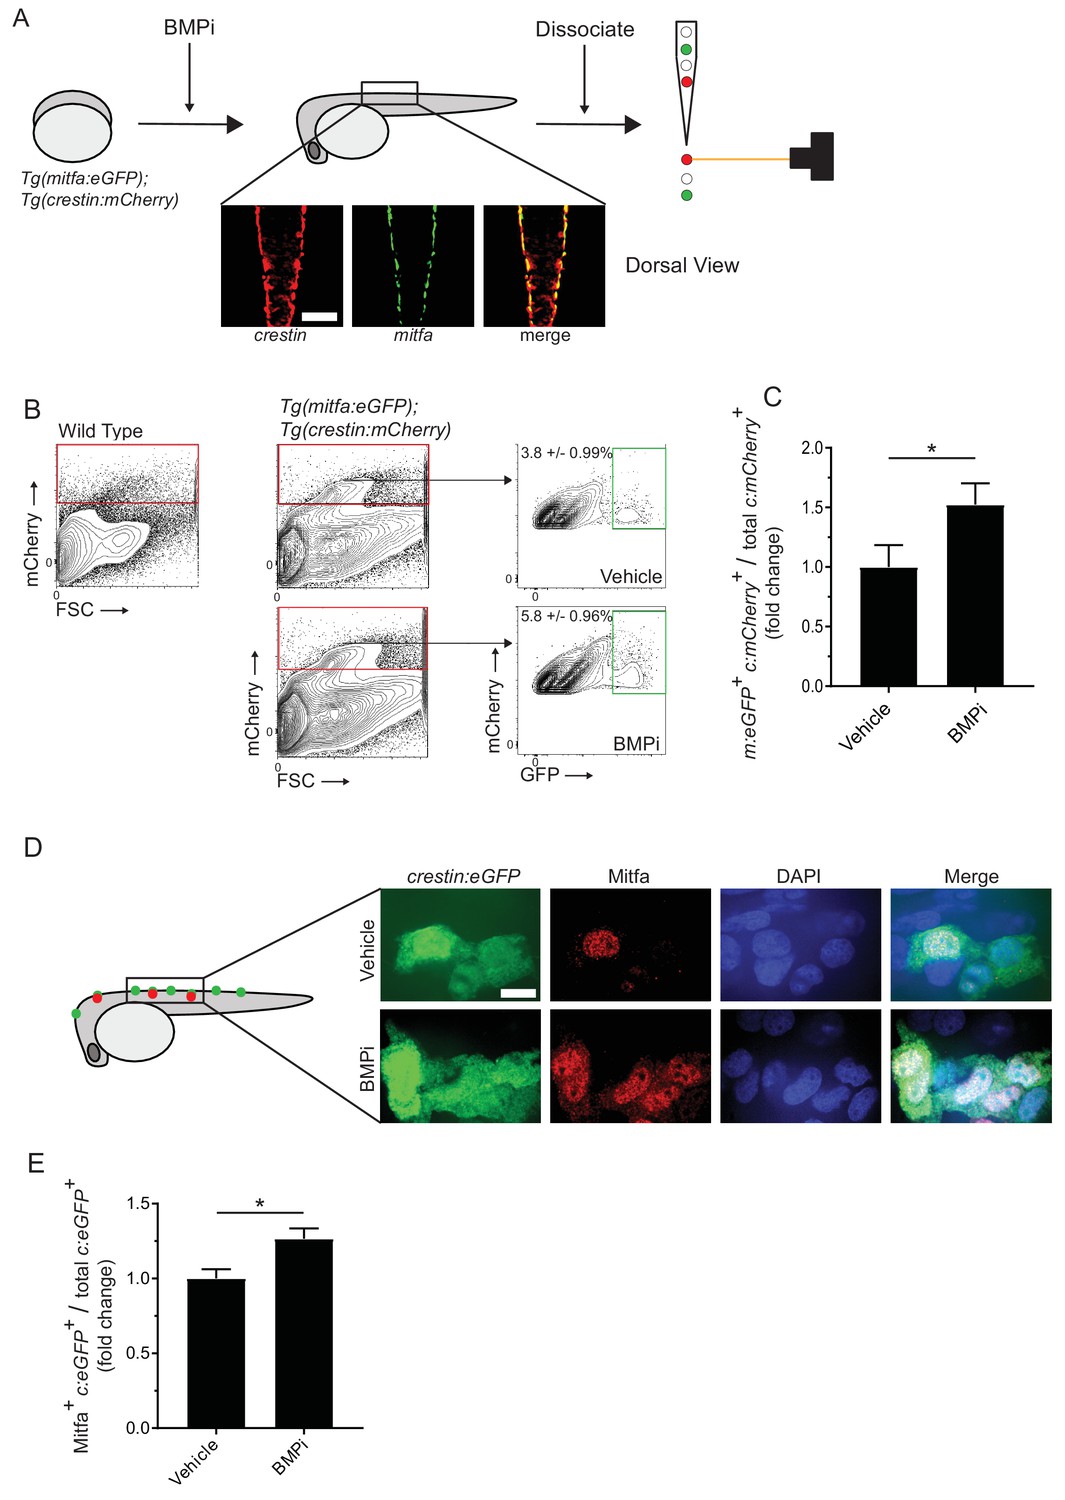
Inhibition of BMP signaling increases mitfa-positive neural crest cells.
(A) Diagram of experiment. Tg(crestin:mCherry); Tg(mitfa:eGFP) embryos were treated with BMPi from 12 to 24 HPF. At 24 HPF, embryos were dissociated and analyzed via flow cytometry for GFP- and mCherry-positive cells, scale bar = 200 µm. (B) Gating strategy based on non-transgenic wild-type control to identify crestin:mCherry-positive cells and crestin:mCherry/mitfa:eGFP double-positive cells. Top, control vehicle-treated embryos. Bottom, BMPi-treated embryos. (C) Fold change in crestin:mCherry/mitfa:eGFP double-positive cells per total crestin:mCherry-positive cells in vehicle and BMPi-treated groups, N = 3 biological replicates of 80–100 stage-matched embryos pooled for each condition. m:eGFP, mitfa:eGFP; c:mCherry, crestin:mCherry. (D) anti-Mitfa immunofluorescence in Tg(crestin:eGFP) embryos treated with BMPi or vehicle control and fixed at 24 hr, scaled bar = 10 µm. (E) Fold change in Mitfa/crestin:eGFP double-positive cells per total crestin:eGFP-cells, n = 16 embryos from two independent experiments (N = 2) for each condition. c:eGFP, crestin:eGFP. Error bars represent mean + /- SEM; P-value was calculated using ratio-paired t-test in panel C and Student’s t-test in panel E, *p<0.05.
-
Figure 2—source data 1
Inhibition of BMP signaling increases mitfa-positive neural crest cells.
- https://cdn.elifesciences.org/articles/50047/elife-50047-fig2-data1-v2.xlsx
Figure 2—figure supplement 1
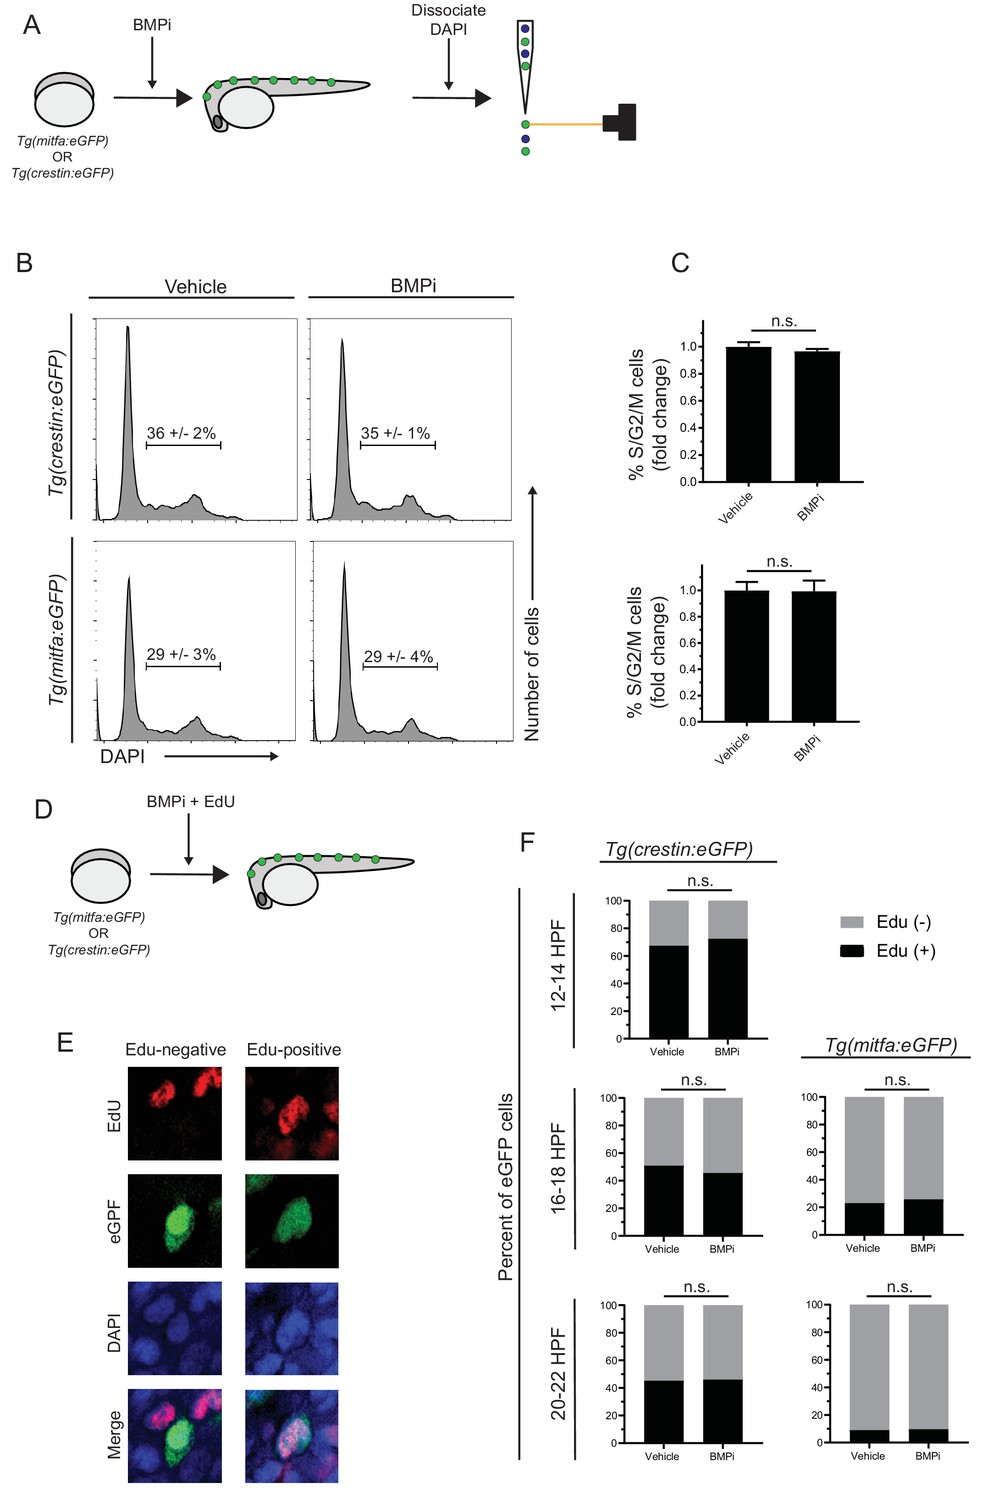
Increased proliferation is not observed in neural crest and pigment progenitor cell populations of BMPi-treated embryos.
(A) Diagram of experiment. Embryos expressing either Tg(mitfa:eGFP) or Tg(crestin:eGFP) were treated with BMP inhibitor from 12 to 24 HPF. Following treatment, embryos were dissociated, fixed, and stained for DNA content using DAPI and analyzed via flow cytometry. Scale bar = 200 µm. (B) Flow cytometry histograms showing the percentage of cells in S/G2/M phases in crestin:eGFP-positive or Tg(mitfa:eGFP-positive cell populations in BMPi-treated embryos compared to vehicle-treated embryos. (C) Fold change of crestin:eGFP-positive cells (top) and mitfa:eGFP-positive cells (bottom) in S/G2/M phases. n = 3 biological replicates of 80–100 stage-matched embryos pooled for each condition. (D) Diagram of experiment. Embryos expressing either Tg(mitfa:eGFP) or Tg(crestin:eGFP) were treated with BMP inhibitor starting at 12 HPF. Embryos were concurrently treated with EdU from 12 to 14 HPF, 16–18 HPF, or 20–22 HPF. Following EdU treatment, embryos were fixed and assess for EdU incorporation. (E) Example image of EdU incorporation in eGFP-positive cells in vehicle- and BMPi-treated embryos. (F) Quantification of EdU incorporation in Tg(crestin:eGFP) and Tg(mitfa:eGFP) embryos at different time points, n = 62–166 eGFP-positive cells from two independent experiments (N = 2) for each condition and time point. Error bars represent mean + /- SEM, P-values were calculated using ratio paired t-test for panel C and Fisher’s exact test for panel F, n.s., not significant.
Figure 3 with 1 supplement
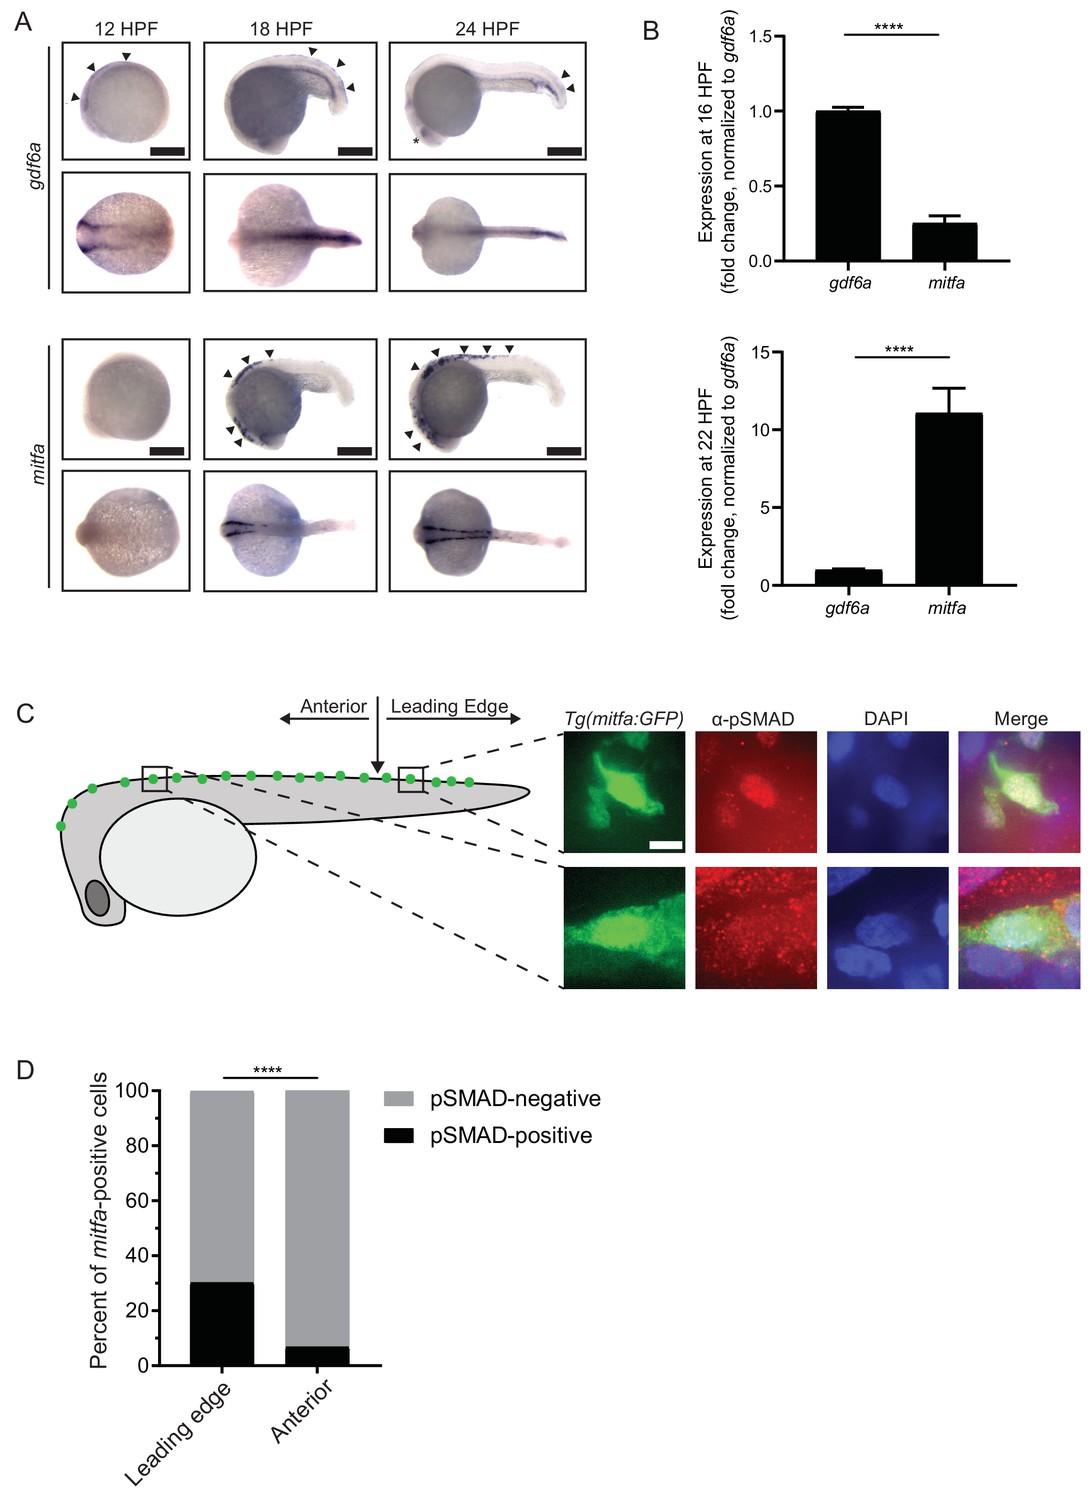
gdf6a expression and BMP activity in pigment progenitor cells.
(A) RNA in situ hybridization for gdf6a (top) and mitfa (bottom) at 12-, 18-, and 24 hr post-fertilization. Arrowheads indicate expression domains in the region of the neural crest of gdf6a and mitfa. Asterisk indicates known dorsal retinal expression of gdf6a. Scale bar = 500 µm. (B) Expression of gdf6a and mitfa from neural crest cells isolated from Tg(crestin:eGFP) embryos by FACS at 16 HPF and 22 HPF. Samples were normalized to gdf6a expression. n = 5–6 replicates per conditions from two independent experiments (N = 2). (C) Images of GFP-positive cells from Tg(mitfa:eGFP) zebrafish stained with α-pSMAD 1/5/8 antibody. Scale bar = 10 µm. (D) Quantification of mitfa:eGFP-positive cells that are phospho-SMAD1/5/8-positive. The leading edge encompassed the five most posterior mitfa-positive cells, whereas anterior cells constituted any mitfa-positive cells anterior to the leading edge. n = 102 and 186 for distal leading edge and anterior cells, respectively, from three independent experiments (N = 3). P-values were calculated using Fisher’s exact test for panels B and D, ****p<0.0001.
-
Figure 3—source data 1
gdf6a expression and BMP activity in pigment progenitor cells.
- https://cdn.elifesciences.org/articles/50047/elife-50047-fig3-data1-v2.xlsx
Figure 3—figure supplement 1
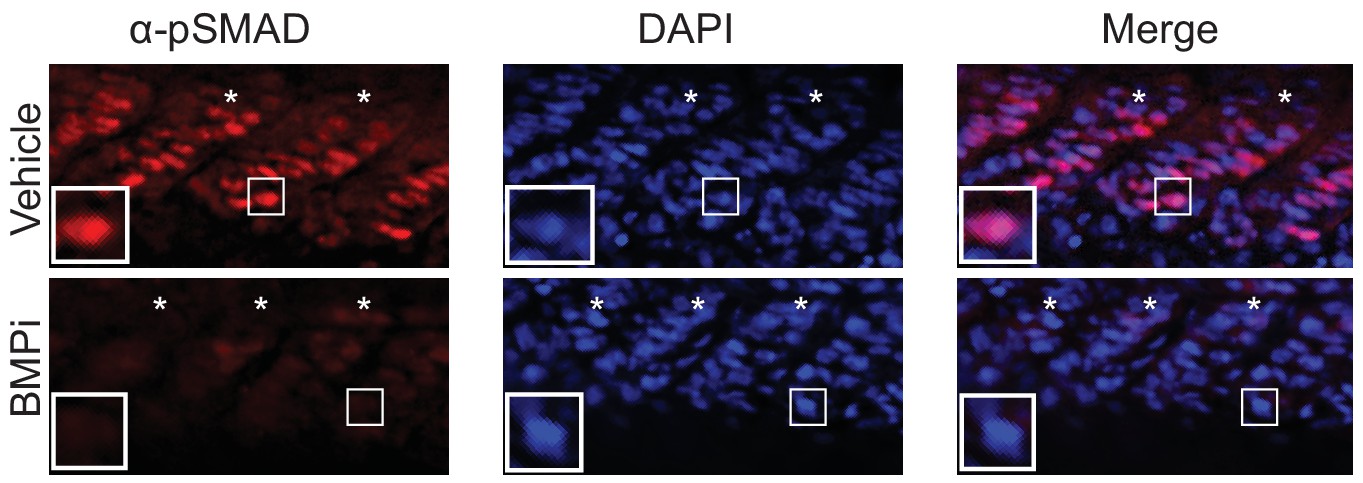
Treatment with the BMP inhibitor DMH1 reduces phospho-SMAD1/5/8 staining in embryos Top, vehicle-treated animals and, bottom, BMPi-treated animals showing lateral views of developing muscle segments, identified by asterisks.
Insets show individual nuclei. Photomicrographs for pSMAD-1/5/8-stained embryos were taken at the same exposure settings.
Figure 4
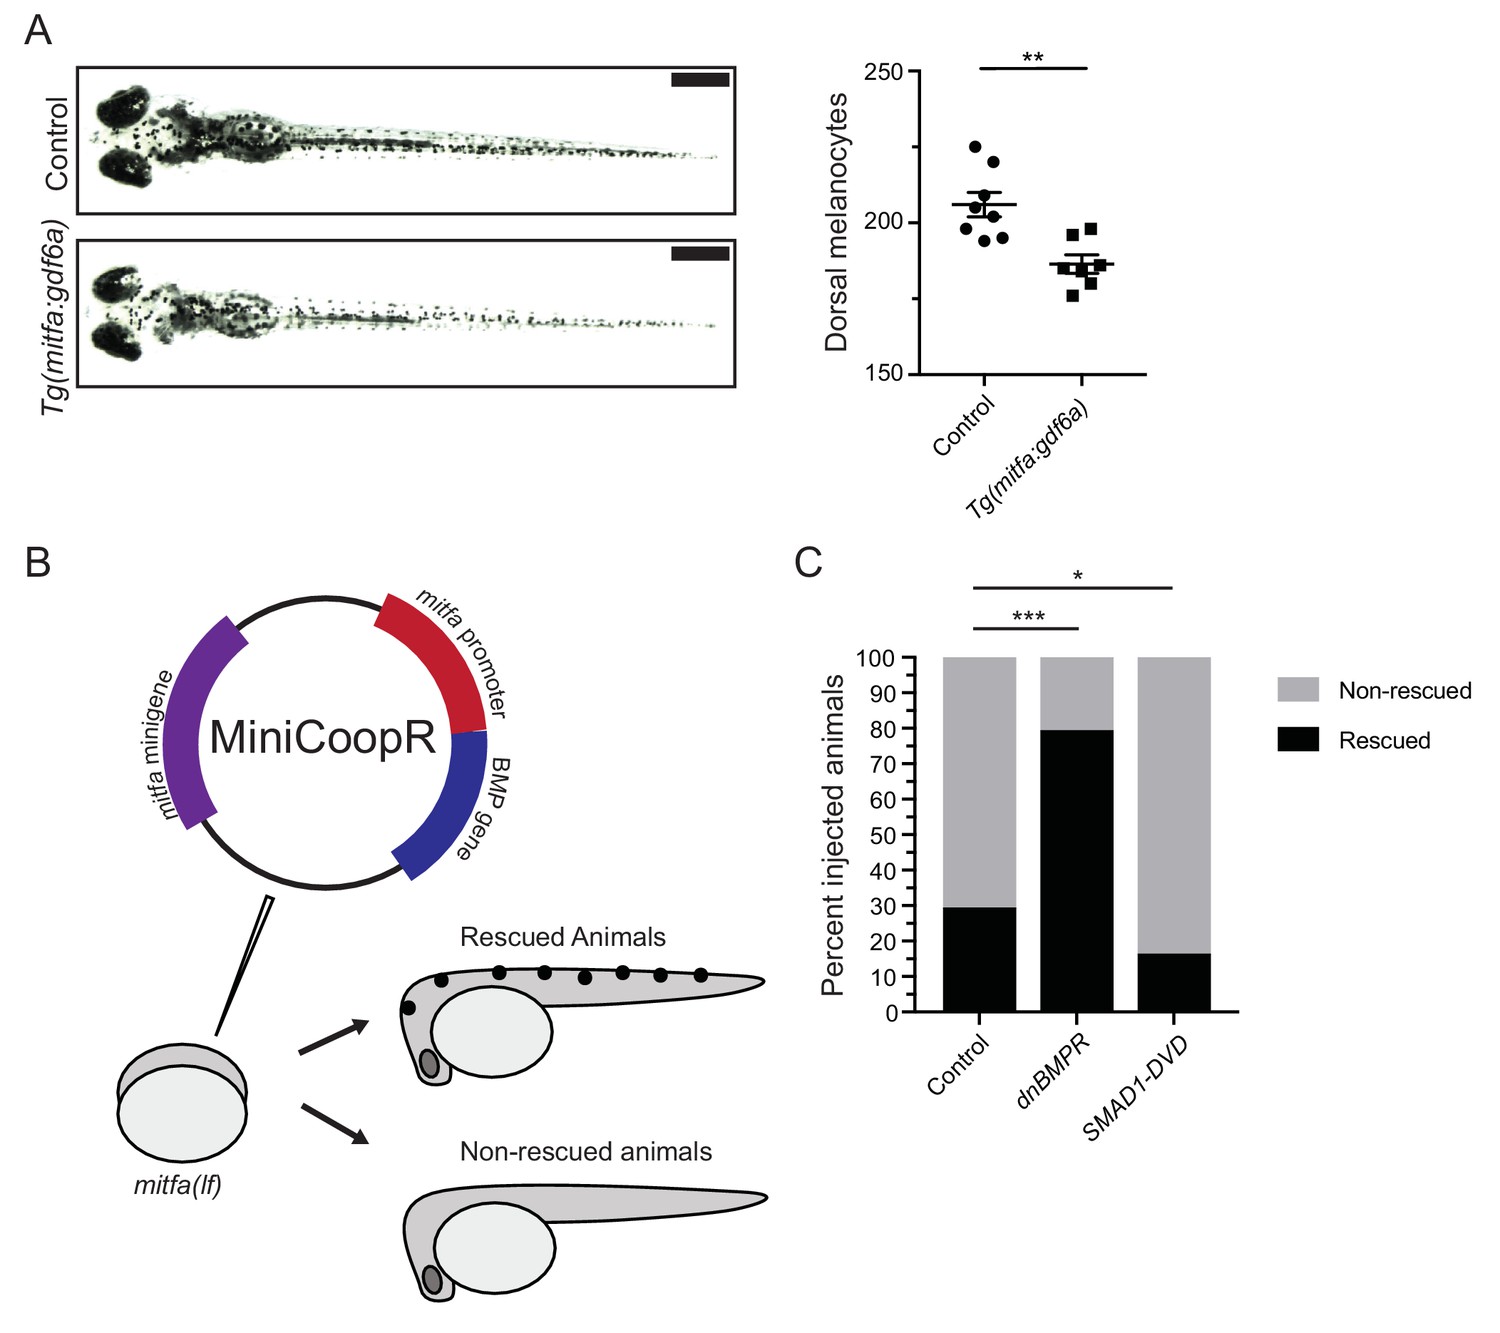
BMP signaling within pigment progenitor cells can impact embryonic melanocytes.
(A) Tg(mitfa:gdf6a) and non-transgenic sibling control embryos (left), and quantification of dorsal melanocytes per animal in each group (right). Animals were treated with epinephrine prior to imaging at 5 DPF, n = 8 and 7 for control and Tg(mitfa:gdf6a) groups, respectively, from two independent experiments (N = 2). Scale bar = 1 mm. (B) Diagram of miniCoopR rescue experiment. Animals harboring a mitfa(lf) mutation were injected at the single-cell stage with the miniCoopR vector containing a BMP gene. Animals were evaluated at 5 DPF for the presence of melanocytes. If melanocytes were present, that animal was scored as rescued, whereas animals lacking melanocytes were scored as non-rescued. (C) Percentages of rescued and non-rescued animals following injection of a miniCoopR-BMP vector, n = 361, 193 and 152 for control, dnBMPR, and SMAD1-DVD groups, respectively, from four independent experiments (N = 4). Error bars represent mean + /- SEM. P-values were calculated Student’s t-test for panel A and with Fisher’s exact test with Bonferroni’s correction for panel C, *p<0.05, **p<0.01, ***p<0.001.
-
Figure 4—source data 1
BMP signaling within pigment progenitor cells can impact embryonic melanocytes.
- https://cdn.elifesciences.org/articles/50047/elife-50047-fig4-data1-v2.xlsx
Figure 5 with 1 supplement
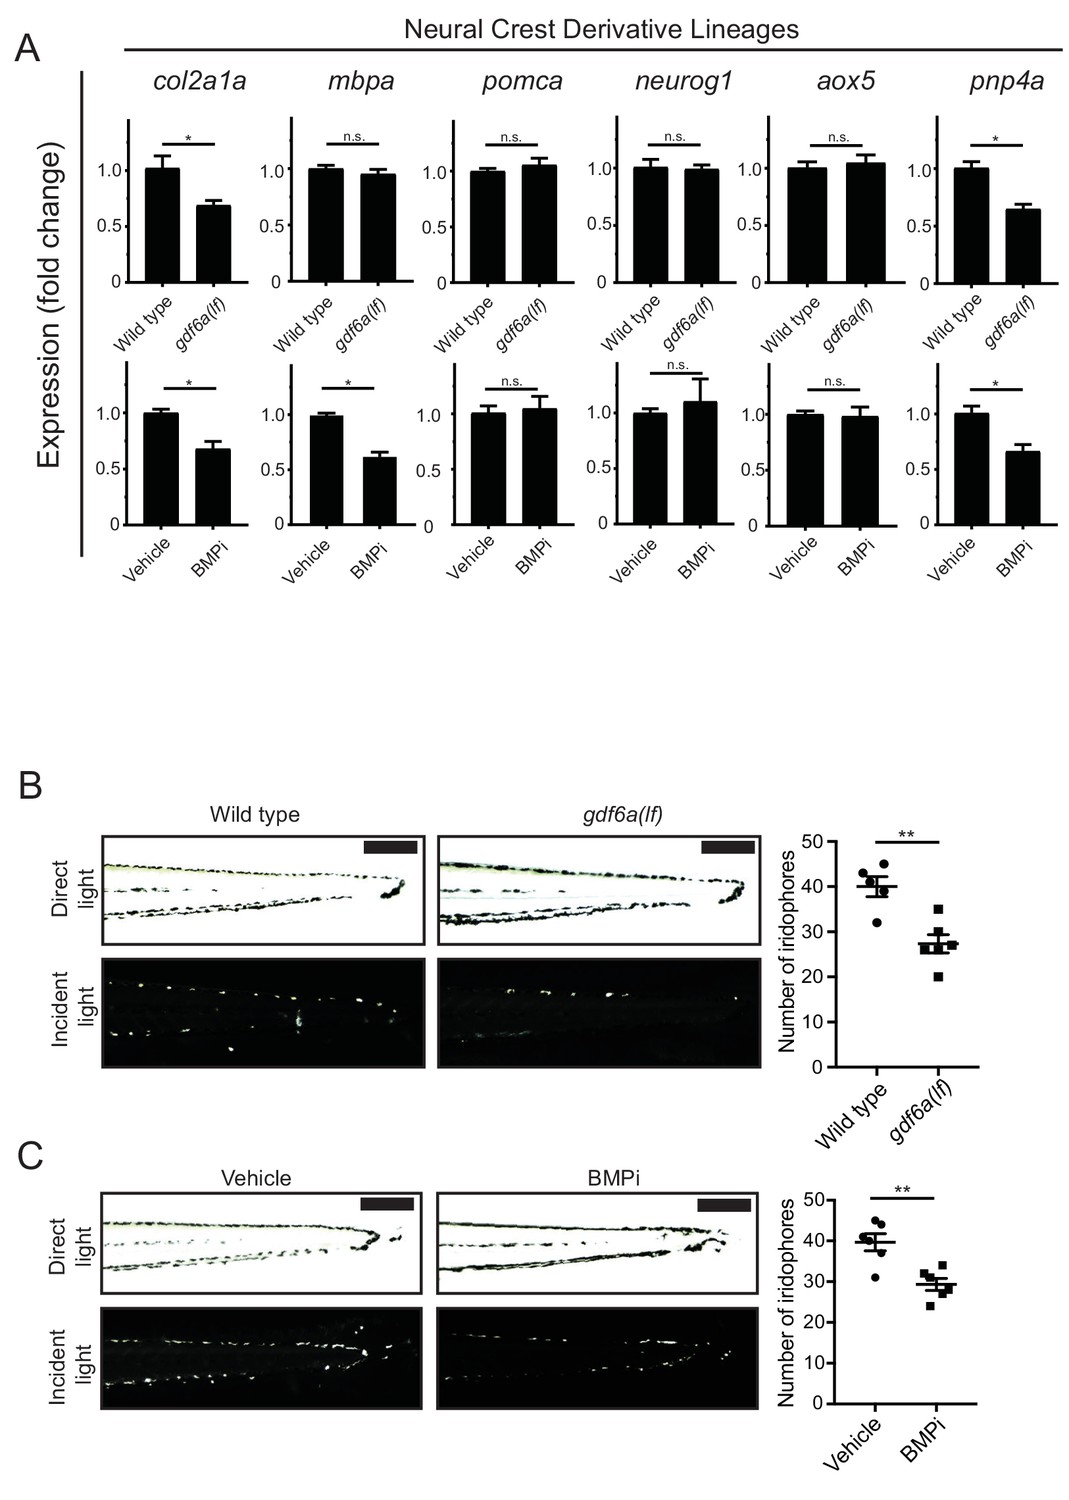
gdf6a loss and BMP inhibition impact development of specific neural crest derivatives.
(A) Expression analyses of multiple neural crest and neural crest derivative lineage markers. qRT-PCR was used to assess changes in markers of neural crest markers and neural crest derivatives in gdf6a(lf) embryonic zebrafish (top) and BMPi-treated wild-type zebrafish (bottom) at 5 DPF; col2a1a, chondrocytes; mbpa, glial; pomca, adrenal medullary cells; neurog1, neuronal cells; aox5, xanthophores; pnp4a, iridophores; n = 5–6 for each group from two independent experiments (N = 2). (B) Direct light (top) and incident light (bottom) images of wild-type and gdf6a(lf) embryos at 5 DPF and quantification of dorsal iridophores (right) per animal in each group. Animals were treated with epinephrine prior to imaging at 5 DPF; n = 5 and 6 for wild-type and gdf6a(lf) groups, respectively, from two independent experiments (N = 2); scale bar = 500 µm. (C) Direct light, top, and incident light, bottom, images of wild-type embryos treated with vehicle or BMPi from 12 to 24 HPF and quantification of dorsal iridophores, right, per animal in vehicle and BMPi treated groups. Animals treated with epinephrine prior to imaging at 5 DPF, n = 6 and 6 for vehicle and BMPi groups, respectively, from two independent experiments (N = 2); scale bar = 1 mm. Error bars represent mean + /- SEM, P-values calculated with Student’s t-test, *p<0.05, **p<0.01, n.s., not significant.
-
Figure 5—source data 1
gdf6a loss and BMP inhibition impact development of specific neural crest derivatives.
- https://cdn.elifesciences.org/articles/50047/elife-50047-fig5-data1-v2.xlsx
Figure 5—figure supplement 1
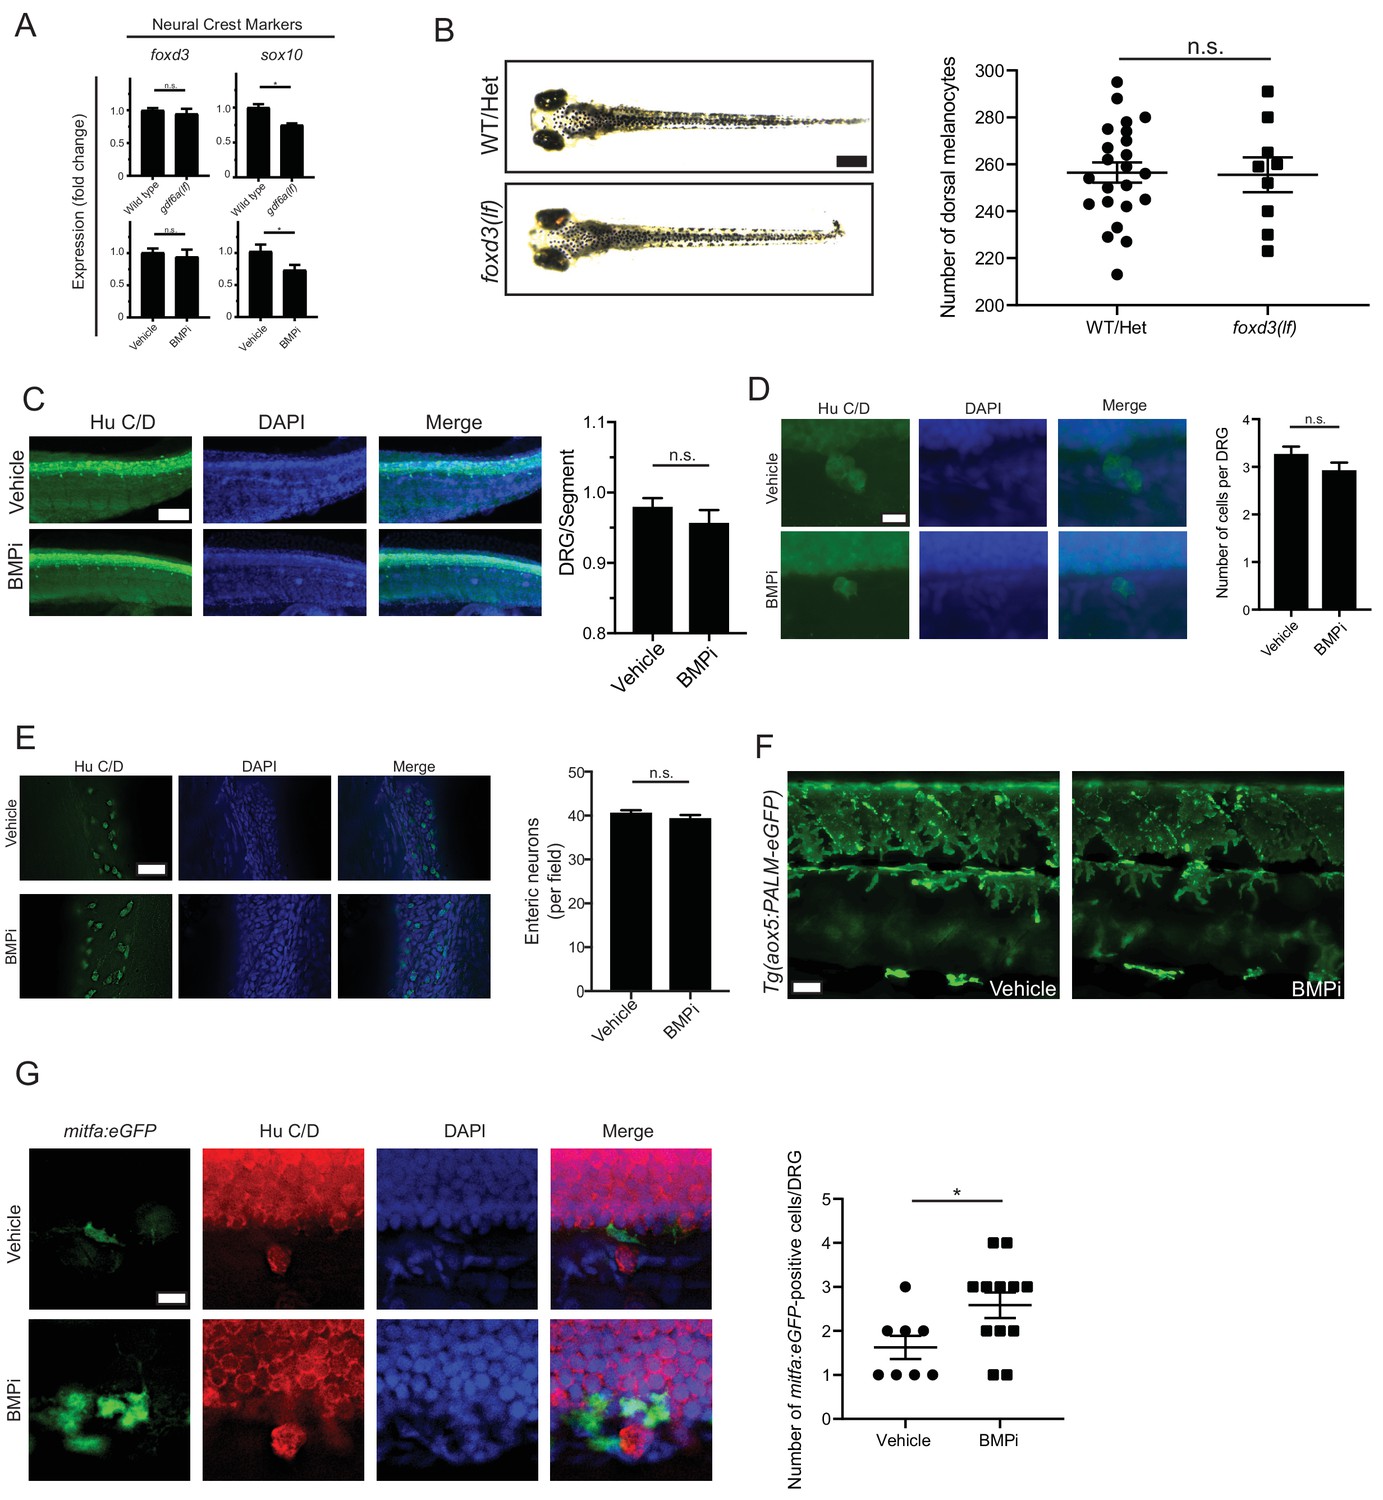
Neural crest cells and derivative populations show variable response to BMP inhibition.
(A) Expression analyses of neural crest markers foxd3 and sox10 by qRT-PCR in gdf6a(lf) and BMPi-treated animals compared to controls, n = 4–6 replicates for each condition from two independent experiments (N = 2). (B) Left, photomicrographs of wild-type/foxp3(lf) heterozygous and foxd3(lf) homozygous embryos under BMPi treatment compared to controls, and, right, melanocyte quantification in these embryos, n = 23 and 9 control and foxd3(lf) embryos, respectively, from two independent experiments (N = 2). (C) Left, Hu C/D staining for dorsal root ganglion structures and, right, quantification of dorsal root ganglia developing per segment, n = 5 per group. Scale bar = 50 µm. (D) Left, photomicrographs of individual Hu C/D-stained DRG’s and, right, quantification in the number of cells populating each individual DRG; n = 30 per group. Scale bar = 10 µm. (E) Left, Hu C/D staining for enteric neurons and, right, quantification of the number of enteric neurons per field in developing gastrointestinal tract; n = 5 per group. Scale bar = 50 µm. (F) Qualitative evaluation of xanthophore development using Tg(aox5:PALM-eGFP) embryos treated with vehicle or BMPi showed no apparent change in density or localization of xanthophores between vehicle- and BMPi-treated embryos, supported by no change in aox5 expression as shown in Figure 5A. (G) Left, Hu C/D staining of vehicle- and BMPi-treated Tg(mitfa:eGFP) embryos and, right, quantification of mitfa:eGFP-positive, DRG-associated cells in control and BMPi-treated groups, n = 8 and 12 DRG’s evaluated in vehicle- and BMPi-treated embryos, respectively, from two independent experiments (N = 2). Error bars represent mean + /- SEM. P-values were calculated using Student’s t-test, *p<0.05, n.s., not significant.
Figure 6 with 1 supplement
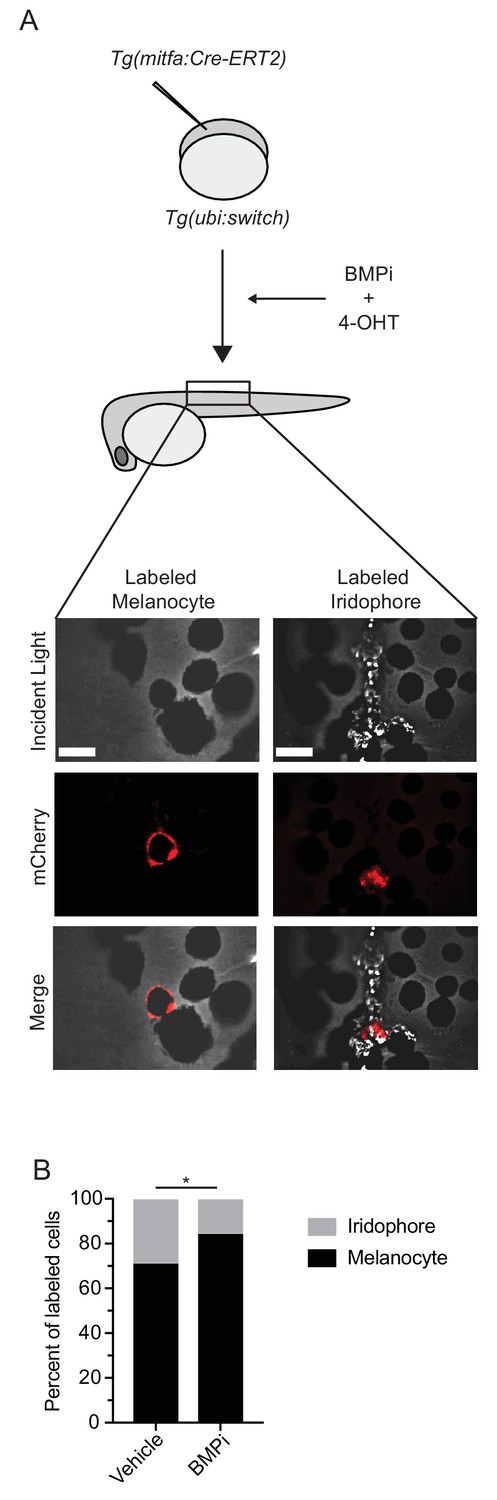
BMP inhibition impacts fate specification of mitfa-positive pigment progenitor cells.
(A) Diagram of lineage tracing experiment. Embryos containing Tg(ubi:switch) were injected with a mitfa:Cre-ERT2 construct and treated with BMPi and tamoxifen (4-OHT) from 12 to 24 HPF to block BMP signaling and allow Cre recombination. At 5 DPF, animals were screened for successful recombination by presence of single mCherry-labeled pigment cells, and the identities of those cells were assessed using incident light. Scale bar = 40 µm. (B) Quantification of mCherry-labeled cell fates at 5 DPF in vehicle and BMPi-treated animals, n = 101 and 80 labeled cells for vehicle and BMPi groups, respectively, from five independent experiments (N = 5); P-value calculated using Fisher’s exact test, *p<0.05.
-
Figure 6—source data 1
BMP inhibition impacts fate specification of mitfa-positive pigment progenitor cells.
- https://cdn.elifesciences.org/articles/50047/elife-50047-fig6-data1-v2.xlsx
Figure 6—figure supplement 1
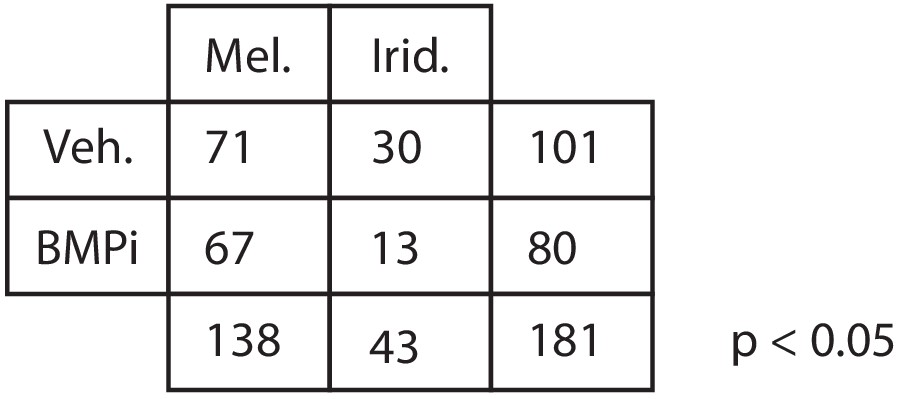
Quantification of iridophore and melanocyte numbers from lineage tracing Number of iridophores and melanocytes identified by lineage tracing under each condition.
P-value was calculated using Fisher’s exact test, p<0.05.
Figure 7 with 1 supplement
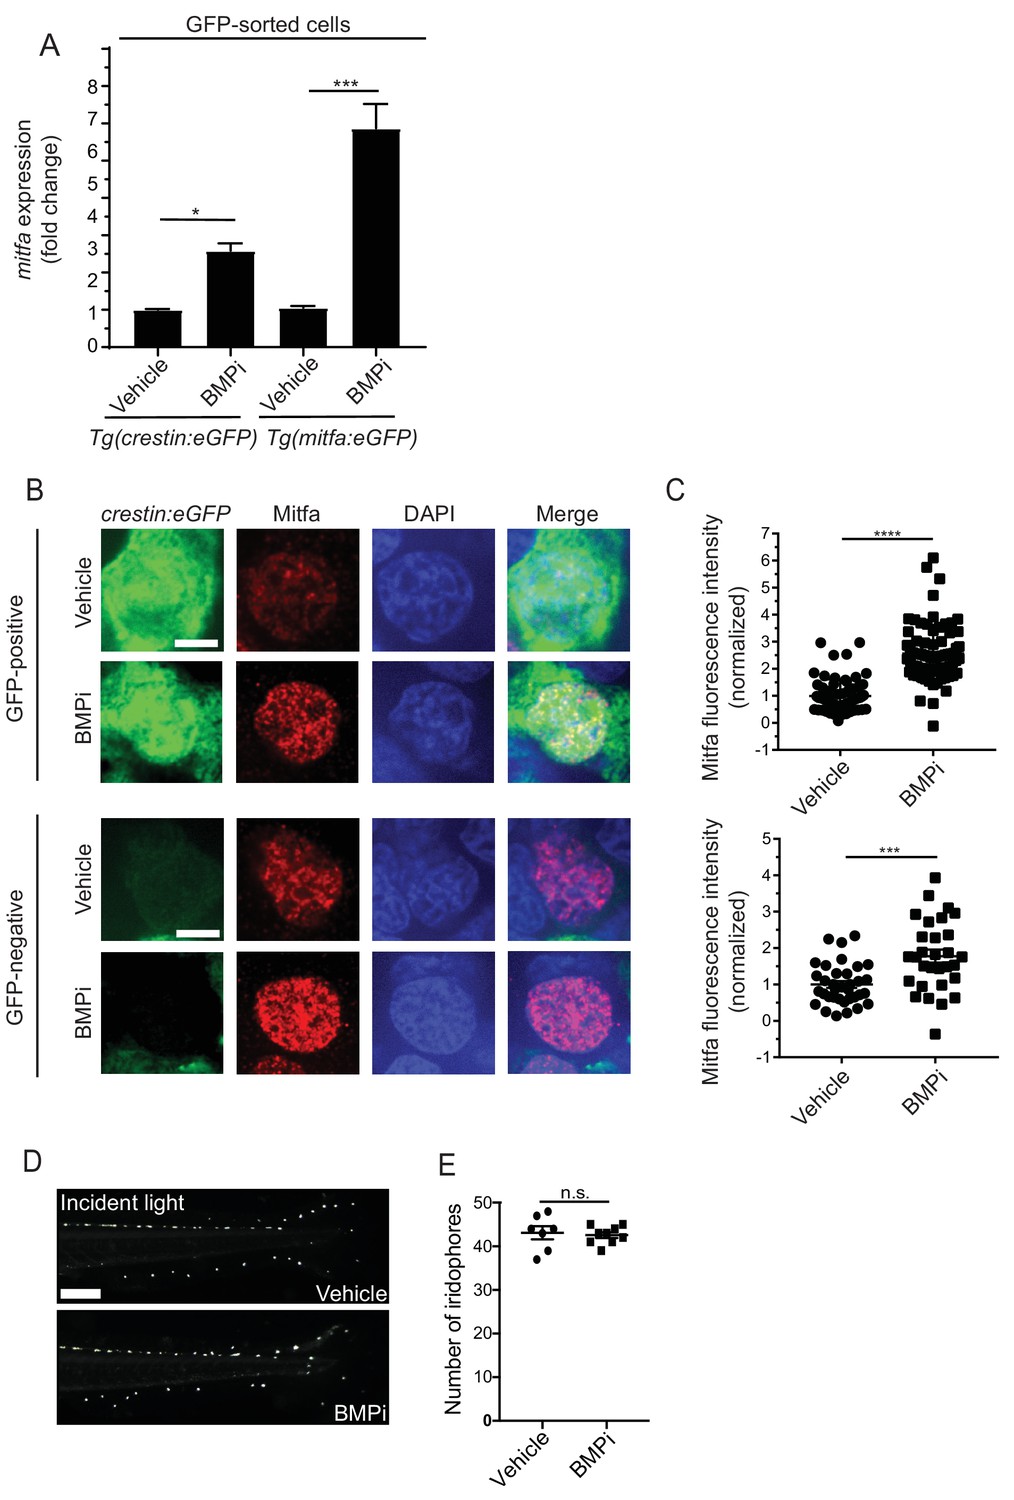
BMP signaling regulates expression of and acts through mitfa to impact pigment cell fates.
(A) mitfa expression in sorted GFP-positive cells from Tg(crestin:eGFP) and Tg(mitfa:eGFP) embryos treated with vehicle or BMPi from 12 to 24 HPF, n = 4–5 replicates for each condition from two independent experiments (N = 2). (B) anti-Mitfa immunofluorescence, DAPI and merged images of Tg(crestin:eGFP) embryos treated with vehicle control or BMPi in GFP-positive cells (top) and GFP-negative cells (bottom), scale bar = 5 µm. (C) Quantification of anti-Mitfa fluorescence intensity of individual nuclei in GFP-positive cells (top) and GFP-negative cells (bottom); n = 65 and 74 for GFP-positive vehicle and BMPi groups, respectively; n = 35 and 30 for GFP-negative vehicle and BMPi groups, respectively, from three independent experiments (N = 3). (D) Incident light images of mitfa(lf) embryonic zebrafish treated with vehicle or BMPi from 12 to 24 HPF and imaged at 5 DPF, scale bar = 1 mm. (E) Quantification of dorsal iridophores in mitfa(lf) embryonic zebrafish treated with vehicle or BMPi from 12 to 24 HPF, n = 7 and 9 for vehicle and BMPi groups, respectively, from two independent experiments (N = 2). Error bars represent mean + /- SEM, P-value was calculated using one-way ANOVA with Tukey’s multiple comparisons test in panel A and Student’s t-test in panel C and E. *p<0.05, ***p<0.001, ****p<0.0001, n.s., not significant.
-
Figure 7—source data 1
BMP signaling regulates expression of and acts through mitfa to impact pigment cell fates.
- https://cdn.elifesciences.org/articles/50047/elife-50047-fig7-data1-v2.xlsx
Figure 7—figure supplement 1
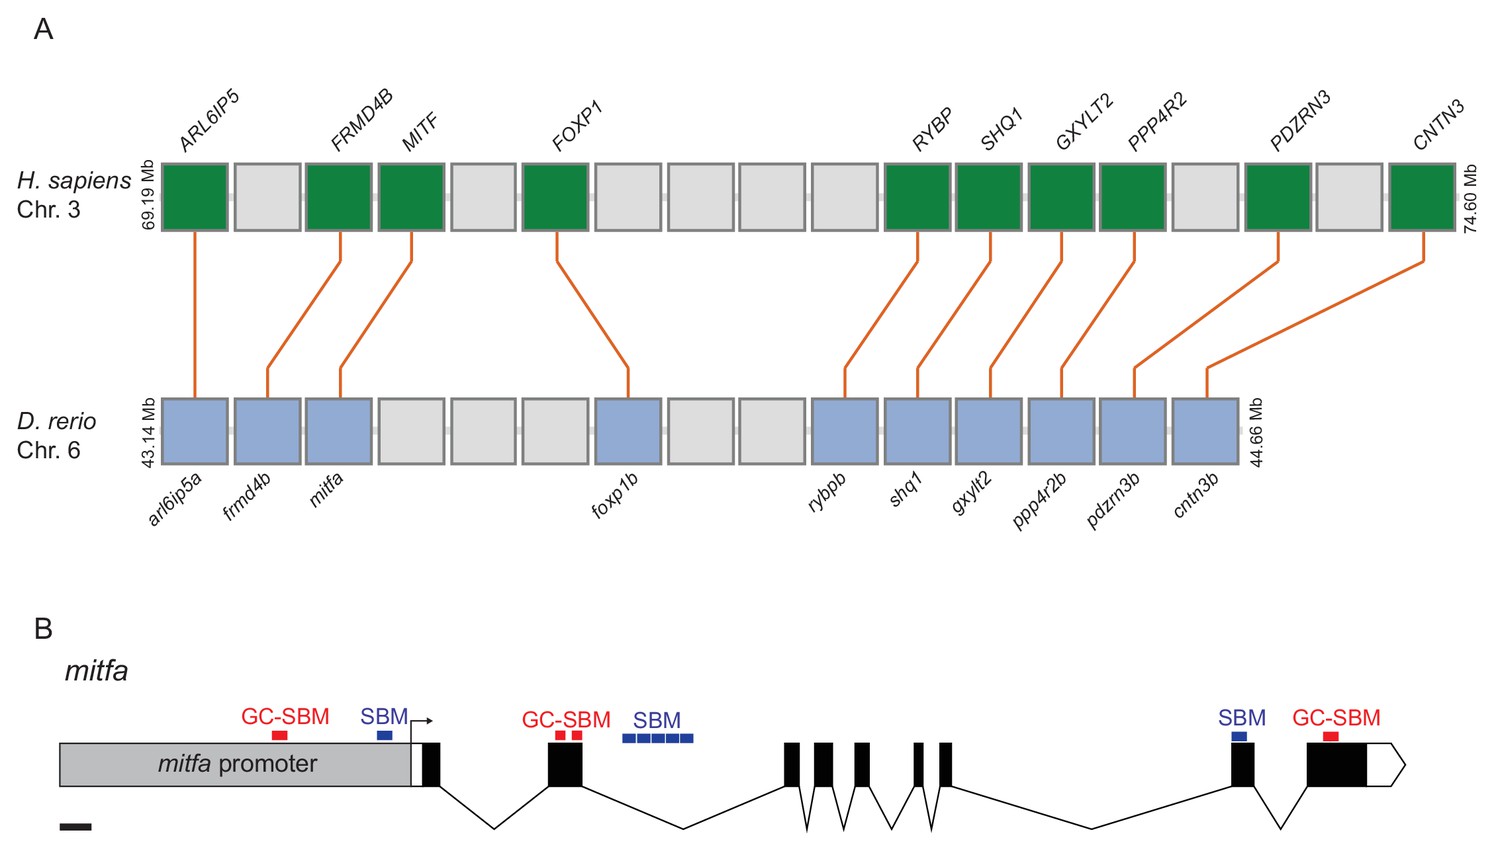
Diagram of synteny between MITF and mitfa loci and SMAD binding motifs at the mitfa locus.
(A) Diagram of orthologous genes flanking the MITF and mitfa loci in human and zebrafish genomes, respectively. H. sapiens, Homo sapiens; D. rerio, Danio rerio. (B) Diagram of mitfa locus, including promoter, intronic and exonic regions with identified SMAD binding motifs (SBM) and GC-rich SMAD binding motifs (GC-SBM). Scale bar = 200 bp.
Tables
Key resources table
| Reagent type (species) or resource | Designation | Source or reference | Identifiers | Additional information |
|---|---|---|---|---|
| Strain, strain background (Danio rerio) | gdf6a(lf) | Gosse and Baier, 2009 PMID: 19164594 | gdf6as327 allele | |
| Strain, strain background (Danio rerio) | gdf6b(lf) | This paper | Generated using Golden Gate TALEN kit – see Materials and methods | |
| Strain, strain background (Danio rerio) | Tg(mitfa:eGFP) | Curran et al., 2009 PMID: 19527705 | ||
| Strain, strain background (Danio rerio) | Tg(crestin:eGFP) | Kaufman et al., 2016 -- PMID:26823433 | ||
| Strain, strain background (Danio rerio) | Tg(crestin:mCherry) | Kaufman et al., 2016 PMID:26823433 | ||
| Strain, strain background (Danio rerio) | Tg(ubi:switch) | Mosimann et al., 2011 PMID: 21138979 | ||
| Strain, strain background (Danio rerio) | Tg(mitfa:gdf6a) | This paper | gdf6a expressed under the mitfa promoter, generated using Tol2Mediate transgenesis – see Materials and methods. | |
| Strain, strain background (Danio rerio) | mitfa(lf) | Lister et al., 1999 PMID: 10433906 | nacre mutant | |
| Strain, strain background (Danio rerio) | foxd3(lf) | Stewart et al., 2006 PMID: 16499899 | sym1 mutant | |
| Antibody | Phospho-SMAD1/5/9, rabbit monoclonal | CellSignaling | #13820 | 1:200 |
| Antibody | Mitfa, rabbit polyclonal | Venkatesan et al. | N/A | 1:100 |
| Antibody | GFP, mouse monoclonal | Thermo-Fisher | #MA5-15256 | 1:500 |
| Antibody | Goat anti-Mouse IgG-Alexafluor 488 | Thermo-Fisher | #A-11001 | 1:300 |
| Antibody | Goat anti-Rabbit IgG-Alexafluor 555 | Thermo-Fisher | #A-21428 | 1:300 |
| Antibody | Anti-DIG-AP Fab Fragments | Roche | #11093274910 | 1:1000 |
| Antibody | HuC/HuD antibody, mouse monoclonal | Thermo-Fisher | #A-21271 | 1:100 |
| Recombinant DNA reagent | pENTRP4P1r-mitfa | Ceol et al., 2011 -- PMID: 21430779 | ||
| Recombinant DNA reagent | pDONR221-gdf6b | Venkatesan et al., 2018-- PMID: 29202482 | ||
| Recombinant DNA reagent | pDONR221-gdf6a | This paper | Tol2 p221 entry vector containing gdf6a | |
| Recombinant DNA reagent | pDONR221-Cre-ERT2 | Mosimann et al., 2011 PMID: 21138979 | ||
| Recombinant DNA reagent | miniCoopR | Ceol et al., 2011 PMID: 21430779 | ||
| Recombinant DNA reagent | pcsDest2 | Villefranc et al., 2007 PMID: 17948311 | ||
| Recombinant DNA reagent | p3E-polyA | Tol2Kit (Kwan et al., 2007) PMID: 17937395 | ||
| Recombinant DNA reagent | pME-eGFP | Tol2Kit (Kwan et al., 2007) PMID: 17937395 | ||
| Recombinant DNA reagent | pDestTol2CG2 (395) | Tol2Kit (Kwan et al., 2007) PMID: 17937395 | ||
| Recombinant DNA reagent | pDestTol2pA2 (394) | Tol2Kit (Kwan et al., 2007) PMID: 17937395 | ||
| Recombinant DNA reagent | miniCoopR-mitfa:dnBMPR:pA | This paper | miniCoopR vector expressing dominant negative BMP receptor; generated by multisite Gateway | |
| Recombinant DNA reagent | miniCoopR-mitfa:eGFP:pA | This paper | miniCoopR vector expressing control eGFP; generated by multisite Gateway | |
| Recombinant DNA reagent | miniCoopR-mitfa:SMAD1-DVD:pA | This paper | miniCoopR vector expressing constitutively active SMAD1; generated by multisite Gateway | |
| Recombinant DNA reagent | 395-mitfa:gdf6a:pA | This paper | pDEST vector expressing gdf6a under mitfa promoter; generated by multisite Gateway | |
| Recombinant DNA reagent | 395-mitfa:Cre-ERT2:pA | This paper | pDEST vector expression CreERT2 under mitfa promoter; generated by multisite Gateway | |
| Recombinant DNA reagent | pcsDest2-gdf6a | This paper | pDEST vector used to generate gdf6a probes; generated by Gateway reaction | |
| Recombinant DNA reagent | pcsDest2-gdf6b | This paper | pDEST vector used to generate gdf6b probes; generated by Gateway reaction | |
| Sequence-based reagent | qPCR and Genotyping Primers | See Supplementary file 1 for primer sequences | ||
| Commercial assay or kit | LR Clonase 2+ Kit | Thermo-Fisher | #12538120 | |
| Commercial assay or kit | LR Clonase Kit | Thermo-Fisher | #11791043 | |
| Commercial assay or kit | Golden Gate TALEN and TAL Effector Kit 2.0 | Addgene | #1000000024 | |
| Commercial assay or kit | mMessage mMachine Kit | Ambion | #AM1340 | |
| Commercial assay or kit | DIG RNA Labeling Kit | Roche | #11175025910 | |
| Commercial assay or kit | SuperScript III First Strand Synthesis | Thermo-Fisher | #18080051 | |
| Commercial assay or kit | SYBR Green Master Mix | Applied Biosystems | 4344463 | |
| Commercial assay or kit | Click-it EdU Cell Proliferation Kit for Imaging, AF 555 | Invitrogen | C10338 | |
| Chemical compound, drug | DMH1 | Sigma Aldrich | #D8946 | |
| Chemical compound, drug | Hydroxytamoxifen (4-OHT) | Sigma Aldrich | #H7904 | |
| Chemical compound, drug | Epinephrine | Acros Organics | #430140250 | |
| Chemical compound, drug | DAPI | Life Technologies | #D1306 | |
| Chemical compound, drug | Hoechst-33342 | Life Technologies | #H3570 | |
| Chemical compound, drug | Pronase | Sigma Aldrich | #10165921001 | |
| Chemical compound, drug | Trizol | Ambion | #15596026 | |
| Software, algorithm | Microsoft Excel | Microsoft Excel (Office 2016), www.microsoft.com | ||
| Software, algorithm | Graphpad Prism 7 | GraphPad Prism seven for Windows, GraphPad Software, www.graphpad.com | ||
| Software, algorithm | Image J | (Schindelin et al., 2012) | ||
| Software, algorithm | Leica LAS X | Leica LAS X for Windows, Leica Microsystems, www.leica-microsystems.com | ||
| Software, algorithm | FlowJo | Flow Jo v10 for Windows, Beckton, Dickinson and Company, www.flowjo.com |
Additional files
-
Supplementary file 1
Primers used for qRT-PCR and genotyping reactions.
(A) Primers used for qRT-PCR reactions. (B) Primers used for genotyping PCR reactions and generation of Gateway compatible DNA fragments.
- https://cdn.elifesciences.org/articles/50047/elife-50047-supp1-v2.docx
-
Transparent reporting form
- https://cdn.elifesciences.org/articles/50047/elife-50047-transrepform-v2.pdf
Download links
A two-part list of links to download the article, or parts of the article, in various formats.
Downloads (link to download the article as PDF)
Open citations (links to open the citations from this article in various online reference manager services)
Cite this article (links to download the citations from this article in formats compatible with various reference manager tools)
Regulation of zebrafish melanocyte development by ligand-dependent BMP signaling
eLife 8:e50047.
https://doi.org/10.7554/eLife.50047


