Regulation of zebrafish melanocyte development by ligand-dependent BMP signaling
- University of Massachusetts Medical School, United States
Abstract
Preventing terminal differentiation is important in the development and progression of many cancers including melanoma. Recent identification of the BMP ligand GDF6 as a novel melanoma oncogene showed GDF6-activated BMP signaling suppresses differentiation of melanoma cells. Previous studies have identified roles for GDF6 orthologs during early embryonic and neural crest development, but have not identified direct regulation of melanocyte development by GDF6. Here, we investigate the BMP ligand gdf6a, a zebrafish ortholog of human GDF6, during the development of melanocytes from the neural crest. We establish that the loss of gdf6a or inhibition of BMP signaling during neural crest development disrupts normal pigment cell development, leading to an increase in the number of melanocytes and a corresponding decrease in iridophores, another neural crest-derived pigment cell type in zebrafish. This shift occurs as pigment cells arise from the neural crest and depends on mitfa, an ortholog of MITF, a key regulator of melanocyte development that is also targeted by oncogenic BMP signaling. Together, these results indicate that the oncogenic role ligand-dependent BMP signaling plays in suppressing differentiation in melanoma is a reiteration of its physiological roles during melanocyte development.
Introduction
Tumor differentiation status is often an important prognostic factor in cancer. For many cancer types, tumors that are less differentiated are associated with a higher grade and worse prognosis compared to more differentiated tumors, which often follow indolent courses (Hoek et al., 2006; Rosai and Ackerman, 1979). In order to adopt a less differentiated state, a common event in cancer is downregulation of factors that drive differentiation of adult tissues (Chaffer et al., 2011; Dravis et al., 2018). This loss of pro-differentiation factors is often coupled with an upregulation of other factors that are associated with embryonic or progenitor states (Caramel et al., 2013; Tulchinsky et al., 2014). Thus, many de-differentiated and high-grade cancers have gene expression profiles associated with early development (O'Brien-Ball and Biddle, 2017).
Developmental factors and pathways co-opted by cancers are often related to vital cellular functions, such as proliferation, migration, and differentiation (Caramel et al., 2013; Casas et al., 2011; McConnell et al., 2019; Perego et al., 2018). Furthermore, the embryonic origin of specific tissues can impact the aggressive phenotypes tumors are able to acquire (Carreira et al., 2006; Gupta et al., 2005; Hoek and Goding, 2010). In the case of melanoma, the cell of origin, the melanocyte, is derived from the neural crest, a highly migratory population of embryonic cells. Thus, melanomas are prone to early and aggressive metastasis, associated with the expression of neural crest migratory factors (Liu et al., 2014). Additionally, melanomas lacking differentiation exhibit more aggressive characteristics and are broadly more resistant to therapy (Fallahi-Sichani et al., 2017; Knappe et al., 2016; Landsberg et al., 2012; Mehta et al., 2018; Müller et al., 2014; Shaffer et al., 2017; Zuo et al., 2018). While differentiation status is evidently important in the course of disease, the mechanisms by which melanomas and other cancers remain less differentiated are poorly understood. Since many of the factors associated with a lack of differentiation in these cancers are expressed and apparently function during embryogenesis, elucidating the developmental roles of these factors can give insight into their behaviors and roles in tumorigenesis and progression.
A key pathway involved in early development and development of the neural crest is the bone-morphogenetic protein (BMP) pathway (reviewed in Kishigami and Mishina, 2005). The BMP pathway is activated by BMP ligands binding to BMP receptors, which can then phosphorylate SMAD1, SMAD5, and SMAD8 (also called SMAD9). Phosphorylated SMAD1/5/8 associates with co-SMAD4, forming a complex that can translocate to the nucleus and regulate expression of target genes. BMP signaling is important in early embryonic dorsoventral patterning and induction of the neural crest (Garnett et al., 2012; Hashiguchi and Mullins, 2013; McMahon et al., 1998; Schumacher et al., 2011). Following neural crest induction, BMP signaling has been implicated in patterning within the neural crest and surrounding tissues, as well as development of nervous system- and musculoskeletal-related neural crest lineages (Hayano et al., 2015; McMahon et al., 1998; Nikaido et al., 1997; Reichert et al., 2013; Valdivia et al., 2016). While many developmental functions of BMP signaling are well characterized, the relationship of BMP signaling to the development of pigment cells from the neural crest is poorly understood.
Our laboratory recently identified a BMP ligand, GDF6, that acts to suppress differentiation and cell death in melanoma (Venkatesan et al., 2018). We found that GDF6-activated BMP signaling in melanoma cells represses expression of MITF, a key regulator of melanocyte differentiation, leading to a less differentiated state. Here, we investigate the role of GDF6 and the BMP pathway in development of pigment cells in zebrafish. We show that BMP signaling regulates fate specification of neural crest-derived pigment cell lineages and suppresses expression of mitfa, an ortholog of MITF. Furthermore, we show that disrupting BMP signaling alters fate specification between melanocyte and iridophore populations in the zebrafish. We determine that this shift in fate occurs at the level of an mitfa-positive pigment progenitor cell, and that BMP signaling acts through mitfa to direct mitfa-positive pigment progenitor cells to a specific fate. Altogether, these findings suggest pathologic BMP signaling in melanoma is a reiteration of normal physiologic function of BMP signaling during melanocyte development.
Results
Loss of gdf6a leads to an increase in adult pigmentation
To understand potential functions of gdf6a in the melanocyte lineage, we first determined if any alterations in pigment pattern were present in animals lacking gdf6a. In these studies, we used the gdf6as327 allele, hereafter referred to as gdf6a(lf), which encodes an early stop codon and has previously been shown to cause a complete loss of gdf6a function (Gosse and Baier, 2009). Previous studies have identified early roles for gdf6a during initial embryonic patterning, including dorsoventral patterning immediately following fertilization, thus gdf6a(lf) mutants have significantly decreased viability during the first 5 days post fertilization (Sidi et al., 2003). However, we found that a small proportion of gdf6a(lf) animals are able to survive early development and progress to adulthood. These gdf6a(lf) adult zebrafish had increased pigmentation when compared to wild-type zebrafish (Figure 1A). Furthermore, gdf6a(lf) adult zebrafish had qualitative disruption of the normal pigment pattern of both stripe and scale-associated melanocytes, and a significant increase in the number of scale-associated melanocytes as well as the overall scale area covered by melanin (Figure 1A and B). These results indicate that gdf6a(lf) mutants have melanocyte defects.
Figure 1 with 1 supplement see all
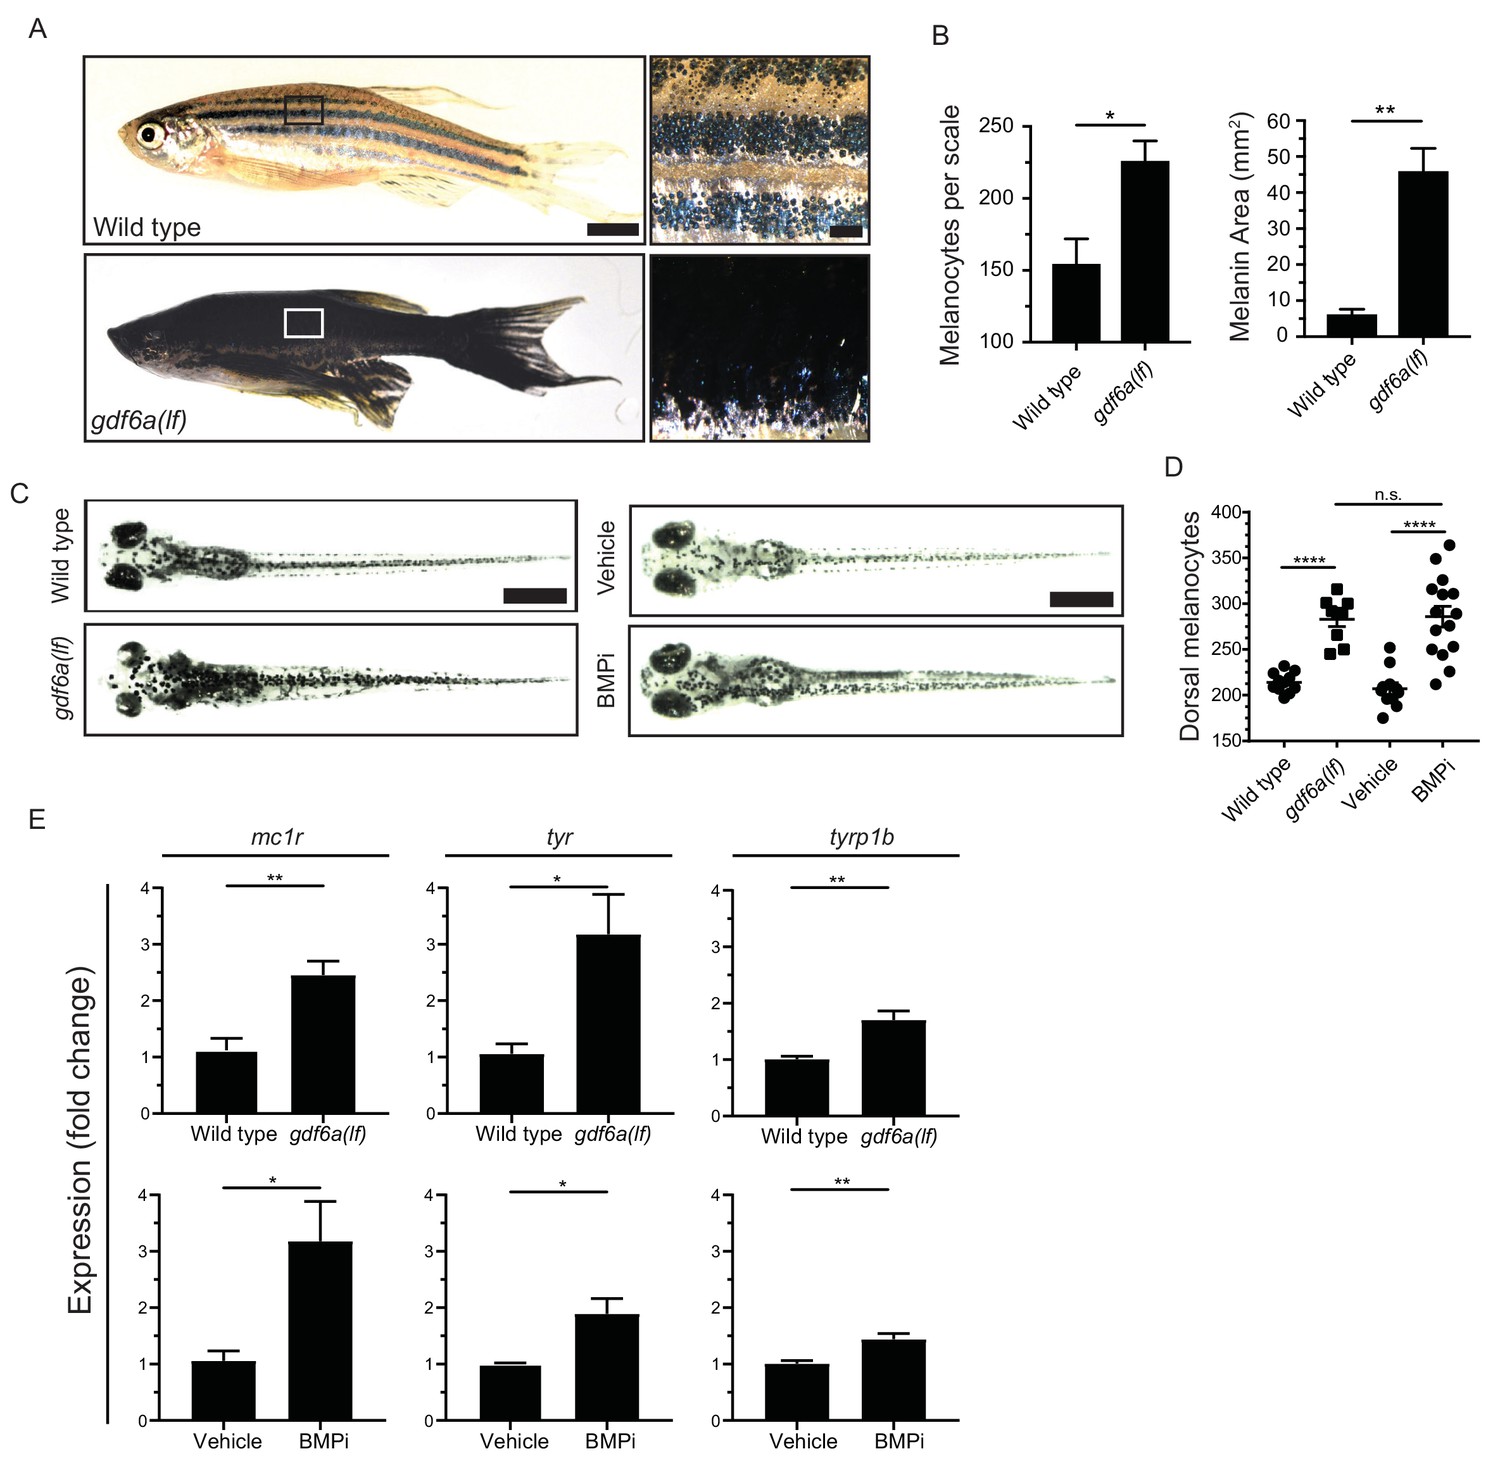
gdf6a loss or BMP inhibition causes the development of supernumerary melanocytes.
(A) Images of wild-type and gdf6a(lf) adult zebrafish, scale bar = 4 mm, inset scale bar = 1 mm. (B) Quantification of number of melanocytes (left) and scale pigmentation using melanin coverage (right), n = 3 scales per group. (C) Wild-type and gdf6a(lf) embryos imaged at 5 days post fertilization (DPF); vehicle- and BMPi-treated embryos imaged at 5 DPF. Scale bar = 1 mm. Animals were treated with epinephrine prior to imaging. (D) Quantification of dorsal melanocytes per animal in 5 DPF wild-type, gdf6a(lf) mutant, vehicle-, and BMPi-treated embryos. n = 11, 9, 11, and 15 embryos, respectively, from two independent experiments (N = 2). (E) Expression of melanocyte differentiation markers mc1r, tyr, and tyrp1b by qRT-PCR in wild-type, gdf6a(lf) mutant, vehicle-, and BMPi-treated embryos. n = 5–6 replicates across two independent experiments (N = 2) for each group. Expression was normalized to β-actin. Error bars represent mean + /- SEM. P-values were calculated using Student’s t-test in panel B and E, and one-way ANOVA with Tukey’s multiple comparisons test in panels D, *p<0.05, **p<0.01, ***p<0.001, ****p<0.0001, n.s., not significant.
-
Figure 1—source data 1
gdf6a loss or BMP inhibition causes the development of supernumerary melanocytes.
- https://cdn.elifesciences.org/articles/50047/elife-50047-fig1-data1-v2.xlsx
Loss of gdf6a or inhibition of BMP signaling leads to an increase in embryonic melanocytes
Since zebrafish develop their adult pigment pattern during metamorphosis, it is possible gdf6a acts during this stage to change adult pigmentation, and not during initial pigment cell development in embryogenesis (Parichy and Spiewak, 2015; Patterson and Parichy, 2013; Quigley et al., 2004). To address this issue, we investigated whether gdf6a(lf) caused embryonic pigmentation changes and, if so, whether any such changes were BMP-dependent. We crossed gdf6a(lf) heterozygotes and, in randomly selected progeny, quantified the number of melanocytes that developed by 5 days post-fertilization (DPF). Following melanocyte quantification, we determined the genotype of each embryo. In parallel, we treated wild-type zebrafish during the period of neural crest induction and melanocyte specification (12 to 24 hours post fertilization) with a small molecule BMP inhibitor, DMH1, hereafter referred to as BMPi, and performed the same quantification of embryonic melanocytes (Hao et al., 2010). gdf6a(lf) homozygous animals developed approximately 40% more dorsal melanocytes by 5 DPF, when compared to sibling wild-type animals and gdf6a(lf) heterozygotes (Figure 1C and D, Figure 1—figure supplement 1A). gdf6a(lf) animals also showed increased expression of mc1r, tyr, and tyrp1b, all markers of differentiated melanocytes, which is consistent with an increase in melanocyte number (Figure 1E). Furthermore, treatment with BMPi phenocopied the melanocyte changes observed in gdf6a(lf) mutants, coupled with a similar increase in expression of mc1r, tyr, and tyrp1b (Figure 1D and E). We observed a similar increase in total body melanocytes, indicating that there is an overall increase in melanocyte development instead of a failure of migration leading to a specific increase in dorsal melanocytes (Figure 1—figure supplement 1B). These results indicate gdf6a-activated BMP signaling normally acts in embryos to limit melanocyte development.
gdf6 ortholog expression during neural crest development
Numerous BMP ligands are expressed during early embryogenesis and participate in multiple facets of development, including neural crest induction. It was previously shown that multiple BMP ligands are activated during zebrafish neural crest development (Reichert et al., 2013). Of those ligands investigated, only gdf6a and bmp6 were expressed in the neural crest, and only gdf6a activated BMP signaling within neural crest cells. An additional study identified dorsal expression of a zebrafish paralog of gdf6a, gdf6b, indicating it could potentially act in the neural crest (Bruneau and Rosa, 1997). We verified gdf6b expression is restricted to the neural tube, and further determined gdf6b loss of function has no impact on pigment cell development by generating a gdf6b mutant, hereafter referred to as gdf6b(lf), and counting embryonic melanocytes (Figure 1—figure supplement 1D–G). We generated double mutants for both gdf6a(lf) and gdf6b(lf) to assess whether these paralogs functioned redundantly or could compensate for the loss of one another. Unfortunately, gdf6a(lf); gdf6b(lf) double mutants had significant morphologic defects and decreased viability such that we could not adequately compare melanocyte numbers in these animals (Figure 1—figure supplement 1H–I). However, because there were no pigmentation defects in gdf6b(lf) mutants and gdf6a(lf) pigmentation defects were the same severity as observed in animals treated with a pan-BMP inhibitor, it is likely that most, if not all, effects of BMP signaling on melanocyte development are directed by gdf6a.
BMP inhibition increases mitfa-positive pigment cell progenitors in the neural crest
We sought to determine the mechanism by which BMP signaling inhibits melanocyte development in embryos. Based on our experiments using BMPi, we suspected BMP signaling acts during pigment cell development from the neural crest to prevent an increase in melanocytes. Following induction, neural crest cells undergo proliferation, followed by fate restriction and specification, in which individual cells become less and less multipotent until a single possible fate remains (Jin et al., 2001; Lewis, 2004; Nagao et al., 2018). In many cases, specification to the ultimate lineage is determined by activation of an individual or a group of lineage-specific factors (Sauka-Spengler et al., 2007). For pigment cells, fate specification is dependent on integration of many signaling factors, including BMP and Wnt signaling, as well as key transcription factors, such as AP2α, AP2ε, SOX-, PAX-, and FOX-family transcription factors (Garnett et al., 2012; Ignatius et al., 2008; Lister et al., 2006; Sato et al., 2005; Southard-Smith et al., 1998; Thomas and Erickson, 2009; Van Otterloo et al., 2010). In zebrafish, specification of the melanocyte lineage depends on upregulation of sox10 and downregulation of factors inhibiting differentiation, such as foxd3 (Curran et al., 2010; Curran et al., 2009; Dutton et al., 2001). Following sox10 upregulation, a subset of sox10-positive cells can activate pigment lineage markers associated with melanocytes, iridophores, and xanthophores (Elworthy et al., 2003; Fadeev et al., 2016; Nagao et al., 2018; Nord et al., 2016; Petratou et al., 2018). mitfa is a key factor that is expressed early in pigment progenitor cells (Lister et al., 1999). Based on this framework, we hypothesized two potential mechanisms by which supernumerary melanocytes are generated: 1) an increase in proliferation of either neural crest cells or pigment progenitor cells, or 2) an increase in the proportion of neural crest cells that are specified to become pigment progenitor cells. To assess changes in proliferation of neural crest cells and pigment cells, we analyzed cell cycle profiles using flow cytometry. Embryos expressing reporters for neural crest cells (Tg(crestin:eGFP)) or pigment progenitor cells (Tg(mitfa:eGFP)) were treated with BMPi from 12 to 24 HPF, during neural crest development and specification (Curran et al., 2009; Kaufman et al., 2016). Embryos were dissociated, stained with DAPI, and analyzed for DNA content of neural crest cells or pigment progenitor cells as defined by the fluorescent GFP marker (Figure 2—figure supplement 1A). We observed no increase in the percent of S/G2/M cells in either population, indicating no apparent change to cell cycle distribution of either neural crest cells or pigment progenitor cells (Figure 2—figure supplement 1B–C). To verify these findings reflected no change in proliferation rate, we performed a 5-ethynyl-2’-deoxyuridine (EdU) incorporation assay. We treated Tg(crestin:eGFP) or Tg(mitfa:eGFP) embryos with BMPi or vehicle control along with EdU during early (12–14 HPF), middle (16–18 HPF), and late (20–22 HPF) stages of neural crest and pigment cell development (Figure 2—figure supplement 1D–E). We observed no differences in EdU incorporation between BMPi-treated and vehicle control groups, indicating no change in proliferation rates of either crestin:eGFP-positive neural crest cells or mitfa:eGFP-positive pigment progenitor cells (Figure 2—figure supplement 1F). Without an obvious increase in proliferation, we tested the hypothesis that a change in specification results in increased melanocytes. To assess changes in specification of neural crest cells into pigment progenitor cells, we utilized reporter embryos marking neural crest cells in red (Tg(crestin:mCherry)) and pigment progenitor cells in green (Tg(mitfa:eGFP)) (Figure 2A). Using these reporters, neural crest cells not committed to the pigment cell lineage are crestin:mCherry single-positive, whereas crestin:mCherry/mitfa:eGFP double-positive cells are those newly committed to the pigment cell lineage. We treated embryos containing both reporter transgenes with BMPi from 12 to 24 HPF, during neural crest development and specification. At 24 HPF, we dissociated embryos and analyzed cells for fluorescent marker expression by flow cytometry (Figure 2A). Embryos treated with BMPi showed approximately a 1.5-fold increase in the percentage of crestin:mCherry/mitfa:eGFP double-positive cells per total crestin:mCherry-positive cells (Figure 2B and C). We further verified a change in specification by staining BMPi- or vehicle-treated Tg(crestin:eGFP) embryos with anti-Mitfa antibody and assessed the proportion of crestin:eGFP-positive cells that stained positive for Mitfa (Figure 2D). We observed a 1.3-fold increase in the proportion of Mitfa/crestin:eGFP double-positive cells per total crestin:eGFP-positive cells in animals treated with BMPi compared to vehicle control (Figure 2E). Altogether these results suggest that an increase in embryonic melanocytes is caused by an increase in the proportion of neural crest cells specified as pigment progenitor cells, rather than a change in proliferation of either neural crest or pigment progenitor cells.
Figure 2 with 1 supplement see all
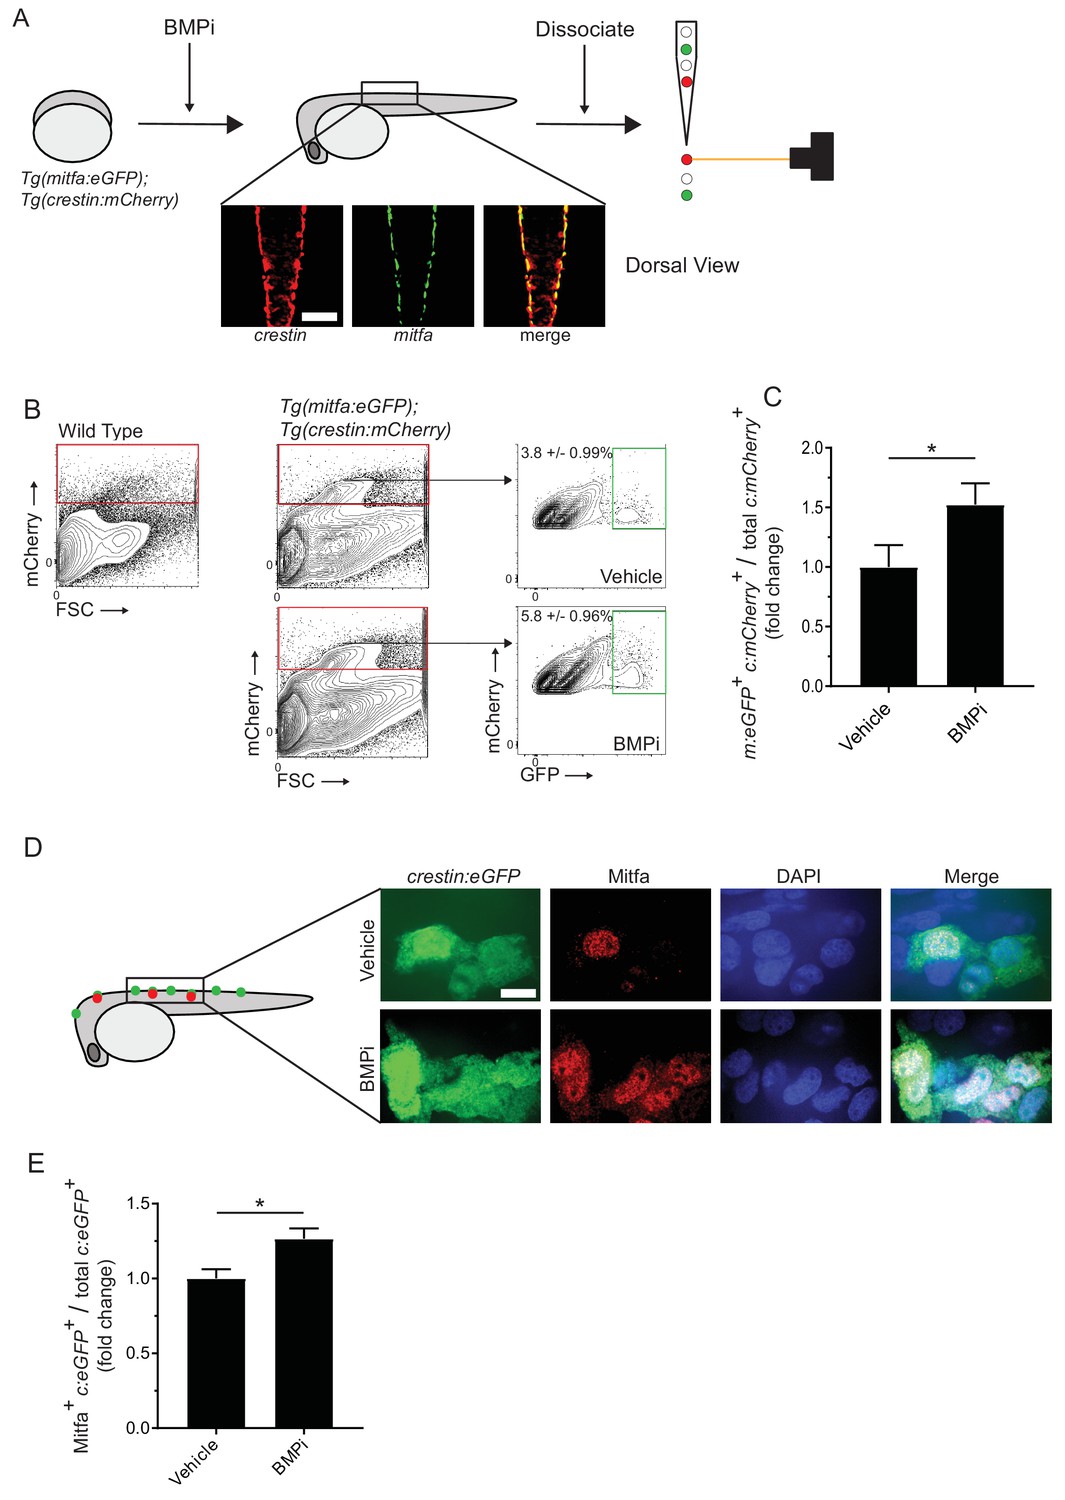
Inhibition of BMP signaling increases mitfa-positive neural crest cells.
(A) Diagram of experiment. Tg(crestin:mCherry); Tg(mitfa:eGFP) embryos were treated with BMPi from 12 to 24 HPF. At 24 HPF, embryos were dissociated and analyzed via flow cytometry for GFP- and mCherry-positive cells, scale bar = 200 µm. (B) Gating strategy based on non-transgenic wild-type control to identify crestin:mCherry-positive cells and crestin:mCherry/mitfa:eGFP double-positive cells. Top, control vehicle-treated embryos. Bottom, BMPi-treated embryos. (C) Fold change in crestin:mCherry/mitfa:eGFP double-positive cells per total crestin:mCherry-positive cells in vehicle and BMPi-treated groups, N = 3 biological replicates of 80–100 stage-matched embryos pooled for each condition. m:eGFP, mitfa:eGFP; c:mCherry, crestin:mCherry. (D) anti-Mitfa immunofluorescence in Tg(crestin:eGFP) embryos treated with BMPi or vehicle control and fixed at 24 hr, scaled bar = 10 µm. (E) Fold change in Mitfa/crestin:eGFP double-positive cells per total crestin:eGFP-cells, n = 16 embryos from two independent experiments (N = 2) for each condition. c:eGFP, crestin:eGFP. Error bars represent mean + /- SEM; P-value was calculated using ratio-paired t-test in panel C and Student’s t-test in panel E, *p<0.05.
-
Figure 2—source data 1
Inhibition of BMP signaling increases mitfa-positive neural crest cells.
- https://cdn.elifesciences.org/articles/50047/elife-50047-fig2-data1-v2.xlsx
BMP signaling in mitfa-expressing pigment progenitor cells can alter melanocyte development in embryogenesis
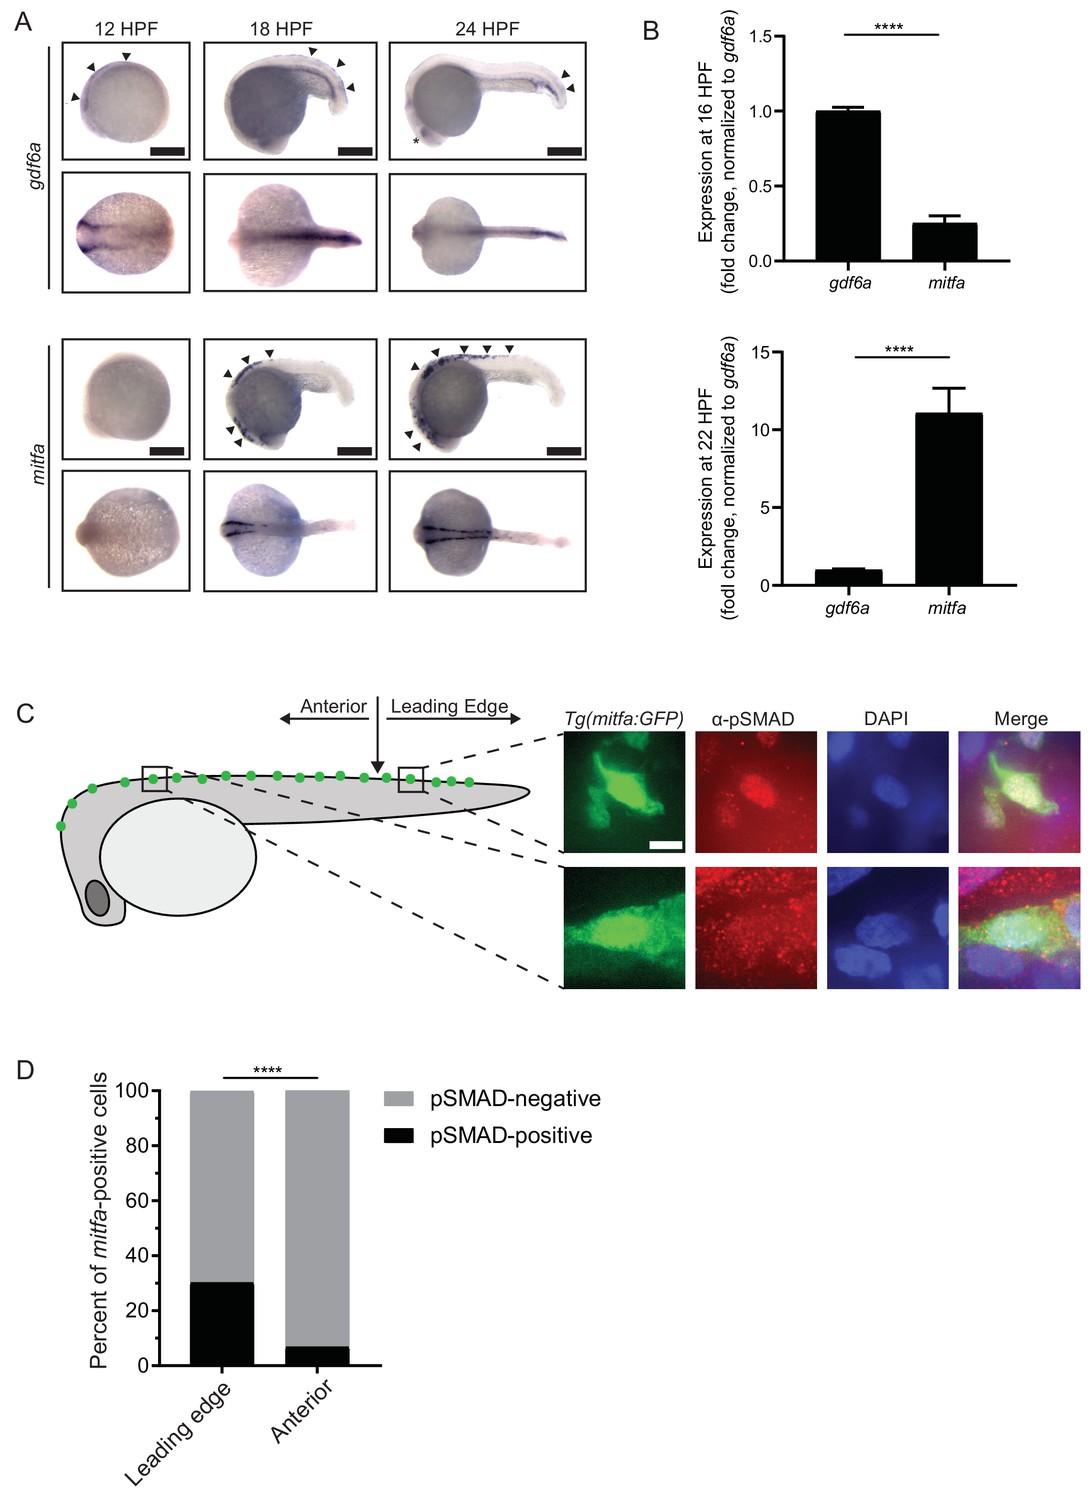
Because we observed an impact of BMP signaling on neural crest-to-pigment progenitor cell specification, we explored the relationship between gdf6a and mitfa expression. First, using whole-mount in situ hybridization (Figure 3A), we found that the anteroposterior expression domains of gdf6a and mitfa were mostly, if not completely, non-overlapping. As described previously (Reichert et al., 2013; Rissi et al., 1995), gdf6a was expressed in the anterior half of the embryo in the neural crest at 12 HPF, shortly following its induction. Consistent with previous observations (Lister et al., 1999), mitfa was not expressed at this time. At 18 HPF, gdf6a was absent from the anterior neural crest, but instead was restricted to the posterior half of the embryo with expression apparent in the hypochord and epidermal cells (Rissi et al., 1995). At 24 HPF, gdf6a expression was further restricted to the posterior end of the embryo and mitfa expression expanded posteriorly to a commensurate degree.
Figure 3 with 1 supplement see all
gdf6a expression and BMP activity in pigment progenitor cells.
(A) RNA in situ hybridization for gdf6a (top) and mitfa (bottom) at 12-, 18-, and 24 hr post-fertilization. Arrowheads indicate expression domains in the region of the neural crest of gdf6a and mitfa. Asterisk indicates known dorsal retinal expression of gdf6a. Scale bar = 500 µm. (B) Expression of gdf6a and mitfa from neural crest cells isolated from Tg(crestin:eGFP) embryos by FACS at 16 HPF and 22 HPF. Samples were normalized to gdf6a expression. n = 5–6 replicates per conditions from two independent experiments (N = 2). (C) Images of GFP-positive cells from Tg(mitfa:eGFP) zebrafish stained with α-pSMAD 1/5/8 antibody. Scale bar = 10 µm. (D) Quantification of mitfa:eGFP-positive cells that are phospho-SMAD1/5/8-positive. The leading edge encompassed the five most posterior mitfa-positive cells, whereas anterior cells constituted any mitfa-positive cells anterior to the leading edge. n = 102 and 186 for distal leading edge and anterior cells, respectively, from three independent experiments (N = 3). P-values were calculated using Fisher’s exact test for panels B and D, ****p<0.0001.
-
Figure 3—source data 1
gdf6a expression and BMP activity in pigment progenitor cells.
- https://cdn.elifesciences.org/articles/50047/elife-50047-fig3-data1-v2.xlsx
To quantify changes in expression of gdf6a and mitfa specifically in neural crest cells, we isolated eGFP-positive cells from Tg(crestin:eGFP) embryos at 16 HPF and 22 HPF by FACS. We analyzed the relative levels of gdf6a and mitfa expression using qRT-PCR and found that gdf6a expression is relatively higher than mitfa at 16 HPF, while mitfa expression is relatively higher at 22 HPF, indicating an inverse correlation of expression over the course of neural crest development (Figure 3B). The reciprocal nature of gdf6a and mitfa expression changes is consistent with the possibility that gdf6a-driven BMP signaling acts in neural crest cells to repress mitfa expression and prevent excess pigment progenitor cells from being specified. However, we also considered the possibility that BMP signaling is active in mitfa-positive cells and affects the fates of these cells. To determine if BMP signaling is active in mitfa-positive cells, we stained Tg(mitfa:eGFP) zebrafish with antibodies against phosphorylated-SMAD-1/5/8 (pSMAD). We verified specificity of the anti-pSMAD antibody using BMPi treated embryos (Figure 3—figure supplement 1). 30% of mitfa-expressing cells on the leading, posterior edge of the mitfa expression domain had nuclear-localized pSMAD staining, whereas only 7% of mitfa-expressing cells in regions anterior to the leading edge showed nuclear pSMAD staining (Figure 3C and D). These results suggest BMP signaling is active as mitfa-expressing cells first arise in the neural crest, but is turned off in such cells as development proceeds.
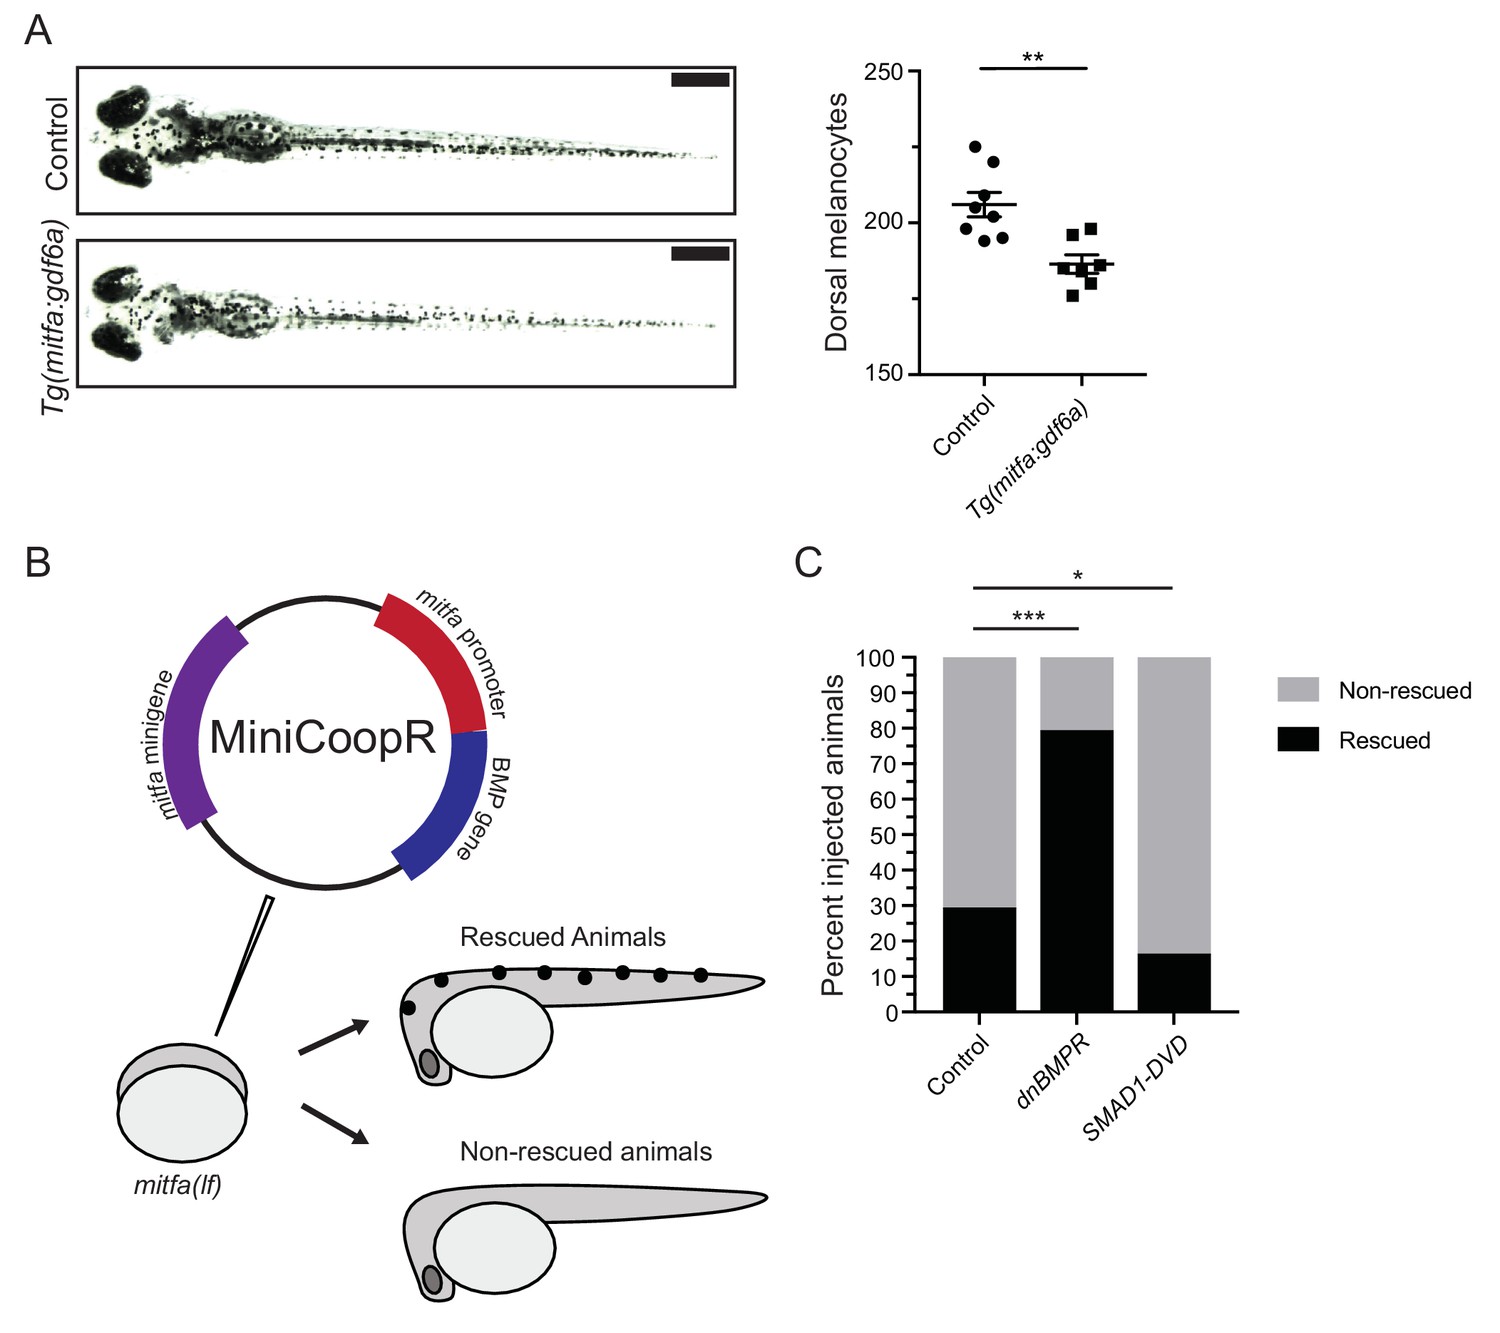
To assess if BMP activity in mitfa-expressing cells can impact melanocyte development, we directly altered BMP activity in these cells. We first generated a stably transgenic zebrafish line expressing gdf6a under the control of the mitfa promoter (Tg(mitfa:gdf6a)) to increase gdf6a expression in mitfa-expressing cells. Embryos expressing the Tg(mitfa:gdf6a) transgene developed fewer melanocytes than non-transgenic sibling controls (Figure 4A). To alter BMP signaling in a cell-autonomous manner within mitfa-expressing cells, we used the miniCoopR system in two complementary approaches: a) to express a dominant negative BMP receptor (dnBMPR), which suppresses intracellular BMP activity, and b) to express a phospho-mimetic variant of SMAD1 (SMAD1-DVD) to constitutively activate intracellular BMP activity (Ceol et al., 2011; Nojima et al., 2010; Pyati et al., 2005). We injected mitfa(lf) animals with miniCoopR-dnBMPR, miniCoopR-SMAD1-DVD, or control miniCoopR-eGFP (Figure 4B). At 5 DPF, we scored animals for rescue of melanocytes. Animals injected with miniCoopR-dnBMPR showed a rescue rate of 79% as compared to 29% of miniCoopR-eGFP-injected animals. Furthermore, animals injected with miniCoopR-SMAD1-DVD showed a 15% rescue rate (Figure 4C). Together these results suggest BMP signaling is active in mitfa-expressing cells and modulating BMP signaling can alter the fate of these mitfa-expressing cells during development. Thus, gdf6a-driven BMP signaling can both limit the number of mitfa-expressing cells arising from the neural crest but also act in mitfa-expressing pigment progenitor cells to influence their development into melanocytes.
Figure 4
BMP signaling within pigment progenitor cells can impact embryonic melanocytes.
(A) Tg(mitfa:gdf6a) and non-transgenic sibling control embryos (left), and quantification of dorsal melanocytes per animal in each group (right). Animals were treated with epinephrine prior to imaging at 5 DPF, n = 8 and 7 for control and Tg(mitfa:gdf6a) groups, respectively, from two independent experiments (N = 2). Scale bar = 1 mm. (B) Diagram of miniCoopR rescue experiment. Animals harboring a mitfa(lf) mutation were injected at the single-cell stage with the miniCoopR vector containing a BMP gene. Animals were evaluated at 5 DPF for the presence of melanocytes. If melanocytes were present, that animal was scored as rescued, whereas animals lacking melanocytes were scored as non-rescued. (C) Percentages of rescued and non-rescued animals following injection of a miniCoopR-BMP vector, n = 361, 193 and 152 for control, dnBMPR, and SMAD1-DVD groups, respectively, from four independent experiments (N = 4). Error bars represent mean + /- SEM. P-values were calculated Student’s t-test for panel A and with Fisher’s exact test with Bonferroni’s correction for panel C, *p<0.05, **p<0.01, ***p<0.001.
-
Figure 4—source data 1
BMP signaling within pigment progenitor cells can impact embryonic melanocytes.
- https://cdn.elifesciences.org/articles/50047/elife-50047-fig4-data1-v2.xlsx
Iridophores, but not other neural crest derivatives, are reduced upon gdf6a loss
Because we observed no change in proliferation of crestin- or mitfa-positive populations, but the number of melanocytes developing from these precursors was increased, we questioned whether this increase corresponded with a commensurate loss of a related pigment or other neural crest-derived cell type. To determine what cells may be impacted, we looked for transcriptional changes in markers of other, related neural crest derivatives as well as known neural crest factors important in specifying different cell fates. We isolated RNA from gdf6a(lf) and wild-type embryos at 5 DPF. Additionally, we isolated RNA from embryos treated with a BMPi or vehicle control. We performed qRT-PCR for markers of neural crest derivatives, including mbpa for glial cells, pomca for adrenal medullary cells, neurog1 for neuronal cells, aox5 for xanthophores, and pnp4a for iridophores, as well as sox10 and foxd3 (Fadeev et al., 2016; McGraw et al., 2008; Parichy et al., 2000; Thomas and Erickson, 2009). As a control, we used a chondrocyte marker, col2a1a, as craniofacial development has previously been described to be disrupted by gdf6a loss (Reed and Mortlock, 2010). Per our previous analysis, gdf6a(lf) mutants and BMPi-treated embryos demonstrated an increase in expression of the melanocyte markers mc1r, tyr, and tyrp1b (Figure 1E). And as predicted based on previous literature, gdf6a(lf) mutants and BMPi-treated embryos showed a decrease in expression of the chondrocyte marker, col2a1a. We observed no changes in foxd3 expression, but observed a slight downregulation of sox10 (Figure 5—figure supplement 1A), previously shown to be downregulated upon GDF6 knockdown in melanoma cells (Venkatesan et al., 2018). Because foxd3 has previously been shown to be related to both BMP signaling in neural crest induction and pigment cell development (Curran et al., 2010; Curran et al., 2009; Stewart et al., 2006), we questioned if foxd3 may have a functional role in mediating the effect of BMP signaling on melanocyte development despite no change in expression. We treated foxd3(lf) (Stewart et al., 2006) embryos with BMPi and assessed melanocyte development (Figure 5—figure supplement 1B). We observed a comparable increase in melanocytes in foxd3(lf) and sibling control animals, indicating BMP signaling acts independently of foxd3 to alter melanocyte development. Despite a downregulation of sox10 in gdf6a mutants and BMPi-treated embryos, we still observed an increase in mitfa expression and markers of melanocyte differentiation, and an increase in the number of melanocytes.
In our evaluation of neural crest derivative populations, markers for neuronal, glial, adrenal medullary, and xanthophore lineages were no different in gdf6a compared to wild-type animals (Figure 5A). Similar results were obtained in animals treated with a BMPi, with the exception of a change in mbpa expression, a marker for glial cells. Previous studies have shown glial cell development is regulated in part by BMP activity (Jin et al., 2001). Since mbpa expression was unchanged in gdf6a(lf) animals, this suggests another BMP ligand is involved in activating BMP signaling to promote glial cell development. For neuronal and xanthophore cell populations, we verified that the expression profile correlated with cell numbers or development of key structures. We treated animals with BMPi or vehicle and stained with anti-HuC/D antibody to label neuronal cells in the dorsal root ganglia and developing gastrointestinal tract (Lister et al., 2006) (Figure 5—figure supplement 1C–E). We detected no difference in dorsal root ganglia and enteric neuron development between each group. We imaged animals stably expressing Tg(aox5:PALM-eGFP) to label xanthophores and found no qualitative difference in xanthophores between BMPi- and vehicle-treated groups (Eom and Parichy, 2017) (Figure 5—figure supplement 1F). We further evaluated mitfa-positive cells associated with the dorsal root ganglion that have previously been connected to formation of adult pigment and are proposed to be melanocyte stem cells (Dooley et al., 2013; Hultman et al., 2009; Singh et al., 2016). Using Tg(mitfa:eGFP) embryos, we observed an increase in these DRG-associated, mitfa:eGFP-positive cells, suggesting that BMPi not only increases differentiated embryonic melanocytes but also cells that underlie adult pigmentation (Figure 5—figure supplement 1G).
Figure 5 with 1 supplement see all
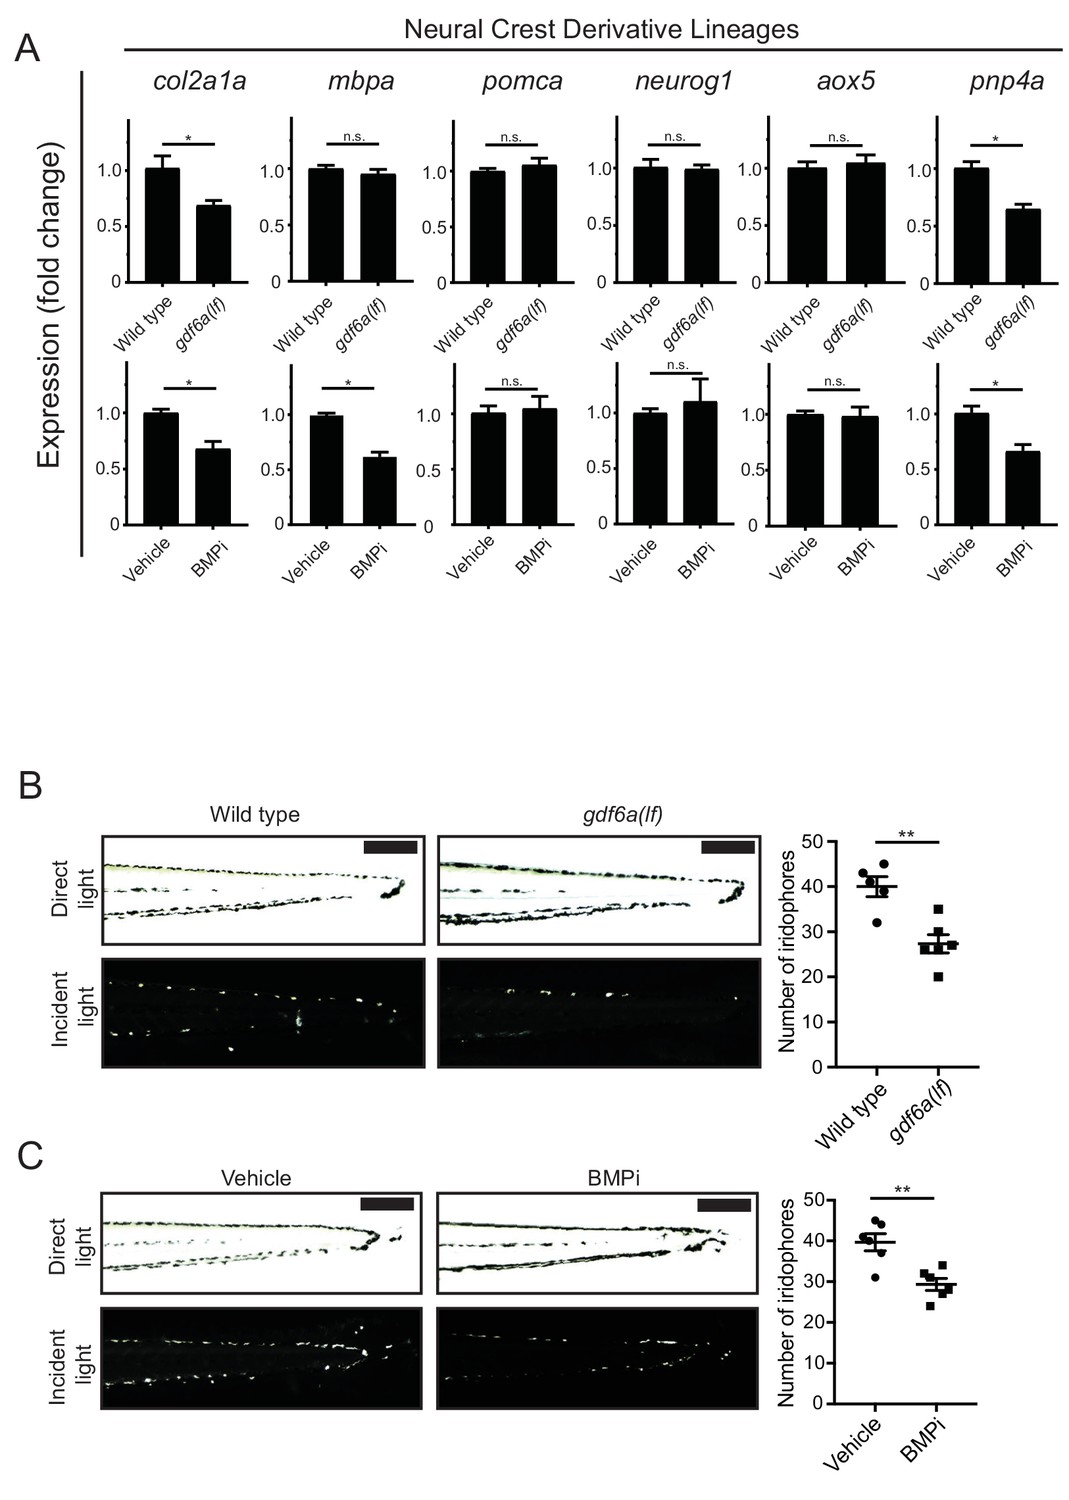
gdf6a loss and BMP inhibition impact development of specific neural crest derivatives.
(A) Expression analyses of multiple neural crest and neural crest derivative lineage markers. qRT-PCR was used to assess changes in markers of neural crest markers and neural crest derivatives in gdf6a(lf) embryonic zebrafish (top) and BMPi-treated wild-type zebrafish (bottom) at 5 DPF; col2a1a, chondrocytes; mbpa, glial; pomca, adrenal medullary cells; neurog1, neuronal cells; aox5, xanthophores; pnp4a, iridophores; n = 5–6 for each group from two independent experiments (N = 2). (B) Direct light (top) and incident light (bottom) images of wild-type and gdf6a(lf) embryos at 5 DPF and quantification of dorsal iridophores (right) per animal in each group. Animals were treated with epinephrine prior to imaging at 5 DPF; n = 5 and 6 for wild-type and gdf6a(lf) groups, respectively, from two independent experiments (N = 2); scale bar = 500 µm. (C) Direct light, top, and incident light, bottom, images of wild-type embryos treated with vehicle or BMPi from 12 to 24 HPF and quantification of dorsal iridophores, right, per animal in vehicle and BMPi treated groups. Animals treated with epinephrine prior to imaging at 5 DPF, n = 6 and 6 for vehicle and BMPi groups, respectively, from two independent experiments (N = 2); scale bar = 1 mm. Error bars represent mean + /- SEM, P-values calculated with Student’s t-test, *p<0.05, **p<0.01, n.s., not significant.
-
Figure 5—source data 1
gdf6a loss and BMP inhibition impact development of specific neural crest derivatives.
- https://cdn.elifesciences.org/articles/50047/elife-50047-fig5-data1-v2.xlsx
In our transcriptional analyses of gdf6a(lf) and BMPi-treated embryos, we observed a decrease in expression of pnp4a, a marker for the iridophore lineage, indicating a potential deficit of iridophore development (Figure 5A). Since pnp4a is expressed in other developing cells and tissues, such as retinal cell populations, we wanted to confirm these changes were specific to a deficit in neural crest-derived body iridophores (Cechmanek and McFarlane, 2017; Lopes et al., 2008; Petratou et al., 2018). We quantified the number of dorsal iridophores that developed in gdf6a(lf) embryos (Figure 5B) and embryos treated with BMPi (Figure 5C) at 5 DPF, using incident light to highlight embryonic iridophores. Embryos developed 32% and 27% fewer iridophores with gdf6a(lf) or BMPi treatment, respectively. Together, these results indicate that gdf6a-driven BMP signaling promotes iridophore development.
BMP inhibition increases the likelihood a multipotent precursor will develop into a melanocyte
Melanocytes and iridophores have previously been shown to develop from mitfa-expressing pigment progenitor cells (Curran et al., 2010; Curran et al., 2009). To determine if BMP signaling regulates fate specification of melanocytes and iridophores from mitfa-expressing pigment progenitor cells, we performed lineage tracing. We injected Tg(ubi:switch) embryos, which stably express a ubi:loxp-GFP-STOP-loxp-mCherry-STOP transgene (Mosimann et al., 2011) with a mitfa:Cre-ERT2 transgene to generate mosaic expression of Cre-ERT2 in mitfa-positive cells (Figure 6A). Injected embryos were treated with BMPi and hydroxytamoxifen (4-OHT), the latter to allow nuclear localization of Cre and generate recombinant events in individual mitfa-expressing pigment progenitor cells. Since these mitfa-expressing pigment progenitor cells are transient, 4-OHT treatment was limited to 12 to 24 HPF, with thorough embryo water exchange to wash out the drug and prevent recombinant events after specification. At 5 DPF, embryos with individual recombinant events, indicated by single mCherry-positive cells, were evaluated for the fate of those cells. In animals treated with BMPi, we observed an increase in the ratio of labeled melanocytes to iridophores as compared to vehicle-treated controls (Figure 6B, Figure 6—figure supplement 1). This result suggests that BMP signaling normally promotes the development of mitfa-expressing pigment progenitor cells into iridophores at the expense of melanocytes.
Figure 6 with 1 supplement see all
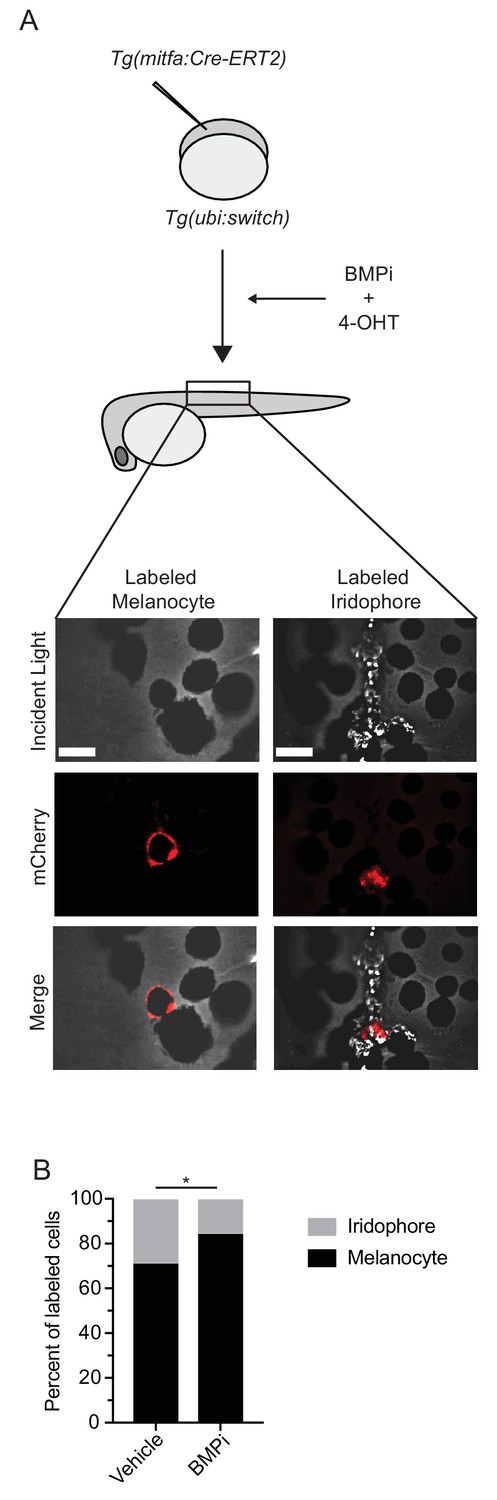
BMP inhibition impacts fate specification of mitfa-positive pigment progenitor cells.
(A) Diagram of lineage tracing experiment. Embryos containing Tg(ubi:switch) were injected with a mitfa:Cre-ERT2 construct and treated with BMPi and tamoxifen (4-OHT) from 12 to 24 HPF to block BMP signaling and allow Cre recombination. At 5 DPF, animals were screened for successful recombination by presence of single mCherry-labeled pigment cells, and the identities of those cells were assessed using incident light. Scale bar = 40 µm. (B) Quantification of mCherry-labeled cell fates at 5 DPF in vehicle and BMPi-treated animals, n = 101 and 80 labeled cells for vehicle and BMPi groups, respectively, from five independent experiments (N = 5); P-value calculated using Fisher’s exact test, *p<0.05.
-
Figure 6—source data 1
BMP inhibition impacts fate specification of mitfa-positive pigment progenitor cells.
- https://cdn.elifesciences.org/articles/50047/elife-50047-fig6-data1-v2.xlsx
BMP signaling represses mitfa expression within neural crest and pigment progenitor cells
Previous studies have indicated that the expression level of mitfa within pigment progenitor cells is important in specifying a melanocyte versus iridophore fate (Curran et al., 2010; Curran et al., 2009). Cells with a higher level mitfa expression are more likely to become melanocytes, while those that downregulate mitfa are more likely to become iridophores. Since gdf6a(lf) and BMP-inhibited embryos have excess melanocytes and fewer iridophores, we hypothesized that this phenotype resulted from disrupted regulation of mitfa expression in these embryos. This hypothesis was driven, in part, by our previous data in human melanoma cells, in which knockdown of GDF6 decreased phospho-SMAD1/5/8 binding at the MITF locus and increased MITF expression (Venkatesan et al., 2018). We first determined the potential for mitfa to be regulated in a similar manner as MITF. We first looked at the flanking regions of both the MITF and mitfa loci for orthologous genes (Catchen et al., 2009). We found many of the same orthologs present near both loci, indicating a syntenic relationship (Figure 7—figure supplement 1A). We did not find conservation in mitfa of the phospho-SMAD-binding region defined in mammalian cells. However, in mitfa we did identify phospho-SMAD binding motifs (GC-SBM) similar to the one present in the mammalian phospho-SMAD-binding region (Morikawa et al., 2011), as well as additional phospho-SMAD-binding motifs that have been defined previously (Jonk et al., 1998). The presence of such sites suggests the potential for mitfa to be directly regulated by phospho-SMAD1/5/8 similarly to MITF (Figure 7—figure supplement 1B). To assess mitfa levels within neural crest cells and mitfa-expressing pigment progenitor cells, we treated Tg(crestin:eGFP) and Tg(mitfa:eGFP) embryos with BMPi as previously described. We dissociated embryos and used fluorescence-activated cell sorting (FACS) to isolate crestin:eGFP-positive or mitfa:eGFP-positive cells. We then assessed mitfa transcript levels in each population by qRT-PCR. Treatment with BMPi led to approximately 3-fold and 6-fold increases in mitfa expression in crestin:eGFP-positive and mitfa:eGFP-positive cells, respectively (Figure 7A). To explore this question on a single-cell level and analyze Mitfa protein levels, we stained BMPi-treated and vehicle-treated Tg(crestin:eGFP) embryos with an anti-Mitfa antibody (Figure 7B) (Venkatesan et al., 2018). In BMPi-treated animals, we observed a 2.5-fold increase in Mitfa staining intensity in crestin:eGFP-positive cells, indicating inhibition of BMP signaling leads to an increase in Mitfa protein in pigment progenitor cells at a single-cell level (Figure 7C). Furthermore, those cells that were Mitfa-positive and crestin:eGFP-negative showed a 1.7-fold increase in Mitfa staining intensity, indicating inhibition of BMP signaling also leads to an increase in Mitfa protein following specification of pigment cells (Figure 7B and C). Together, these results indicate BMP signaling suppresses mitfa expression in cells during specification of pigment cell lineages.
Figure 7 with 1 supplement see all
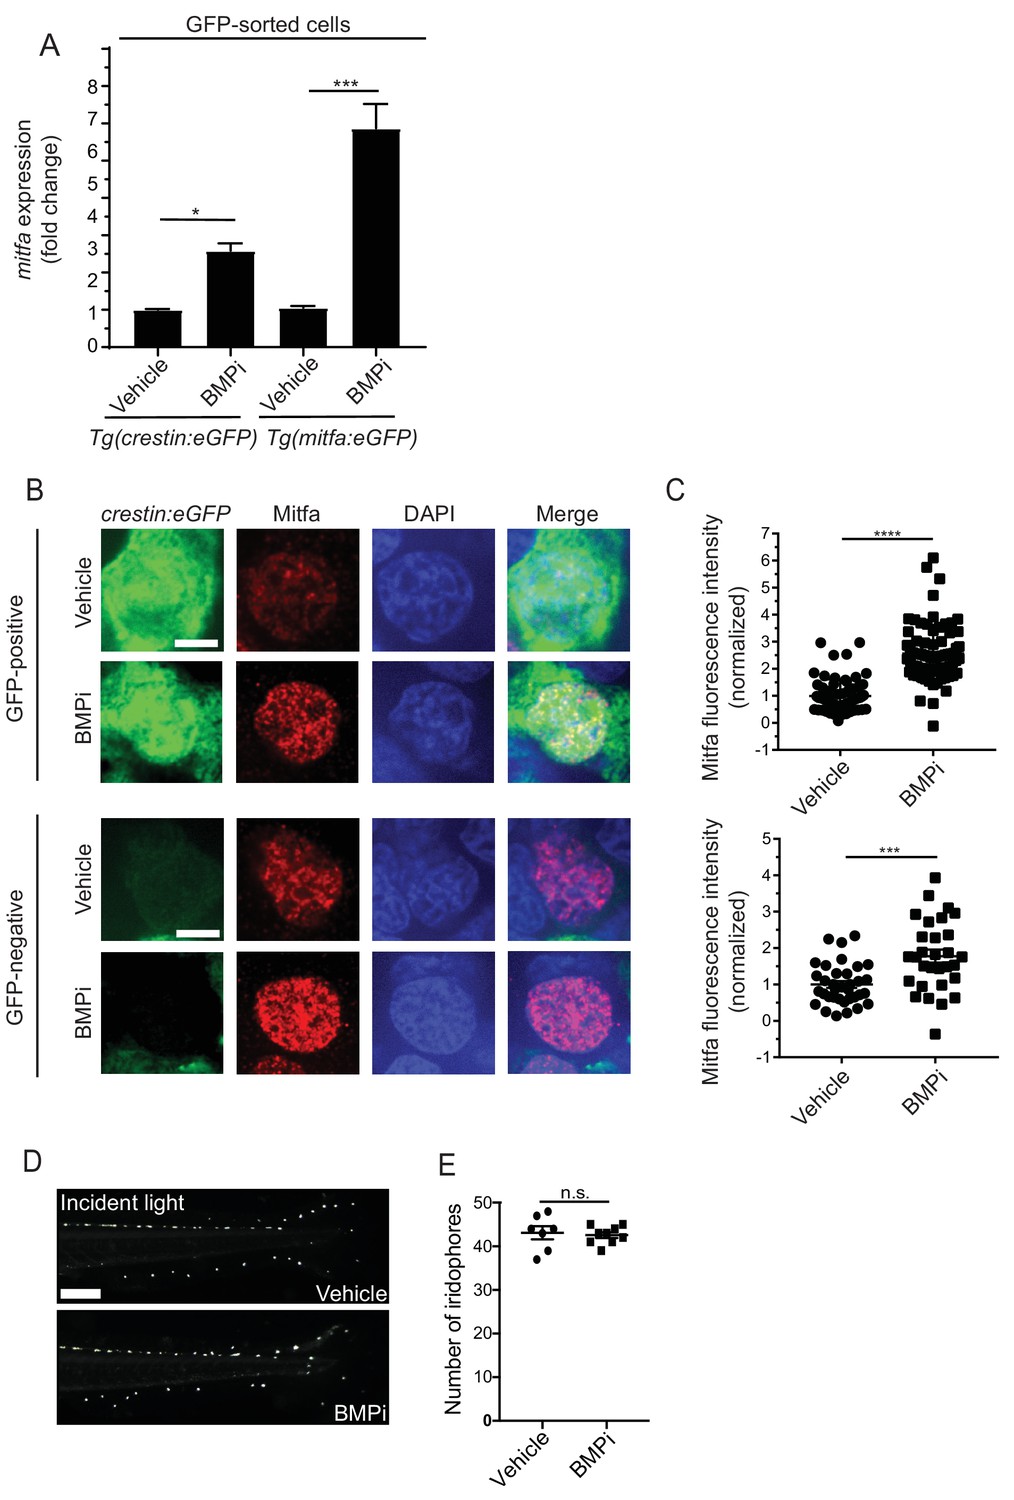
BMP signaling regulates expression of and acts through mitfa to impact pigment cell fates.
(A) mitfa expression in sorted GFP-positive cells from Tg(crestin:eGFP) and Tg(mitfa:eGFP) embryos treated with vehicle or BMPi from 12 to 24 HPF, n = 4–5 replicates for each condition from two independent experiments (N = 2). (B) anti-Mitfa immunofluorescence, DAPI and merged images of Tg(crestin:eGFP) embryos treated with vehicle control or BMPi in GFP-positive cells (top) and GFP-negative cells (bottom), scale bar = 5 µm. (C) Quantification of anti-Mitfa fluorescence intensity of individual nuclei in GFP-positive cells (top) and GFP-negative cells (bottom); n = 65 and 74 for GFP-positive vehicle and BMPi groups, respectively; n = 35 and 30 for GFP-negative vehicle and BMPi groups, respectively, from three independent experiments (N = 3). (D) Incident light images of mitfa(lf) embryonic zebrafish treated with vehicle or BMPi from 12 to 24 HPF and imaged at 5 DPF, scale bar = 1 mm. (E) Quantification of dorsal iridophores in mitfa(lf) embryonic zebrafish treated with vehicle or BMPi from 12 to 24 HPF, n = 7 and 9 for vehicle and BMPi groups, respectively, from two independent experiments (N = 2). Error bars represent mean + /- SEM, P-value was calculated using one-way ANOVA with Tukey’s multiple comparisons test in panel A and Student’s t-test in panel C and E. *p<0.05, ***p<0.001, ****p<0.0001, n.s., not significant.
-
Figure 7—source data 1
BMP signaling regulates expression of and acts through mitfa to impact pigment cell fates.
- https://cdn.elifesciences.org/articles/50047/elife-50047-fig7-data1-v2.xlsx
Regulation of pigment cell fate by BMP signaling is dependent on mitfa
If deregulated mitfa expression is critical to the phenotypic defects observed upon inhibition of BMP signaling, then these defects should be dependent on mitfa function. To determine whether mitfa is indeed responsible for mediating the shift in cell fate regulated by BMP activity, we treated mitfa(lf) embryos with BMPi. As mitfa is necessary for the specification of all body melanocytes, mitfa(lf) animals do not develop any melanocytes during embryogenesis or through adulthood. However, these animals can develop iridophores and develop a greater number of iridophores at baseline than their wild-type counterparts (Lister et al., 1999). We hypothesized that, if an elevation of mitfa expression in BMPi-treated embryos was required to shift pigment progenitor cell fates from iridophores to melanocytes, there would be no decrease in the number of iridophores when mitfa(lf) embryos were treated with BMPi. Indeed, BMPi-treated embryos showed no difference in the number of iridophores compared to vehicle-treated controls (Figure 7D and E). Together, these results indicate that BMP inhibition requires mitfa to direct pigment progenitor cells away from iridophore fate.
Discussion
Our results elucidate a role for gdf6a-activated BMP signaling in suppressing melanocyte development from the neural crest during embryogenesis. Inhibition of BMP signaling leads to an increase of neural crest cells expressing mitfa, affecting the proportion of neural crest cells specified as pigment progenitor cells. Additionally, in BMP-inhibited embryos these mitfa-positive pigment progenitor cells demonstrate an increased propensity to become melanocytes, instead of iridophores. Cells in BMP-inhibited embryos have increased expression of mitfa, and the function of mitfa is required for the reduction of iridophores observed in BMP-inhibited embryos. Based on these findings, we propose that gdf6a-activated BMP signaling normally represses mitfa expression, limiting both the development of pigment progenitor cells from the neural crest and the specification of melanocytes from these pigment progenitor cells. As discussed below, MITF is downregulated by GDF6-activated BMP signaling to prevent melanocytic differentiation in melanomas (Venkatesan et al., 2018). The function we have defined for gdf6a-activated BMP signaling in development suggests that its activity is co-opted in tumors to prevent differentiation of melanoma cells.
Regulation of pigment cell fate by BMP signaling
Our studies indicate gdf6a-activated BMP signaling can regulate pigment cell development from the neural crest in two ways. First, BMP signaling restricts the number of neural crest cells that transition into mitfa-positive pigment cell progenitors. When BMP signaling is abrogated, additional cells adopt a pigment progenitor fate, which likely is a source of supernumerary melanocytes. Second, BMP signaling biases the fate choice of mitfa-positive progenitor cells. In BMP-deficient embryos, mitfa-positive progenitor cells more often become melanocytes and less often become iridophores. Previous studies have suggested a common melanocyte-iridophore progenitor (Curran et al., 2010; Curran et al., 2009; Petratou et al., 2018), and our data support the existence of such a progenitor and indicate that it is mitfa-expressing and influenced by BMP signaling. These studies implicate foxd3 (Curran et al., 2010; Curran et al., 2009) or some other unknown factor (Petratou et al., 2018) that regulates the fate of this progenitor. Our data indicate BMP signaling can act independently of foxd3 in impacting melanocyte development, thus suggesting BMP signaling may directly suppress the melanocyte fate or act indirectly through another factor. While BMP signaling regulates the fate of a common melanocyte-iridophore precursor, the decrease in the number of iridophores cannot fully account for the number of melanocytes gained in gdf6a(lf) and BMPi-treated embryos. Because gdf6a(lf) and BMPi-treatment are potentially impacting the entirety of neural crest development, other neural crest cells may be mis-specified to the melanocyte lineage. This mis-specification could account for the discrepancy between the gain of melanocytes and loss of iridophores. If mis-specification of other neural crest cells is occurring, other neural crest lineages could show a deficit. However, in our assays evaluating other lineages, we detected no deficits outside of a loss of iridophores. Among several possibilities, the deficit may be present in a neural crest lineage we did not directly measure. Alternatively, deficits in other neural crest lineages may be small and distributed across multiple other lineages, such that our assays are unable to detect those subtle changes. Lastly, proliferation within the neural crest and of neural crest derivatives following migration from the crest is known to occur (Dougherty et al., 2013; Gianino et al., 2003), and it is possible that such proliferation could compensate for any deficit. In summary, the supernumerary melanocytes observed in gdf6a(lf) and BMPi-treated embryos are likely to arise from some combination of neural crest cells that are shunted to the pigment cell lineage and melanocyte-iridophore precursors that preferentially adopt a melanocyte fate.
Regulation of mitfa by BMP signaling
Our studies identify gdf6a-activated BMP signaling as a regulator of mitfa during pigment cell development in zebrafish. Previous studies have identified roles for gdf6a in the preplacodal ectoderm, retinal cell survival, and craniofacial development in zebrafish, while others have broadly connected BMP signaling to fate determination and cell survival in the neural crest in other model systems (French et al., 2009; Gosse and Baier, 2009; Hanel and Hensey, 2006; Jin et al., 2001; Reed and Mortlock, 2010; Reichert et al., 2013). However, the specific role of BMP signaling and of gdf6a on pigment cell development has heretofore been uncharacterized. Our analyses indicate that gdf6a is expressed in neural crest cells prior to the anteroposterior onset of mitfa expression. In addition, we observed an overlap of BMP activity and mitfa expression at the leading edge of the anteroposterior mitfa progression. When BMP signaling was inhibited, we found increased expression in neural crest cells of mitfa RNA and Mitfa protein. Together, these results suggest that gdf6a-driven BMP signaling regulates expression of mitfa and, consequently, directs fates adopted by mitfa-expressing cells. We speculate that such a role underlies the excess melanocytes observed in gdf6a(lf) and BMPi-treated embryos. In the absence of gdf6a and BMP signaling, increased expression of mitfa could lead to a greater proportion of neural crest cells adopting a pigment cell fate and could lead to a greater propensity of melanocyte-iridophore precursors adopting a melanocyte fate. These findings are consistent with what has previously been established in human melanoma cells, where GDF6-activated BMP signaling has been shown to promote pSMAD binding to MITF and is suspected to directly regulate MITF expression (Venkatesan et al., 2018). Our results support this regulatory role and provide a developmental context in vivo to understand why GDF6-activated BMP signaling is able to regulate MITF in melanoma cells.
Reiteration of normal physiologic function in melanoma
GDF6 and BMP signaling were previously described in melanoma to suppress differentiation through binding of pSMAD to MITF and corresponding repression of MITF expression (Venkatesan et al., 2018). Results from the current study indicate gdf6a and BMP signaling likely act in a similar fashion during development to repress expression of MITF, either directly or indirectly, leading to suppression of melanocyte specification and differentiation from the neural crest. Together, these findings suggest BMP activity in melanoma is a recapitulation of normal regulatory functions executed by gdf6a and BMP signaling during pigment cell development. It has been previously established that lineage programs can be co-opted by cancers to promote pro-tumorigenic characteristics (Carreira et al., 2006; Gupta et al., 2005). These programs activate EMT factors, such as TWIST1 and SNAI2, and factors associated with neural crest multipotency, such as SOX10, to promote invasiveness, proliferative capacity, metastatic capability, and therapeutic resistance (Caramel et al., 2013; Casas et al., 2011; Shakhova et al., 2015). However, it is unclear if these factors have similar regulation between normal development and melanoma. Here, we have described a developmental role for GDF6 that is reiterated in a pathologic process in disease. Because initiation and maintenance of neural crest gene expression has been shown to be important in melanoma, a better understanding of how regulation occurs during development may have clinical implications (Kaufman et al., 2016). Our findings indicate BMP signaling has a regulatory role over key differentiation genes during melanocyte development from the neural crest. Many studies have implicated expression of neural crest and melanocyte factors during many phases of melanoma, including initiation, progression, invasion, metastasis, and therapeutic resistance of melanoma (Carreira et al., 2006; Fallahi-Sichani et al., 2017; Gupta et al., 2005; Kaufman et al., 2016; Shaffer et al., 2017). Taken together, these findings suggest therapeutic targeting of GDF6 or BMP signaling would likely have a positive impact on prognosis and outcome in melanoma patients by promoting differentiation in tumors.
Materials and methods
Key resources table
| Reagent type (species) or resource | Designation | Source or reference | Identifiers | Additional information |
|---|---|---|---|---|
| Strain, strain background (Danio rerio) | gdf6a(lf) | Gosse and Baier, 2009 PMID: 19164594 | gdf6as327 allele | |
| Strain, strain background (Danio rerio) | gdf6b(lf) | This paper | Generated using Golden Gate TALEN kit – see Materials and methods | |
| Strain, strain background (Danio rerio) | Tg(mitfa:eGFP) | Curran et al., 2009 PMID: 19527705 | ||
| Strain, strain background (Danio rerio) | Tg(crestin:eGFP) | Kaufman et al., 2016 -- PMID:26823433 | ||
| Strain, strain background (Danio rerio) | Tg(crestin:mCherry) | Kaufman et al., 2016 PMID:26823433 | ||
| Strain, strain background (Danio rerio) | Tg(ubi:switch) | Mosimann et al., 2011 PMID: 21138979 | ||
| Strain, strain background (Danio rerio) | Tg(mitfa:gdf6a) | This paper | gdf6a expressed under the mitfa promoter, generated using Tol2Mediate transgenesis – see Materials and methods. | |
| Strain, strain background (Danio rerio) | mitfa(lf) | Lister et al., 1999 PMID: 10433906 | nacre mutant | |
| Strain, strain background (Danio rerio) | foxd3(lf) | Stewart et al., 2006 PMID: 16499899 | sym1 mutant | |
| Antibody | Phospho-SMAD1/5/9, rabbit monoclonal | CellSignaling | #13820 | 1:200 |
| Antibody | Mitfa, rabbit polyclonal | Venkatesan et al. | N/A | 1:100 |
| Antibody | GFP, mouse monoclonal | Thermo-Fisher | #MA5-15256 | 1:500 |
| Antibody | Goat anti-Mouse IgG-Alexafluor 488 | Thermo-Fisher | #A-11001 | 1:300 |
| Antibody | Goat anti-Rabbit IgG-Alexafluor 555 | Thermo-Fisher | #A-21428 | 1:300 |
| Antibody | Anti-DIG-AP Fab Fragments | Roche | #11093274910 | 1:1000 |
| Antibody | HuC/HuD antibody, mouse monoclonal | Thermo-Fisher | #A-21271 | 1:100 |
| Recombinant DNA reagent | pENTRP4P1r-mitfa | Ceol et al., 2011 -- PMID: 21430779 | ||
| Recombinant DNA reagent | pDONR221-gdf6b | Venkatesan et al., 2018-- PMID: 29202482 | ||
| Recombinant DNA reagent | pDONR221-gdf6a | This paper | Tol2 p221 entry vector containing gdf6a | |
| Recombinant DNA reagent | pDONR221-Cre-ERT2 | Mosimann et al., 2011 PMID: 21138979 | ||
| Recombinant DNA reagent | miniCoopR | Ceol et al., 2011 PMID: 21430779 | ||
| Recombinant DNA reagent | pcsDest2 | Villefranc et al., 2007 PMID: 17948311 | ||
| Recombinant DNA reagent | p3E-polyA | Tol2Kit (Kwan et al., 2007) PMID: 17937395 | ||
| Recombinant DNA reagent | pME-eGFP | Tol2Kit (Kwan et al., 2007) PMID: 17937395 | ||
| Recombinant DNA reagent | pDestTol2CG2 (395) | Tol2Kit (Kwan et al., 2007) PMID: 17937395 | ||
| Recombinant DNA reagent | pDestTol2pA2 (394) | Tol2Kit (Kwan et al., 2007) PMID: 17937395 | ||
| Recombinant DNA reagent | miniCoopR-mitfa:dnBMPR:pA | This paper | miniCoopR vector expressing dominant negative BMP receptor; generated by multisite Gateway | |
| Recombinant DNA reagent | miniCoopR-mitfa:eGFP:pA | This paper | miniCoopR vector expressing control eGFP; generated by multisite Gateway | |
| Recombinant DNA reagent | miniCoopR-mitfa:SMAD1-DVD:pA | This paper | miniCoopR vector expressing constitutively active SMAD1; generated by multisite Gateway | |
| Recombinant DNA reagent | 395-mitfa:gdf6a:pA | This paper | pDEST vector expressing gdf6a under mitfa promoter; generated by multisite Gateway | |
| Recombinant DNA reagent | 395-mitfa:Cre-ERT2:pA | This paper | pDEST vector expression CreERT2 under mitfa promoter; generated by multisite Gateway | |
| Recombinant DNA reagent | pcsDest2-gdf6a | This paper | pDEST vector used to generate gdf6a probes; generated by Gateway reaction | |
| Recombinant DNA reagent | pcsDest2-gdf6b | This paper | pDEST vector used to generate gdf6b probes; generated by Gateway reaction | |
| Sequence-based reagent | qPCR and Genotyping Primers | See Supplementary file 1 for primer sequences | ||
| Commercial assay or kit | LR Clonase 2+ Kit | Thermo-Fisher | #12538120 | |
| Commercial assay or kit | LR Clonase Kit | Thermo-Fisher | #11791043 | |
| Commercial assay or kit | Golden Gate TALEN and TAL Effector Kit 2.0 | Addgene | #1000000024 | |
| Commercial assay or kit | mMessage mMachine Kit | Ambion | #AM1340 | |
| Commercial assay or kit | DIG RNA Labeling Kit | Roche | #11175025910 | |
| Commercial assay or kit | SuperScript III First Strand Synthesis | Thermo-Fisher | #18080051 | |
| Commercial assay or kit | SYBR Green Master Mix | Applied Biosystems | 4344463 | |
| Commercial assay or kit | Click-it EdU Cell Proliferation Kit for Imaging, AF 555 | Invitrogen | C10338 | |
| Chemical compound, drug | DMH1 | Sigma Aldrich | #D8946 | |
| Chemical compound, drug | Hydroxytamoxifen (4-OHT) | Sigma Aldrich | #H7904 | |
| Chemical compound, drug | Epinephrine | Acros Organics | #430140250 | |
| Chemical compound, drug | DAPI | Life Technologies | #D1306 | |
| Chemical compound, drug | Hoechst-33342 | Life Technologies | #H3570 | |
| Chemical compound, drug | Pronase | Sigma Aldrich | #10165921001 | |
| Chemical compound, drug | Trizol | Ambion | #15596026 | |
| Software, algorithm | Microsoft Excel | Microsoft Excel (Office 2016), www.microsoft.com | ||
| Software, algorithm | Graphpad Prism 7 | GraphPad Prism seven for Windows, GraphPad Software, www.graphpad.com | ||
| Software, algorithm | Image J | (Schindelin et al., 2012) | ||
| Software, algorithm | Leica LAS X | Leica LAS X for Windows, Leica Microsystems, www.leica-microsystems.com | ||
| Software, algorithm | FlowJo | Flow Jo v10 for Windows, Beckton, Dickinson and Company, www.flowjo.com |
Zebrafish
Zebrafish were handled in accordance with protocols approved by the University of Massachusetts Medical School IACUC. Fish stocks were maintained in an animal facility at 28.5°C on a 14 hr/10 hr Light/Dark cycle (Westerfield, 1995). The wild-type strain used was AB. Published strains used in this study include gdf6a(lf) (gdf6as327) (Gosse and Baier, 2009), Tg(mitfa:eGFP) (Curran et al., 2009), Tg(crestin:eGFP) (Kaufman et al., 2016), Tg(crestin:mCherry) (Kaufman et al., 2016), mitfa(lf) (Lister et al., 1999), Tg(ubi:switch) (Mosimann et al., 2011), Tg(aox5:PALM-eGFP) (Eom and Parichy, 2017). Construction of new strains generated are detailed below.
DNA constructs
Request a detailed protocolDNA constructs were built using Gateway cloning (Life Technologies). Sequences of gdf6a, dnBMPR (Pyati et al., 2005) and SMAD1-DVD (Nojima et al., 2010) were PCR-amplified and cloned into pDONR221 (Life Technologies). Oligonucleotides used in cloning are described in Key Resources Section. Previously published entry clones used in this study were pENTRP4P1r-mitfa (Ceol et al., 2011), pDONR221-gdf6b (Venkatesan et al., 2018), pDONR221-CreERT2 (Mosimann et al., 2011). Previously published destination vectors used in this study are MiniCoopR (MCR) (Ceol et al., 2011) and pcsDest2 (Villefranc et al., 2007). p3E-polyA, pME-eGFP, pDestTol2CG2, pDestTol2pA2, pCS2FA-transpoase were acquired from the Tol2Kit (Kwan et al., 2007). Using the entry clones and destination vectors described above, the following constructions were built using multisite or single site Gateway (Life Technologies): MCR-mitfa:dnBMPR:pA, MCR-mitfa:eGFP:pA, MCR-mitfa:SMAD1-DVD:pA, pDestTol2CG2-mitfa:gdf6a:pA, pDestTol2pA2-mitfa:CreERT2:pA, pcsDest2-gdf6a, pcsDest2-gdf6b. All constructs were verified by restriction digest or sequencing.
Construction of gdf6b(lf)
Request a detailed protocolTo generate gdf6b(lf) mutants, we used TALEN genome editing. TALEN’s were designed targeting exon 1 of gdf6b (TAL1 sequence: GTCAGCATCACTGTTAT; TAL2 sequence: CCTTGATCGCCCTTCT). TALENs were assembled using the Golden Gate TALEN kit (Addgene) per the manufacturer’s instructions. TALEN plasmids were linearized and transcribed with mMESSAGE mMACHINE kit (Ambion). Zebrafish embryos were injected with 50 pg of mRNA of each TALEN arm. Injected embryos (F0) were matured to breeding age and outcrossed. Resulting offspring (F1) were genotyped by extraction genomic DNA from fin clips per standard protocol and PCR amplification with gdf6b primers. F1 offspring carrying mutations by genotyping were sequenced to identify mutations predicted to lead to loss of function of gdf6b. Following identification of candidate zebrafish by sequencing, zebrafish were bred to generate homozygous gdf6b(lf) mutations. Whole RNA was isolated from homozygous gdf6b(lf) embryos at 20 HPF and qRT-PCR was used to determine effective depletion of gdf6b transcripts. Primers for genotyping and qRT-PCR are listed in the Key Reagents section.
Construction of Tg(mitfa:gdf6a)
Request a detailed protocolTo generate the Tg(mitfa:gdf6a) transgenic line, 25 pg of pDestTol2CG2-mitfa:gdf6a:pA was injected along with 25 pg of Tol2 transposase RNA, synthesized from pCS2FA-transposase, into single cell wild-type embryos (Kwan et al., 2007). Embryos were screened for incorporation of the transgene by expression of cmlc:eGFP in the heart at 48 HPF. Animals with eGFP-positive hearts (F0) were outcrossed to wild-type animals to determine germline incorporation.
Drug treatments
Request a detailed protocolDrugs used in experiments were reconstituted at stock concentrations in solvent as follows: DMH1 (BMPi), 10 mM in DMSO; Tamoxifen (4-OHT), 1 mg/mL in ethanol; Epinephrine, 10 mg/mL in embryo media. Embryos were dechorionated by incubating in Pronase (Roche) for 10 min with gentle shaking. Dechorionated embryos were transferred to 6-well plates coated in 1.5% agarose in embryo media. Embryo media with appropriate drug concentration or vehicle control was added to each well. For BMPi and 4-OHT treatments, embryos were treated from 12 HPF (6ss) to 24 HPF (Prim-5). Embryos were incubated at 28.5°C for the duration of the drug treatment. Following drug treatment, embryos were thoroughly washed in fresh embryo medium and returned to incubator in new embryo medium until analysis.
Lineage tracing
Request a detailed protocolTo trace the lineage of embryonic pigment cells, Tg(ubi:switch) embryos were injected with 25 pg of pDestTol2pA2-mitfa:Cre-ERT2:pA and 25 pg of Tol2 transposase RNA at the single-cell stage. At 12 HPF, injected embryos were treated with BMPi and 4-OHT as described above. Following treatment, embryos were thoroughly washed and allowed to mature at 28.5°C to 5 DPF. Embryos were treated with 1 mg/mL epinephrine to contract melanosomes, anesthetized using 0.17 mg/mL tricaine in embryo media, mounted in 1% low-melt agarose on a plastic dish, and submerged in embryo media for imaging.
Mosaic rescue
Request a detailed protocolMiniCoopR constructs MCR-mitfa:dnBMPR:pA, MCR-mitfa:SMAD1-DVD:pA, and MCR-mitfa:eGFP:pA (control) were used. mitfa(lf) animals were injected with 25 pg of a single construct and 25 pg of Tol2 transposase RNA. Upon successful integration of the MCR constructs, the mitfa-minigene in the construct allowed development of melanocytes. Embryos were screened for incorporation of the transgene by rescue of melanocytes at 5 DPF (Ceol et al., 2011).
In Situ Hybridization
Request a detailed protocolRNA sense and anti-sense probes were synthesized from pcsDest2-gdf6a and pcsDest2-gdf6b constructs using DIG RNA Labeling Kit (Roche) per the manufacturer’s instruction. Wild-type embryos of the appropriate stage were fixed in 4% PFA at 4°C for 24 hr. Following fixation, embryos were dehydrated in methanol at stored at −20°C. Whole mount in situ hybridization was performed as previously described (Reichert et al., 2013). Hybridized probes were detected using anti-digoxigenin (DIG) antibodies tagged with alkaline-phosphatase (AP) (Roche) using NBT/BCIP (Roche) solution per the manufacturer’s instructions. Stained embryos were mounted in 2.5% methylcellulose and imaged using a Leica M165FC microscope and Leica DFC400 camera. Specificity of the probes was verified using sense probes synthesized from the same construct.
EdU incorporation
Request a detailed protocolEmbryos were dechorionated at the desired time and thoroughly washed in embryo media. Embryos were transferred to 1 mM EdU (Invitrogen), 10% DMSO in embryo media and incubated on ice for 1 hr, then incubated at 28.5°C for 1 hr until the desired stage was reached. Embryos were washed thoroughly in fresh embryo media and fixed in 4% PFA for 2 hr. Following fixation, embryos were permeabilized by washing with 1% DMSO, 1% Triton X-100 in PBS for 1 hr. The EdU reaction mix was prepared per the manufacturer’s instructions. Embryos were then transferred to the reaction mix and incubated in the dark for 1 hr at room temperature. Following the reaction, embryos were washed in PBST and mounted for imaging. Cells were counted and data were analyzed using Microsoft Excel and GraphPad Prism 7.
Immunofluorescence
Request a detailed protocolEmbryos were fixed at the desired time or following drug treatment in 4% PFA for 24 hr at 4°C. Whole mount immunofluorescence was performed as previously described (Venkatesan et al., 2018). Primary antibodies used were pSMAD-1/5/8 (1:100 dilution) (Cell Signal Technologies), HuC/D (1:100 dilution) (Sigma), mitfa (1:100 dilution) (Venkatesan et al., 2018). AlexaFluor-488 (Invitrogen) and AlexaFluor-555 (Invitrogen) conjugated secondary antibodies were used to detect primary antibody signaling. Nuclei were counterstained with DAPI. Following staining, animals were dissected to remove yolk sack and flat mounted laterally on slides using VectaShield mounting medium. Fluorescent images were taken using a Leica DM5500 microscope with a Leica DFC365FX camera, and a Zeiss Axiovert 200 microscope outfitted with a Yokogawa spinning disk confocal scanner. Cells and structures were counted, and data was analyzed using Microsoft Excel and GraphPad Prism 7.
Flow cytometry and Fluorescence Activated Cell Sorting (FACS)
Request a detailed protocolEmbryos were treated and matured to appropriate age as per drug treatment protocol described above. At a desired timepoint, embryos were washed in PBS and transferred to 500 µL of PBS + 5% FBS (FACS buffer). Embryos were mechanically dissociated in FACS buffer using a mortar and pestle. Dissociated embryos were washed with FACS buffer and filtered through a 40 µm mesh membrane. Samples were analyzed using a BD FACS Aria II flow cytometer and sorted directly into Trizol LS (Life Technologies) for RNA isolation. Flow cytometry data was analyzed using FlowJo software (Becton, Dickinson and Company) and GraphPad Prism 7.
Quantitative Real-Time PCR (qRT-PCR)
Request a detailed protocolOligos used for qRT-PCR primers are listed in Key Reagents section. RNA was isolated from FACS-sorted cells or whole embryos using Trizol reagent (Life Technologies) and purified using the RNeasy kit (Quiagen) per manufacturer’s protocol. cDNA was synthesized from purified RNA using the SuperScript III First Strand Synthesis kit (Thermo Fisher). Reaction mixes were assembled with SYBR Green RT-PCR master mix (Thermo Fisher), primers, and 25 ng cDNA, and analyzed using a StepOnePlus Real Time PCR System (Applied Biosystems). All samples were normalized to β-actin, unless otherwise noted, and fold changes were calculated using the ΔΔCt method using Microsoft Excel and GraphPad Prism 7.
Imaging and quantification
Request a detailed protocolZebrafish adults and embryos were treated with 1 mg/mL epinephrine to contract melanosomes prior to imaging unless otherwise noted. Fish were anesthetized in 0.17% Tricaine in embryo media and positioned in 2.5% methylcellulose in embryo media for imaging. Images of adult fish were captured with a Nikon D90 DSLR camera. Brightfield and incident light images of embryos were captured with Leica M165FC microscope and Leica DFC400 camera. Fluorescent images of embryos were captured with a Leica DM5500 upright microscope with a Leica DFC365FX camera, and a Zeiss Axiovert 200 microscope outfitted with a Yokogawa spinning disk confocal scanner. Images were processed using ImageJ and Leica LAS X software. Cells were counted and analyses were performed using Microsoft Excel and GraphPad Prism 7. Statistical calculations were performed using GraphPad Prism seven as described in each Figure legend.
Statistical analysis
Request a detailed protocolStatistical analyses were performing using GraphPad Prism seven software package. Statistical significance of experiments was calculated using Student’s t-test, ratio-paired t-test, Fisher’s exact test with Bonferroni’s correction, 1-way ANOVA with Tukey’s multiple comparison test as described in each figure legend. Statistical significance was denoted as follows: not significant (ns) p>0.05, *p<0.05, **p<0.01, ***p<0.001 and ****p<0.0001.
Data availability
All data generated or analyzed during this study are included in the manuscript and supporting files. Source data files have been provided for all figures and supplements.
References
-
Mitf regulation of Dia1 controls melanoma proliferation and invasivenessGenes & Development 20:3426–3439.https://doi.org/10.1101/gad.406406
-
Automated identification of conserved synteny after whole-genome duplicationGenome Research 19:1497–1505.https://doi.org/10.1101/gr.090480.108
-
Zebrafish colourless encodes sox10 and specifies non-ectomesenchymal neural crest fatesDevelopment 128:4113–4125.
-
Zebrafish leucocyte tyrosine kinase controls iridophore establishment, proliferation and survivalPigment Cell & Melanoma Research 29:284–296.https://doi.org/10.1111/pcmr.12454
-
Eye and neural defects associated with loss of GDF6BMC Developmental Biology 6:43.https://doi.org/10.1186/1471-213X-6-43
-
Cancer stem cells versus phenotype-switching in melanomaPigment Cell & Melanoma Research 23:746–759.https://doi.org/10.1111/j.1755-148X.2010.00757.x
-
Wnt and BMP signaling govern lineage segregation of melanocytes in the avian embryoDevelopmental Biology 233:22–37.https://doi.org/10.1006/dbio.2001.0222
-
BMP signaling and early embryonic patterningCytokine & Growth Factor Reviews 16:265–278.https://doi.org/10.1016/j.cytogfr.2005.04.002
-
The Tol2kit: a multisite gateway-based construction kit for Tol2 transposon transgenesis constructsDevelopmental Dynamics 236:3088–3099.https://doi.org/10.1002/dvdy.21343
-
Reiterated wnt signaling during zebrafish neural crest developmentDevelopment 131:1299–1308.https://doi.org/10.1242/dev.01007
-
Nacre encodes a zebrafish microphthalmia-related protein that regulates neural-crest-derived pigment cell fateDevelopment 126:3757.
-
Zebrafish Foxd3 is required for development of a subset of neural crest derivativesDevelopmental Biology 290:92–104.https://doi.org/10.1016/j.ydbio.2005.11.014
-
Developmental pathways activated in melanocytes and melanomaArchives of Biochemistry and Biophysics 563:13–21.https://doi.org/10.1016/j.abb.2014.07.023
-
Zebrafish dorsal root ganglia neural precursor cells adopt a glial fate in the absence of neurogenin1Journal of Neuroscience 28:12558–12569.https://doi.org/10.1523/JNEUROSCI.2079-08.2008
-
ChIP-seq reveals cell type-specific binding patterns of BMP-specific smads and a novel binding motifNucleic Acids Research 39:8712–8727.https://doi.org/10.1093/nar/gkr572
-
Conservation of BMP signaling in zebrafish mesoderm patterningMechanisms of Development 61:75–88.https://doi.org/10.1016/S0925-4773(96)00625-9
-
Dual roles of smad proteins in the conversion from myoblasts to osteoblastic cells by bone morphogenetic proteinsJournal of Biological Chemistry 285:15577–15586.https://doi.org/10.1074/jbc.M109.028019
-
Pax7 is required for establishment of the xanthophore lineage in zebrafish embryosMolecular Biology of the Cell 27:1853–1862.https://doi.org/10.1091/mbc.e15-12-0821
-
Reprogramming to developmental plasticity in Cancer stem cellsDevelopmental Biology 430:266–274.https://doi.org/10.1016/j.ydbio.2017.07.025
-
An orthologue of the kit-related gene fms is required for development of neural crest-derived xanthophores and a subpopulation of adult melanocytes in the zebrafish, Danio rerioDevelopment 127:3031–3044.
-
Origins of adult pigmentation: diversity in pigment stem cell lineages and implications for pattern evolutionPigment Cell & Melanoma Research 28:31–50.https://doi.org/10.1111/pcmr.12332
-
The pathology of tumors, part III: grading, staging & classificationCA: A Cancer Journal for Clinicians 29:66–77.https://doi.org/10.3322/canjclin.29.2.66
-
Ancient evolutionary origin of the neural crest gene regulatory networkDevelopmental Cell 13:405–420.https://doi.org/10.1016/j.devcel.2007.08.005
-
Fiji: an open-source platform for biological-image analysisNature Methods 9:676–682.https://doi.org/10.1038/nmeth.2019
-
Ligand-activated BMP signaling inhibits cell differentiation and death to promote melanomaJournal of Clinical Investigation 128:294–308.https://doi.org/10.1172/JCI92513
-
Gateway compatible vectors for analysis of gene function in the zebrafishDevelopmental Dynamics 236:3077–3087.https://doi.org/10.1002/dvdy.21354
-
BookThe Zebrafish Book: A Guide for the Laboratory Use of ZebrafishBrachydanio rerio: University of Oregon Press.
Article and author information
Author details
Funding
Melanoma Research Foundation
- Alec K Gramann
National Cancer Institute (1F31CA239478-01)
- Alec K Gramann
National Center for Advancing Translational Sciences (UL1-TR001453)
- Alec K Gramann
Congressionally Directed Medical Research Programs (W8IXWH-13-0107)
- Craig J Ceol
National Institute of Arthritis and Musculoskeletal and Skin Diseases (R01AR063850)
- Craig J Ceol
Sidney Kimmel Foundation for Cancer Research (SKF-13-123)
- Craig J Ceol
The funders had no role in study design, data collection and interpretation, or the decision to submit the work for publication.
Acknowledgements
We thank Nathan Lawson for the pcsDest2 plasmid; David Kimelman for the dnBMPR plasmid; Takenobu Katagiri for the SMAD1-DVD plasmid; Christian Mossiman for the Tg(ubi:switch) zebrafish strain and CreERT2 plasmid; Charles Kaufmann for Tg(crestin:eGFP) and Tg(crestin:mCherry) zebrafish strains; Thomas Look for the foxd3(zdf10) zebrafish strain; Patrick White, Ed Jaskolski and the staff at the UMMS Animal Medicine Department for fish care; Tammy Krumpoch for guidance and assistance in performing flow cytometry and FACS experiments. AKG was supported by a Melanoma Research Foundation Looney Legacy Foundation Medical Student Award, Center for Translational Sciences TL1 Training Fellowship through the UMMS CCTS (UL1-TR001453), NCI NRSA F31 Predoctoral Fellowship (1F31CA239478-01). Research was supported by a Kimmel Scholar Award (SKF-13–123), Department of Defense Peer Reviewed Cancer Research Program Career Development Award (W8IXWH-13–0107) and NIH National Institute of Arthritis and Musculoskeletal and Skin Diseases grant (R01AR063850) to CJC. The content is solely the responsibility of the authors and does not necessarily represent the official views of the Department of Defense or NIH.
Ethics
Animal experimentation: This study was performed in strict accordance with the recommendations in the Guide for the Care and Use of Laboratory Animals of the National Institutes of Health. Zebrafish were handled in accordance with protocols approved by the University of Massachusetts Medical School IACUC protocol (A-2171-19). For procedures, including imaging and genotyping, animals were anesthetized in 0.17% tricaine or euthanized by overdose of tricaine. Every effort was made to minimize suffering.
Copyright
© 2019, Gramann et al.
This article is distributed under the terms of the Creative Commons Attribution License, which permits unrestricted use and redistribution provided that the original author and source are credited.
Metrics
-
- 2,862
- views
-
- 403
- downloads
-
- 30
- citations
Views, downloads and citations are aggregated across all versions of this paper published by eLife.
Citations by DOI
-
- 30
- citations for umbrella DOI https://doi.org/10.7554/eLife.50047
Download links
A two-part list of links to download the article, or parts of the article, in various formats.
Downloads (link to download the article as PDF)
Open citations (links to open the citations from this article in various online reference manager services)
Cite this article (links to download the citations from this article in formats compatible with various reference manager tools)
Regulation of zebrafish melanocyte development by ligand-dependent BMP signaling
eLife 8:e50047.
https://doi.org/10.7554/eLife.50047


