Cholesterol accessibility at the ciliary membrane controls hedgehog signaling
- Stanford University School of Medicine, United States
- University of Texas Southwestern Medical Center, United States
- Washington University School of Medicine, United States
- University of Oxford, United Kingdom
Figures
Figure 1
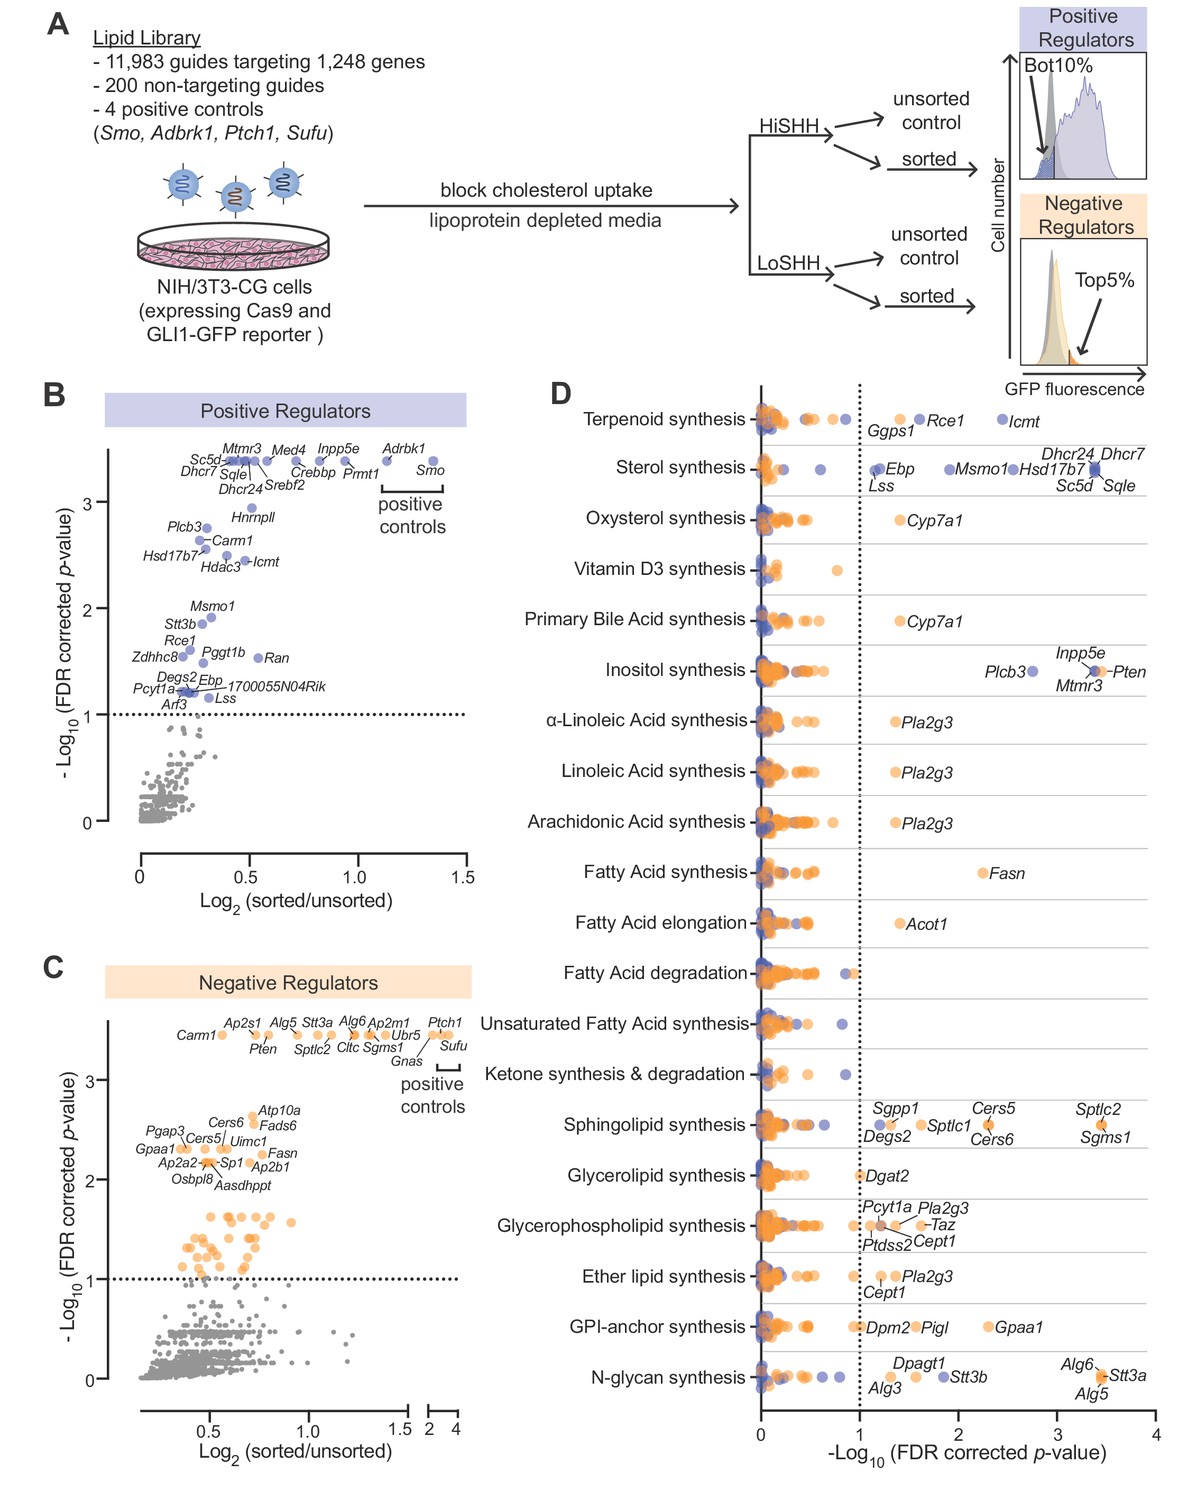
CRISPR screens identify lipid-related genes that influence hedgehog signaling.
(A) Flowchart summarizing the screening strategy. Screens for positive and negative regulators used a high, saturating concentration of SHH (HiSHH, 25 nM) or a low concentration of SHH (LoSHH, 3.2 nM), respectively. (B and C) Volcano plots of the HiSHH-Bot10% (B) screen for positive regulators and the LoSHH-Top5% (C) screen for negative regulators. Enrichment is calculated as the mean of all sgRNAs for a given gene in the sorted over unsorted population, with the y-axis showing significance based on the false discovery rate (FDR)-corrected p-value. (D) Screen results analyzed by grouping genes based on the core lipid biosynthetic pathways in KEGG. In all panels, genes identified as positive and negative regulators are labeled in blue and orange respectively. See Supplementary file 4 for the full analysis.
Figure 2 with 1 supplement
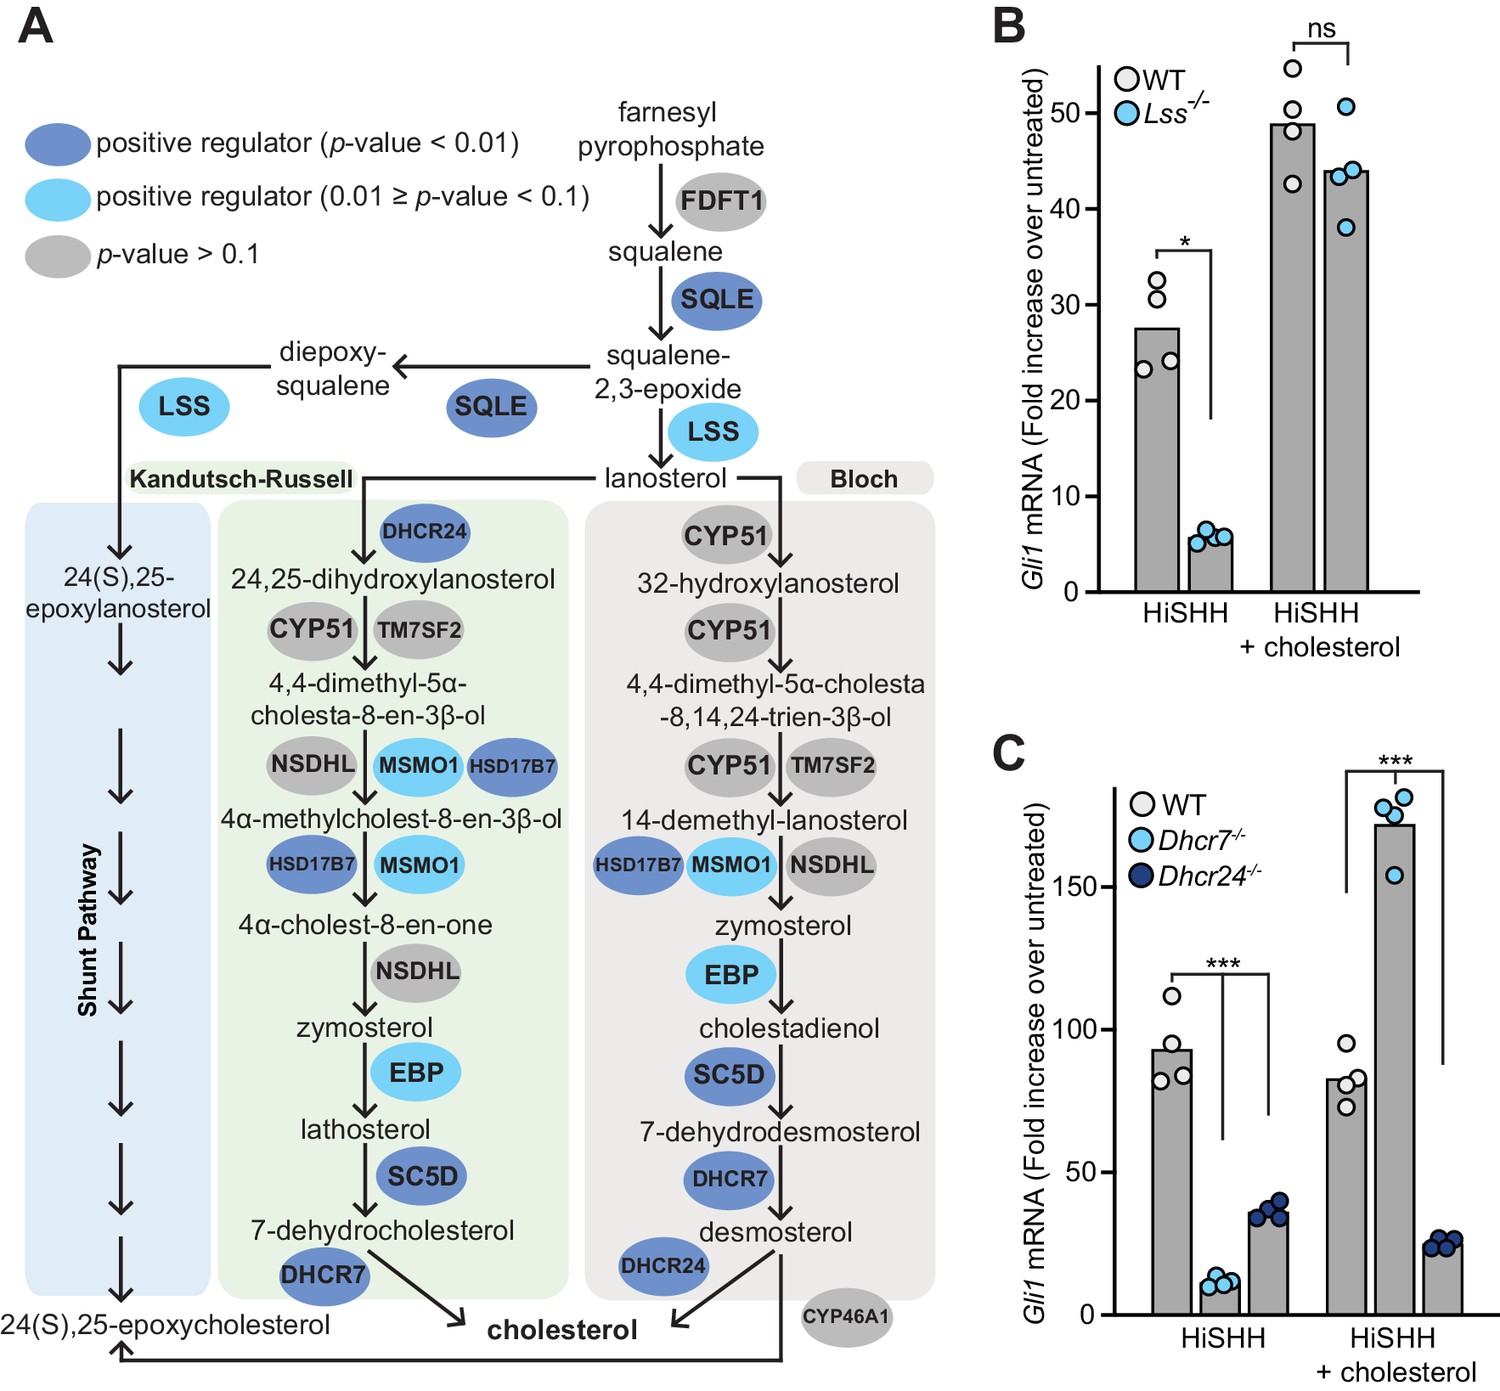
Enzymes that generate cholesterol positively regulate hedgehog signaling.
(A) The post-squalene portion of the cholesterol biosynthetic pathway, with enzymes colored according to their FDR corrected p-value in our CRISPR screens (see Supplementary files 2 and 3). Two branches of the pathway (the Kandutsch-Russell and the Bloch pathways) produce cholesterol, while a third shunt pathway produces 24(S),25-epoxycholesterol. DHCR24 is the only enzyme that is required for cholesterol biosynthesis, but dispensable for 24(S), 25-epoxycholesterol synthesis. (B and C) HH signaling strength in Lss-/-, Dhcr7-/- and Dhcr24-/- NIH/3T3 cells was assessed by measuring Gli1 mRNA by quantitative reverse transcription PCR (qRT-PCR) after treatment with either HiSHH (25 nM) or HiSHH combined with 0.3 mM cholesterol:MβCD complexes. Bars denote the mean value derived from the four individual measurements shown. Statistical significance was determined by the Mann-Whitney test (B, p-value for HiSHH treatment = 0.0286, p-value for HiSHH + cholesterol treatment = 0.4857) or the Kruskal-Wallis test (C, p-value for HiSHH treatment = 0.0002, p-value for HiSHH + cholesterol treatment = 0.0002).
Figure 2—figure supplement 1
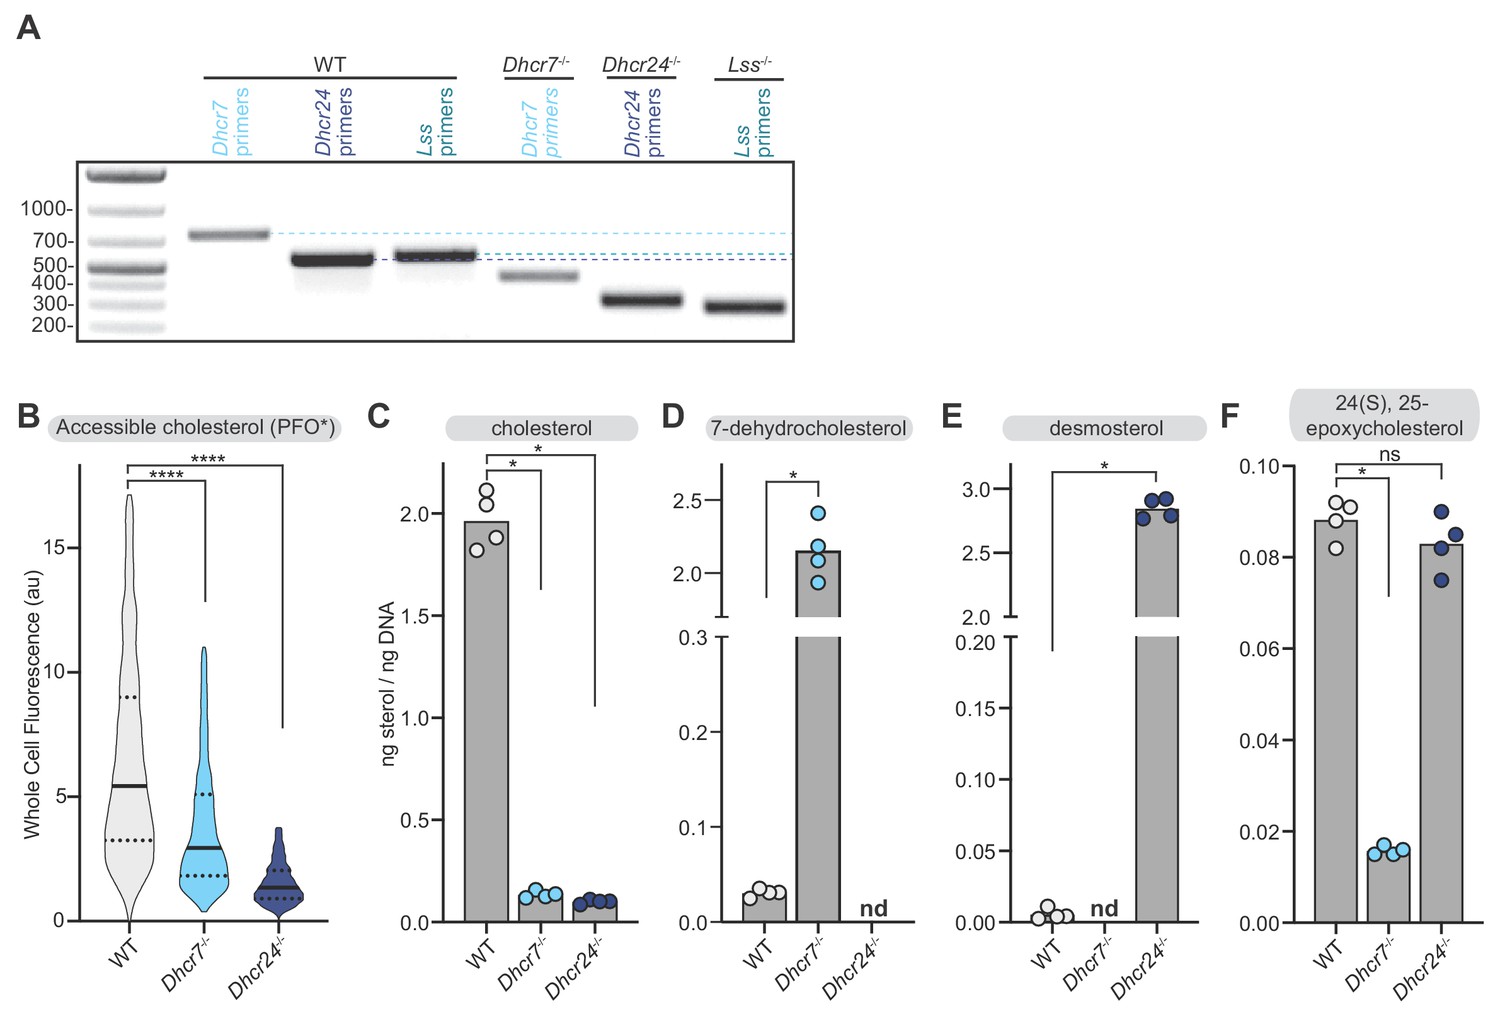
Abundance of sterols in Dhcr7-/- and Dhcr24-/- cells.
(A) Agarose gel electrophoresis showing amplification of relevant genomic DNA regions using primers that flank the two-guide CRISPR edits in the Dhcr7-/-, Dhcr24-/- and Lss-/- cell lines. A downward shift in the amplified band relative to the WT cell lines indicates successful editing. (B) Flow cytometry analysis (n > 4500 cells for each cell line) was used to measure staining of the plasma membrane by PFO*, a protein probe that binds accessible cholesterol (see Figure 5A and associated discussion). (C–F) Measurement of the indicated sterols in whole cell extracts by mass spectrometry (nd = not detected). Sterol measurements were normalized to a matched measurement of genomic DNA content in each sample to correct for differences in cell number (see Materials and methods). Each data point represents an independent plating of the indicated cell line (n = 4) and the height of the bar denotes the mean. Statistical significance in B-F was determined by the Mann-Whitney test; p-values are: (B) p-value<0.0001 (both comparisons), (C) p-value=0.0286 (both comparisons), (D) p-value=0.0286, (E) p-value=0.0286, and (F) WT vs Dhcr7-/-p value=0.0286; WT vs Dhcr24-/-p value=0.2.
Figure 3 with 1 supplement
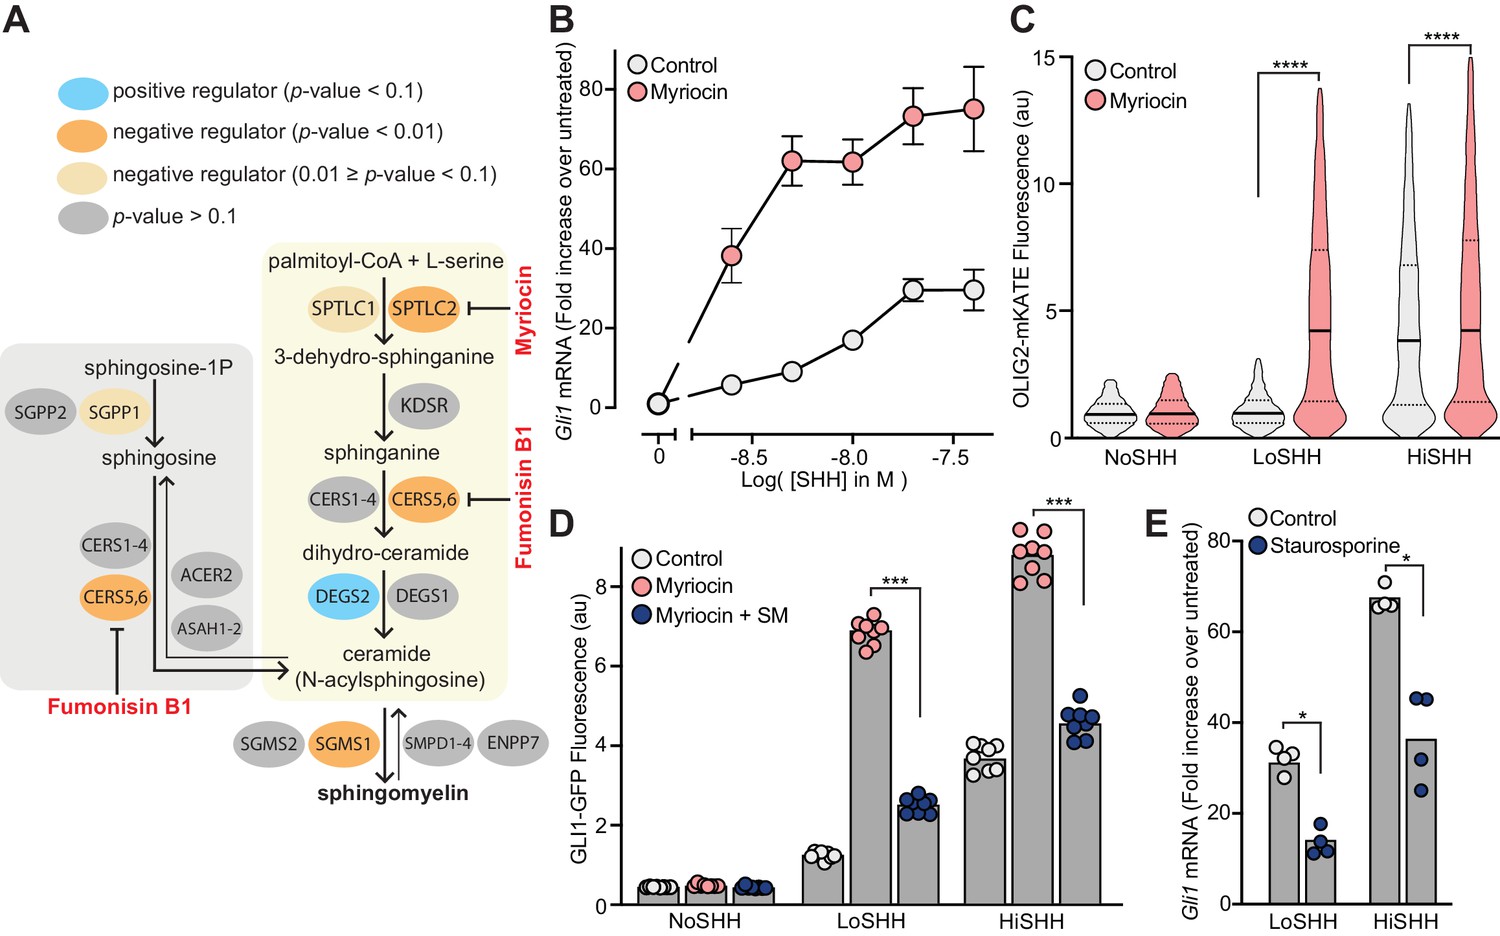
Enzymes that generate sphingomyelin negatively regulate hedgehog signaling.
(A) The pathway for the synthesis of SM, with enzymes colored according to their FDR corrected p-value in our CRISPR screens. Steps in the pathway blocked by myriocin and fumonisin B1 are denoted in red. (B) A dose-response curve for SHH in myriocin-treated NIH/3T3 cells compared to control cells treated with vehicle (DMSO) alone. Error bars represent the standard error of the mean from four replicates. (C) Differentiation of spinal Neuronal Precursor Cells (NPCs) into OLIG2-positive motor neuron progenitors exposed to either LoSHH (5 nM) or HiSHH (25 nM) was assessed using flow cytometry to measure the fluorescence of a OLIG2-mKate reporter (n > 5000 cells for each treatment). (D) HH signaling strength in NIH/3T3-CG reporter cells treated with LoSHH (5 nM) or HiSHH (50 nM) after treatment with myriocin alone or myriocin followed by addition of exogenous egg SM. Each data point represents the mean GLI1-GFP fluorescence from 250 cells in two independent experiments. (E) HH signaling strength measured in NIH/3T3 cells treated with either LoSHH (5 nM) or HiSHH (25 nM) in the presence or absence of 50 nM staurosporine to increase SM. Bars denote the mean value derived from the four individual measurements shown. Statistical significance was determined by the Mann-Whitney test (C, D and E); p-values are: (C) p-value<0.0001 (both comparisons), (D) p-value=0.0002 (both comparisons), and (E) p-value=0.0286 (both comparisons).
Figure 3—figure supplement 1
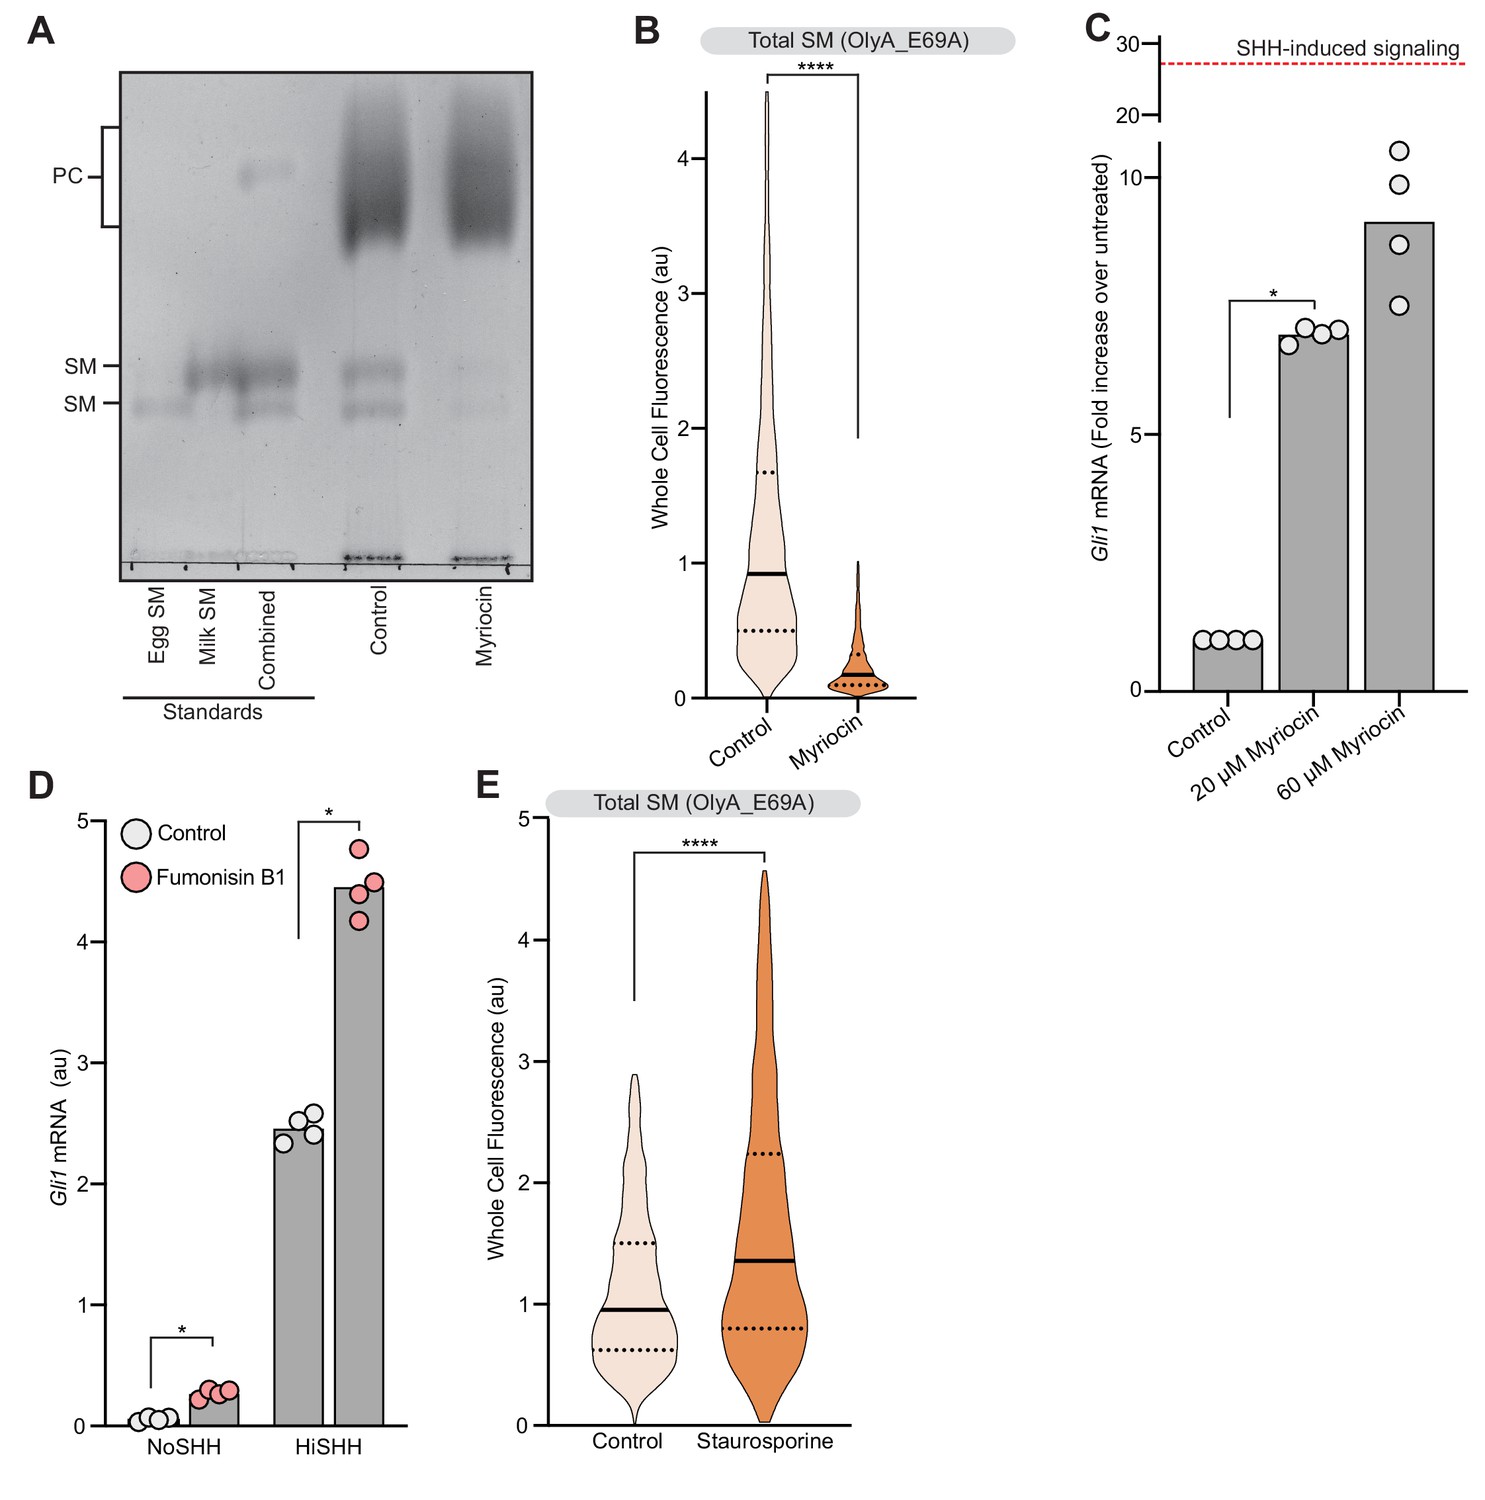
Analysis of sphingomyelin levels and their effect on hedgehog signaling.
(A) Thin Layer Chromatography was used to measure SM and phosphatidylcholine (PC) levels in cells treated with myriocin. Purified egg and milk sphingomyelin were used as standards. (B) Flow cytometry was used to measure plasma membrane OlyA_E69A staining in intact NIH/3T3 cells after myriocin treatment (n > 4000 cells per treatment). (C) HH signaling triggered by myriocin alone in Smo-/- MEFs stably expressing wild-type SMO. Dotted red line indicates the magnitude of Gli1 mRNA induced by HiSHH (50 nM) treatment. (D) HH signaling triggered by fumonisin B1 (40 µM) in the presence or absence of HiSHH (25 nM) in NIH/3T3 cells. (E) Flow cytometry was used to measure plasma membrane OlyA_E69A staining in intact NIH/3T3 cells after staurosporine treatment (50 nM) (n > 4000 cells per treatment). In (C) and (D), bars denote the mean value derived from the four individual measurements shown. Statistical significance was determined by the Mann-Whitney test (B–E); p-values are: (B) p-value<0.0001, (C) p-value=0.0286, (D) p-value=0.0286 (both comparisons), and (E) p-value<0.0001.
Figure 4 with 1 supplement
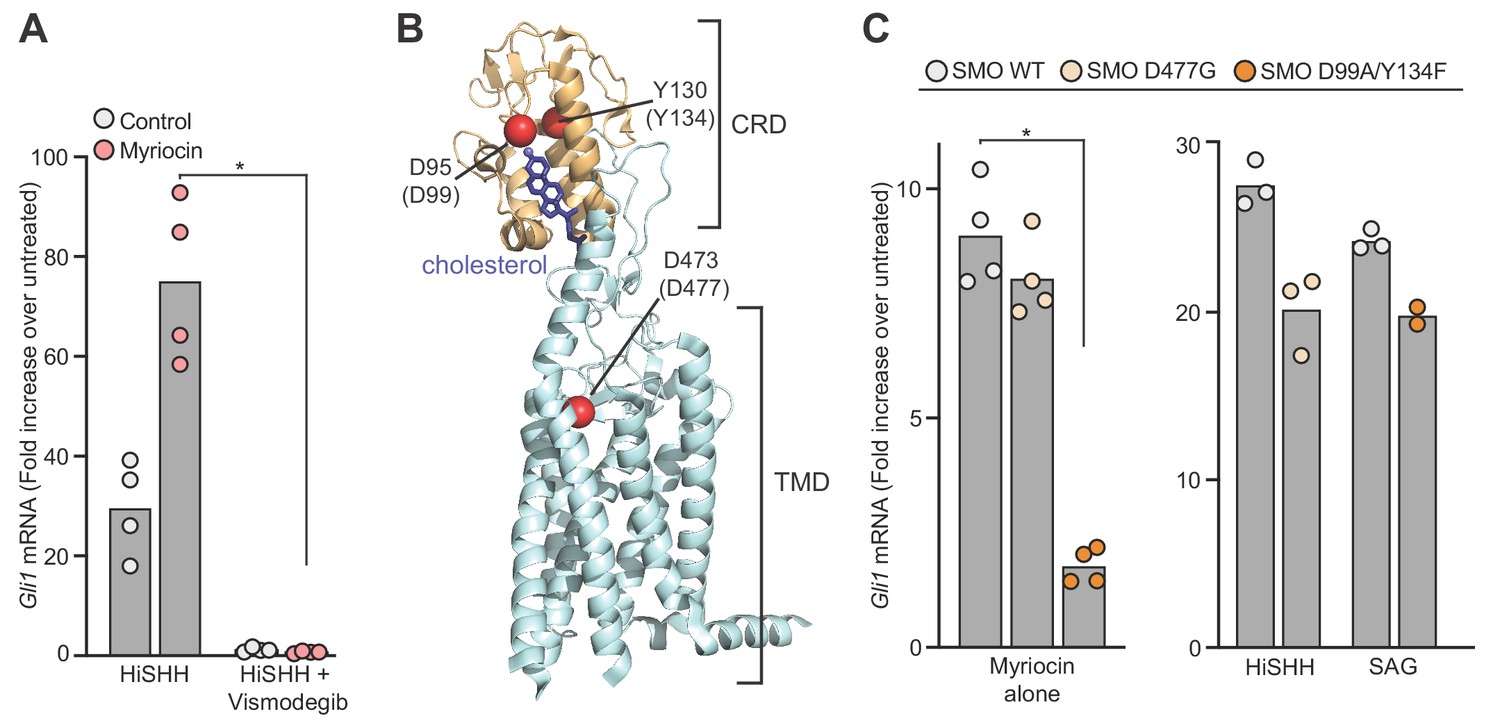
Sphingomyelin depletion potentiates hedgehog signaling at the level of Smoothened.
(A) HH signaling triggered by HiSHH (25 nM) in the presence or absence of Vismodegib (2.5 µM) in NIH/3T3 cells treated with myriocin. (B) Human SMO in complex with cholesterol (PDB 5L7D) highlighting two residues in the CRD (D95 and Y130) critical for cholesterol binding and a residue (D473) in the transmembrane domain (TMD) critical for binding to the agonist SAG. Numbering for mouse SMO, used in our studies, is denoted in parenthesis. (C) HH signaling triggered by myriocin alone in Smo-/- MEFs stably expressing the indicated variants of mouse SMO. A control experiment (right) shows that the SMO variants respond appropriately to either SAG (100 nM) or SHH (50 nM), demonstrating protein integrity. Note that the D477G and D99A/Y134F mutations abrogate responses to SAG and SHH, respectively (Luchetti et al., 2016). In (A) and (C), bars denote the mean value derived from the measurements shown (n = 4 for A, n = 2–4 in C). Statistical significance (p-value=0.0286 for both A and C) was determined by the Mann-Whitney test.
Figure 4—figure supplement 1
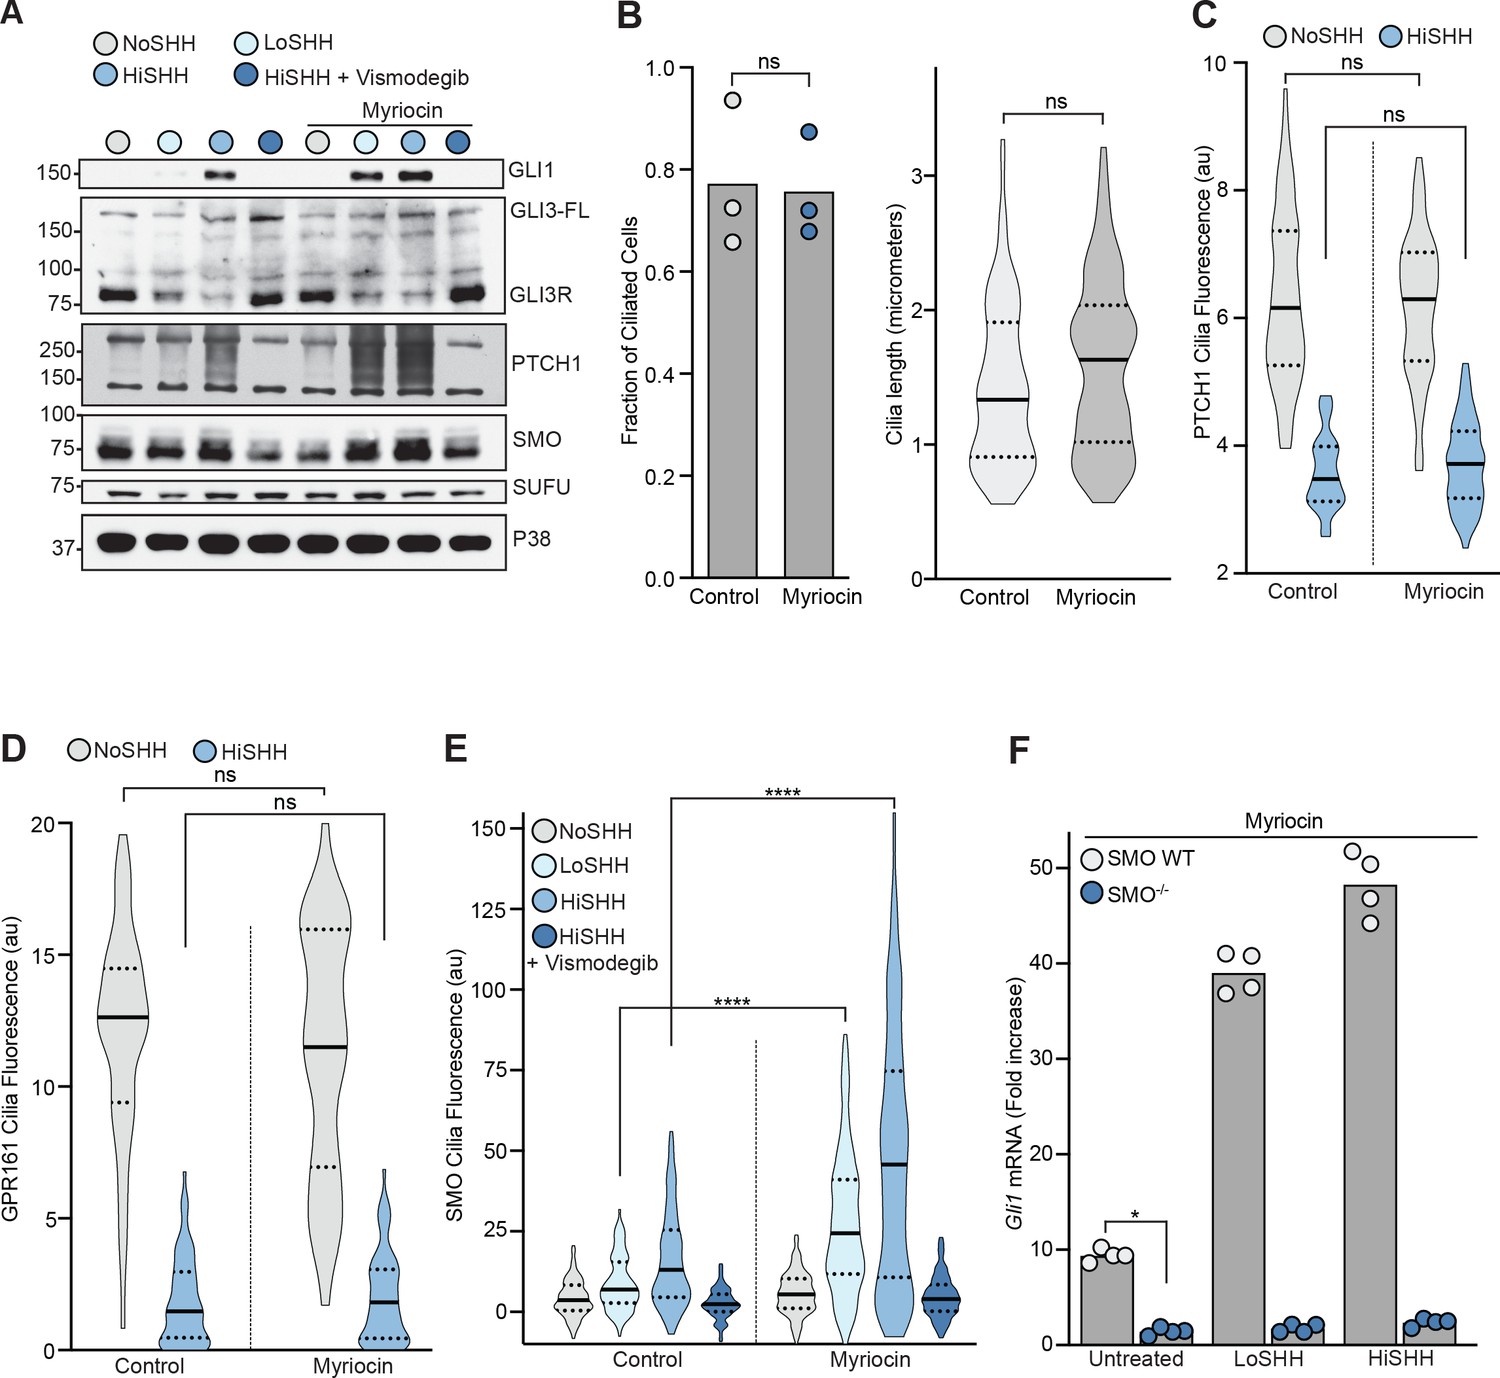
The effect of myriocin treatment on the abundances of hedgehog pathway components and on ciliary protein trafficking.
(A) Western Blot showing levels of HH signaling proteins (SMO, SUFU and GLI3-FL/GLI3R) and HH target genes (GLI1 and PTCH1) after treatment with myriocin and either LoSHH (2.5 nM), HiSHH (25 nM) or HiSHH with Vismodegib (2.5 µM). (B) Ciliation frequency (left) of cells after myriocin treatment, calculated as the number of cilia over the number of nuclei. Each point represents the ciliation frequency (derived from >30 cells) in a different imaging field. The cilia length distribution (from 100 cells) is shown on the right. (C and D) Violin plots showing the lack of an effect of myriocin on levels of PTCH1 (C, n > 50 cilia per condition) or GPR161-YFP (D, n > 35 cilia per condition) at cilia by quantitative fluorescence microscopy in the absence or presence of HiSHH (25 nM). (E) Violin plots showing the SHH-induced ciliary accumulation of endogenous SMO in the presence and absence of myriocin (n > 100 cilia per condition, SHH concentrations as in A). (F) HH signaling triggered by myriocin alone or myriocin in combination with LoSHH (5 nM) or HiSHH (50 nM) in Smo-/- MEFs or Smo-/- MEFs stably expressing wild-type SMO. Bars denote the mean value derived from the four individual measurements shown. Statistical significance was determined by the Mann-Whitney test (B–F); p-values are: (B) p-value>0.9999 for fraction of ciliated cells and p-value=0.0603 for cilia length, (C) p-value=0.7581 for NoSHH and p-value=0.7801 for HiSHH, (D) p-value=0.5469 for NoSHH and p-value=0.5604 for HiSHH, (E) p-value<0.0001 (both comparisons), and (F) p-value=0.0286.
Figure 5
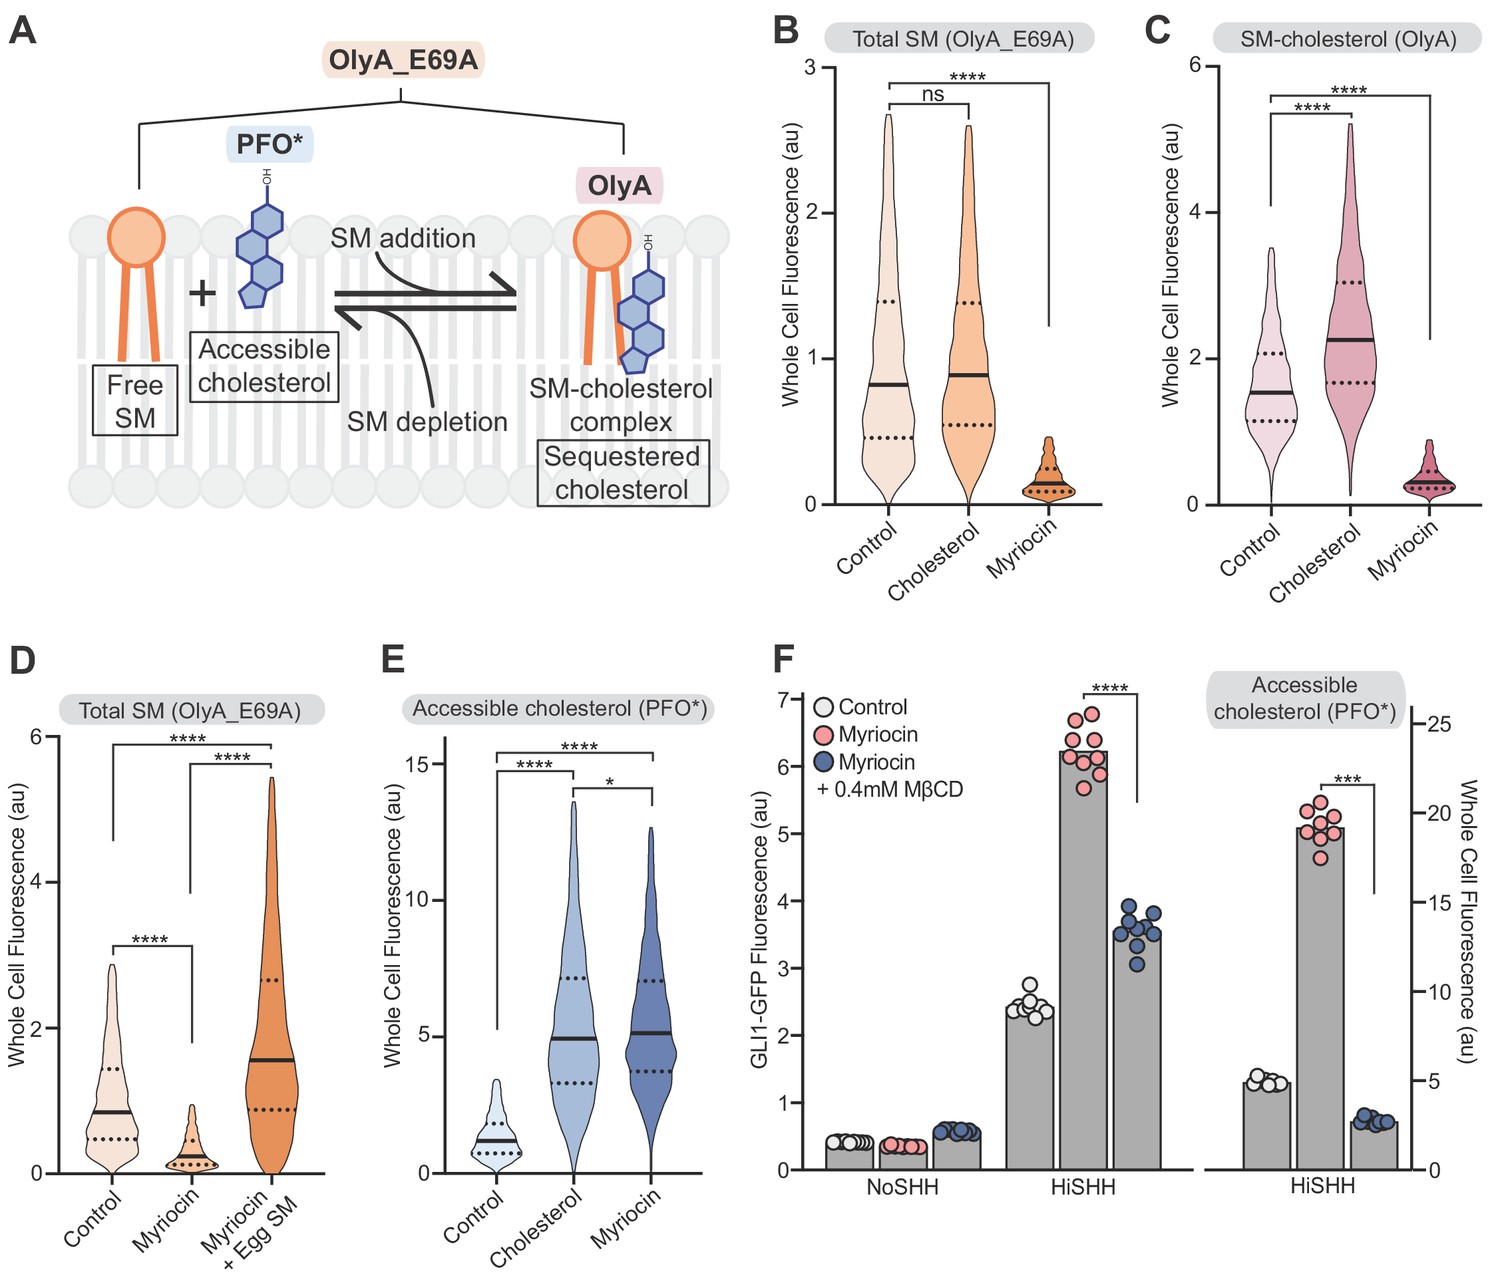
Reducing accessible cholesterol in myriocin-treated cells impairs hedgehog signaling.
(A) Cholesterol and SM form SM-cholesterol complexes in which cholesterol is sequestered and prevented from interacting with proteins like SMO. The ratio of SM to cholesterol determines the level of accessible cholesterol (free from SM). Protein probes detecting the various pools of cholesterol and SM are shown: PFO* binds to accessible cholesterol, OlyA to SM-cholesterol complexes and OlyA_E69A to both free SM and SM-cholesterol complexes. (B–E) Flow cytometry of intact cells stained with fluorescently-labeled OlyA_E69A (B and D), OlyA (C) or PFO* (E) after the indicated treatments (n > 4000 cells for each condition). (F) HiSHH-induced (50 nM) GLI1-GFP reporter fluorescence in NIH/3T3-CG cells treated with myriocin alone or myriocin followed by 0.4 mM MβCD to reduce accessible cholesterol levels. The graph on the right shows whole cell fluorescence of cells stained with PFO* to measure accessible cholesterol in the outer leaflet of the plasma membrane. Each data point denotes the mean fluorescence of GLI1-GFP or PFO* staining calculated from ~200 cells from two separate experiments and the bars denote the mean value. Statistical significance was determined by the Mann-Whitney test (B–F); p-values are: (B) p-value=0.9486 for control vs cholesterol treated cells and p-value<0.0001 for control vs myriocin treated cells, (C) p-value<0.0001 (both comparisons), (D) p-value<0.0001 (all comparisons), (E) p-value<0.0001 (control vs cholesterol and control vs myriocin) and p-value=0.0195 for cholesterol vs myriocin, (F) p-value<0.0001 for GLI-GFP fluorescence comparison and p-value=0.0002 for PFO* comparison.
Figure 6

ALOD4 impairs hedgehog signaling by trapping accessible cholesterol.
(A) ALOD4 and MβCD reduce accessible cholesterol by different mechanisms. ALOD4 binds and traps accessible cholesterol in the outer leaflet of plasma membranes of intact cells, without changing total cholesterol abundance. MβCD removes cholesterol from membranes, reducing both accessible and total cholesterol. (B) HH signaling triggered by five hours of LoSHH (5 nM) or HiSHH (30 nM) treatment following pre-treatment of cells with ALOD4 (3 or 9 µM) or MβCD (2 mM) for 1 hr. Bars denote the mean value derived from the four individual measurements shown. (C) Hmgcr mRNA levels measured with qRT-PCR after treatment with the same conditions as in (B). Bars denote the mean value derived from the eight individual measurements shown. (D) Ciliation frequency of cells after ALOD4 treatment (same conditions as in B), calculated as the number of cilia over the number of nuclei. Each point represents the ciliation frequency (derived from >30 cells) in a different imaging field. Statistical significance was determined by the Mann-Whitney test (B–D); p-values are: (B) p-value=0.0286 (all comparisons), (C) p-value=0.0002 for both comparisons, and (D) p-value=0.4857.
Figure 7 with 1 supplement
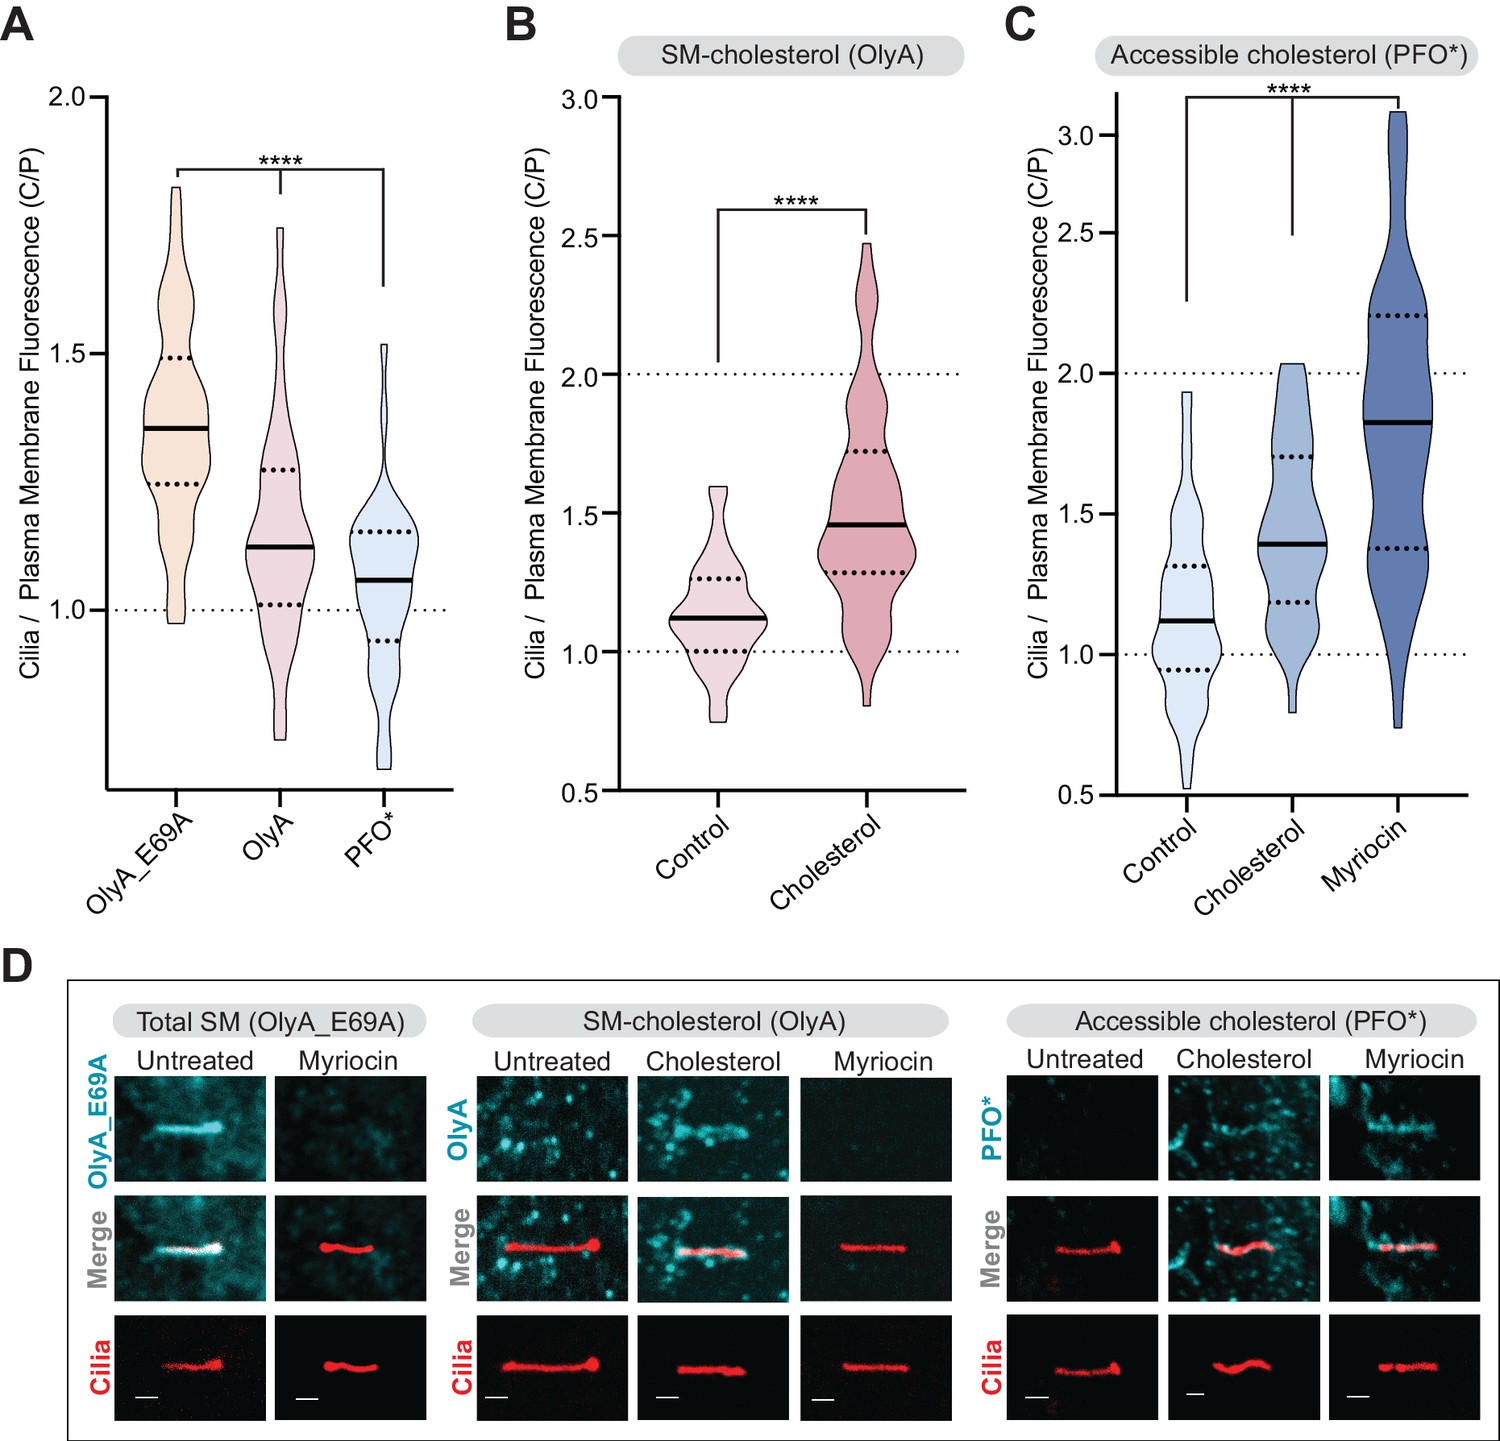
Primary cilia have high sphingomyelin and low accessible cholesterol.
(A–C) Ratio of mean ciliary staining intensity to mean plasma membrane staining intensity (the C/P ratio, see text) for OlyA_E69A, OlyA, or PFO* (see Figure 5A) in NIH/3T3 cells left untreated (A) or treated with either myriocin (80 μM) or cholesterol-MβCD complexes (B and C) (A-C, n > 30 cilia per condition). (D) Representative images of individual primary cilia from cells stained with each of the lipid probes (colored blue) after the indicated treatments. Cells stably expressed ARL13B-GFP (colored red) to allow the identification of cilia. Scale bar: one micron. Statistical significance was determined by the Kruskal-Wallis test (A and C) or the Mann-Whitney test (B); all p-values are <0.0001.
Figure 7—figure supplement 1
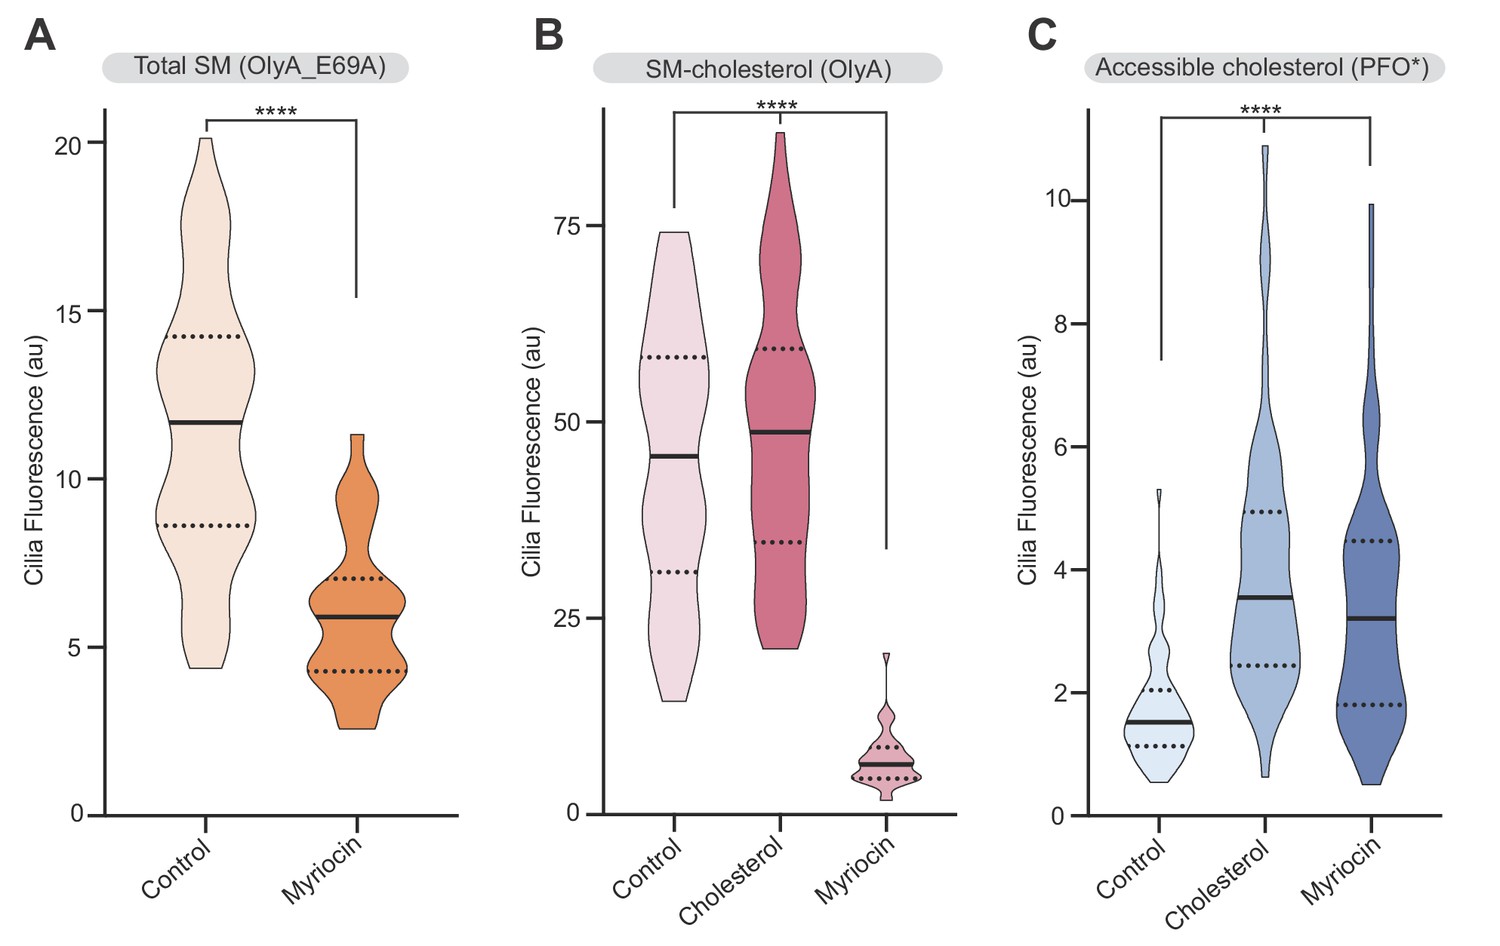
Sphingomyelin depletion increases accessible cholesterol at cilia.
(A–C) Ciliary staining intensity for OlyA_E69A, OlyA or PFO* in NIH/3T3 cells left untreated (A) or treated with either myriocin (80 μM) or cholesterol:MβCD complexes (B and C) (n > 28 cilia). Statistical significance was determined by the Mann-Whitney (A) or the Kruskal-Wallis test (B and C); all p-values are <0.0001.
Figure 8 with 1 supplement
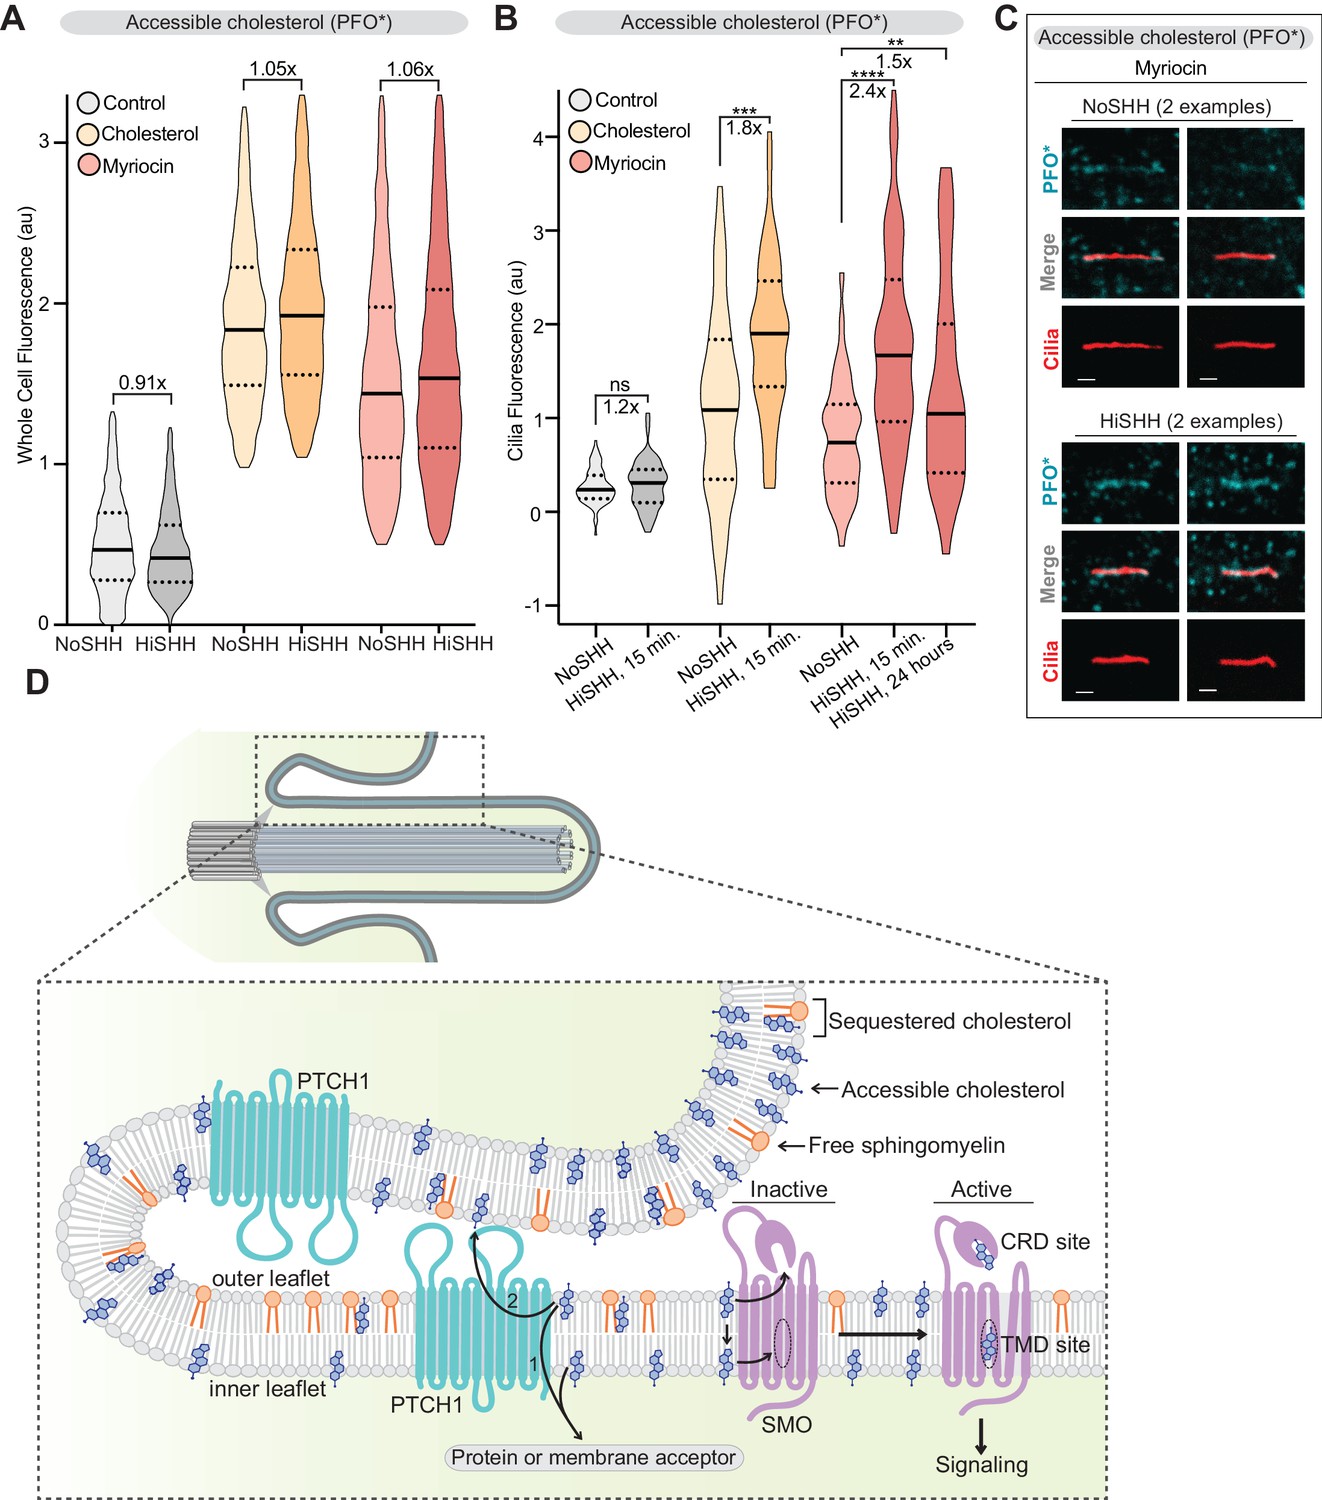
PTCH1 decreases the pool of accessible cholesterol at primary cilia.
(A) Flow cytometry was used to measure plasma membrane PFO* staining in intact cells after HiSHH treatment (n > 4000 cells per violin). Fold changes of median values (SHH treated over untreated) are indicated (A and B). (B) PFO* staining at primary cilia after the addition of HiSHH in cells treated with myriocin (80 μM), cholesterol:MβCD complexes or left untreated (n > 65 cilia per condition). (C) Representative images of primary cilia from cells treated with myriocin with or without the addition of HiSHH. Scale bar: one micron. (D) Model depicting how PTCH1 could inhibit SMO at primary cilia by decreasing accessible cholesterol in the ciliary membrane (see Discussion for details). PTCH1 could transport cholesterol from the ciliary membrane to an intracellular acceptor (1) or to an extracellular acceptor (2). PTCH1 inactivation leads to an increase in accessible cholesterol in both leaflets of the ciliary membrane, leading to SMO activation through the CRD and TMD sterol-binding sites. Statistical significance was determined by the Mann-Whitney test (B); p-values are: NoSHH vs HiSHH p-value=0.5984, cholesterol treated NoSHH vs HiSHH p-value=0.0008, myriocin treated NoSHH vs HiSHH 15 min p-value<0.0001 and 24 hr p-value=0.0277.
Figure 8—figure supplement 1
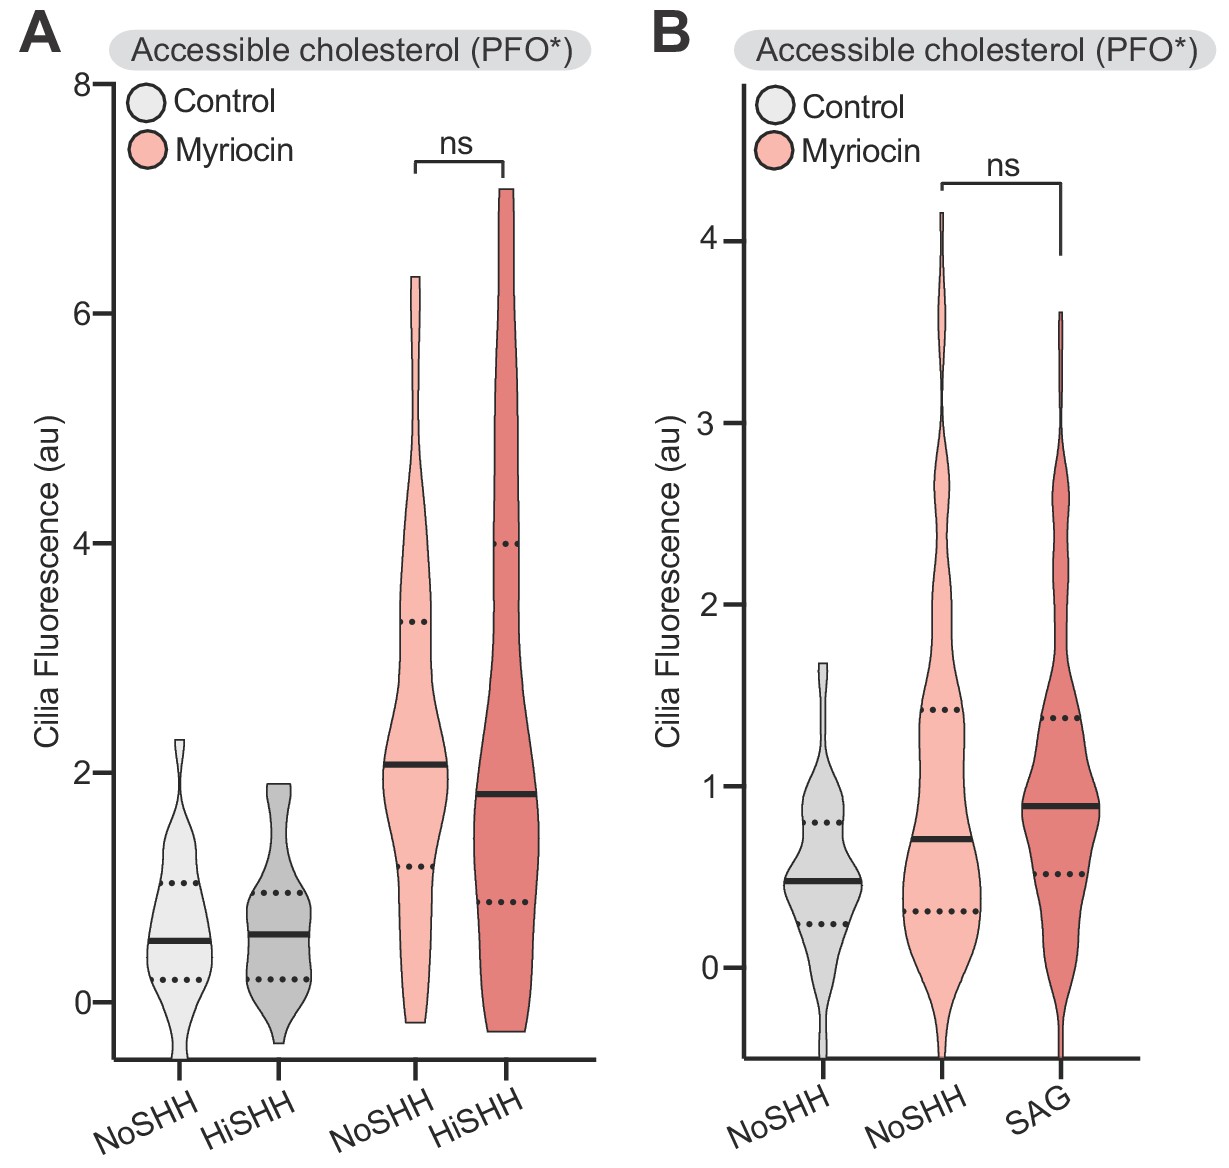
SHH- induced changes in accessible cholesterol levels at cilia are dependent on PTCH1 activity.
(A) PFO* staining at primary cilia in Ptch1-/- MEFs in the presence of HiSHH (50 nM, 15 min) in cells treated with myriocin or left untreated (n > 38 cilia). (B) PFO* staining at primary cilia in the presence of SAG (100 nM, 15 min) in cells treated with myriocin or left untreated (n > 50 cilia). Statistical significance was determined by the Mann-Whitney test (A and B); p-values are: (A) p-value=0.9137 and (B) p-value=0.2087.
Additional files
-
Supplementary file 1
List of genes and sgRNAs in the custom lipid library used for the screens in Figure 1.
The first tab lists all the sgRNAs used in the library and the second tab lists all the lipid-related genes targeted by the library.
- https://doi.org/10.7554/eLife.50051.015
-
Supplementary file 2
Complete tabulated results for the HiSHH-Bottom10% screen shown in Figure 1B.
The first tab contains a description of the columns in the second tab, which contains the scores for each sgRNA output from the MAGeCK algorithm. In the MAGeCK algorithm, gene enrichment or depletion in the sorted population (compared to the unsorted) are denoted as ‘pos’ or ‘neg’ respectively. Genes are listed in rank order according to the MAGeCK criteria.
- https://doi.org/10.7554/eLife.50051.016
-
Supplementary file 3
Complete tabulated results for the LoSHH-Top10% screen shown in Figure 1C.
Organized in a manner identical to Supplementary file 2, but for the LoSHH-Top5% screen.
- https://doi.org/10.7554/eLife.50051.017
-
Supplementary file 4
Compiled lists of lipid pathway genes from the KEGG database used for the analysis in Figure 1D.
The first tab contains lists of genes identified in each lipid biosynthesis pathway found in the KEGG database for Mus musculus. Column A contains a legend used throughout the spreadsheet. For each lipid biosynthesis pathway, the name of the gene is given along with the FDR-corrected p-values from the HiSHH-Bottom10% and LoSHH-Top5% screens and the mRNA expression level in the NIH/3T3 (see Supplementary file 5). The second tab contains the same analysis focused on oxysterol-related genes manually curated from the literature.
- https://doi.org/10.7554/eLife.50051.018
-
Supplementary file 5
Transcriptional profiling of NIH/3T3 cells using RNAseq.
A list of genes from NIH/3T3 cells and their respective mRNA abundances from two independent RNAseq experiments.
- https://doi.org/10.7554/eLife.50051.019
-
Supplementary file 6
Key Resources Table.
This file describes reagents used in this study, including (when available or applicable) the type of reagent, the designation, the source and the catalogue numbers.
- https://doi.org/10.7554/eLife.50051.020
-
Transparent reporting form
- https://doi.org/10.7554/eLife.50051.021
Download links
A two-part list of links to download the article, or parts of the article, in various formats.
Downloads (link to download the article as PDF)
Open citations (links to open the citations from this article in various online reference manager services)
Cite this article (links to download the citations from this article in formats compatible with various reference manager tools)
Cholesterol accessibility at the ciliary membrane controls hedgehog signaling
eLife 8:e50051.
https://doi.org/10.7554/eLife.50051


