Cue-inhibited ventrolateral periaqueductal gray neurons signal fear output and threat probability in male rats
- Boston College, United States
- Medical University of South Carolina, United States
Figures
Figure 1
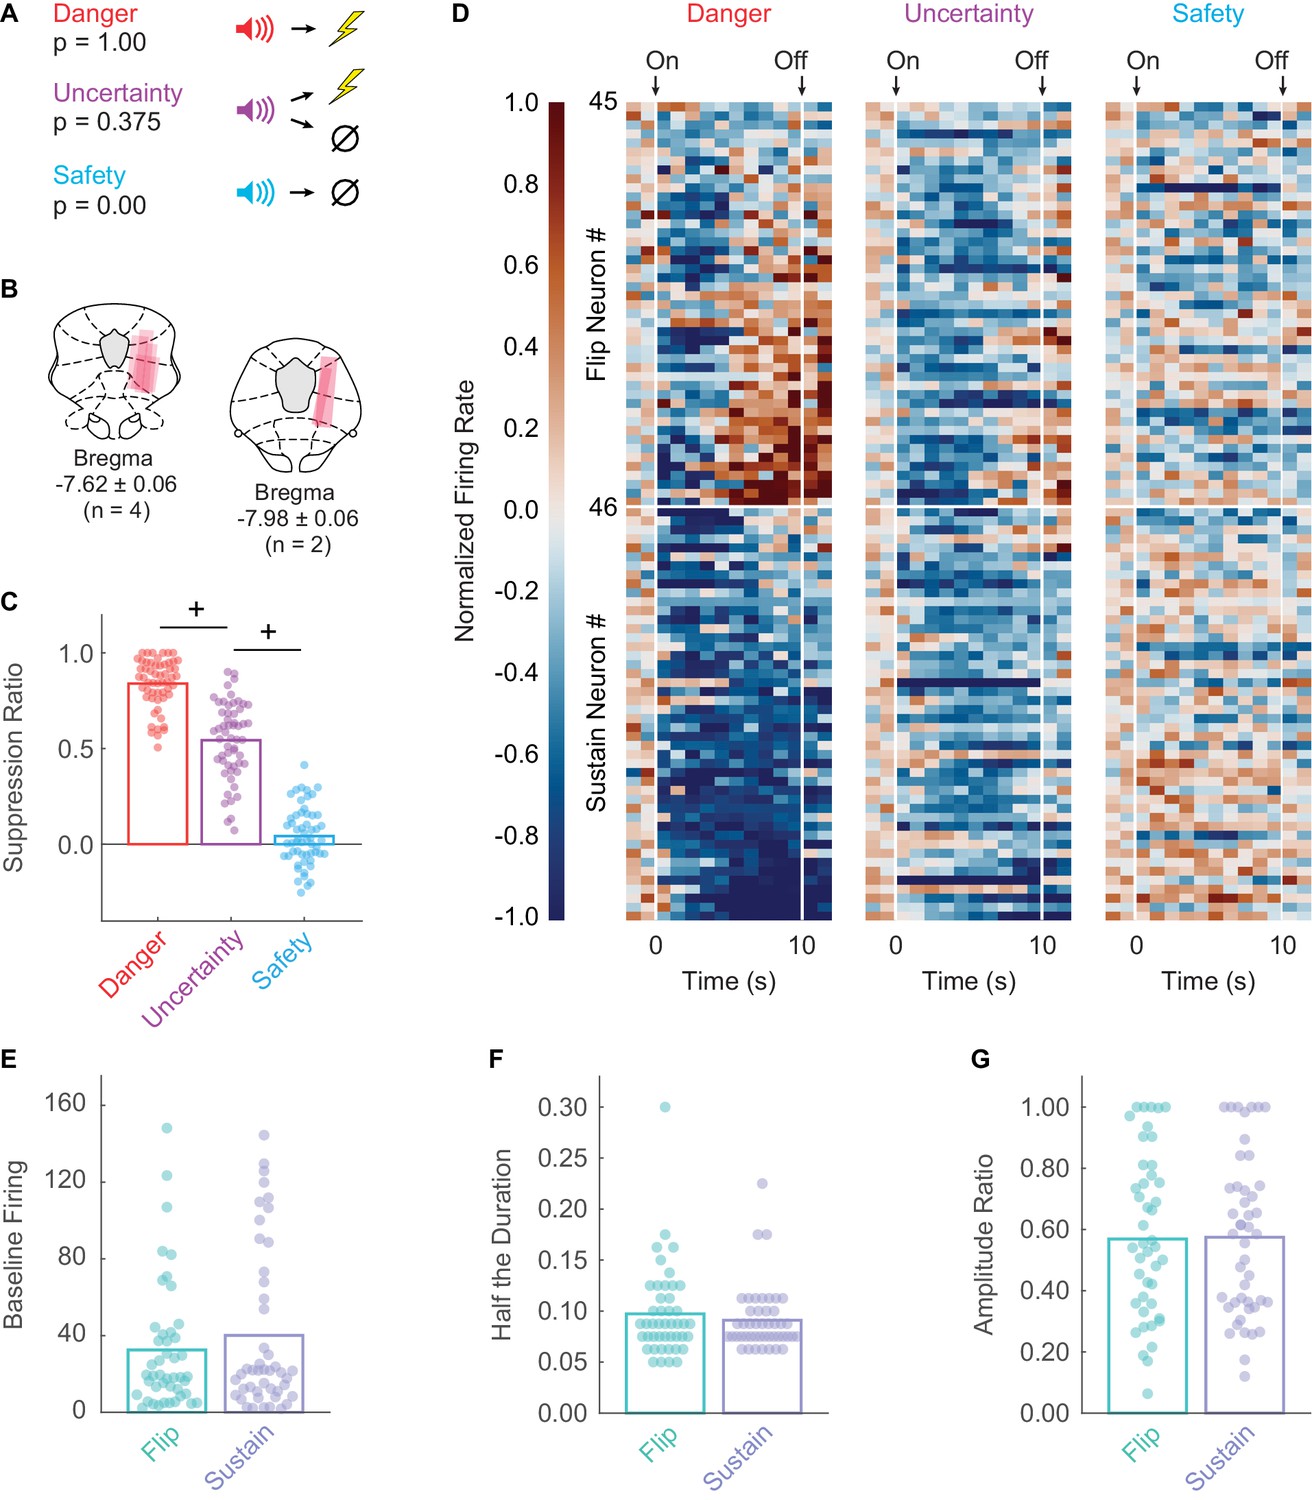
Fear discrimination, histology, heat plot and waveform characteristics.
(A) Pavlovian fear discrimination consisted of three cues predicting unique foot shock probabilities: danger, p = 1.00 (red); uncertainty, p = 0.375 (purple); and safety, p = 0.00 (blue). (B) Microelectrode bundle placements for all rats (n = 6) and all neurons (n = 245) during recording sessions are represented by salmon bars. (C) Mean + individual (data points) suppression ratio for danger, uncertainty, and safety is shown for all recording sessions (n = 88). (D) Normalized firing rate in 1 s intervals is shown for each Flip (n = 45, top) and Sustain (n = 46, bottom) neuron for each trial type (danger, uncertainty and safety). Color scale for normalized firing rate is shown to the right; red indicates high firing and blue low firing. Cue onset and offset are indicated. Single-unit waveform properties of Flip (sea foam) and Sustain (periwinkle) neurons are shown: (E) baseline firing rate, (F) half the duration, and (G) amplitude ratio. +95% bootstrap confidence interval for differential suppression ratio does not contain zero.
Figure 2 with 1 supplement
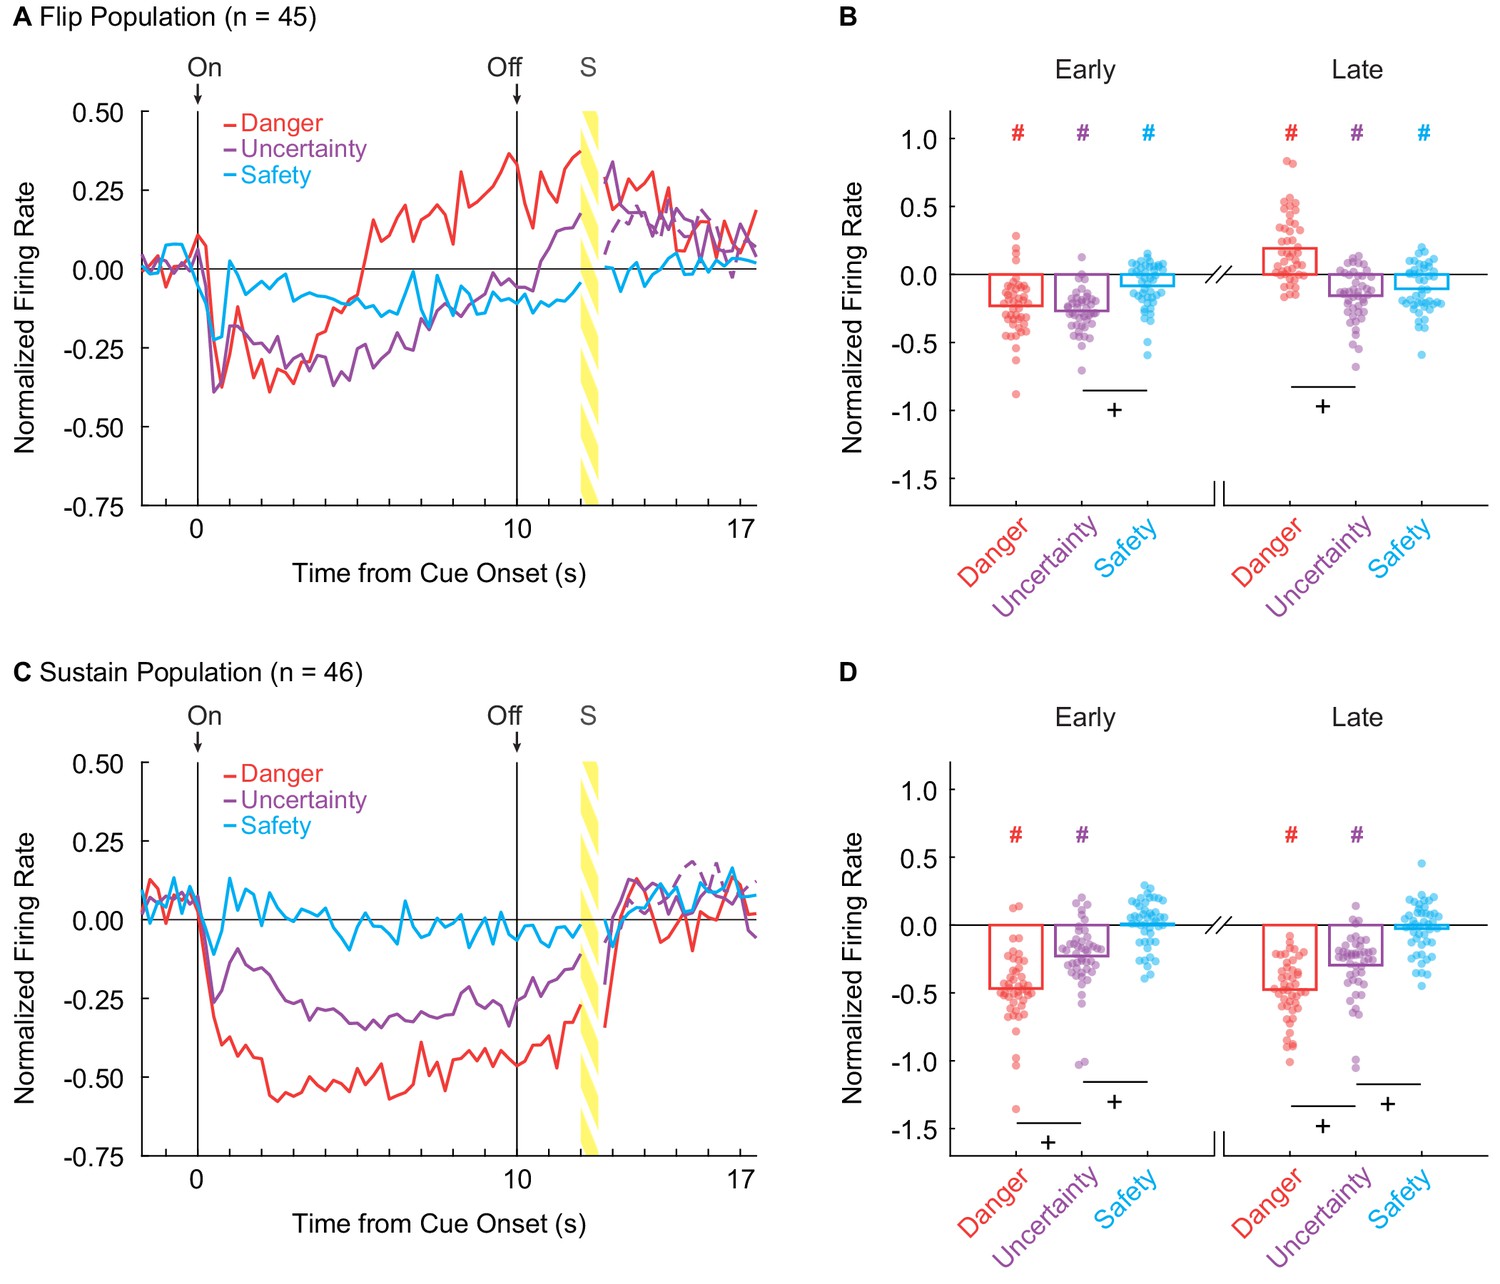
vlPAG neurons flip to excitation or sustain inhibition over cue presentation.
(A) Mean normalized firing to danger (red), uncertainty (purple) and safety (blue) is shown for the 2 s pre-cue period, 10 s cue period, and 2 s delay period for the Flip population (n = 45). Cue onset (On) and offset (Off) are indicated by vertical black lines. (B) Mean (bar) and individual (data points), normalized firing for Flip neurons during the first 5 s of cue presentation (Early, left) and the last 5 s of cue presentation (Late, right) is shown for each cue. (C) Mean normalized firing for the Sustain population (n = 45), shown as in A. (D) Mean and individual (data points), normalized firing for Sustain neurons, as in B. +95% bootstrap confidence interval for differential firing does not contain zero. #95% bootstrap confidence interval for normalized firing does not contain zero.
Figure 2—figure supplement 1
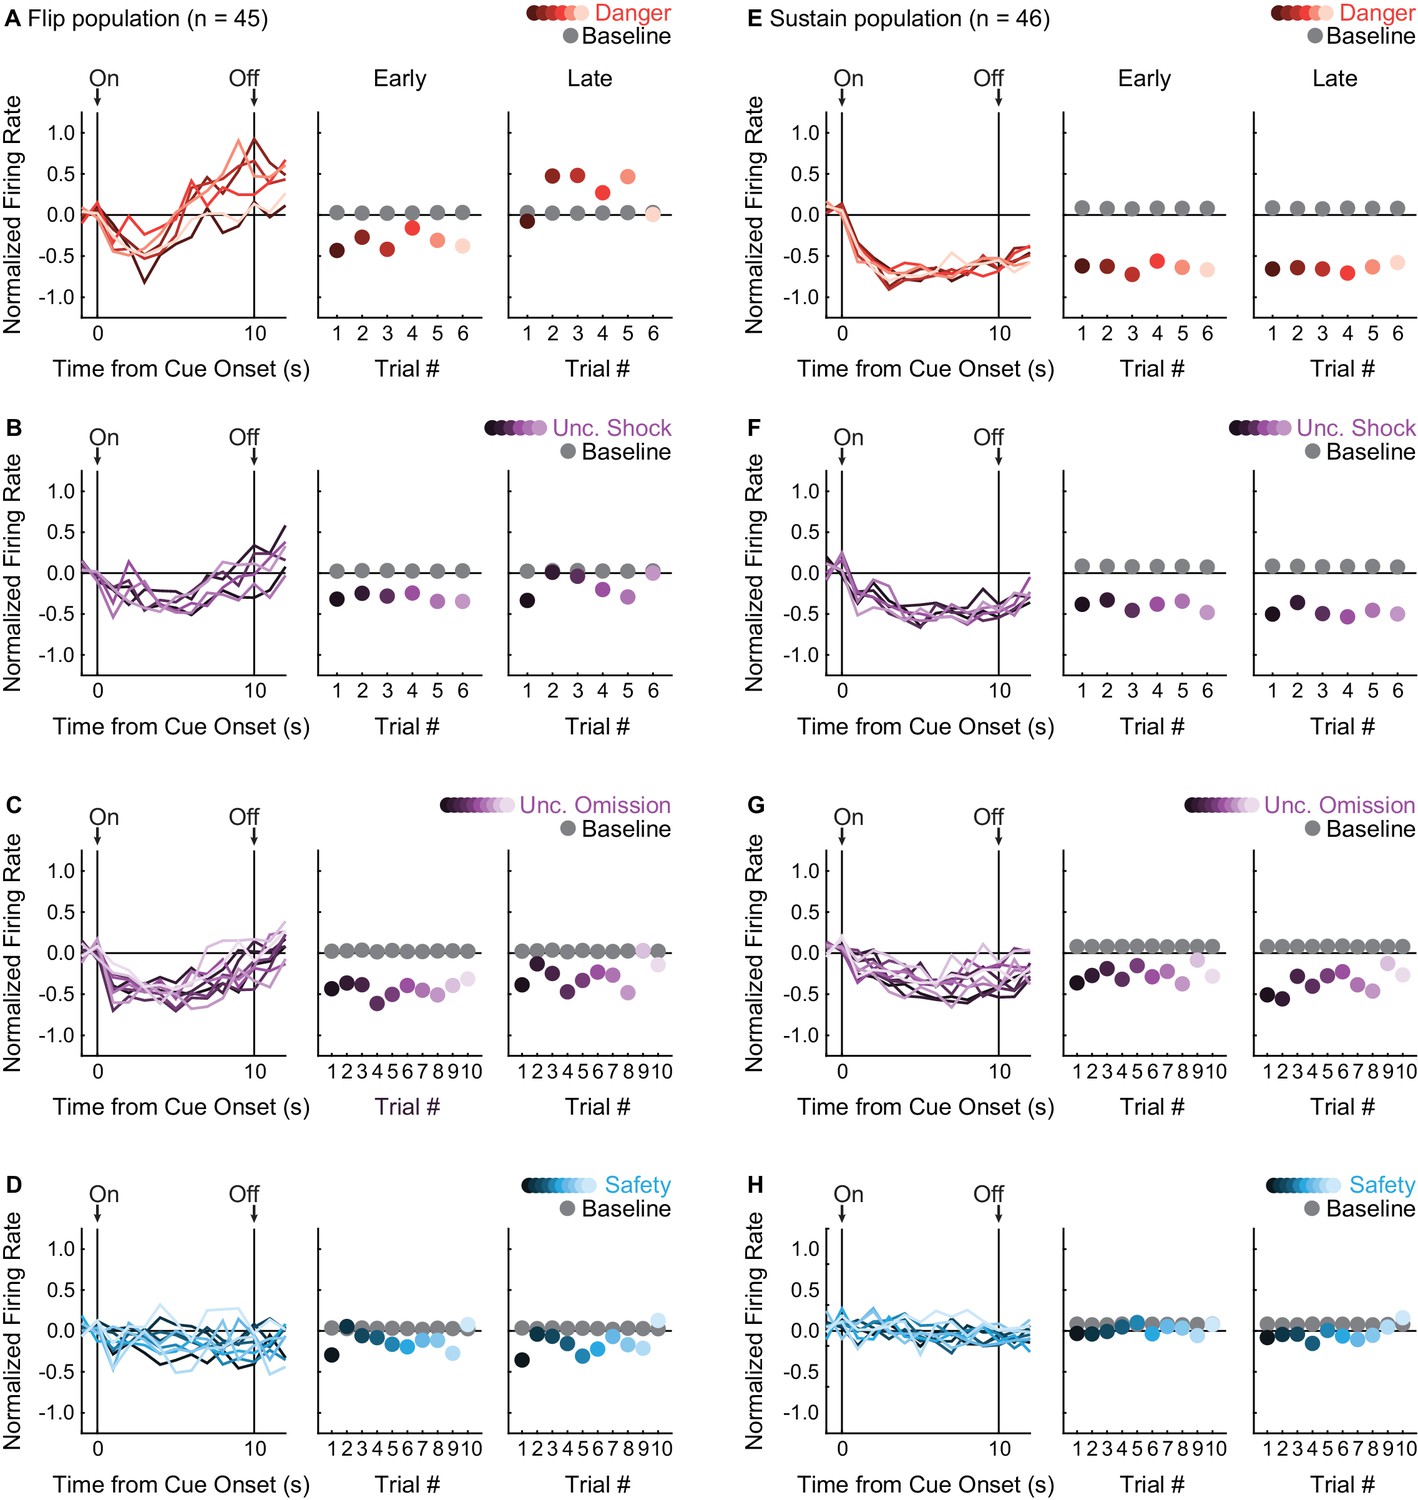
Trial by trial firing for Flip and Sustain populations.
(A, left ) Normalized firing rate for the Flip population (n = 45) is shown across cue presentation for each of the six danger trials. Trials are color-coded from dark (first trial) to light (last trial) with ‘On’ indicating cue onset and ‘Off’ indicating cue offset. (A, center) Mean population firing rate for the first 5 s of cue presentation (early) is shown for each trial. Color scheme maintained from A, left. Mean population baseline firing rate (2 s prior to cue presentation) is shown for each trial (gray). (A, right) Firing for the last 5 s of cue presentation (late) shown as in A, center. Identical figures using unique color schemes were made for each trial type: (B) uncertainty shock, (C) uncertainty omission and (D) safety. An identical set of figures were made for the Sustain population (n = 46; E–H).
Figure 3
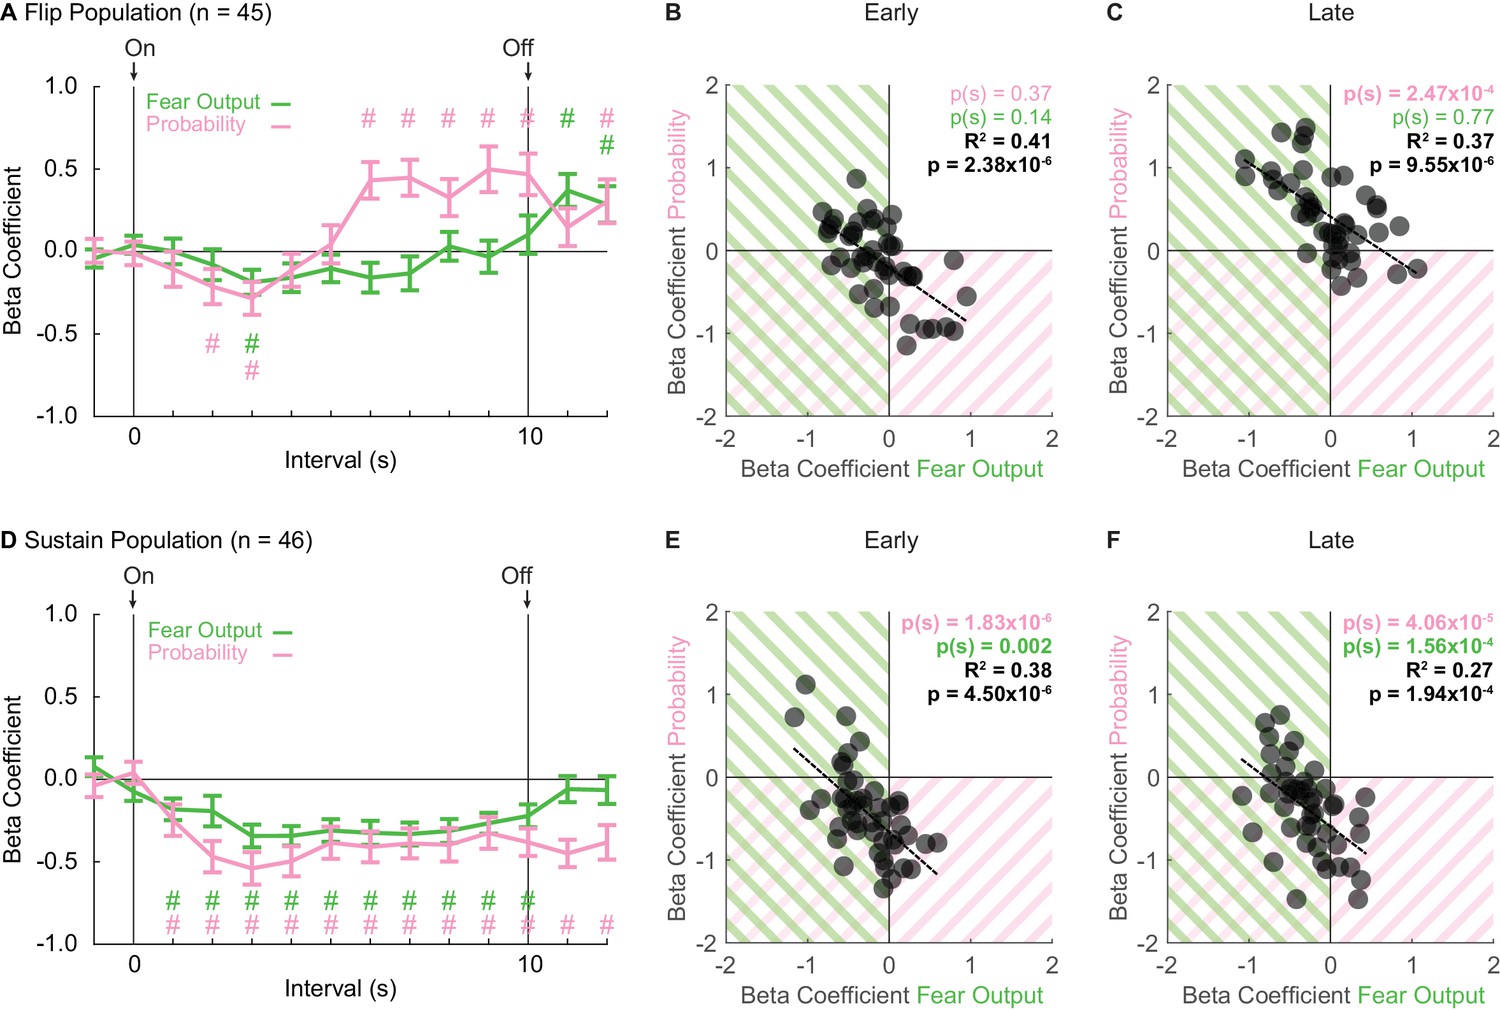
Sustain and Flip populations signal threat probability and fear output.
(A) Mean ± SEM beta coefficients are shown for each regressor (probability: pink, fear output: green), in 1 s intervals, for the Flip population (n = 46). (B) Beta coefficients during the first, 5 s of cue presentation (Early) for fear output and threat probability are plotted for all Flip neurons. Black dashed trendline, the square of Pearson’s correlation coefficient (R2) with associated p value, and sign test p value demonstrating regressor bias shown. Background shading indicates negative beta coefficients, color coded by regressor. (C) Beta coefficients during the last, 5 s of cue presentation (Late) for fear output and threat probability are plotted for all Flip neurons. (D) Mean ± SEM beta coefficients are shown for each regressor for the Sustain population (n = 46). All graph properties maintained from A. (E) Beta coefficients during Early cue presentation for fear output and threat probability are plotted for all Sustain neurons. All graph properties maintained from B. (F) Beta coefficients during Late cue presentation for fear output and threat probability are plotted for all Sustain neurons. #95% bootstrap confidence interval for beta coefficient does not contain zero.
Figure 4
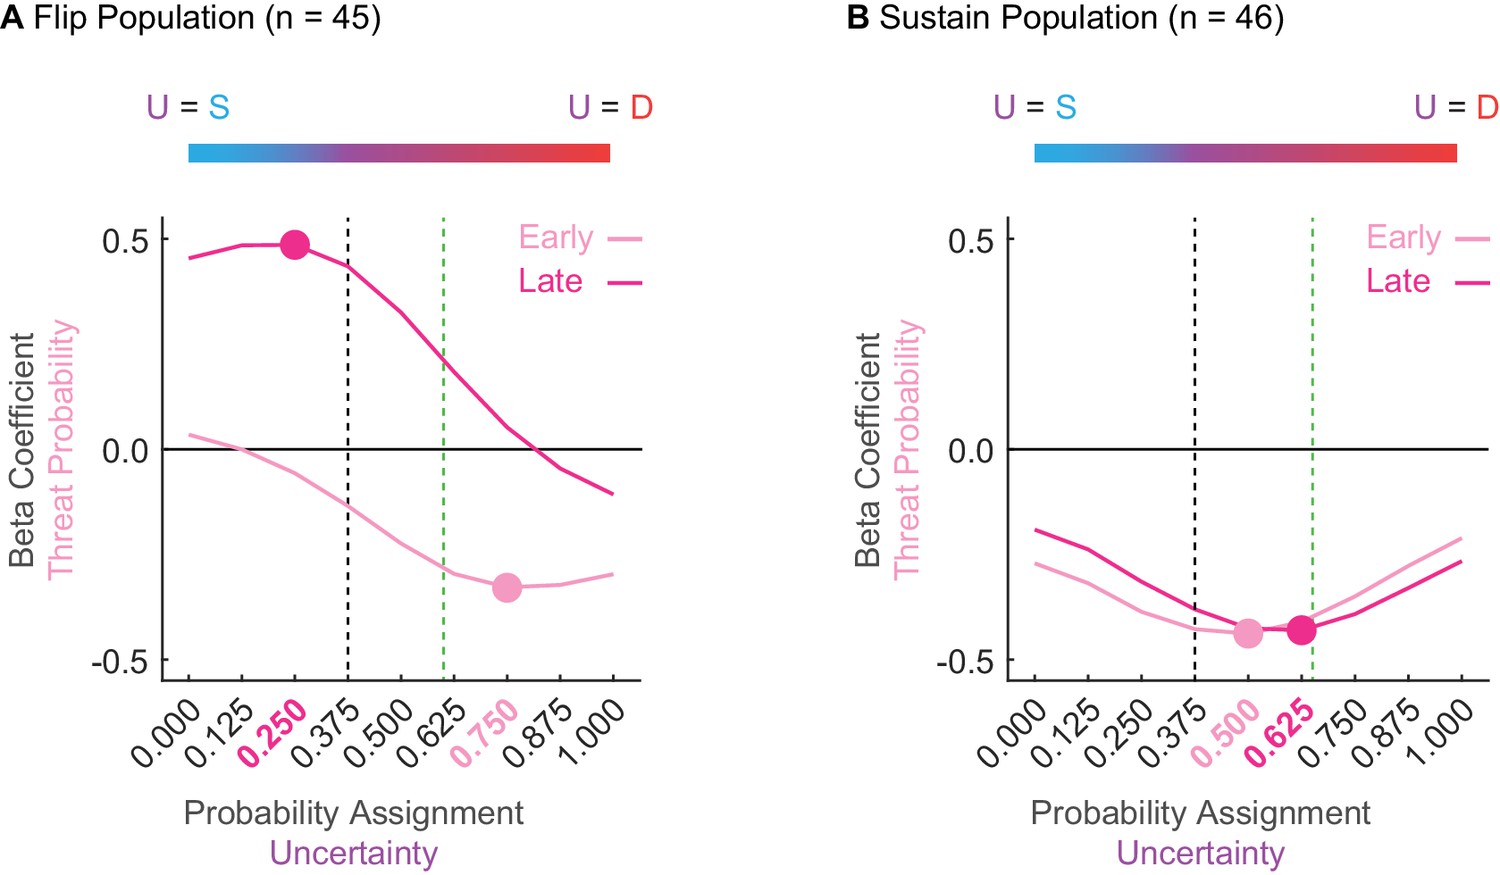
Sustain and Flip populations probability tuning.
(A) Mean beta coefficient for probability is shown for early (light pink) or late (hot pink) cue presentation for each of nine uncertainty assignments for the Flip population (n = 45). The peak or trough of each curve is indicated by a single point with the corresponding uncertainty assignment highlighted in the same color on the x axis below. Black dashed line indicates the actual foot shock probability associated with uncertainty (p = 0.375). Green dashed line indicates the mean proportional distance of uncertainty between danger and safety (suppression ratio). The blue-to-red color bar at the top of the figure demonstrates that a leftward shift along the x-axis reflects an uncertainty assignment similar in quality to safety (p = 0.000) versus those that would be more similar to a danger cue on the far right (p = 1.000). (B) All graph properties maintained from A, but applied to the Sustain population.
Tables
Key resources table
| Reagent type (species) or resource | Designation | Source or Reference | Identifier | Additional information |
|---|---|---|---|---|
| Antibody | Anti-Tryptophan Hydroxylase (sheep polyclonal) | Sigma | Cat # T8575 RRID:AB_1080792 | [1:1000] in 0.05M PBS |
| Antibody | Biotinylated Anti-Sheep (rabbit clonality unknown) | Vector Labs | Cat # PK-6106 RRID:AB_2336217 | [1:200] in 0.05M PBS |
| Chemical Compound, Drug | Normal Rabbit Serum | Vector Labs | Cat # PK-6106 RRID:AB_2336825 | 1% in 0.05M PBS |
| Chemical Compound, Drug | Avidin | Vector Labs | Cat # PK-6106 RRID:AB_2336825 | [1:200] in 0.05M PBS |
| Chemical Compound, Drug | Biotin | Vector Labs | Cat # PK-6106 RRID:AB_2336825 | [1:200] in 0.05M PBS |
| Chemical Compound, Drug | NovaRED Perioxidase (HRP) Substrate Kit | Vector Labs | Cat # SK-4800 RRID: AB_2336845 | 18 drops (1), 12 drops (2), 12 drops (3) and 12 drops H2O2 solution in DI H2O. |
| Chemical Compound, Drug | Triton | Sigma | Cat # T8787 | |
| Chemical Compound, Drug | Hydrogen Peroxide | Sigma | Cat # 216763 | |
| Chemical Compound, Drug | Paraformaldehyde | Sigma | Cat # P6148 | |
| Chemical Compound, Drug | Sucrose | Fisher Scientific | Cat # S5 | |
| Chemical Compound, Drug | Sodium Chloride | Fisher Scientific | Cat # S 640 | |
| Chemical Compound, Drug | Histoprep 100% Reagent Alcohol | Fisher Scientific | Cat # HC800 | |
| Chemical Compound, Drug | Histoprep 95% Reagent Alcohol | Fisher Scientific | Cat # HC1300 | |
| Chemical Compound, Drug | Histoclear II | Fisher Scientific | Cat # 5089990150 | |
| Chemical Compound, Drug | Omnimount | Fisher Scientific | Cat # 5089990146 | |
| Chemical Compound, Drug | 10% Neutral Buffered Formalin | Fisher Scientific | Cat # 22899402 | |
| Chemical Compound, Drug | Potassium Phosphate Monobasic | Fisher Scientific | Cat # P285 | |
| Chemical Compound, Drug | Potassium Phosphate Dibasic | Fisher Scientific | Cat # P288 | |
| Software and Algorithms | MED PC-IV | Med Associates | RRID:SCR_012156 | |
| Software and Algorithms | OmniPlex | Plexon | Data Acquisition System | |
| Software and Algorithms | Offline Sorter V6 | Plexon | RRID:SCR_000012 | |
| Software and Algorithms | NeuroExplorer | Plexon | RRID:SCR_001818 | |
| Software and Algorithms | Matlab | Mathworks | RRID:SCR_001622 | |
| Software and Algorithms | Statistica | StatSoft | RRID:SCR_014213 | |
| Software and Algorithms | SPSS | IBM | RRID:SCR_002865 | |
| Software and Algorithms | Adobe Illustrator | Adobe | RRID:SCR_010279 | |
| Software and Algorithms | Adobe Photoshop | Adobe | RRID:SCR_014199 | |
| Other | Plexon standard commutator | Plexon | Cat # 50122 | |
| Other | Plexon head stage cable | Plexon | Cat # 91809–017 | Metal Mesh Enclosed Cable |
| Other | Plexon head stage | Plexon | Cat # 40684–020 | |
| Other | Omnetics connector | Omnetics Corporation | Cat # A79042-001 | |
| Other | Green board - Moveable Array | San Francisco Circuits | Cat # PCB | |
| Other | Stainless Steel ground wire | AM Systems | Cat # 791400 | |
| Other | Formvar Insulated Nichrome Wire | AM Systems | Cat # 761500 | |
| Other | Dustless Precision Pellets | Bio-Serv | Cat # F0021 |
Additional files
-
Transparent reporting form
- https://doi.org/10.7554/eLife.50054.007
Download links
A two-part list of links to download the article, or parts of the article, in various formats.
Downloads (link to download the article as PDF)
Open citations (links to open the citations from this article in various online reference manager services)
Cite this article (links to download the citations from this article in formats compatible with various reference manager tools)
Cue-inhibited ventrolateral periaqueductal gray neurons signal fear output and threat probability in male rats
eLife 8:e50054.
https://doi.org/10.7554/eLife.50054


