Maternally regulated gastrulation as a source of variation contributing to cavefish forebrain evolution
- Paris-Saclay Institute of Neuroscience, CNRS UMR9197, Université Paris-Sud, Université Paris-Saclay, France
Figures
Figure 1 with 2 supplements
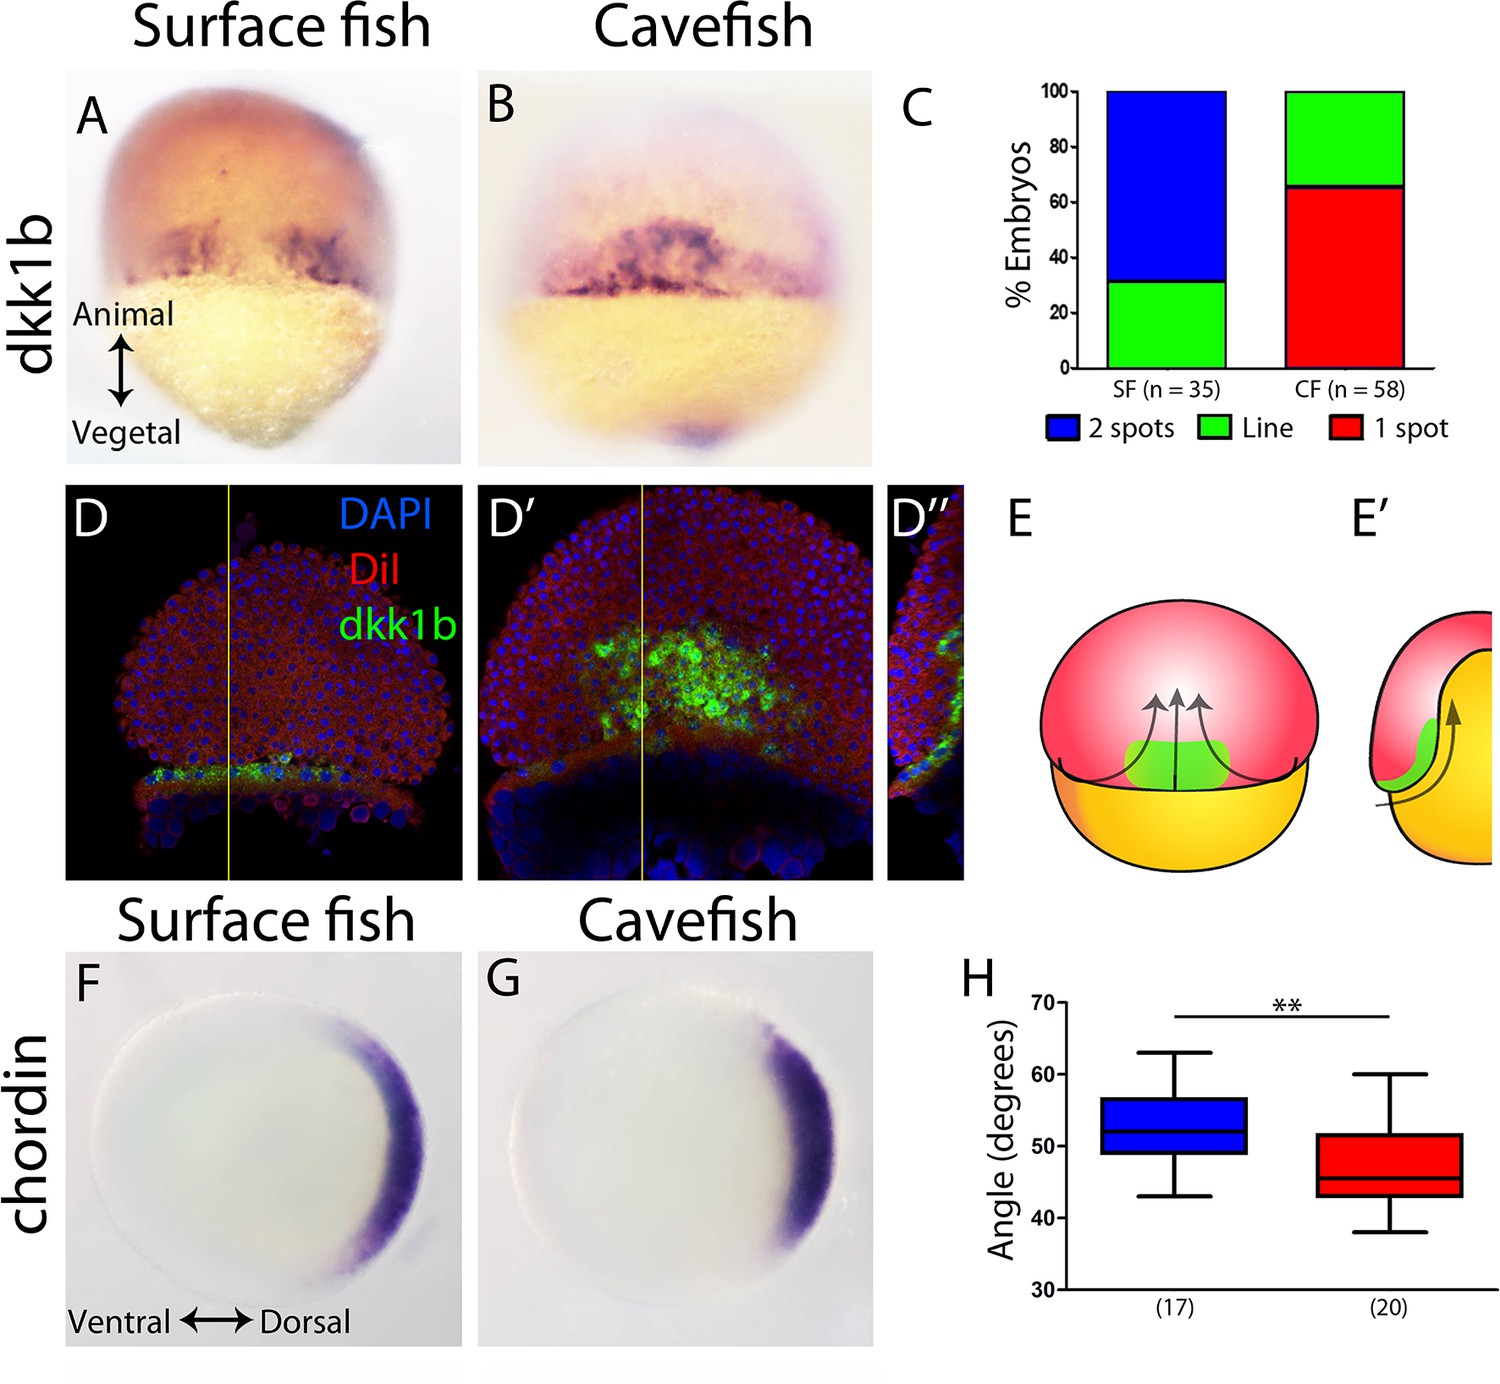
Expression of genes in the organizer at 50% epiboly in surface fish and cavefish.
(A–B) Expression of dkk1b in surface fish (A) and cavefish (B) in dorsal view. (C) Quantification of the expression patterns observed in each morphotype. The y-axis indicates the percentage of embryos belonging to each of the categories and the number of embryos analyzed is indicated. ‘Two spots’ (blue) is the pattern observed in panel (A), ‘one spot’ (red) is the pattern observed in panel (B), and ‘Line’ is an intermediate profile (not shown). (D, D’’) Confocal optical sections of superficial (D) and deep (D’) planes and orthogonal section (D’’) at the level of the yellow line in panels (D) and (D’) of a cavefish embryo stained with DiI (red) and DAPI (blue) after fluorescent ISH to dkk1b. (E, E’) Representation of the cell movements of convergence and internalization (arrows) in a dorsal view (E) and in a section (E’), with the dkk1b+ cells represented in green. (F, G) Expression of chordin in surface fish (F) and cavefish (G) in animal view. (H) Quantification of the angle covered chordin expression pattern. Panels (A, B, D, D’) are dorsal views, animal pole upwards. Panels (F, G) are animal views, dorsal to the right. The results of a Mann-Whitney test are shown in panel (H), **, p = 0.0083.
Figure 1—figure supplement 1
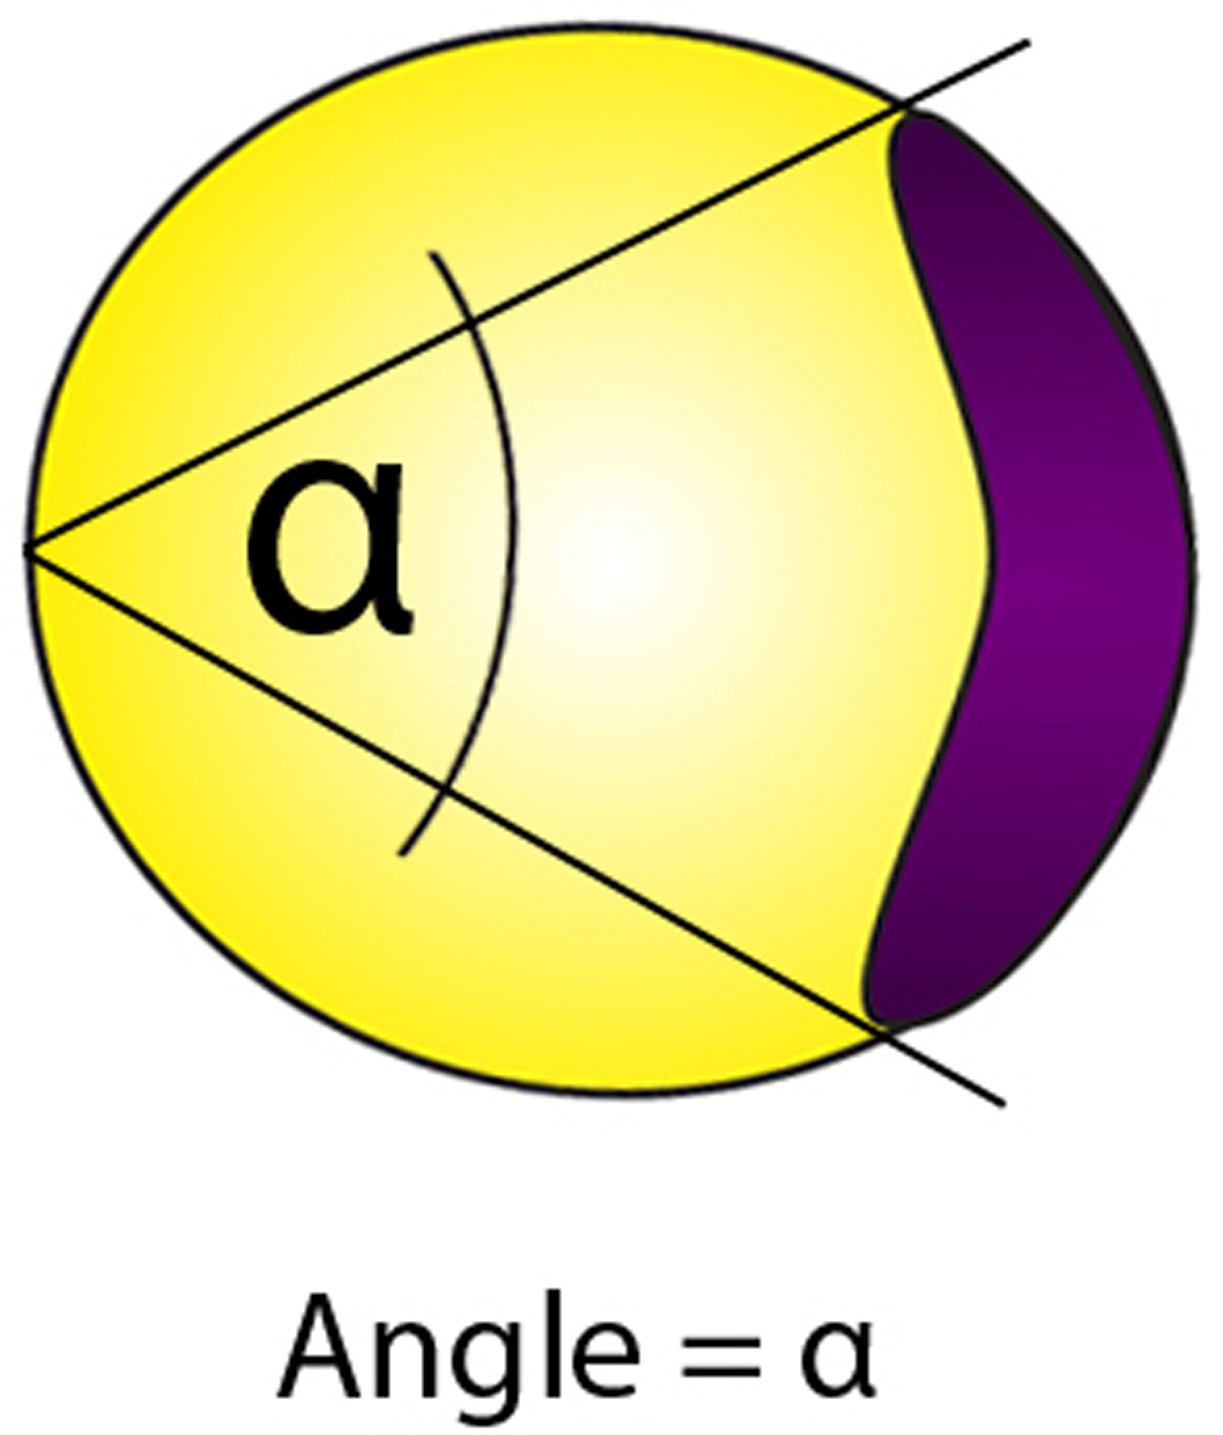
Measurement of angle in embryos stained for chordin at 50% of epiboly, in animal view.
Figure 1—figure supplement 2

Expression of genes in the margin at 50% epiboly in surface fish and cavefish.
(A, B) Expression of lefty1 in surface fish (A) and cavefish (B) in dorsal view. (C) Quantification of the height (see Figure 2—figure supplement 1) for lefty1 expression. (D, E) Expression of flh in surface fish (D) and cavefish (E) in dorsal view. (F) Quantification of the width (see figure; left) and the height (right) of flh expression. (G, H) Expression of ntl in surface fish (G) and cavefish (H). (I, J) Expression of bra in surface fish (I) and cavefish (J). All embryos are in dorsal view, animal pole upwards.
Figure 2 with 1 supplement
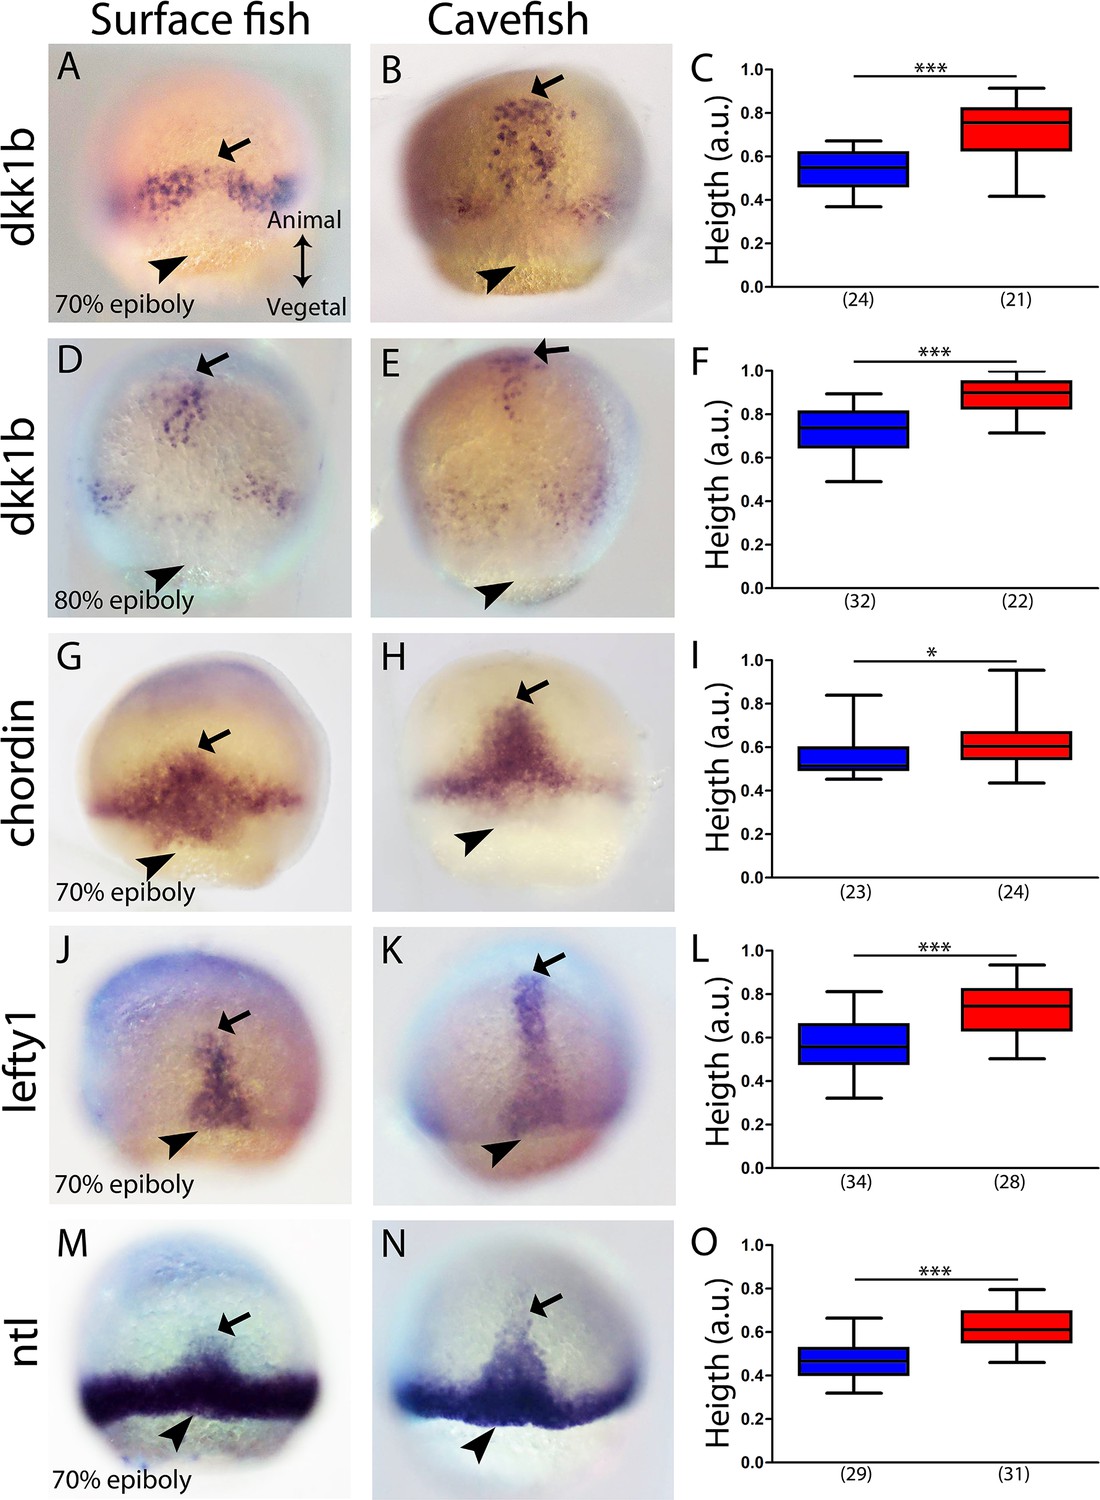
Expression of axial mesodermal genes during mid-gastrulation in surface fish and cavefish.
(A, B, D, E) Expression of dkk1b in surface fish (A, D) and cavefish (B, E) at 70% and 80% epiboly (A, B and D, E, respectively). (C, F) Quantification of height (see Figure 2—figure supplement 1) in dkk1b-labeled embryos at 70% and 80% epiboly (C and F, respectively). (G, H) Expression of chordin in surface fish (G) and cavefish (H) at 70% epiboly. (I) Quantification of height in chordin-labeled embryos at 70% epiboly. (J, K) Expression of lefty1 in surface fish (J) and cavefish (K) at 70% epiboly. (L) Quantification of height in lefty1-labeled embryos at 70% epiboly. (M, N) Expression of ntl in surface fish (M) and cavefish (N) at 70% epiboly. (O) Quantification of height in ntl-labeled embryos at 70% epiboly. Embryos in dorsal views, animal pole upwards. Mann-Whitney test were performed. ***, p = <0.0001, *, p = 0.0167.
Figure 2—figure supplement 1

Measurement of the height,.
The height was obtained from the ratio between H1 (distance from the margin to the leading cell) and H2 (distance from the margin to the animal pole).
Figure 3 with 1 supplement
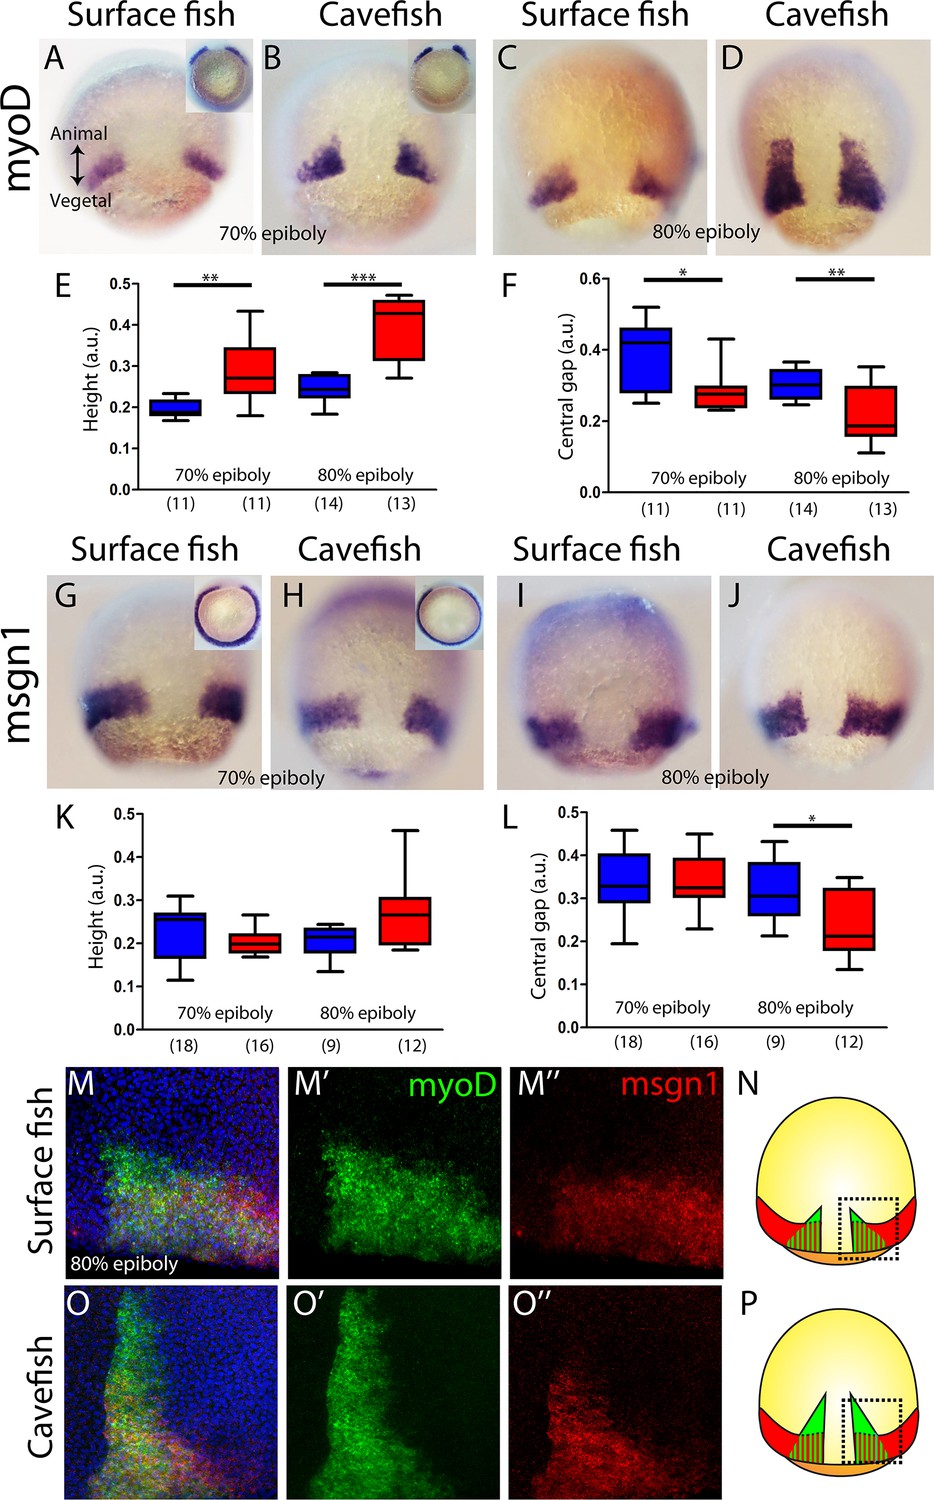
Internalization of paraxial mesoderm in surface fish and cavefish.
(A–D) Expression of myoD in surface fish (A, C) and cavefish (B, D) at 70% and 80% epiboly (A, B and C, D, respectively). Insets in panel (A) and (B) show the corresponding embryos in a vegetal view. (E) Quantification of height in myoD-labeled embryos at 70% and 80% epiboly (left and right, respectively). (F) Quantification of the central non-expressing zone in myoD-labeled embryos at 70% and 80% epiboly (left and right, respectively). (G–J) Expression of msgn1 in surface fish (G, I) and cavefish (H, J) at 70% and 80% epiboly (G, H and I, J, respectively). Insets in panels (G) and (H) show the corresponding embryos in a vegetal view. (K) Quantification of height in msgn1-labeled embryos at 70% and 80% epiboly (left and right, respectively). (F) Quantification of the central non-expressing zone in msgn1-labeled embryos at 70% and 80% epiboly (left and right, respectively). (M–M’’ and O–O’’) Confocal projection (20–30 µm) showing the expression of myoD (green) and msgn1 (red) in double-stained surface fish and cavefish embryos (M–M’’ and O–O’’, respectively) at 80% epiboly. DAPI was used as a counterstain (blue nuclei). (N, P) representations of surface fish (N) and cavefish (P) embryos, indicating in black dashed lines the regions of interest showed in panels (M) and (O). Mann-Whitney tests were performed. **, p = 0.0025 (E, left), ***, p = <0.0001 (E, right), *, p = 0.0181 (F, left), **, p = 0.0094 (F, right), *, p = 0.0209 (L, right). Embryos in dorsal views, animal pole on top; insets in vegetal view, dorsal on top.
Figure 3—figure supplement 1
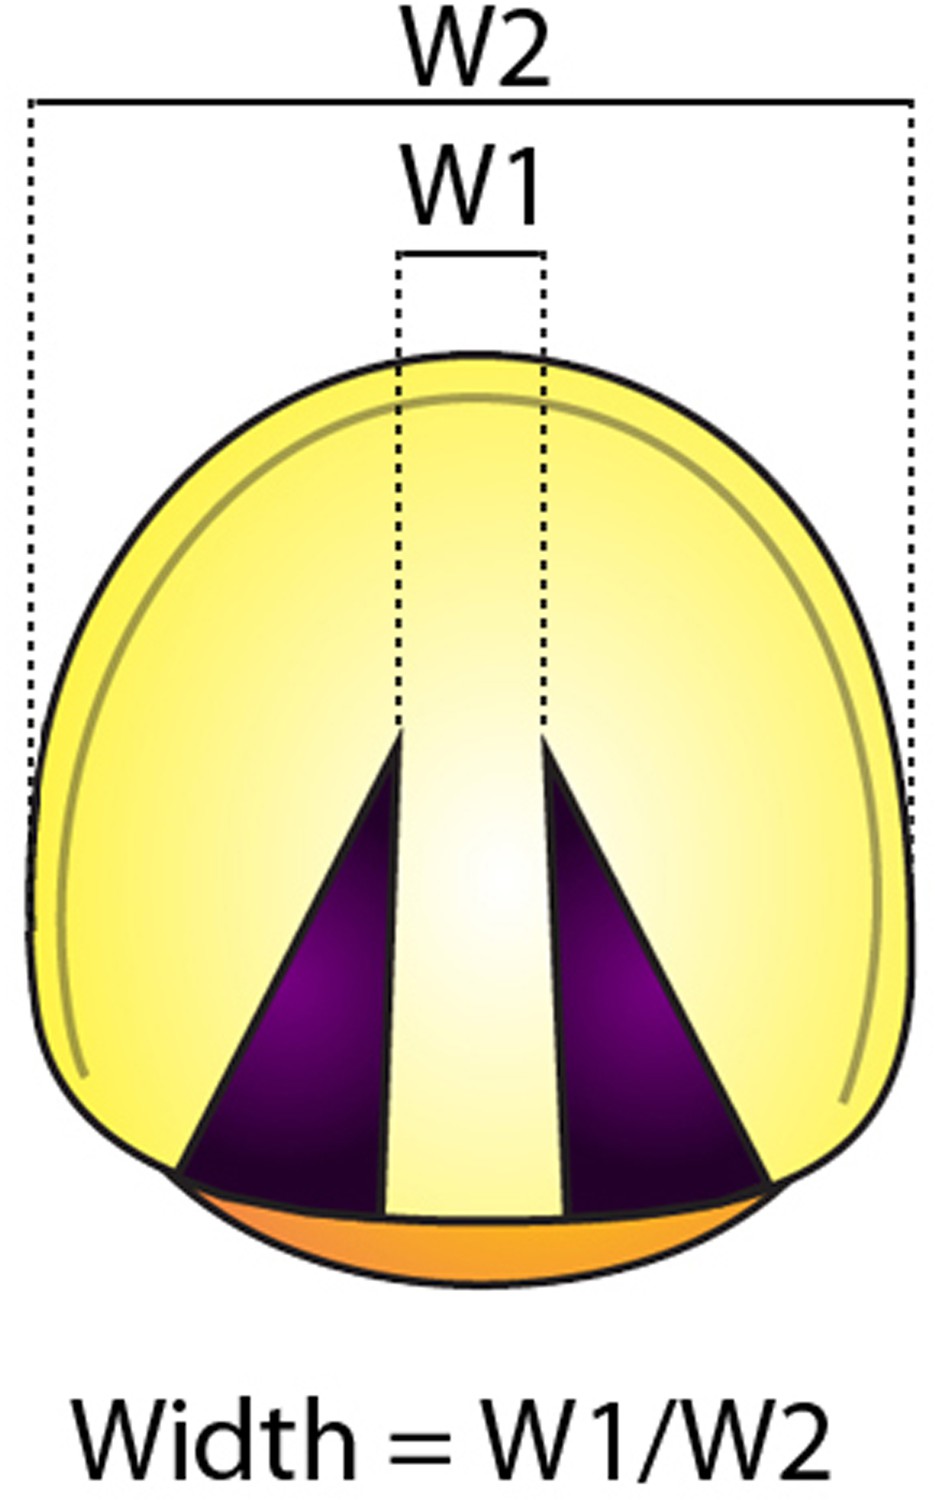
Measurement of the width.
the width was obtained from the ratio between W1 (distance of the central gap in this case, or the expression domain) and W2 (the total width of the embryo).
Figure 4 with 2 supplements
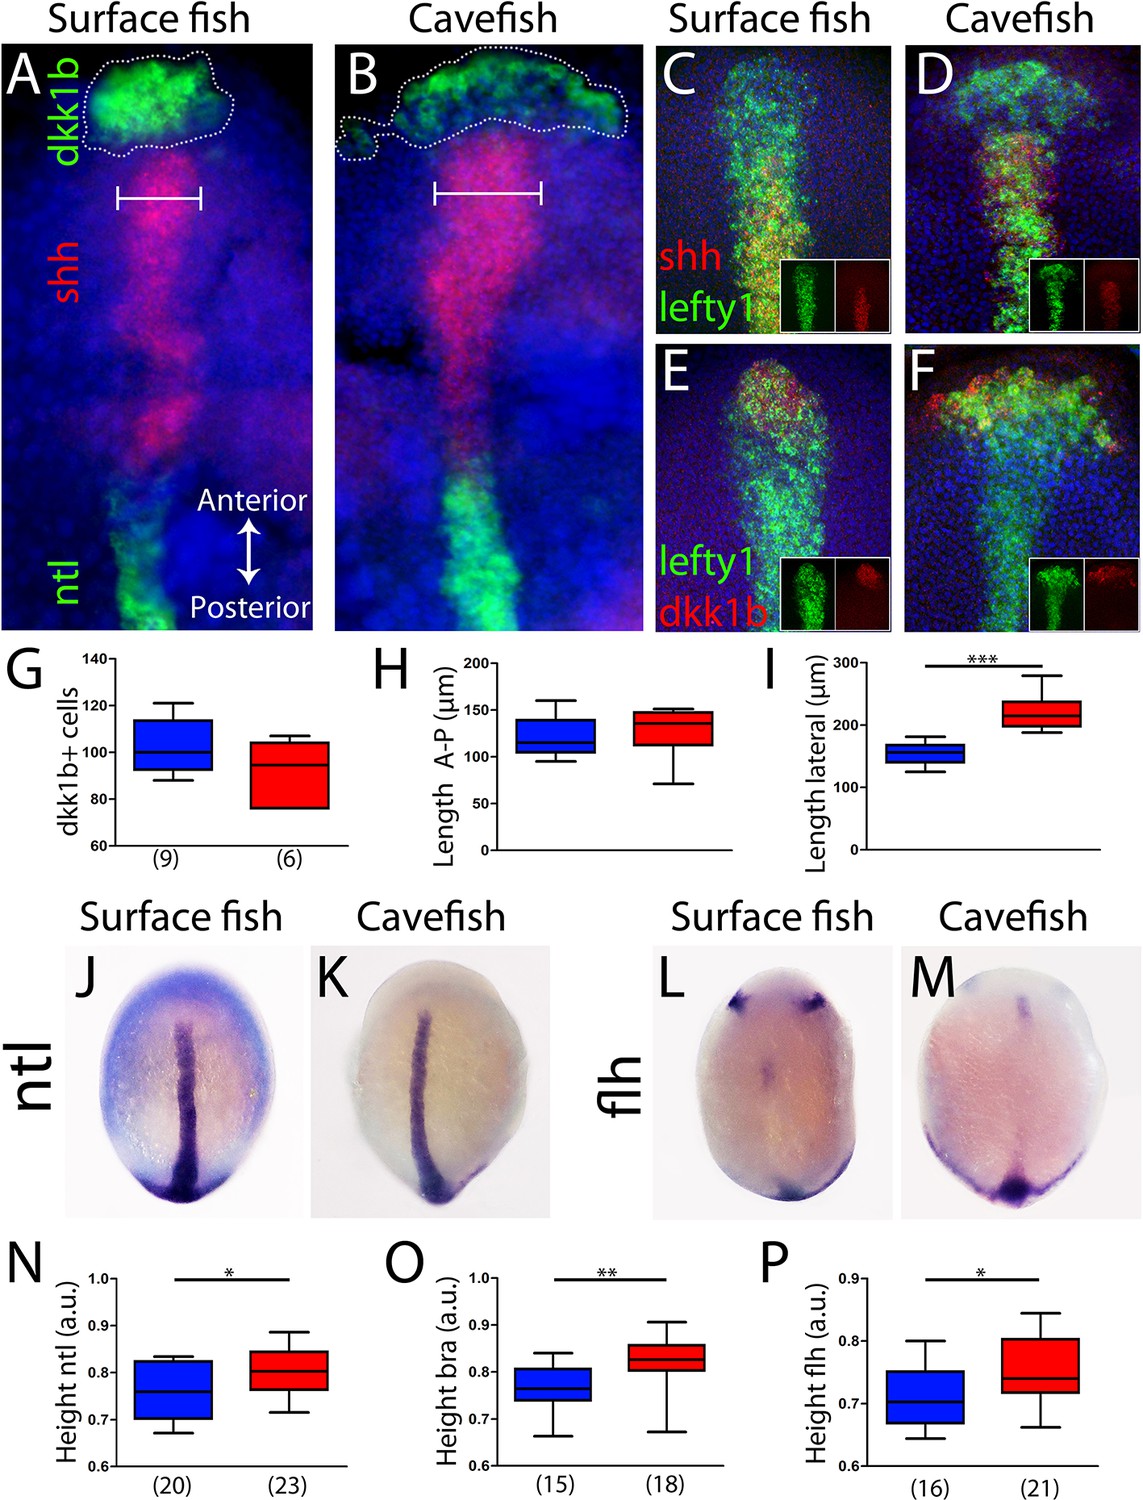
Axial mesoderm organization in surface fish and cavefish.
(A, B) Triple ISH to dkk1b (green, rostral), shh (red, central) and ntl (green, posterior) in surface fish (A) and cavefish (B). (C, D) Confocal projection (20–30 µm) showing the expression of shh (red) and lefty1 (green) in surface fish (C) and cavefish (D) embryos. Insets show the individual channels. (E, F) Confocal projection (20–30 µm) showing the expression of dkk1b (red) and lefty1 (green) in surface fish (E) and cavefish (F) embryos. Insets show the split channels. (G) Quantification of the number of cells expressing dkk1b. (H) Quantification of the distance between the dkk1b-expressing cells located in the extremes of the antero-posterior axis. (I) Quantification of the distance between the dkk1b-expressing cells in lateral extremes. (J, K) Expression of ntl in surface fish (J) and cavefish (K). (L, M) Expression of flh in surface fish (L) and cavefish (M). (N) Quantification of height in ntl-labeled embryos. (O) Quantification of height in bra-labeled embryos. (P) Quantification of height in flh-labeled embryos. All embryos at tail-bud stage, in dorsal view, anterior upwards. Pictures in panels (A–F) are flat mounted embryos, whereas pictures in panels (J–M) are whole-mount embryos. Mann-Whitney tests were performed. ***, p = <0.0001 (I); *, p = 0.0396 (N); **, p = 0.0012 (O); and *, p = 0.0142 (P).
Figure 4—figure supplement 1
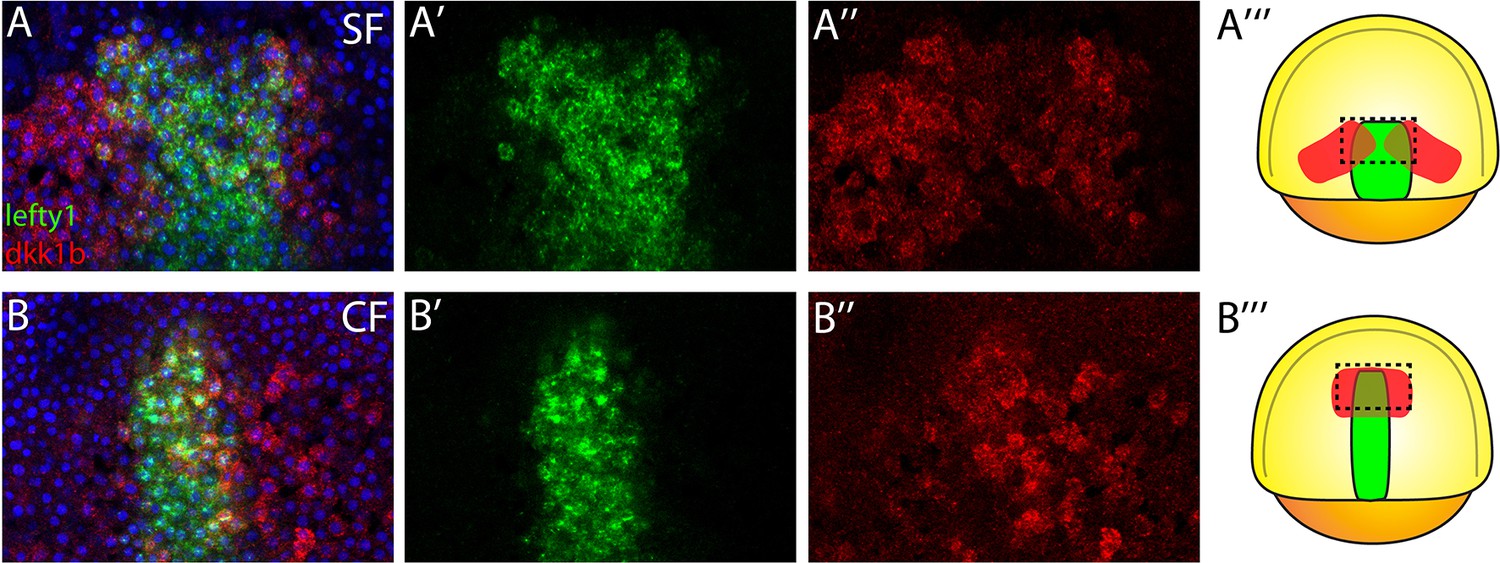
Expression of dkk1b and lefty1 during mid-gastrulation.
Expression of dkk1b (red) and lefty1 (green) in surface fish (A) and cavefish (B) at 70% of epiboly.
Scheme of surface fish (A’’’) and cavefish (B’’’) at 70% of epiboly with the region of interest indicated by a dashed box.
Figure 4—figure supplement 2
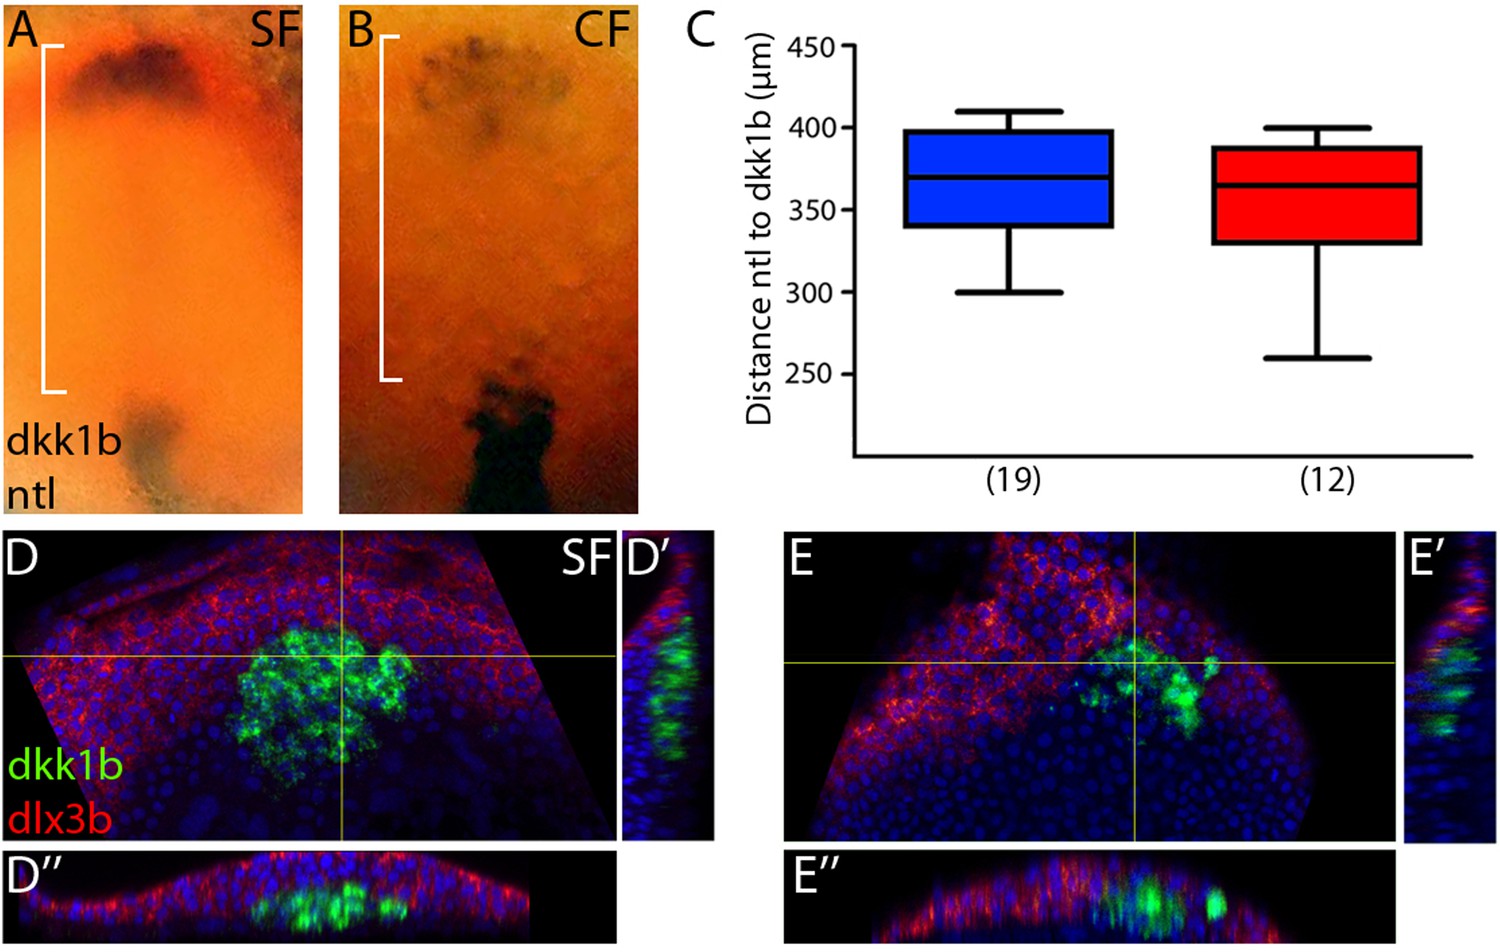
Position of the prechordal plate relative to notochord and anterior neural border.
(A, B) Expression of dkk1b and ntl (notochord) at 10 hpf in surface fish (A) and cavefish (B). (C) Quantification of the distance from the leading notochordal cell to the leading polster cell in a dorsal view, indicated by square brackets in panels (A) and (B). (D, E) Confocal images of the expression of dkk1b (green) and dlx3b (red, neural plate border) at 10 hpf in surface fish (D) and cavefish (E). Panels (D) and (E) are projections of 3 µm; panels (D’) and (E’) are reconstructions of a sagittal section (yellow line, vertical); and panels (D’’) and (E’’) are reconstructions from a transverse section (yellow line, horizontal). Panels (A) and (B) are whole-mounted embryos, whereas panels (D) and (E) are dissected embryos.
Figure 5 with 1 supplement
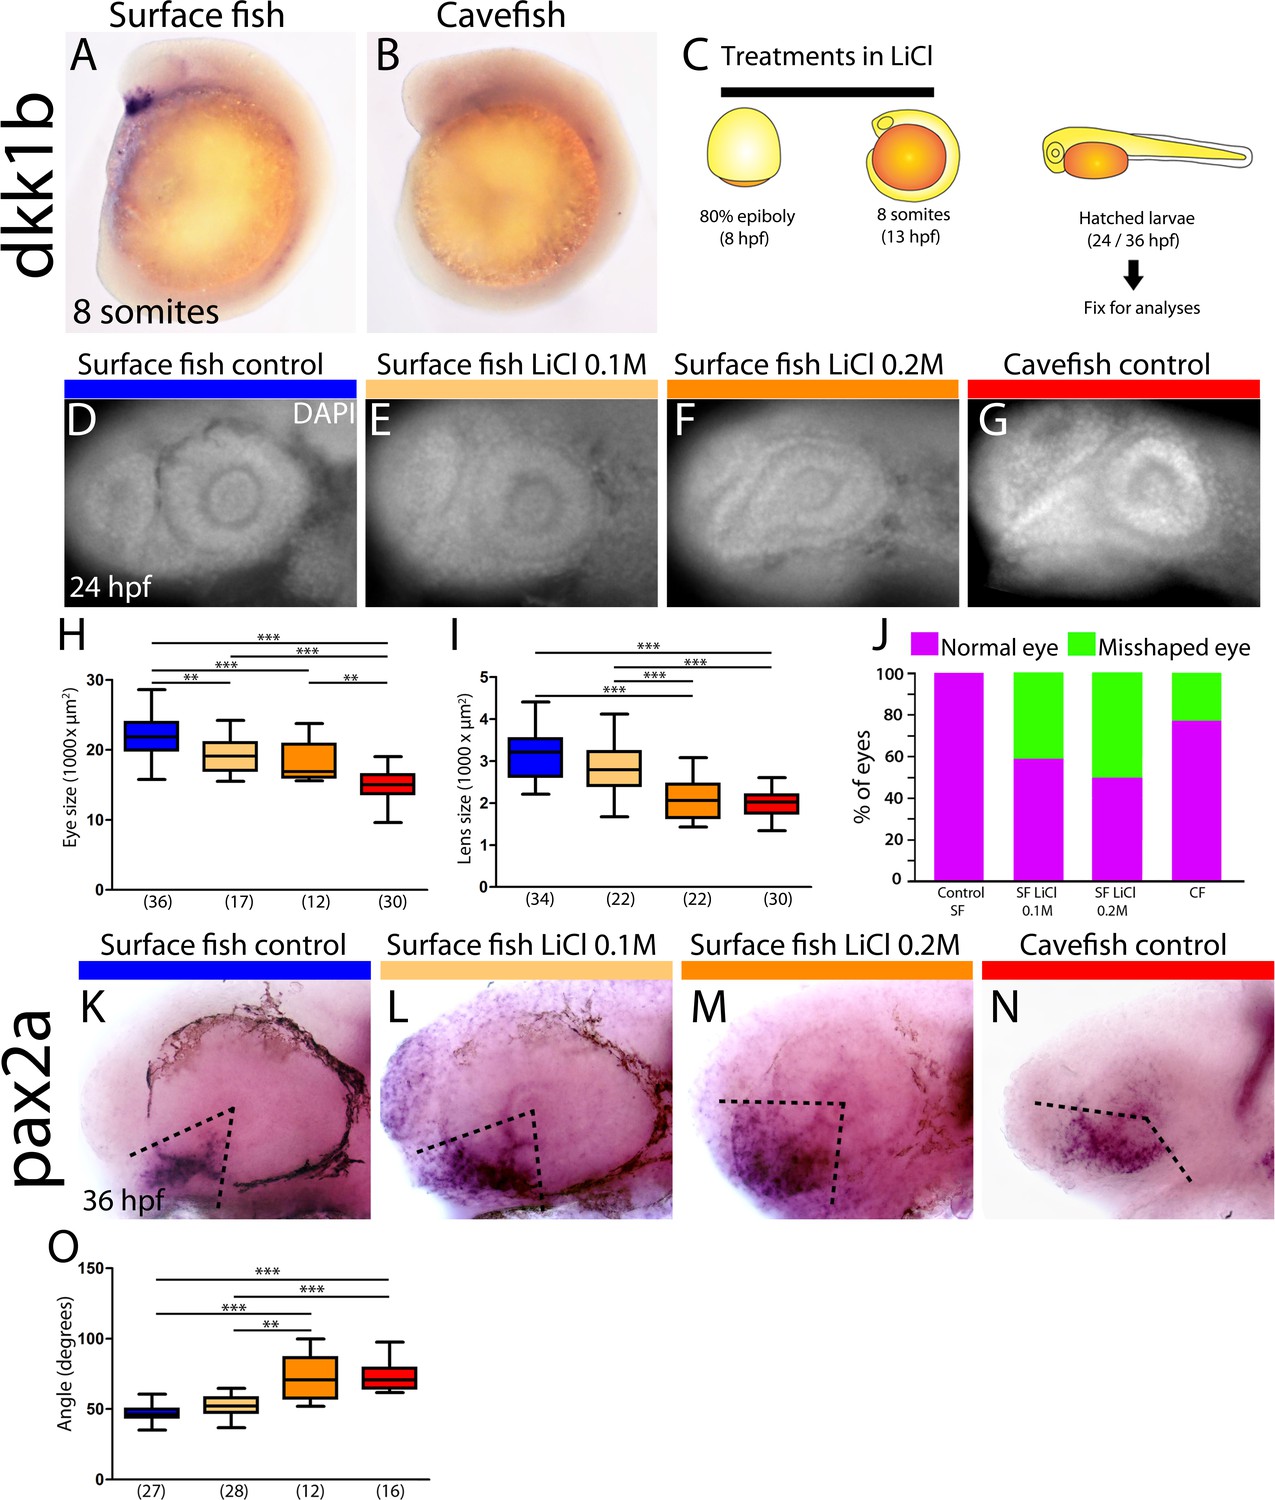
Differential off-set of dkk1b expression may be relevant for the optic phenotype in cavefish.
(A, B) Expression of dkk1b at the 8-somite stage in surface fish (A) and cavefish (B). (C) Experimental design for LiCl treatments. Dechorionated surface fish embryos were treated in LiCl solutions from the end of gastrulation (8 hpf, left) until mid-somitogenesis (13 hpf, center) and then fixed for analyses at larvae stages (24 or 36 hpf, right). (D–J) Effect of LiCl treatments analyzed at 24 hpf. Surface fish untreated (D), treated with 0.1M and 0.2M LiCl (E and F, respectively) and cavefish untreated (G), stained with DAPI at 24 hpf. Quantification of the eye size (H) lens size (I) and percentage of embryos with misshaped developing eye (J). (K–O) Effect of LiCl treatments analyzed at 36 hpf. Expression of pax2a at 36 hpf in the optic stalk/optic fissure of surface fish that were untreated (K) or treated with0.1M and 0.2M LiCl (L and M, respectively) and of untreated cavefish (N). (O) Quantification of the measured angle (indicated in K-N as black dashed lines). Kruskal-Wallis tests with Dunn’s post-test, were performed. **, p = <0.01; ***, p = <0.001.
Figure 5—figure supplement 1
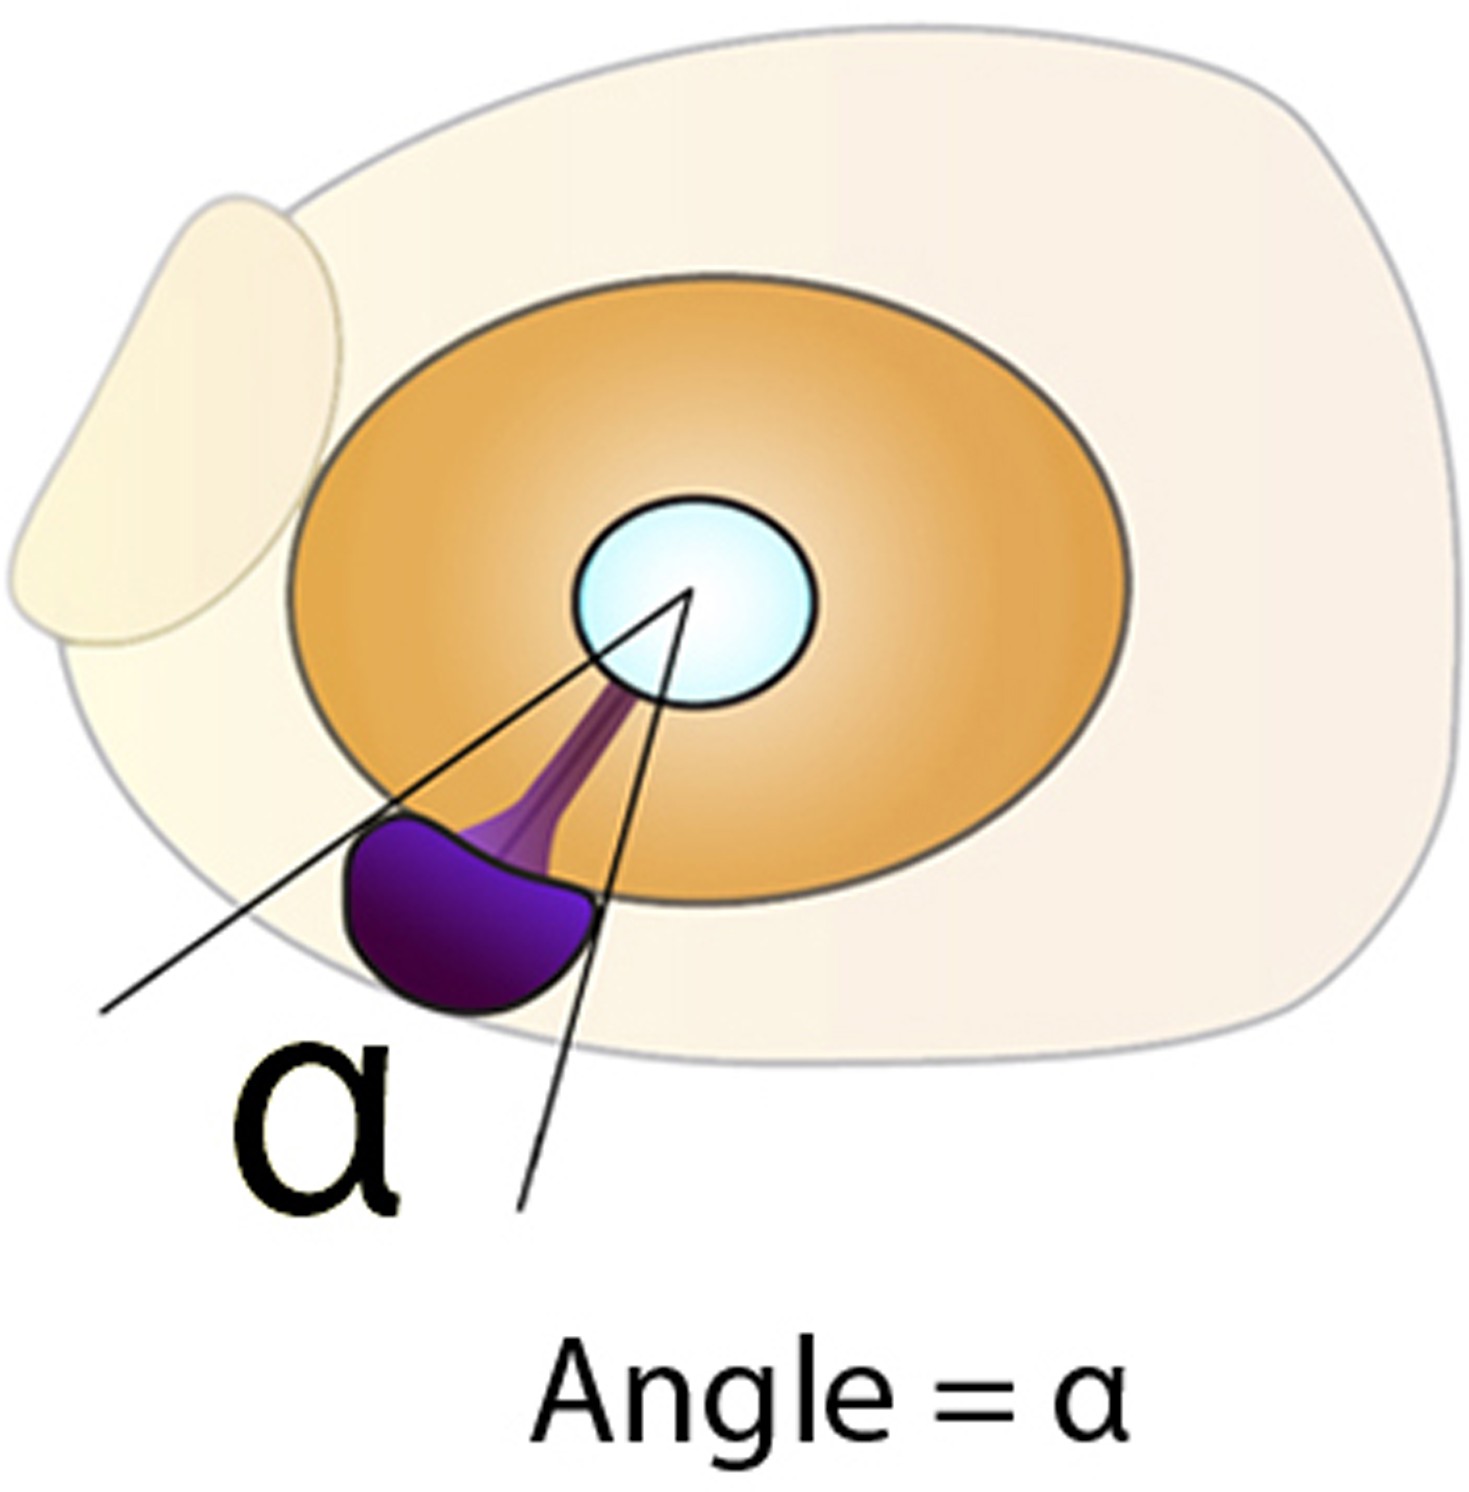
Measurement of angle in embryos stained for pax2a at 36 hpf, in lateral view.
Figure 6 with 1 supplement
Maternal effect on early development.
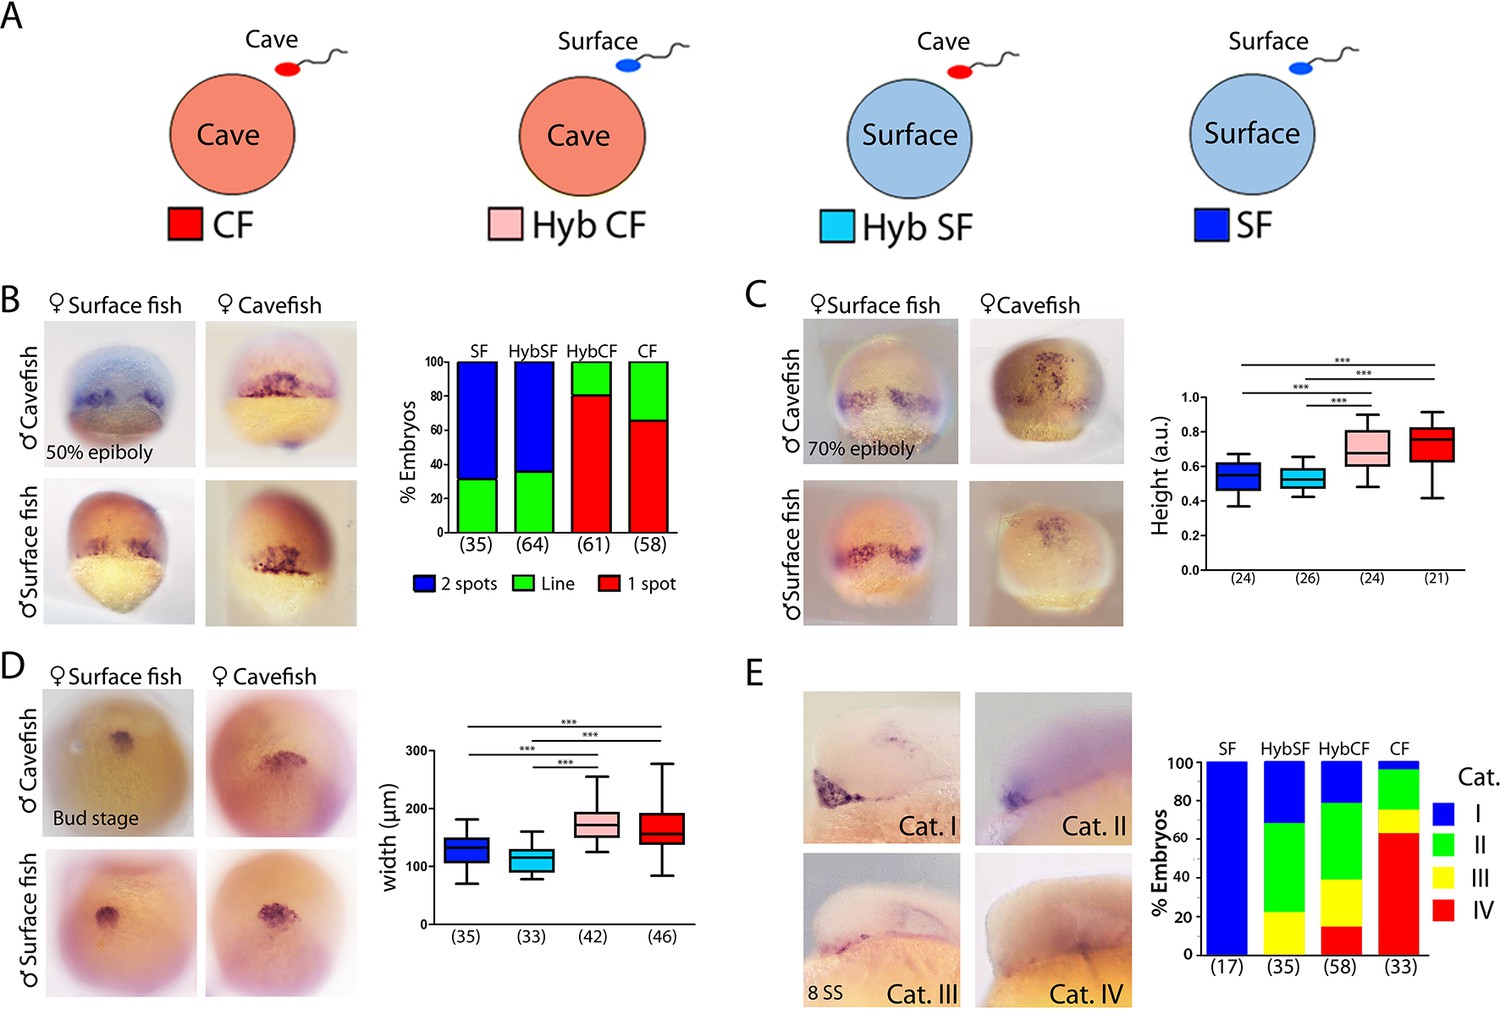
(A) Schematic representation of the fertilizations performed for the analyses of maternal effect in F1 hybrids. Oocytes from either morph (cave in pink and surface in light blue) were fertilized with sperm from cavefish (red) or surface fish (blue). For simplicity, F1 hybrids were named HybCF (oocyte from cavefish, pink) and HybSF (oocyte from surface fish, light blue), based on their maternal contribution. (B–E) Expression of dkk1b at 50% of epiboly (B), 70% of epiboly (C), bud stage (D) and 8-somite stage (E). (B, right) Quantification of the expression pattern of dkk1b at 50% epiboly, classified into three categories: ‘2 spots’,‘1 spot’ (red), and ‘Line’, which is an intermediate profile (not shown in micrographs). The y-axis indicates the percentage of the total embryos belonging to each of the three categories and the numbers of embryos examined are indicated. (C, right) Quantification of height in dkk1b-labeled embryos at 70% epiboly . (D, right) Quantification of width of the polster based on dkk1b expression. (E, right) Quantification of the pattern of dkk1b at the 8-somite stage, with embryos classified according to the number of positive cells. Category I (blue, surface fish), more than 5 cells; category II (green, HybSF), between 3 and 5 cells; category III (yellow, HybCF); and category IV, no positive cells (red, cavefish). All embryos were imaged in whole mount. Embryos in panels (B) and (C) in dorsal view with the animal pole upwards; embryos in panel (D) are in dorsal view with the anterior upwards; and embryos in panel (E) are in lateral view with the anterior to the left. Kruskal-Wallis tests with Dunn’s post-test were performed in all cases. ***, p = <0.001.
Figure 6—figure supplement 1
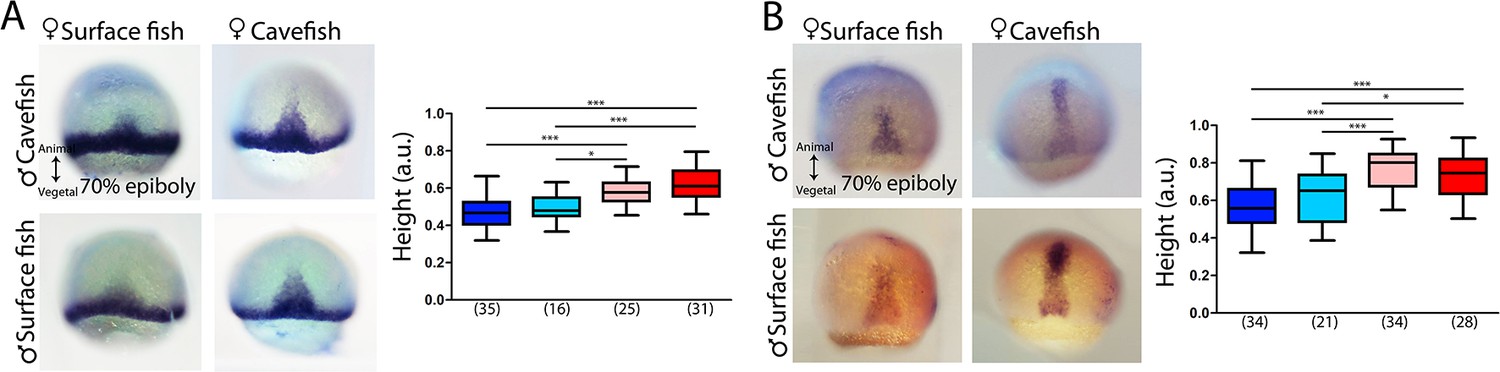
Maternal effect during mid-gastrulation.
Expression of ntl (A) and lefty1 (B) at 70% of epiboly. (A, B) HybSF (top left), cavefish (top right), surface fish (bottom left) and HybCF (bottom right). Quantification of height in ntl- (A, right) and lefty1-labeled (B, right) embryos at 70% epiboly. Color code: surface fish, blue; HybSF, light blue; HybCF, pink; and cavefish, red.
Figure 7 with 1 supplement
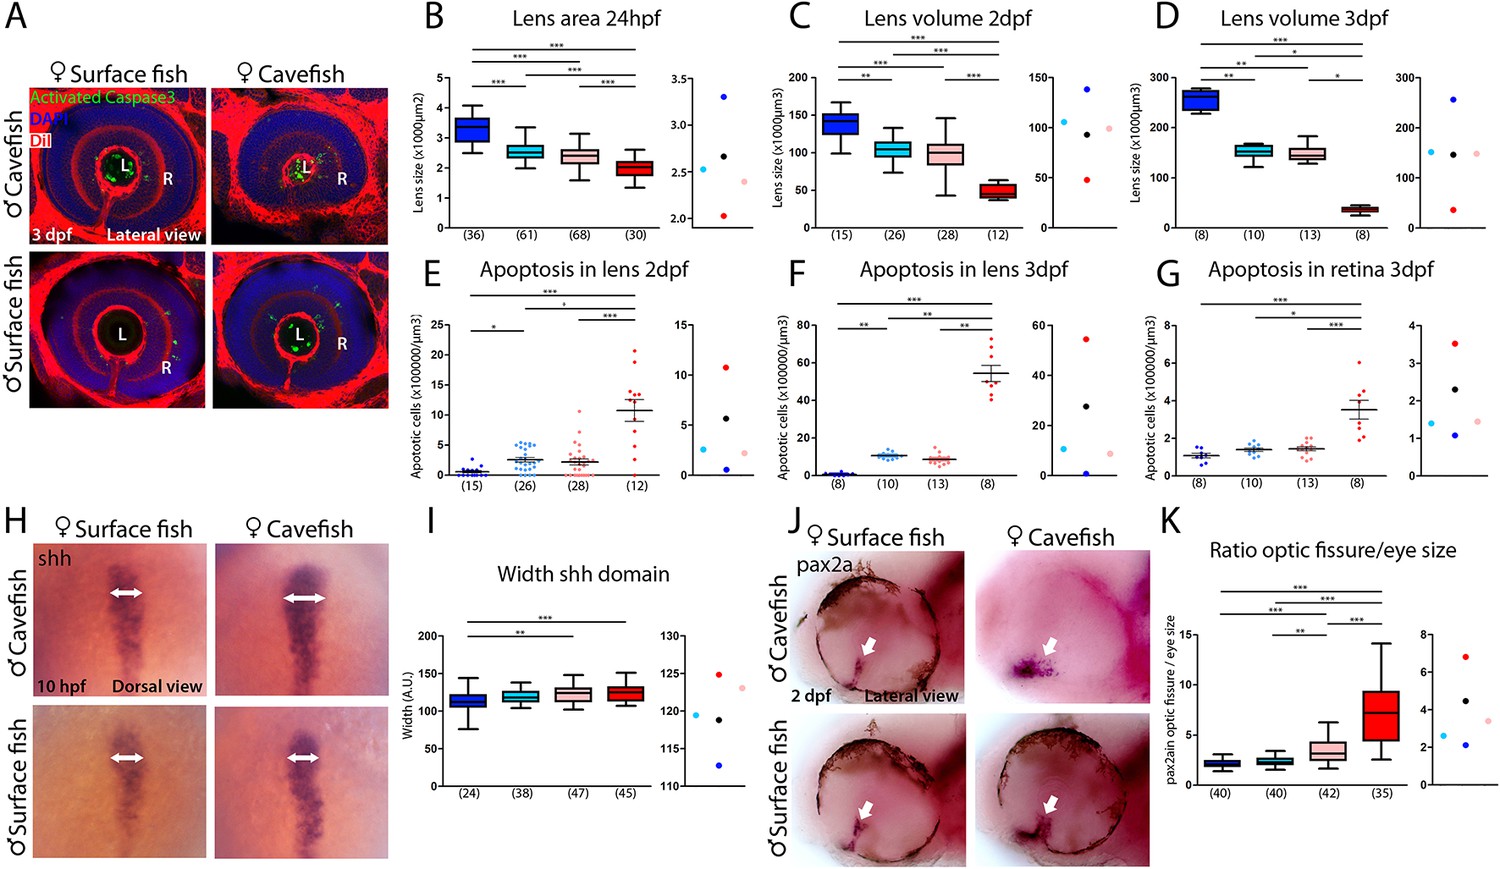
Maternal effect on eye development.
(A) Immunostaining of activated caspase three in the developing eye at 3 days post-fertilization (dpf). (B–D) Quantification of the size of the lens at 24 hpf (B, area), 2 dpf (C, volume) and 3 dpf (D, volume). (E–G) Quantification of the number of apoptotic cells per unit of volume in the lens at 2 dpf (E) and 3 dpf (F) and in the retina at 3 dpf (G). (H) Expression of Shh at 10 hpf. (I) Quantification of the width of the Shh expression domain (arrows in panel H). (J) Expression of Pax2a in the optic fissure (arrow) at 2 dpf. (K) Quantification of the size (area) of the Pax2a expression domain in the optic fissure normalized by the eye size (area). Embryos are arranged in panels (A, H and J) as follows: HybSF (top left), cavefish (top right), surface fish (bottom left) and HybCF (bottom right). In the quantifications, HybSF, cavefish, surface fish and HybCF are colored light blue, red, blue and pink, respectively. A plot of means is shown to the right of each graph. Images in panels (A) and (J) correspond to lateral views of the eye, anterior to the left. Images in panel (H) are whole-mounted embryos in dorsal views, anterior to the top. Kruskal-Wallis tests with Dunn’s post-test were performed in all cases.
Figure 7—figure supplement 1
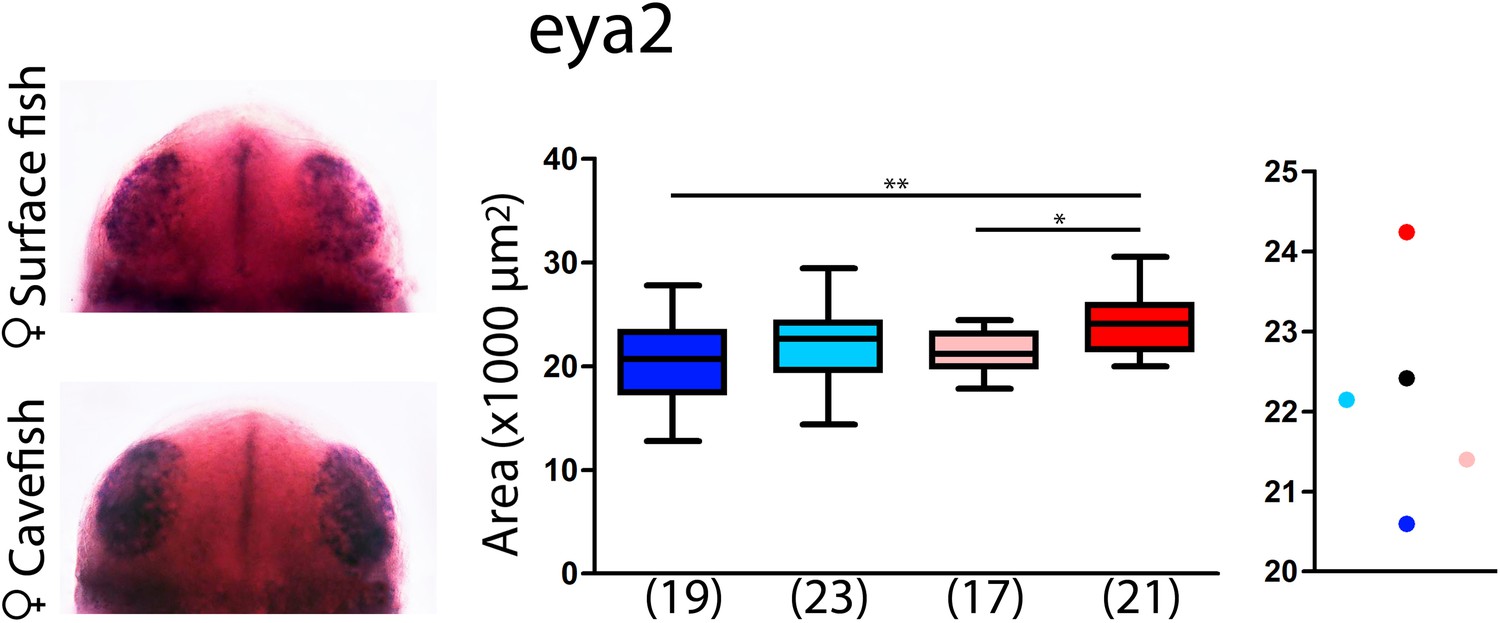
Maternal effect on the size of the developing olfactory epithelium.
Expression of eya2 in HybSF (left, on top) and HybCF (left, on bottom) at 24 hpf. Quantification of the size of the eya2 expression domain in the olfactory placodes (center) and the corresponding plot of means distribution (right). Embryos in panels (A–D) were dissected and mounted in ventral view, anterior upwards. Embryos in panels (E–H) are whole-mounted embryos in lateral view anterior to the left (E); in dorsal view, anterior upwards (G); or in frontal view, dorsal upwards (H). Kruskal-Wallis tests with Dunn’s post-test were performed.
Figure 8
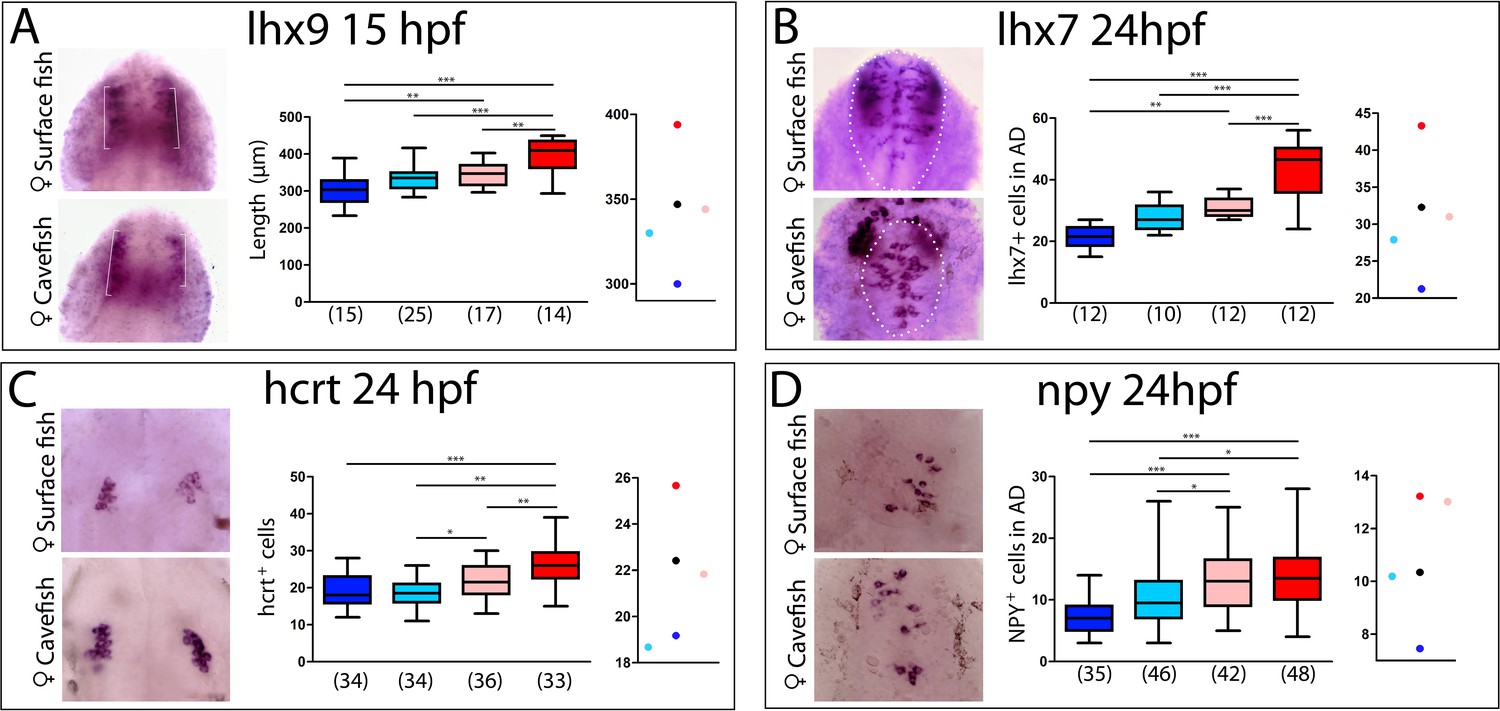
Maternal effect on the development of peptidergic systems.
(A) Expression of lhx9 in HybSF (left, on top) and HybCF (left, on bottom) at 15 hpf. Quantification of the length of the expression domain in the prospective hypothalamus (white brackets) (center) and the corresponding plot of means distribution (right). (B) Expression of lhx7 in HybSF (left, on top) and HybCF (left, on bottom) at 24 hpf, with the acroterminal domain indicated in dashed lines. Quantification of the number of lhx7-expressing cells in the acroterminal domain (center) and the corresponding plot of means distribution (right). (C) Expression of hcrt HybSF (left, on top) and HybCF (left, on bottom) at 24 hpf. Quantification of the number of hypothalamic hcrt-expressing cells (center) and the corresponding plot of means distribution (right). (D) Expression of NPY in HybSF (left, on top) and HybCF (left, on bottom) at 24 hpf in the acroterminal domain. Quantification of the number of NPY-expressing cells (center) and the corresponding plot of means distribution (right). Kruskal-Wallis tests with Dunn’s post-test were performed in all cases.
Figure 9 with 1 supplement
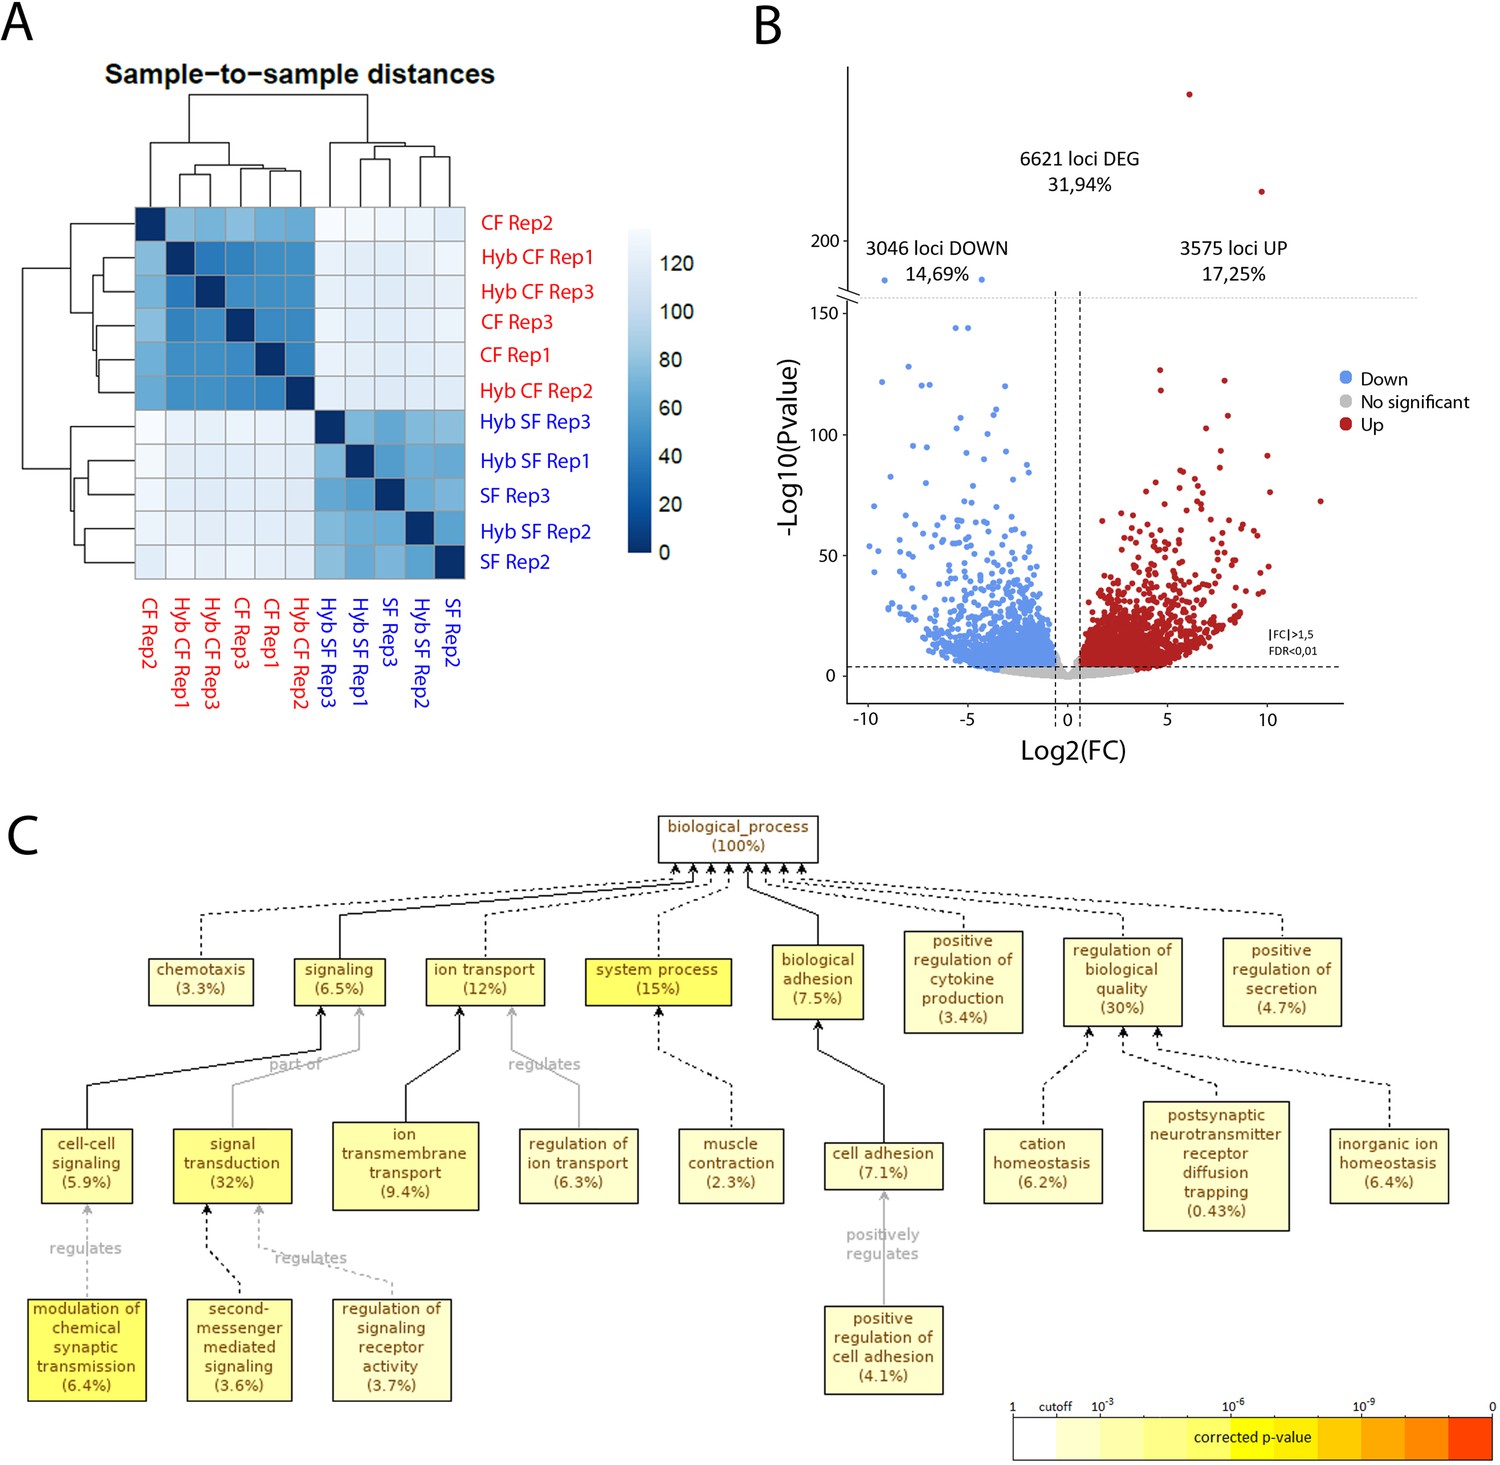
RNA-sequencing of the maternal mRNA of surface fish (SF), cavefish (CF) and reciprocal F1 hybrid (HybSF and HybCF) eggs at the 2-cell stage.
(A) Sample-to-sample distance between all samples. Samples that are similar are close to each other. On the scale, lower numbers (dark blue) indicate a closer relationship between samples than higher numbers (light blue/white). (B) Volcano plot of expressed genes at the 2-cell stage (n = 20.730). Genes that have an absolute fold change >1.5 and an adjusted p-value (FDR) <0.01 are considered to be differentially expressed in cavefish compared to surface fish. Genes that are upregulated in cavefish are in red, whereas those that are downregulated in cavefish are in blue. (C) Gene ontology enrichment (level: Biological Process) for cavefish DEGs with an absolute fold change higher than 5. Black lines correspond to ‘is a’ relationship, whereas gray lines correspond to the annotated relationship. Full lines correspond to a direct relationship and dashed lines to an indirect relationship (i.e. some nodes are hidden). The color of a node refers to the adjusted p-value (FDR) of the enriched GO term and the percentage corresponds to the frequency of the GO term in the studied gene set at the level considered. A given gene can have several GO terms. Only enriched GO terms that pass the threshold (p-value<0.01) are displayed on the graph.
Figure 9—figure supplement 1
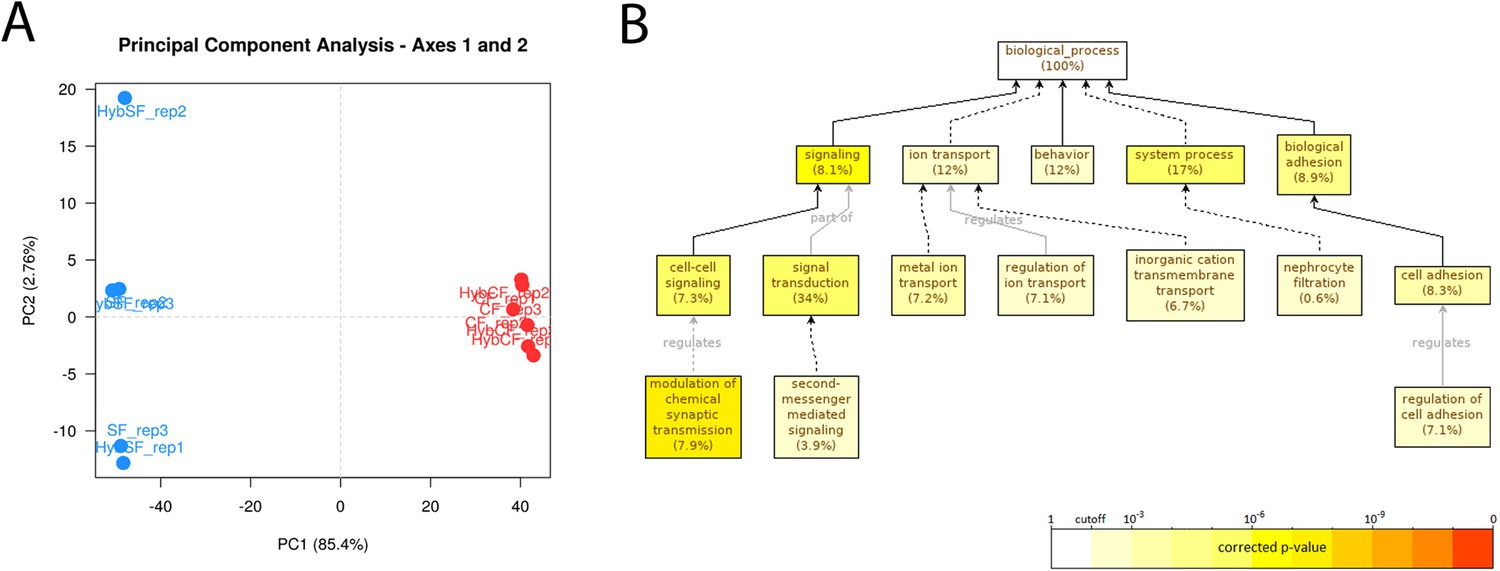
PCA analyses of samples used for RNAseq and GO analyses.
(A) Principal component analysis (PCA) of all the samples for PC1 and PC2. Blue dots correspond to samples coming from a female surface fish and red dots to samples coming from female cavefish, irrespective of the morphotype of the male parent. Note that PC1 and PC2 represent 85.4% and 2.7% of the variation, respectively. (B) GO Enrichment graph for a subset of cavefish that are upregulated differentially expressed genes (DEGs), with a fold change higher than 5. Black lines correspond to ‘is_a’ relationship whereas gray lines correspond to the annotated relationship. Full lines correspond to a direct relationship and dashed lines to an indirect relationship (i.e. some nodes are hidden). The color of a node refers to the adjusted p-value (corrected for false discovery rate [FDR]) of the enriched GO term and the percentage corresponds to the frequency of the GO term in the studied gene set at the level considered. A given gene can have several GO terms. Only enriched GO terms that pass the threshold (p-value<0.01) are displayed on the graph.
Additional files
-
Supplementary file 1
Supplementary tables including the raw quantifications.
- https://cdn.elifesciences.org/articles/50160/elife-50160-supp1-v2.xlsx
-
Transparent reporting form
- https://cdn.elifesciences.org/articles/50160/elife-50160-transrepform-v2.docx
Download links
A two-part list of links to download the article, or parts of the article, in various formats.
Downloads (link to download the article as PDF)
Open citations (links to open the citations from this article in various online reference manager services)
Cite this article (links to download the citations from this article in formats compatible with various reference manager tools)
Maternally regulated gastrulation as a source of variation contributing to cavefish forebrain evolution
eLife 8:e50160.
https://doi.org/10.7554/eLife.50160


