Metabolic modulation regulates cardiac wall morphogenesis in zebrafish
- Max Planck Institute for Heart and Lung Research, Germany
- Weizmann Institute of Science, Israel
Figures
Figure 1 with 3 supplements
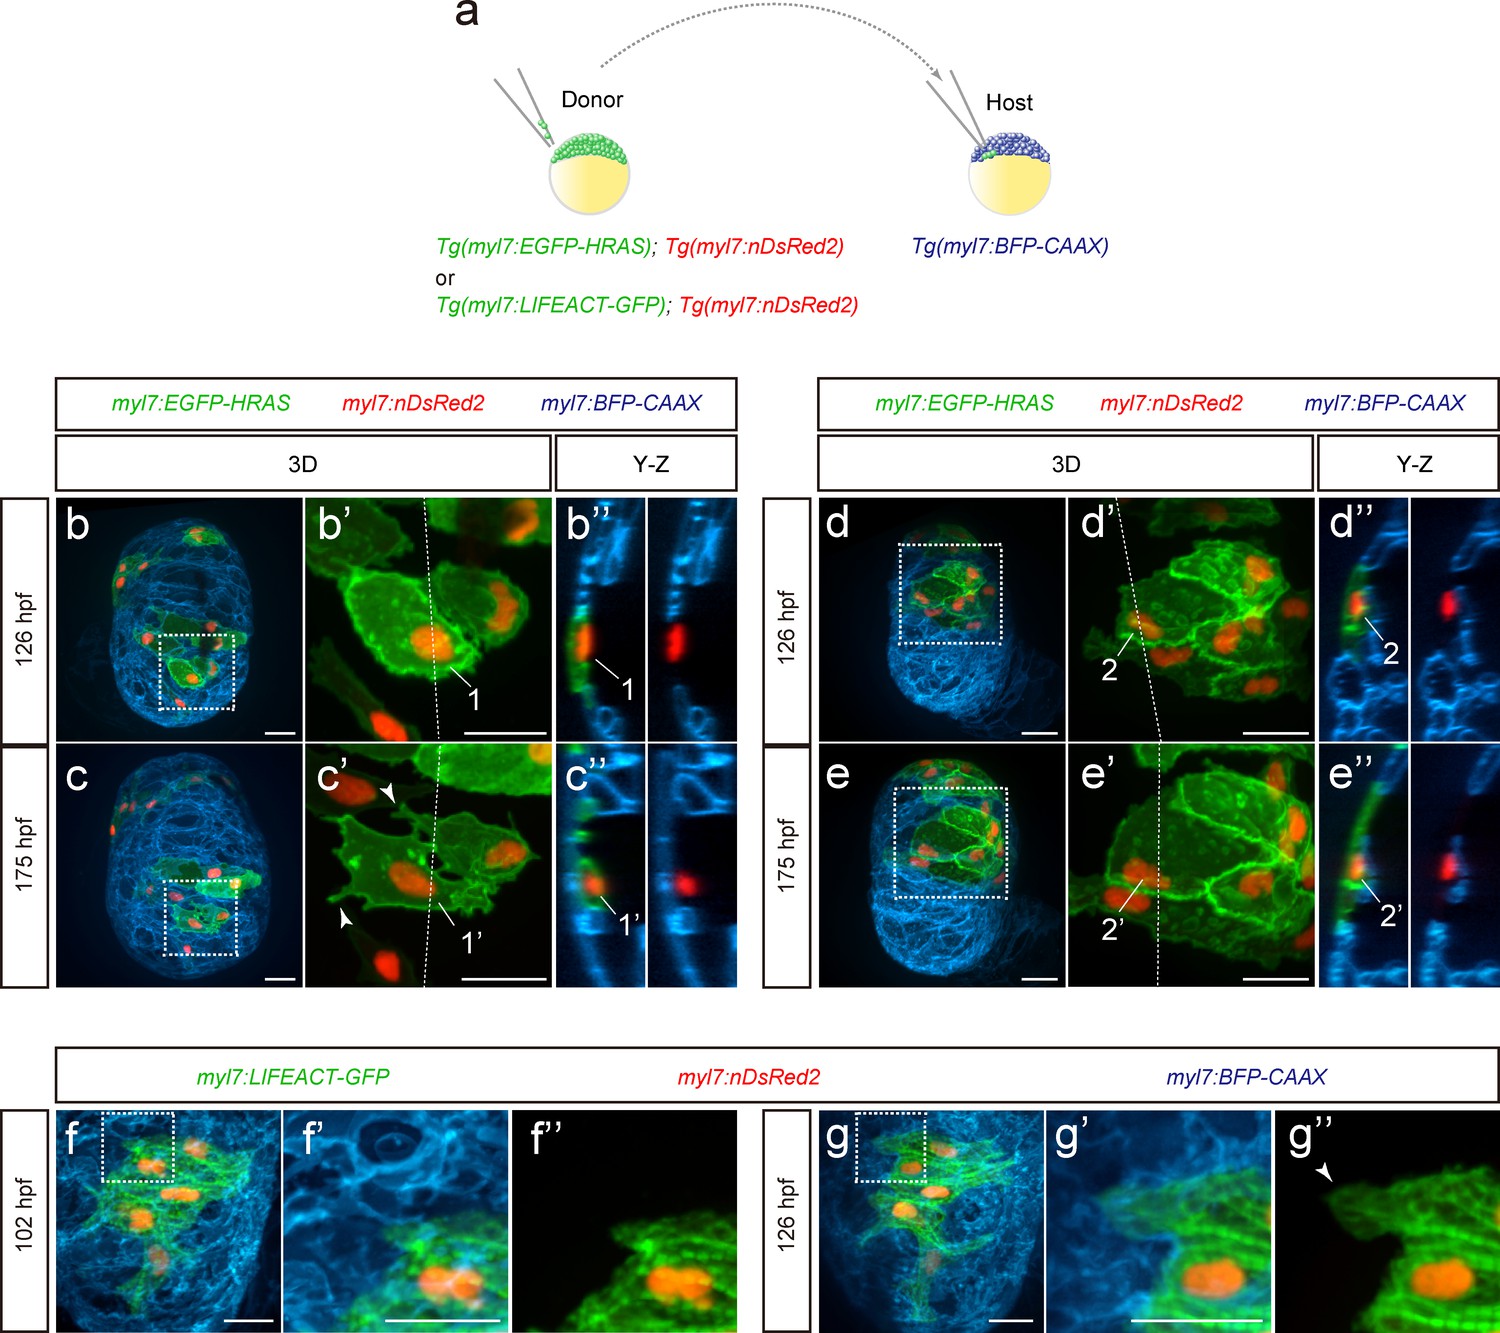
Cardiomyocyte behavior during cardiac trabeculation.
(a) Schematic of the transplantation experiment. (b–e) 3D time-course images of chimeric hearts; magnified view (b’, c’, d’, e’) of area in white boxes and Y-Z plane images (b”, c”, d”, e”) along white dashed lines (b’, c’, d’, e’). CMs initially in the compact layer (b’, b”) enter the trabecular layer (c’, c”) exhibiting morphological changes and membrane protrusions (c’; arrowheads; n = 5 CMs); CMs remaining in the compact layer (d’, d”, e’, e”) do not exhibit obvious morphological changes (n = 5 CMs). The same CMs are shown at 126 and 175 hpf as indicated in the images. (f, g) 3D time-course images of chimeric heart; magnified view (f’, f”, g’, g”) of area in white boxes. CMs entering the trabecular layer exhibit partial disassembly of their sarcomeres (g’; arrowhead). Scale bars, 20 μm.
Figure 1—figure supplement 1
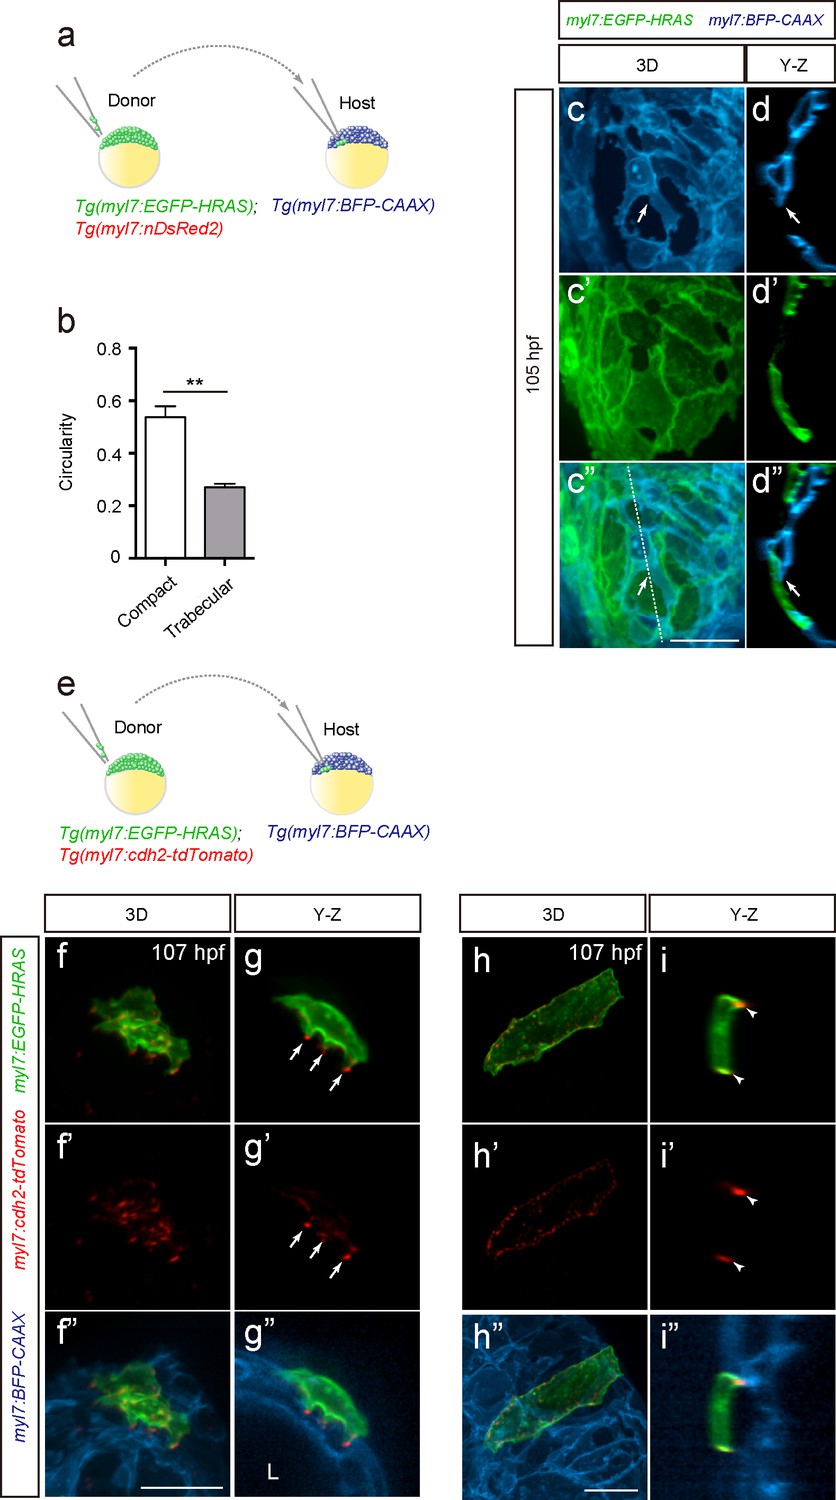
Cardiomyocytes change morphology and exhibit cell-cell junction rearrangements when entering the trabecular layer.
(a) Schematic of the transplantation experiment. (b) Circularity analysis of CMs in the compact and trabecular layers (n = 7–9 CMs from 3 to 5 ventricles). (c–c”) 3D images of chimeric hearts; Y-Z plane images (d–d”) along white dashed line (c”). A host-derived CM entering the trabecular layer exhibits membrane protrusions (c, d, c’, d’; arrows). (e) Schematic of the transplantation experiment. (f–f”, h–h”) 3D images of chimeric hearts; Y-Z plane images (g–g”, i–i”). A CM entering the trabecular layer exhibits N-cadherin localization in protruding membranes (g, g’; arrows), while a CM remaining in the compact layer exhibits lateral localization of N-cadherin (i, i’; arrowheads). L, cardiac lumen. Error bars, s.e.m.; **p<0.001 by two-tailed unpaired t-test. Scale bars, 20 μm.
Figure 1—video 1
Z-stack images of 126 hpf CMs related to Figure 1b’.
Figure 1—video 2
Z-stack images of 175 hpf CMs related to Figure 1c’.
Figure 2 with 2 supplements
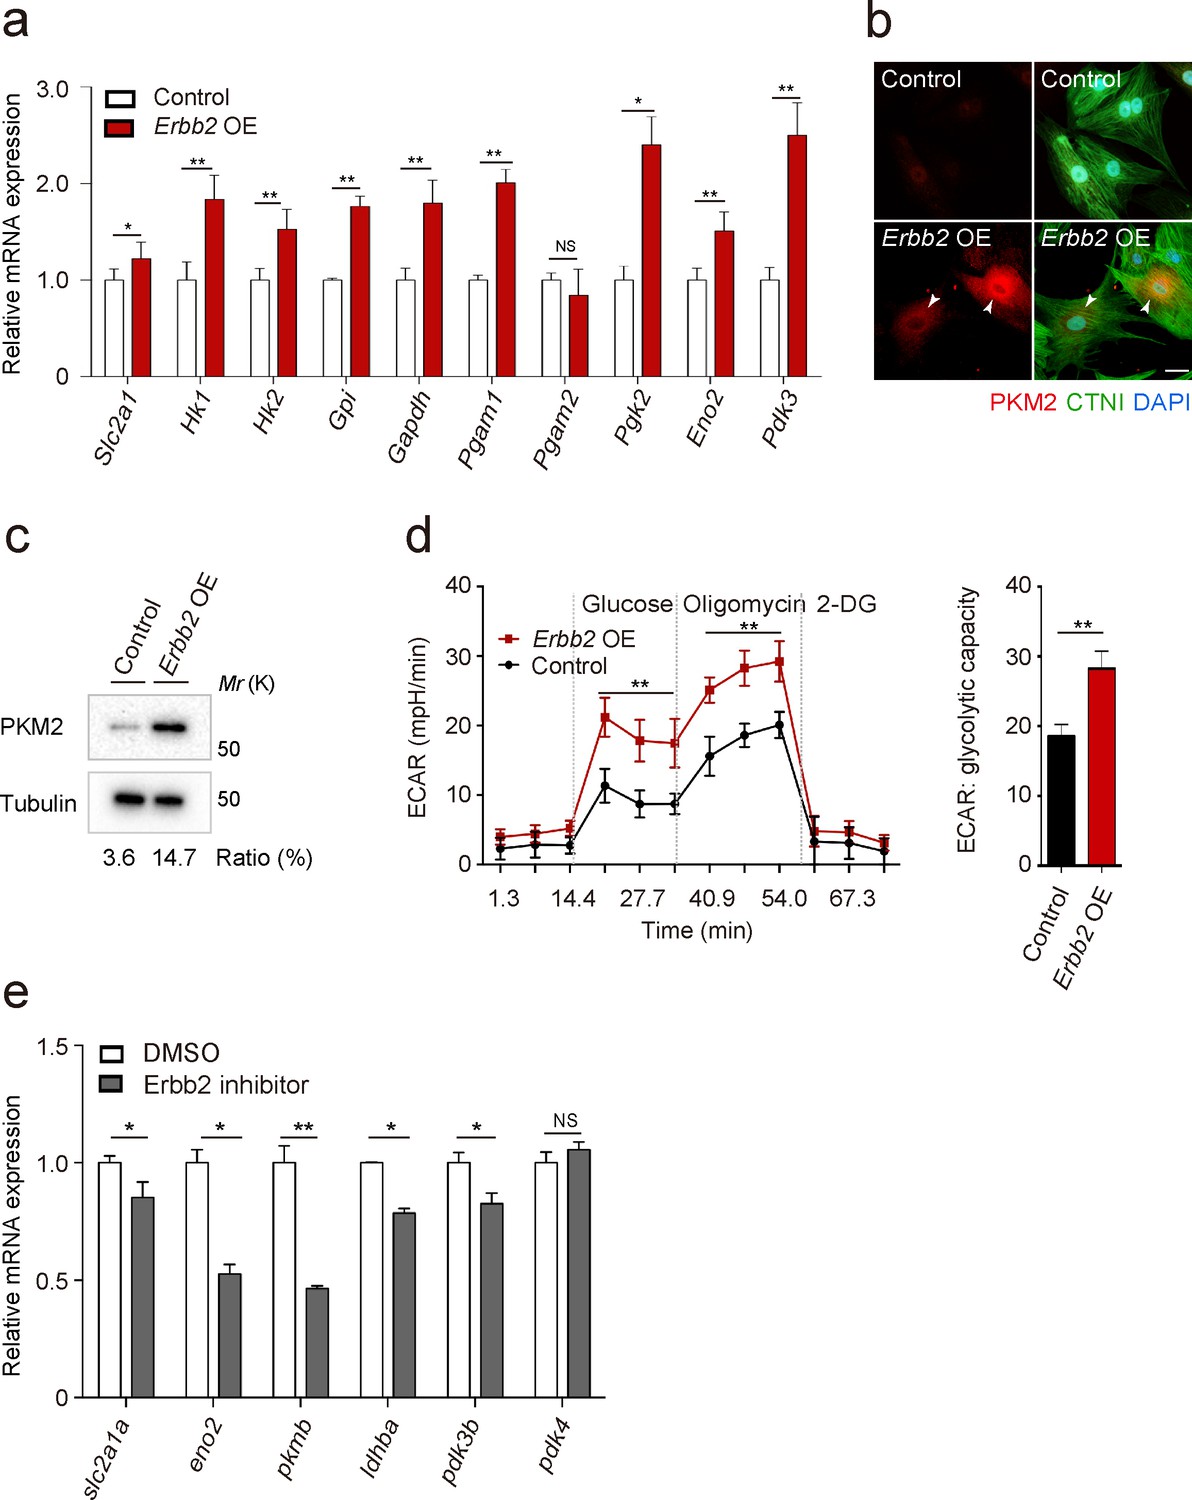
ERBB2 signaling activates glycolysis in cardiomyocytes.
(a) qPCR analysis of mRNA levels of glycolytic enzyme genes in control and Erbb2 overexpressing (OE) rat neonatal CMs (n = 3). Error bars, s.e.m. (b) Staining for PKM2, CTNI and DNA (DAPI) in control and Erbb2 OE rat neonatal CMs; arrowheads point to PKM2+ CMs. (c) Western blot analysis of PKM2 levels in control and Erbb2 OE rat neonatal CMs. (d) Extracellular acidification rate (ECAR) analysis in control and Erbb2 OE rat neonatal CMs; glycolytic capacity shown on the right (n = 7). Error bars, s.d. (e) qPCR analysis of mRNA levels of glycolytic enzyme genes in DMSO and Erbb2 inhibitor treated zebrafish hearts (n = 3). Error bars, s.e.m.; *p<0.05 and **p<0.001 by two-tailed unpaired t-test. NS, not significant. Scale bar, 20 μm.
-
Figure 2—source data 1
Mass spectrometry data.
P7 WT and CAERBB2 OE mouse hearts were isolated and protein expression levels analyzed by mass spectrometry. All presented proteins are statistically significant at p<0.05.
- https://cdn.elifesciences.org/articles/50161/elife-50161-fig2-data1-v2.docx
-
Figure 2—source data 2
Primer sequences for qPCR analysis.
Primer sequences used in Figure 2a and e.
- https://cdn.elifesciences.org/articles/50161/elife-50161-fig2-data2-v2.docx
-
Figure 2—source data 3
Mean Ct values of qPCR analysis in Figure 2a and e.
- https://cdn.elifesciences.org/articles/50161/elife-50161-fig2-data3-v2.docx
Figure 2—figure supplement 1
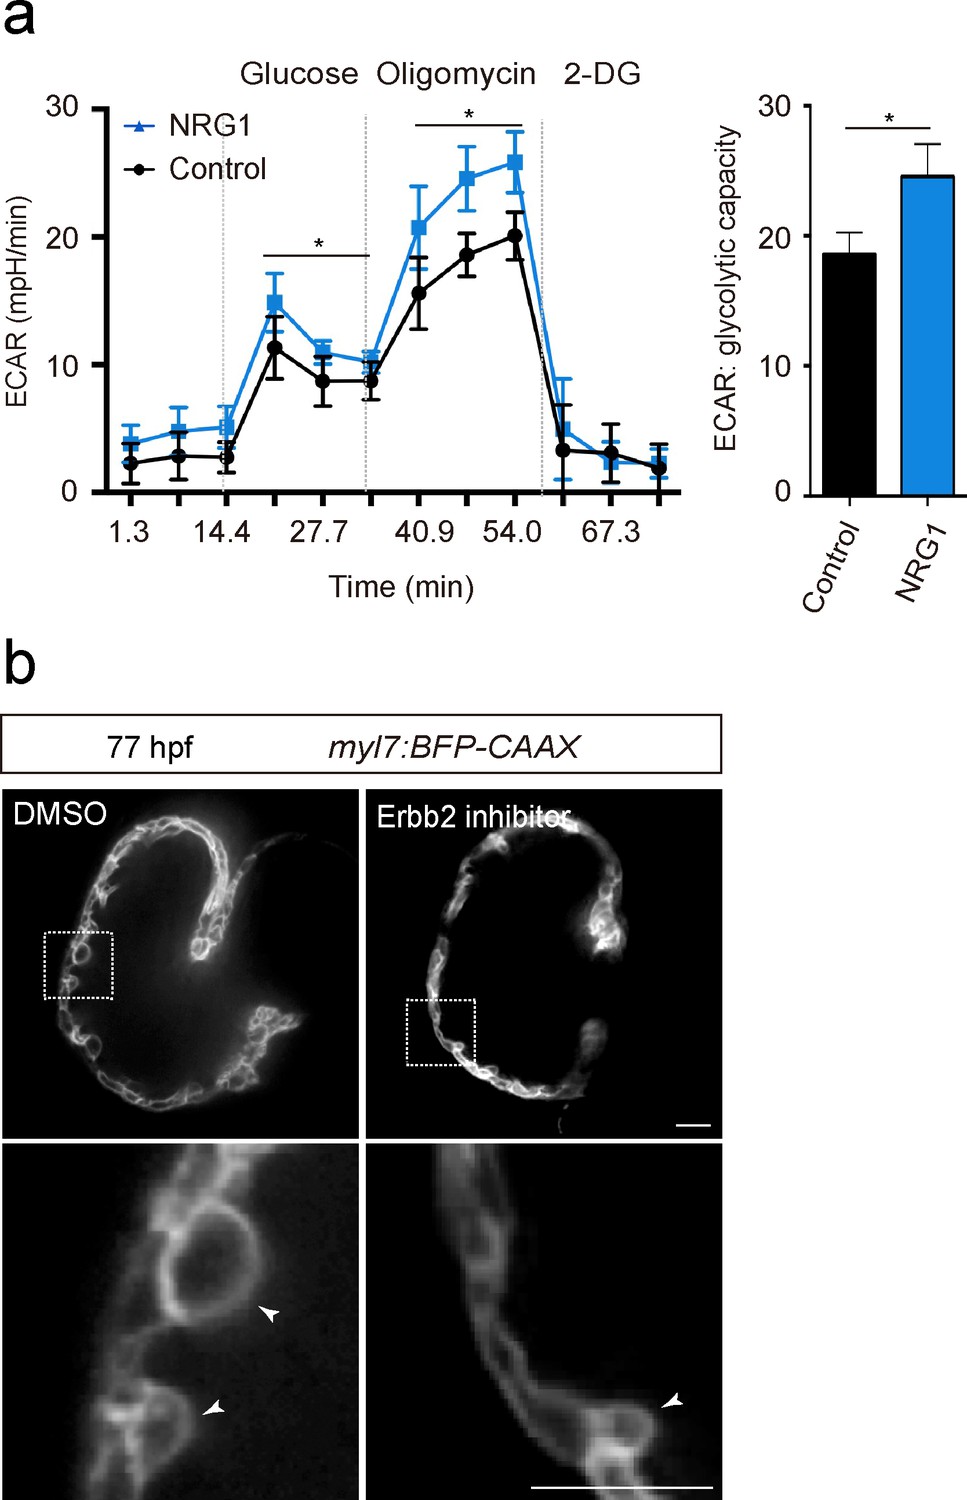
NRG1/ERBB2 signaling activates glycolysis in CMs.
(a) ECAR analysis in control and NRG1 treated rat neonatal CMs; glycolytic capacity shown on the right (n = 7). (b) Confocal images (mid-sagittal sections) of 77 hpf zebrafish hearts treated with DMSO or Erbb2 inhibitor; magnified view of area in white boxes shown below; arrowheads point to CMs in the trabecular layer. Error bars, s.d.; *p<0.05 by two-tailed unpaired t-test. Scale bars, 20 μm.
Figure 2—figure supplement 2
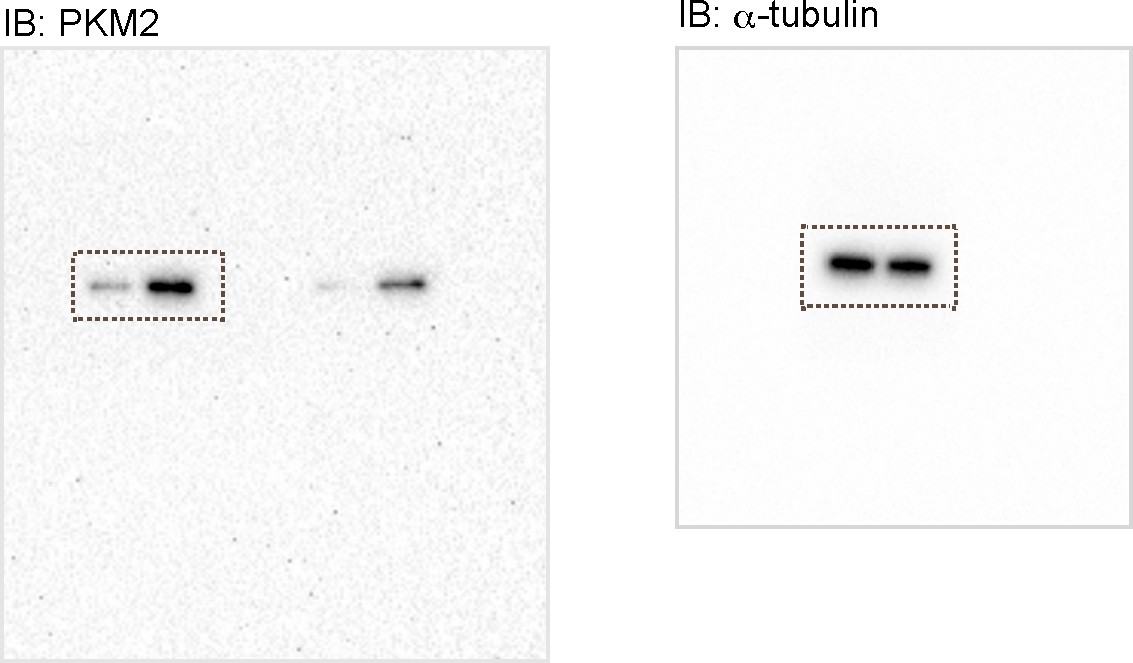
Uncropped images related to western blotting data.
Figure 3 with 1 supplement
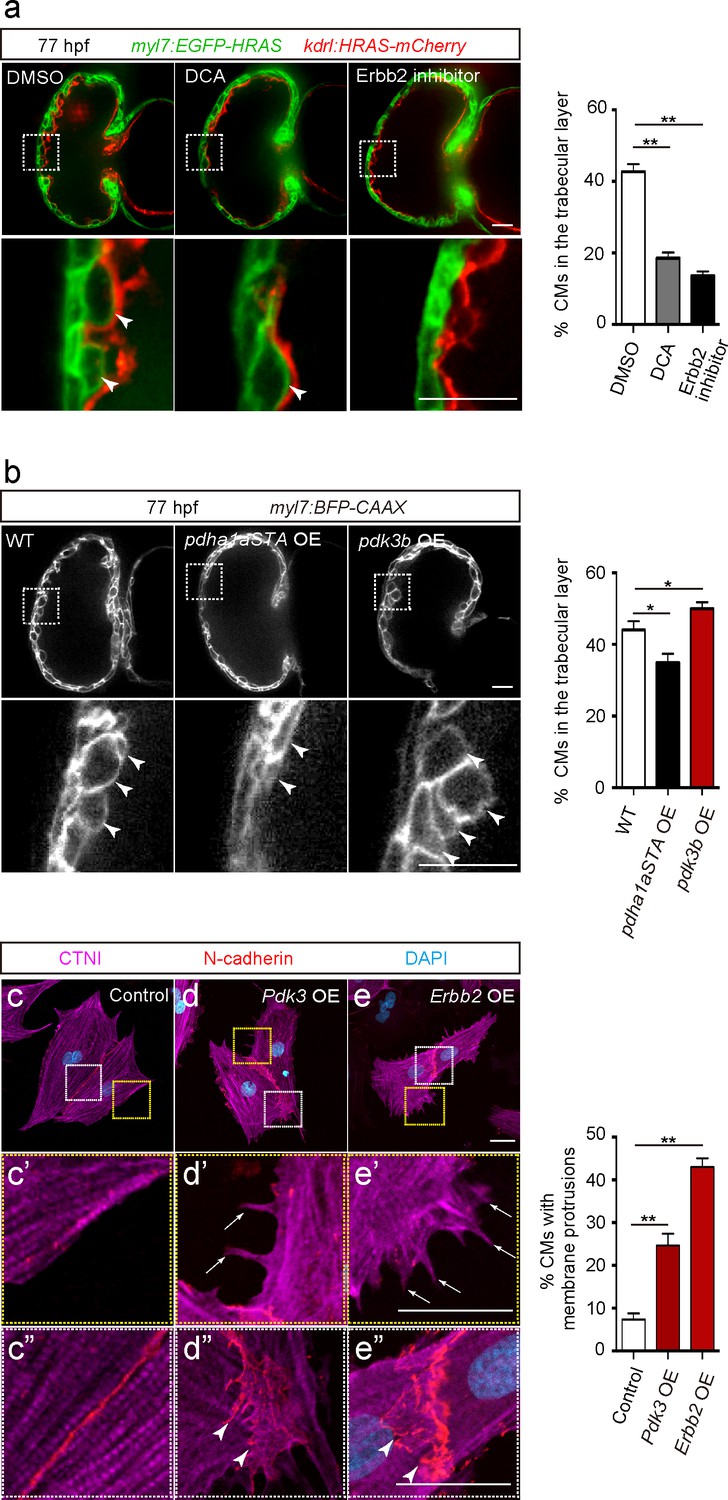
Glycolysis regulates cardiac trabeculation.
(a) Confocal images (mid-sagittal sections) of 77 hpf hearts treated with DMSO, dichloroacetate (DCA) or Erbb2 inhibitor; magnified view of area in white boxes shown below; arrowheads point to CMs in the trabecular layer; percentage of CMs in the trabecular layer shown on the right (n = 5–7 ventricles). (b) Confocal images (mid-sagittal sections) of 77 hpf Tg(myl7:BFP-CAAX) alone or in combination with Tg(myl7:pdha1aSTA-P2A-tdTomato) or Tg(myl7:pdk3b-P2A-tdTomato) hearts; magnified view of area in white boxes shown below; arrowheads point to CMs in the trabecular layer; percentage of CMs in the trabecular layer shown on the right (n = 5–7 ventricles). (c–e”) Staining for CTNI, N-cadherin and DNA (DAPI) in control (c), Pdk3 (d) and Erbb2 (e) OE rat neonatal CMs; magnified view of area in yellow (c’, d’, e’) and white (c”, d”, e”) boxes; percentage of CMs exhibiting membrane protrusions shown on the right (n = 3 individual experiments; each value corresponds to an average of 30 CMs). Pdk3 and Erbb2 OE causes rat neonatal CMs to exhibit membrane protrusions (d’, e’; arrows) and cell-cell junction rearrangements (d’, e’; arrowheads). Error bars, s.e.m.; *p<0.05 and **p<0.001 by ANOVA followed by Tukey’s HSD test. Scale bars, 20 μm.
Figure 3—figure supplement 1
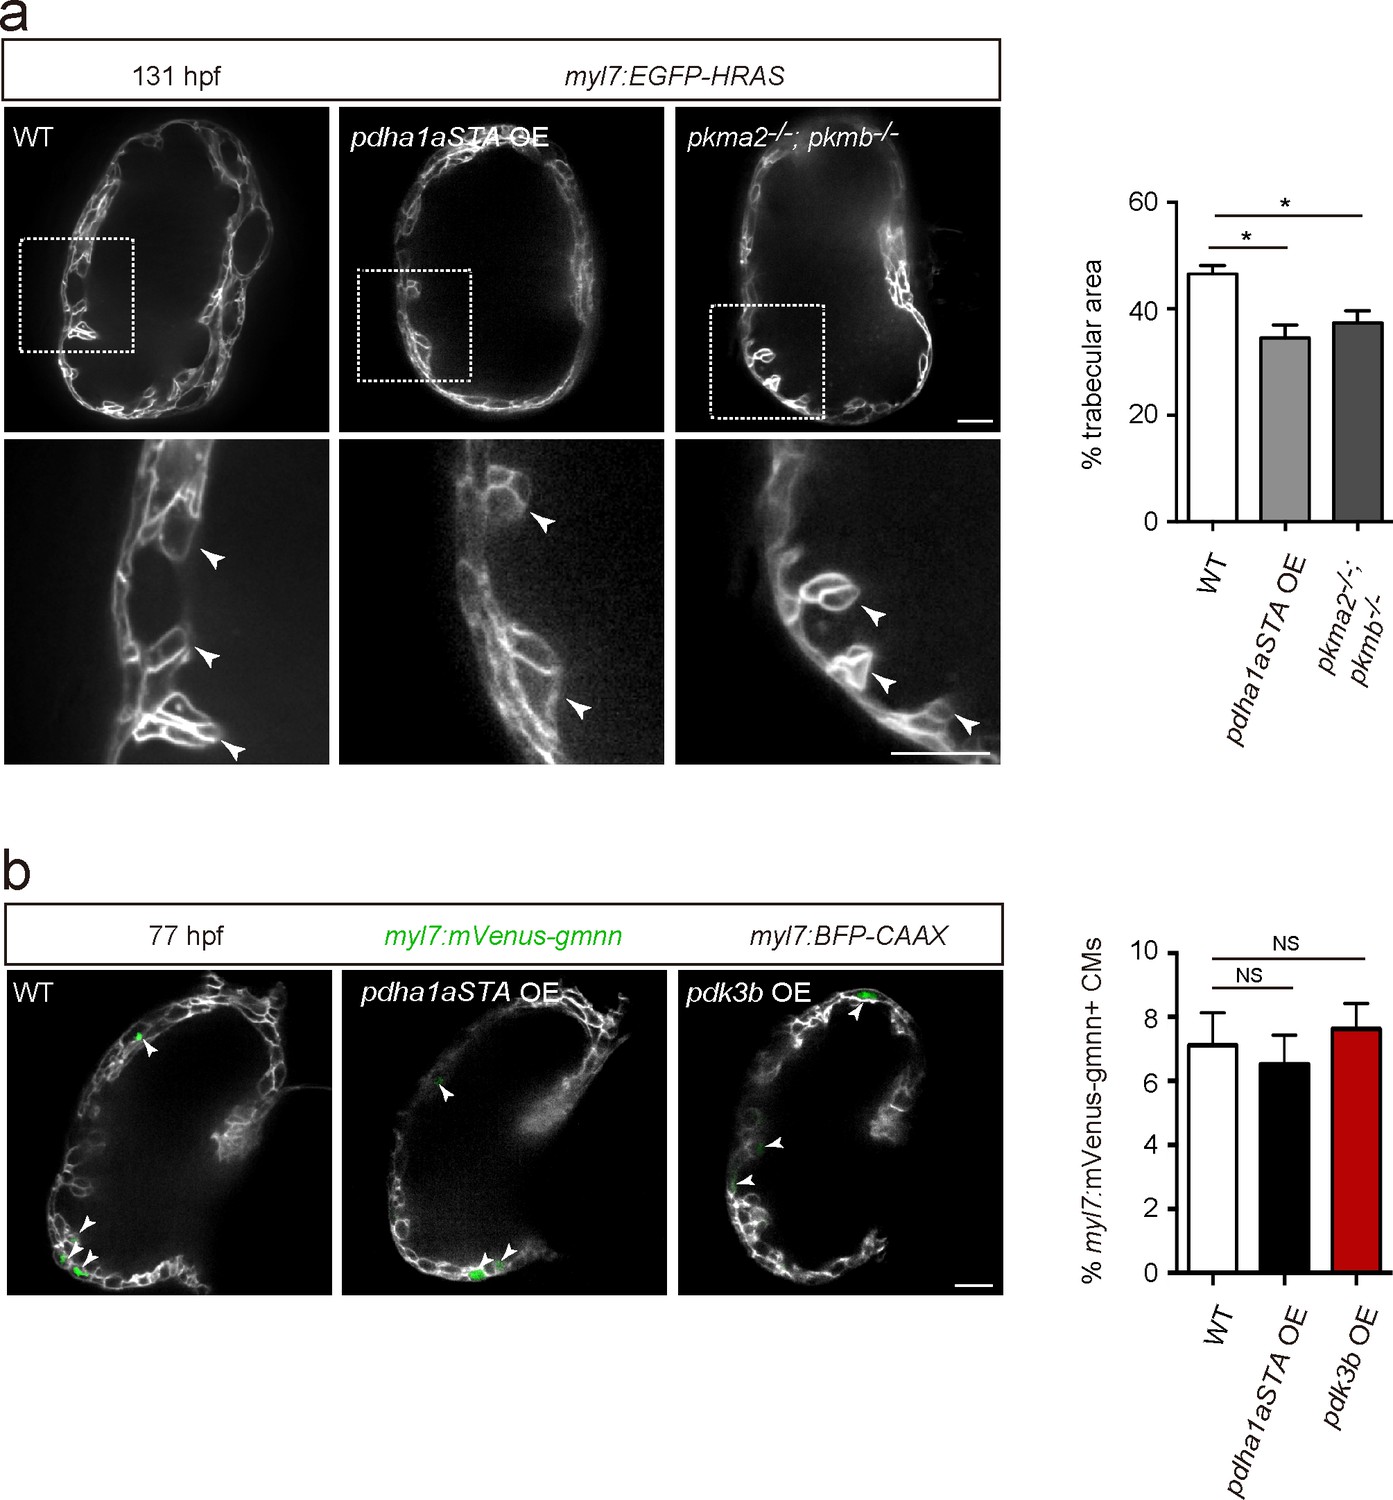
Cardiomyocyte proliferation does not appear to be affected by modulation of glycolysis.
(a) Confocal images (mid-sagittal sections) of 131 hpf Tg(myl7:EGFP-HRAS) alone or in combination with Tg(myl7:pdha1aSTA-P2A-tdTomato) and of 131 hpf Tg(myl7:EGFP-HRAS); pkma2-/-; pkmb-/- hearts; magnified view of area in white boxes shown below; arrowheads point to trabecular CMs; percentage of trabecular area shown on the right (n = 5 ventricles). (b) Confocal images (mid-sagittal sections) of 77 hpf Tg(myl7:mVenus-gmnn); Tg(myl7:BFP-CAAX) alone or in combination with Tg(myl7:pdha1aSTA-P2A-tdTomato) or Tg(myl7:pdk3b-P2A-tdTomato) hearts; arrowheads point to myl7:mVenus-Gmnn+ CMs; percentage of myl7:mVenus-Gmnn + CMs shown on the right (n = 5 ventricles). Error bars, s.e.m.; *p<0.05 and **p<0.001 by two-tailed unpaired t-test (a) or ANOVA followed by Tukey’s HSD test (b). NS, not significant. Scale bars, 20 μm.
Figure 4 with 1 supplement
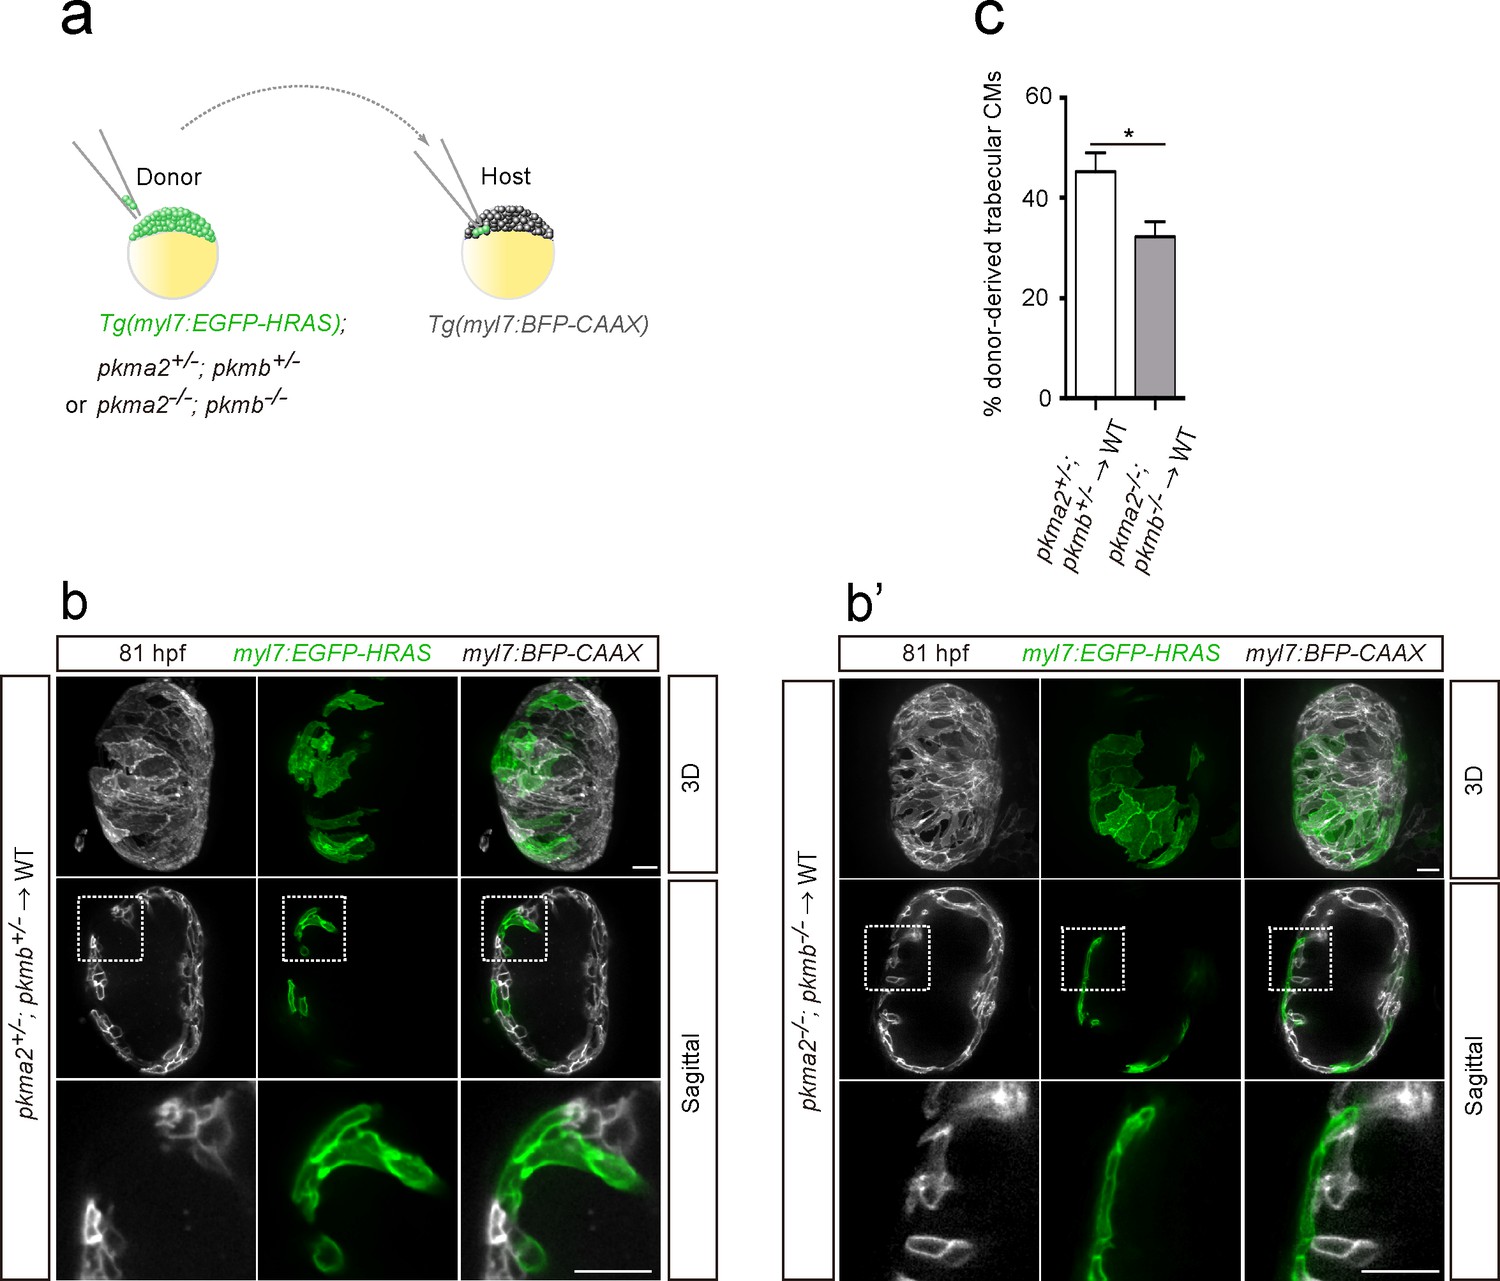
Loss of pkm2 impairs cardiac trabeculation.
(a) Schematic of the transplantation experiment. (b, b’) 3D and mid-sagittal section images of chimeric hearts using pkma2+/-; pkmb+/-; Tg(myl7:EGFP-HRAS) (b) and pkma2-/-; pkmb-/-; Tg(myl7:EGFP-HRAS) (b’) cells as donors; magnified view of area in white boxes shown below. (c) Percentage of donor-derived trabecular CMs (n = 10 ventricles). Error bars, s.e.m.; *p<0.05 by two-tailed unpaired t-test. Scale bars, 20 μm.
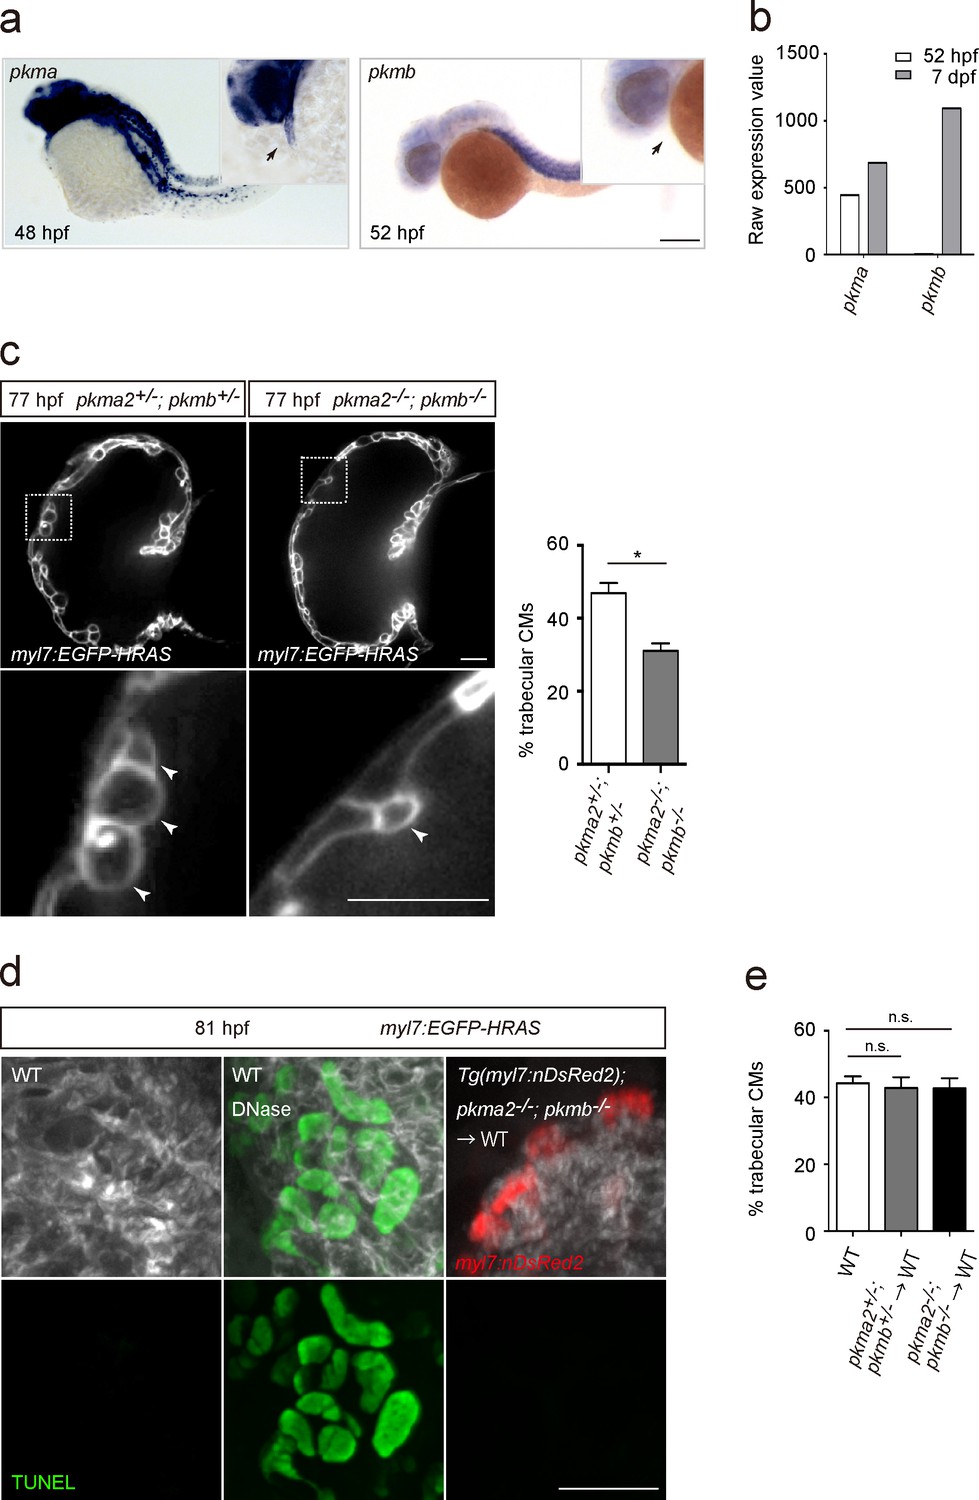
Figure 4—figure supplement 1
Glycolytic enzymes regulate cardiac trabeculation.
(a) Analysis of pkma and pkmb mRNA expression by in situ hybridization; magnified view shown in the top right corner; arrows point to the heart. (b) Expression levels of pkma and pkmb in 52 hpf and seven dpf hearts as detected by microarray analysis. (c) Confocal images (mid-sagittal sections) of 77 hpf Tg(myl7:EGFP-HRAS); pkma2+/-; pkmb+/- and Tg(myl7:EGFP-HRAS); pkma2-/-; pkmb-/- hearts; magnified view of area in white boxes shown below; arrowheads point to CMs in the trabecular layer; percentage of CMs in the trabecular layer shown on the right (n = 5–7 ventricles). (d) TUNEL assay in WT and chimeric hearts using Tg(myl7:nDsRed2); pkma2-/-; pkmb-/- cells as donors. As a positive control for the TUNEL assay, WT embryos were treated with DNase. (e) Percentage of trabecular CMs in WT and chimeric hearts using pkma2+/-; pkmb+/- or pkma2-/-; pkmb-/- cells as donors (n = 5 ventricles). Error bars, s.e.m.; *p<0.05 by two-tailed unpaired t-test (c) or ANOVA followed by Tukey’s HSD test (e). Scale bars, 200 μm in a; 20 μm in c and d.
Author response image 1
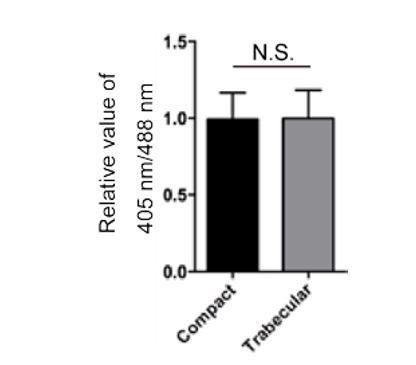
Redox analysis.
70 hpf Tg(myl7:mitochondrial-Rogofp2Orp1) hearts were examined and 405 nm/488 nm ratios determined for redox state analysis. Relative values of 405 nm/488 nm in compact and trabecular cardiomyocytes are shown.
Tables
Key resources table
| Reagent type (species) or resource | Designation | Source or reference | Identifiers | Additional information |
|---|---|---|---|---|
| Genetic reagent (Danio rerio) | pkma2s717 | Stone et al., 2018 | ||
| Genetic reagent (Danio rerio) | pkmbs718 | Stone et al., 2018 | ||
| Gene (Danio rerio) | pdk3b | NM_001080688 | ||
| Gene (Danio rerio) | pdha1a | NM_213393 | ||
| Gene (Rattus norvegicus) | Pdk3 | NM_001106581 | ||
| Gene (Homo sapiens) | ERBB2 | NM_004448 | ||
| Antibody | anti-Cardiac Troponin I (Goat polyclonal) | Abcam | AB_880622 Cat# ab56357 | IF(1:500) |
| Antibody | anti-PKM2 (Rabbit monoclonal) | Cell Signaling | AB_1904096 Cat# D78A4 | IF(1:100) WB(1:1000) |
| Chemical compound, drug | Sodium dichloroacetate | Sigma Aldrich | 347795 | |
| Software, algorithm | Zen 2012 (Blue edition) | Carl Zeiss Microscopy | Version 1.1.2.0 | |
| Software, algorithm | Imaris x64 | Bitplane | Version 9.3.0 | |
| Other | DAPI stain | Sigma | D954 | (1 µg/mL) |
Additional files
Download links
A two-part list of links to download the article, or parts of the article, in various formats.
Downloads (link to download the article as PDF)
Open citations (links to open the citations from this article in various online reference manager services)
Cite this article (links to download the citations from this article in formats compatible with various reference manager tools)
Metabolic modulation regulates cardiac wall morphogenesis in zebrafish
eLife 8:e50161.
https://doi.org/10.7554/eLife.50161


