Activation of hedgehog signaling in mesenchymal stem cells induces cartilage and bone tumor formation via Wnt/β-Catenin
- Shanghai Jiao Tong University, Ministry of Education, China
- Shanghai Jiao Tong University Affiliated Sixth People's Hospital, China
- Harvard School of Dental Medicine, United States
- Renji Hospital, Shanghai Jiao Tong University, China
Figures
Figure 1
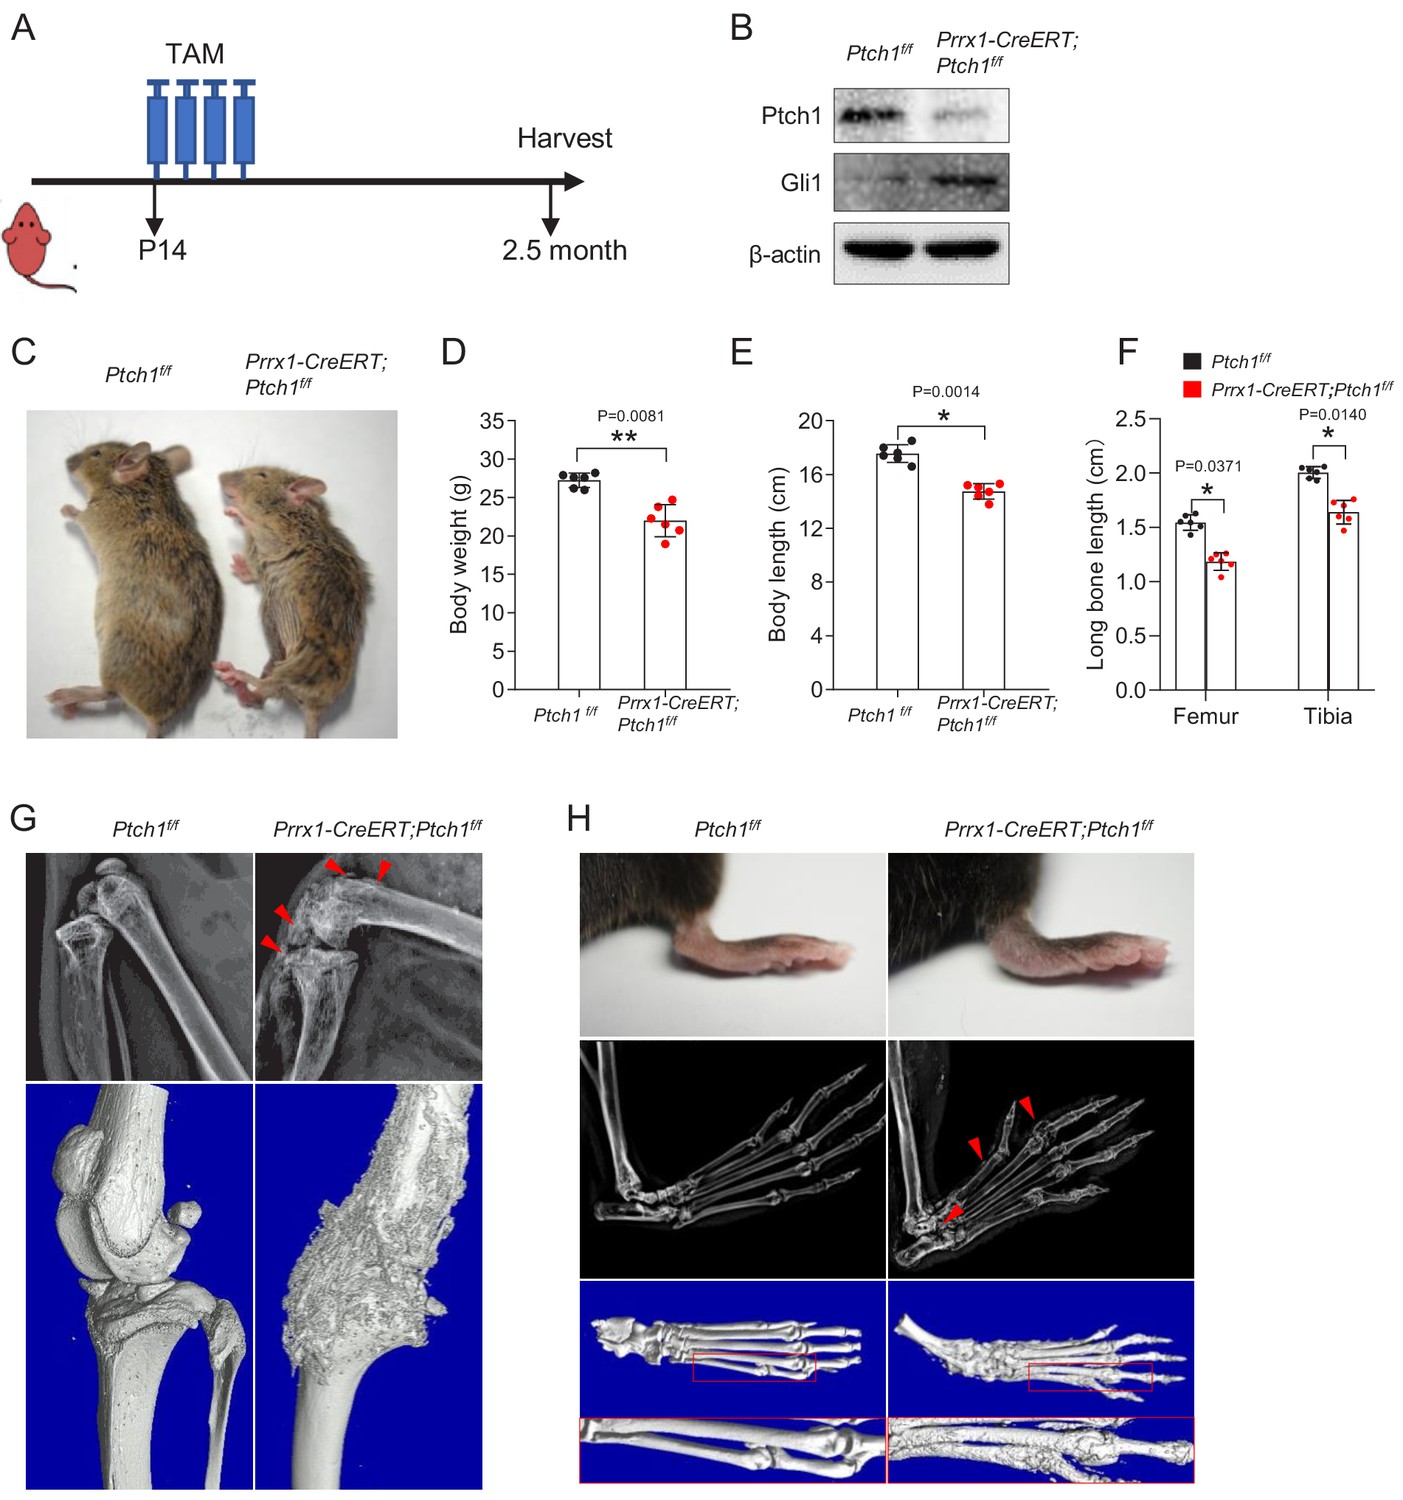
Ablation of Ptch1 in young mice led to joint deformation and exostoses.
(A) A schematic for the experimental design. (B) Western blot results showed that Ptch1 was largely deleted in BM MSCs and this led to an increase in Gli1 protein. (C) Prrx1-CreERT; Ptch1f/f mice appeared smaller than control littermates 2 months after TAM injection. (D) Prrx1-CreERT; Ptch1f/f mice showed a decrease in body weight compared with control littermates,**p<0.01, n = 6. (E) Prrx1-CreERT; Ptch1f/f mice showed a decrease in body length compared with control littermates, *p<0.05, n = 6. (F) Prrx1-CreERT; Ptch1f/f mice showed a decrease in femur length compared with control littermates, *p<0.05, n = 6. (G) Radiographic and micro-CT images of hindlimb showed joint deformation and exostoses in Prrx1-CreERT; Ptch1f/f mice. (H) Radiographic and micro-CT images of the paws showed joint deformation and exostoses in Prrx1-CreERT; Ptch1f/f mice.
Figure 2 with 2 supplements
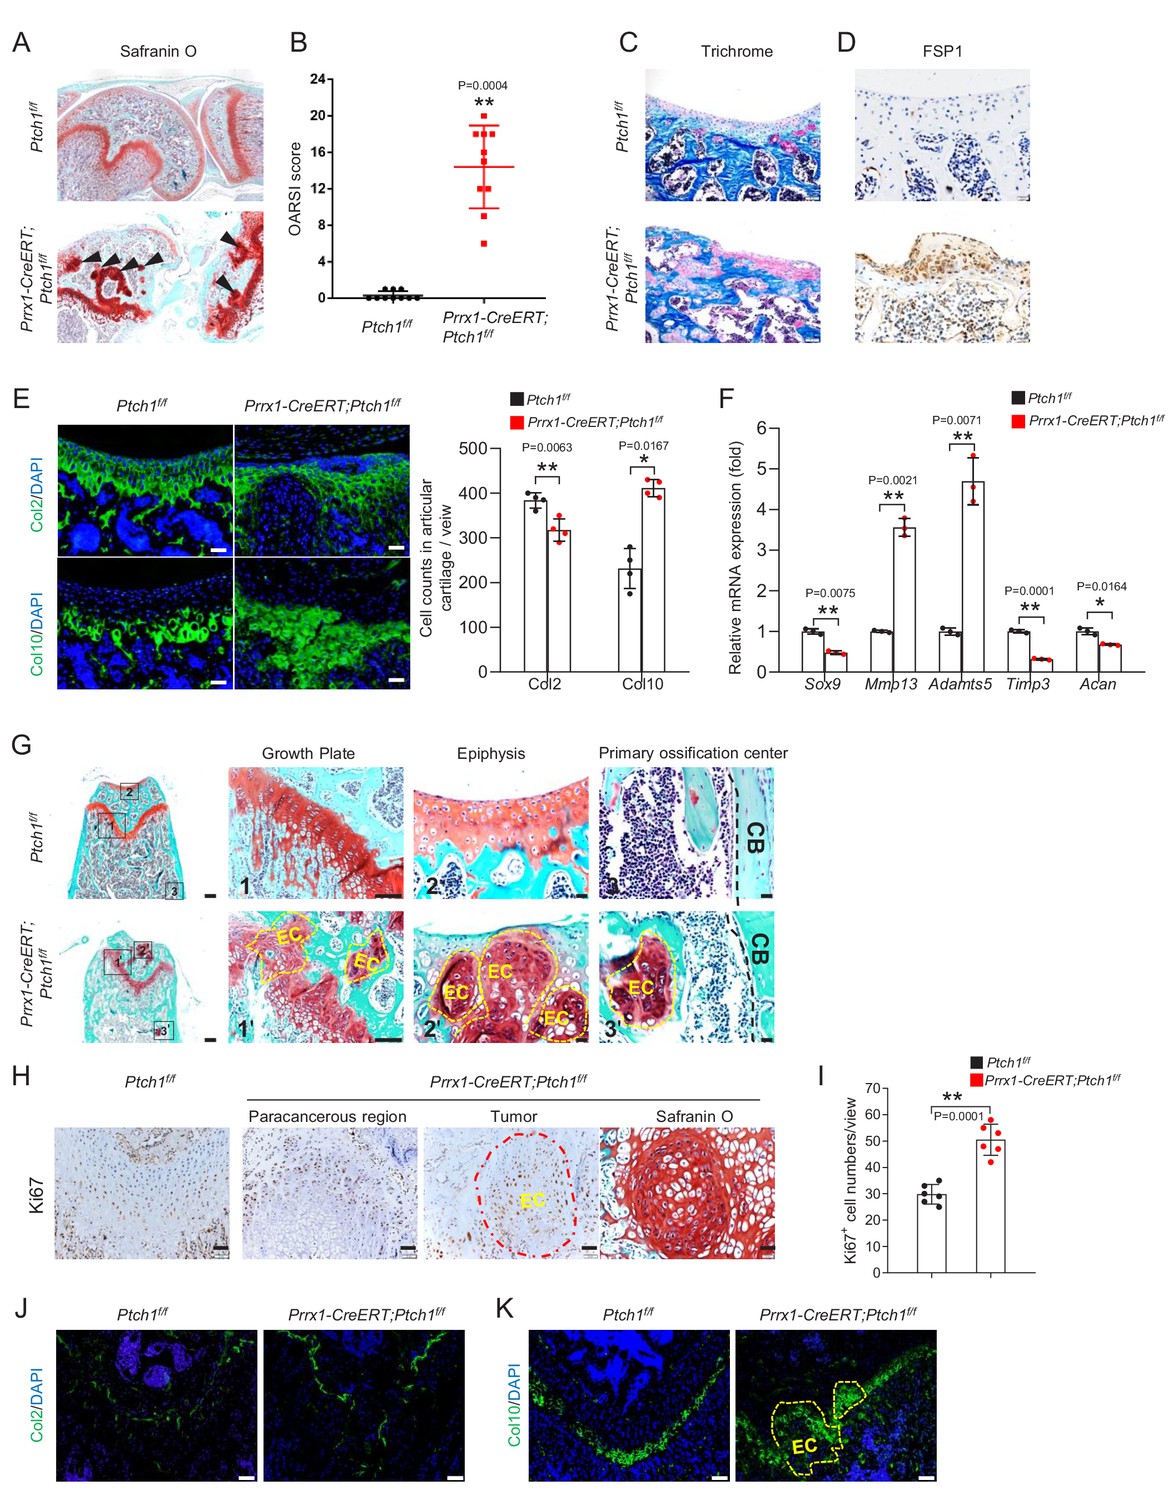
Ablation of Ptch1 led to increased chondrocyte proliferation and development of osteoarthritis and enchondroma.
(A) Safranin O staining of knee joints of Prrx1-CreERT; Ptch1f/f and control mice. (B) Increased OARSI scores of Prrx1-CreERT; Ptch1f/f mice compared to control littermates. **p<0.01 compared to the Ptch1f/f group, n = 9 per group. (C) Villanueva-Goldner's trichrome staining of articular cartilage of Prrx1-CreERT; Ptch1f/f and control mice. (D) Immunostaining for FSP1 of articular cartilage of Prrx1-CreERT; Ptch1f/f and control mice. (E) Immunostaining of Col2 (top) and Col10 (bottom) on the articular cartilage of femur bones in Prrx1-CreERT; Ptch1f/f and control mice. Right panel: quantitation data, *p<0.05, **p<0.01, n = 4. (F) Quantitative PCR analysis of articular cartilage samples of Prrx1-CreERT; Ptch1f/f and control mice revealed alteration of gene expression that indicated osteoarthritis phenotypes. All samples were normalized to GAPDH and then to the control samples, *p<0.05, **p<0.01, n = 3. (G) Safranin O staining showed multiple enchondroma-like lesions (EC) at growth plate, articular cartilage, and bone marrow in Prrx1-CreERT; Ptch1f/f mice. Higher magnification views of boxed areas were shown on the right. CB, cortical bone. (H) Ki67 immunohistochemistry at the growth plate of femurs of Prrx1-CreERT; Ptch1f/f and control mice. Right panel: Safranin O staining of section corresponding to tumor region. (I) Quantitation of Ki67+ cells at the growth plate of femur bones (non-tumor regions) of Prrx1-CreERT; Ptch1f/f and control mice, **p<0.01, n = 6. (J) Immunostaining of Col2 at the growth plate of femur in Prrx1-CreERT; Ptch1f/f and control mice. (K) Immunostaining of Col10 at the growth plate of femur in Prrx1-CreERT; Ptch1f/f and control mice.
Figure 2—figure supplement 1
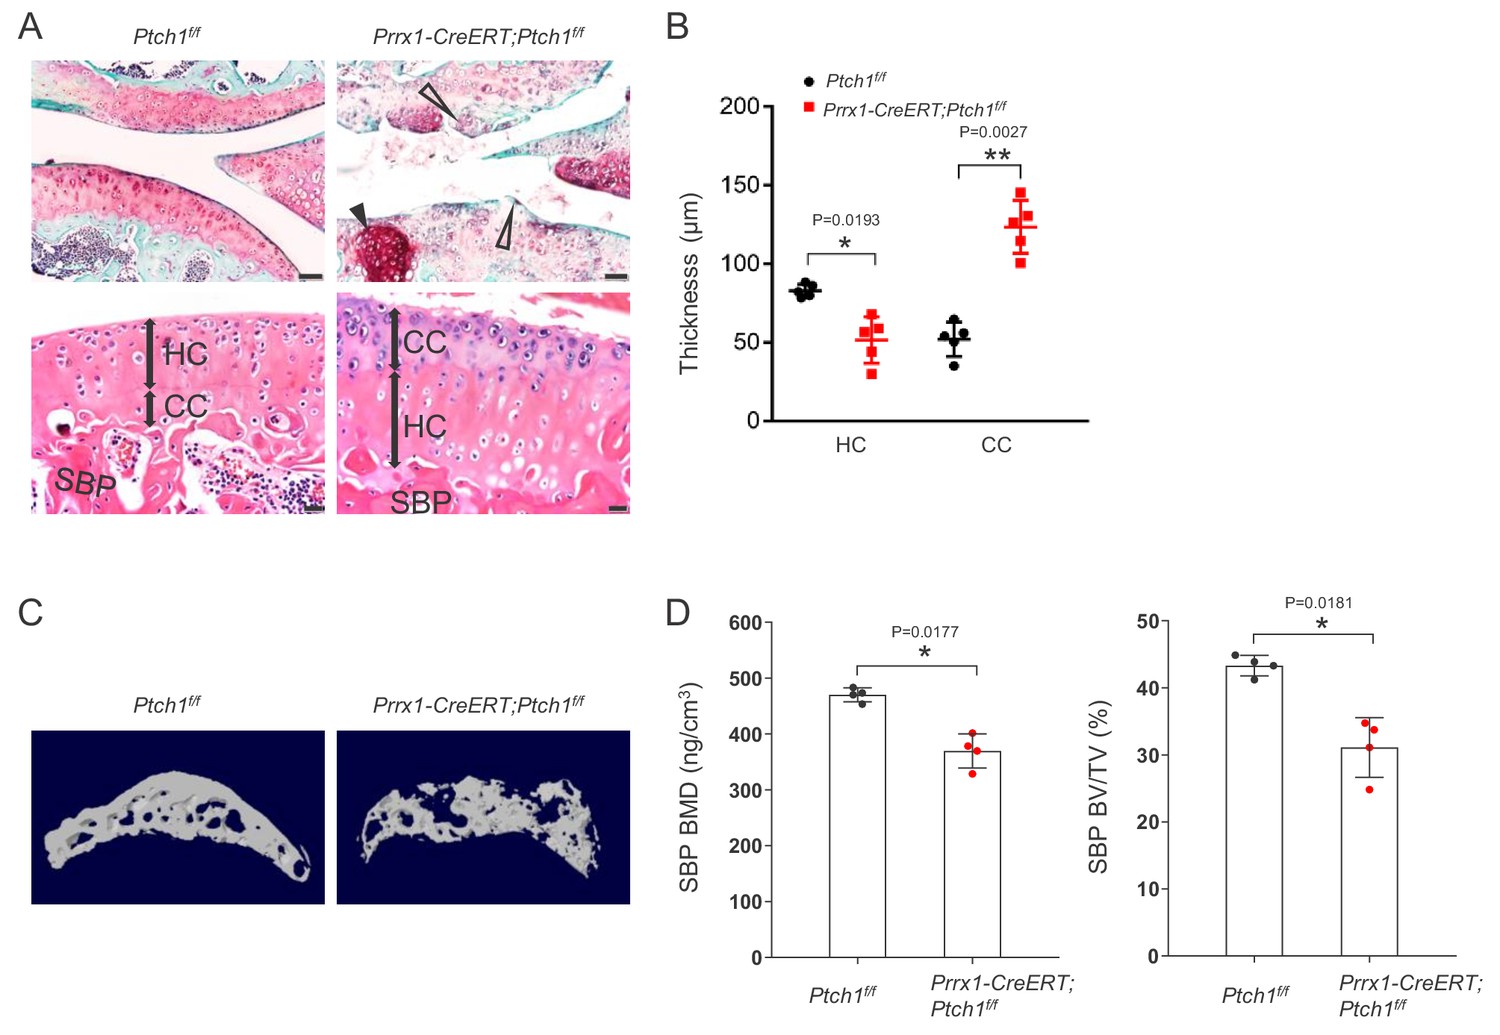
OA-like changes of subchondral bone architecture in Prrx1-CreERT; Ptch1f/f mice.
(A) Top, Safranin O staining of cartilage of sagittal sections of the femur medial compartment of Prrx1-CreERT; Ptch1f/f and control mice. Arrows indicate tumors while open arrows indicate loss of proteoglycan. Bottom, H/E staining of the SBP and cartilage of femur sections of Prrx1-CreERT; Ptch1f/f and control mice. The hyaline cartilage (HC) and calcified cartilage (CC) thicknesses are indicated by double-headed arrows. SBP, subchondral bone plate. Scale bars, 100 mm. (B) Quantification of the hyaline cartilage (HC) and calcified cartilage (CC) according to H/E staining in (A) *p<0.05, **p<0.01 compared to the Ptch1f/f group, n = 5 per group. (C) Three dimensional high-resolution micro-CT images of the tibial subchondral bone medial compartment (sagittal view). (D) Quantitative analysis of structural parameters of subchondral bone by micro-CT analysis. BMD, bone mineral density. BV/TV, bone volume relative to tissue volume. *p<0.05 compared to the Ptch1f/f group, n = 4 per group.
Figure 2—figure supplement 2

Histological analysis of the skeleton of Prrx1-CreERT; Ptch1f/f mice.
(A) Safranin O staining of femurs of Prrx1-CreERT;Ptch1f/f and control mice at different times after TAM injection. The tumor-like lesions are indicated by black arrows. (B) Safranin O staining of phalange sections of Prrx1-CreERT; Ptch1f/f and control mice; (C) Safranin O staining of humerus sections in Prrx1-CreERT; Ptch1f/f and control mice; (D) Safranin O staining of tibia sections in Prrx1-CreERT; Ptch1f/f and control mice; (E) Safranin O staining of vertebrae sections in Prrx1-CreERT; Ptch1f/f and control mice; (F) Tumor counts in phalanges, humerus, tibia, and vertebrae of Prrx1-CreERT; Ptch1f/f mutant mice. *p<0.05, **p<0.01 compared to normal mice, n = 4 per group.
Figure 3 with 3 supplements
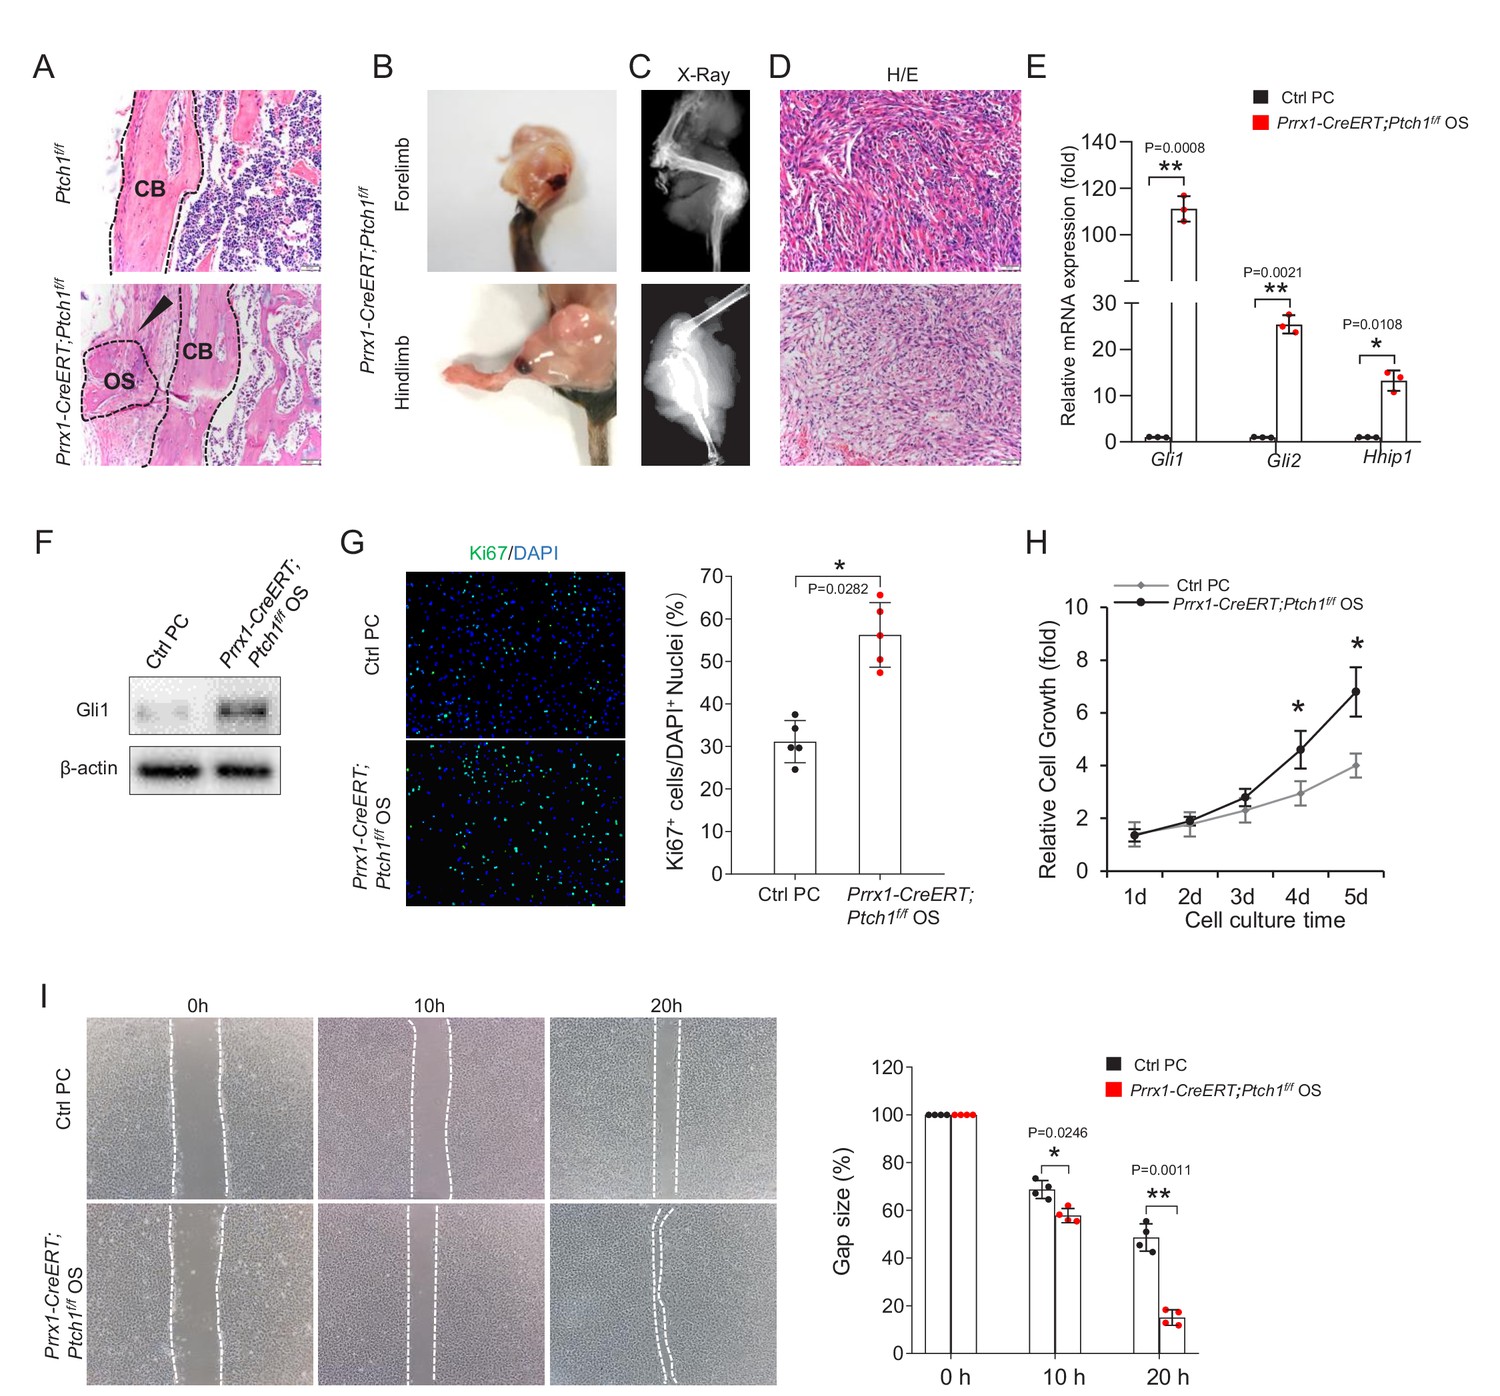
Prrx1-CreERT; Ptch1f/f mice developed osteosarcoma.
(A) H/E staining showed that osteoid lesions (arrows) were present in femur of Prrx1-CreERT; Ptch1f/f mice. OS, osteosarcoma; CB, cortical bone. (B) Representative presentation of osteosarcoma (OS) in forelimb (top) and hindlimb (bottom) in Prrx1-CreERT; Ptch1f/f mice 5 months after TAM injection. (C) Radiographic images of bone tumors in Prrx1-CreERT; Ptch1f/f mice 5 months after TAM injection. (D) Representative histological section of osteosarcoma in Prrx1-CreERT; Ptch1f/f mice 5 months after TAM injection. (E) Quantitative PCR analysis of Hh target genes of tumor tissues isolated from Prrx1-CreERT; Ptch1f/f mice. All samples were normalized to GAPDH and then to control periosteal cells (PC), *p<0.05, **p<0.01, n = 3. (F) Western blot showed an increase in Gli1 in bone tumor tissues isolated from Prrx1-CreERT; Ptch1f/f mice compared to normal periosteal cells. (G) Cell proliferation assays for primary osteosarcoma cells and control periosteal cells by Ki67 staining, Right panel: quantitation data. *p<0.05, n = 5. (H) Cell proliferation analysis of primary osteosarcoma cells and control periosteal cells using CKK8 assays, *p<0.05, n = 3. (I) Wound healing assay of primary osteosarcoma cells. Dotted lines indicated the cell fronts, Right panel: quantitation data. *p<0.05, **p<0.01, n = 4.
Figure 3—figure supplement 1
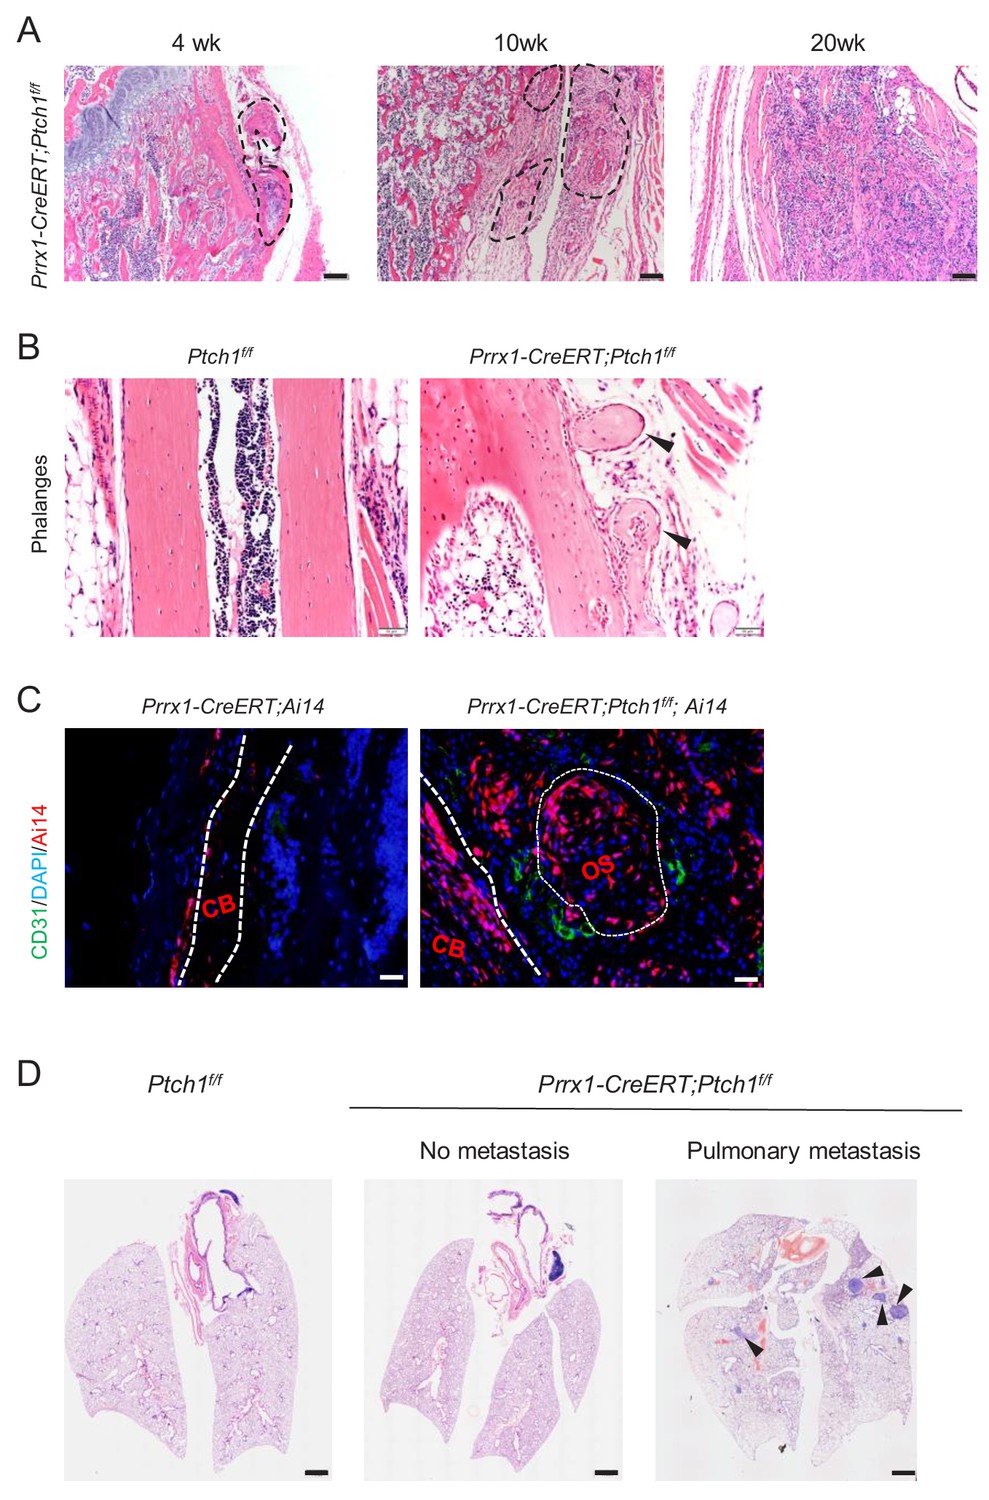
Enhanced angiogenesis and possible metastasis in Prrx1-CreERT; Ptch1f/f mice.
(A) H/E staining of osteogenic tumor-like nodules from mutant mice at 4, 10 and 20 weeks after TAM injection showed a progressive histopathological feature. (B) H/E staining showed that exostosis lesions (arrows) were present in phalanges of Prrx1-CreERT; Ptch1f/f mice. (C) Immunostaining of CD31 on femur sections of Prrx1-CreERT; Ptch1f/f; Ai14 and control mice in periosteum region. CB, cortical bone; OS, osteosarcoma. (D) H/E staining of lungs of Prrx1-CreERT; Ptch1f/f and control mice 6 months after TAM injection. The arrows indicated the tumor nodules.
Figure 3—figure supplement 2
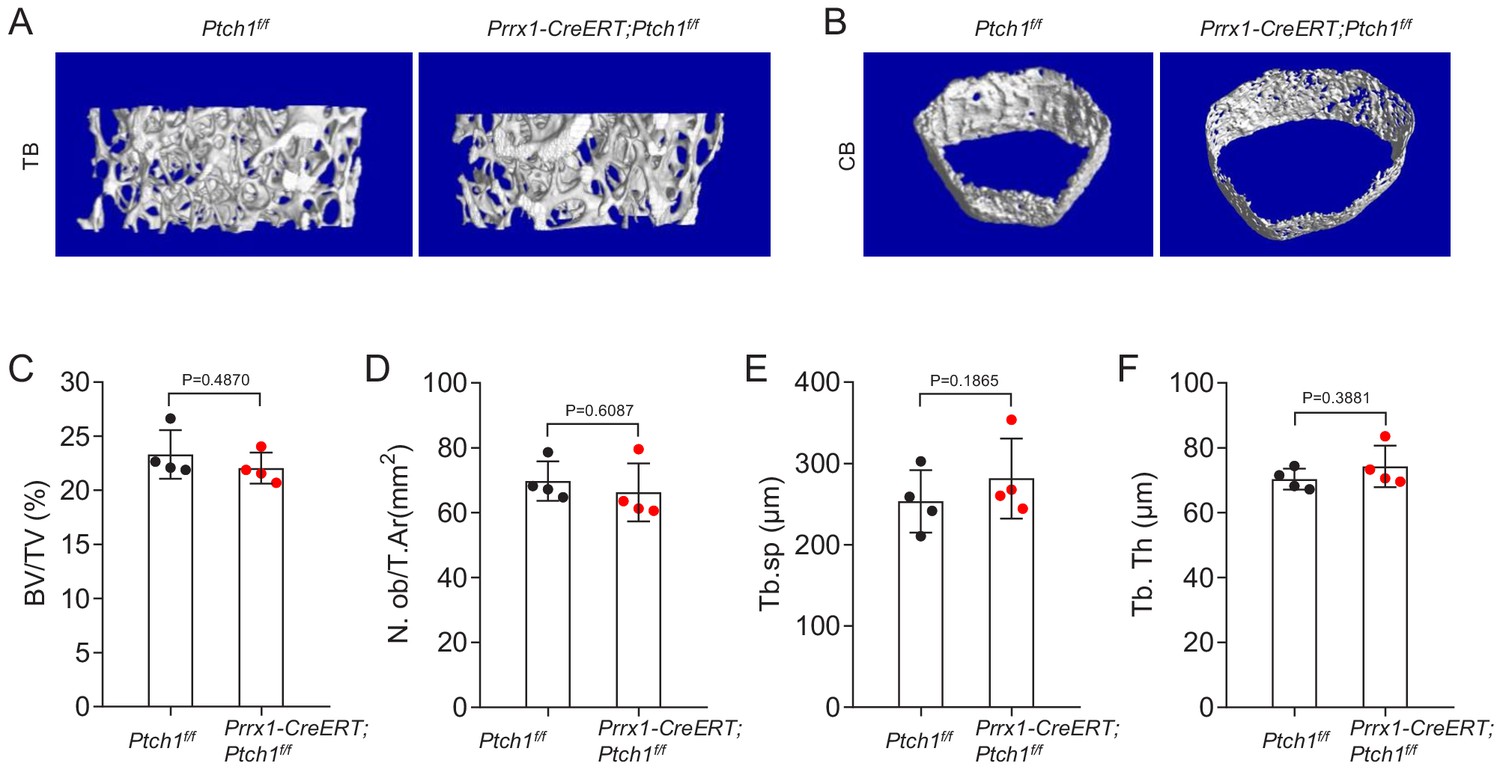
Activation of Hh signaling in MSCs did not alter bone mass.
(A) Micro-CT images of the trabecular bones (TB) of 2-month-old Prrx1-CreERT; Ptch1f/f and control mice. (B) Micro-CT images of the cortical bones (CB) of 2-month-old Prrx1-CreERT; Ptch1f/f and control mice. (C) Prrx1-CreERT; Ptch1f/f mice showed unaltered bone volume. ns, not significant; n = 4 per group. (D) Prrx1-CreERT; Ptch1f/f mice showed unaltered trabecular bone numbers. ns, not significant; n = 4 per group. (E) Prrx1-CreERT; Ptch1f/f mice showed unaltered trabecular bone separation. ns, not significant; n = 4 per group. (F) Prrx1-CreERT; Ptch1f/f mice showed unaltered trabecular bone thickness. ns, not significant; n = 4 per group. Data are given as means, and error bars represent SDs.
Figure 3—figure supplement 3
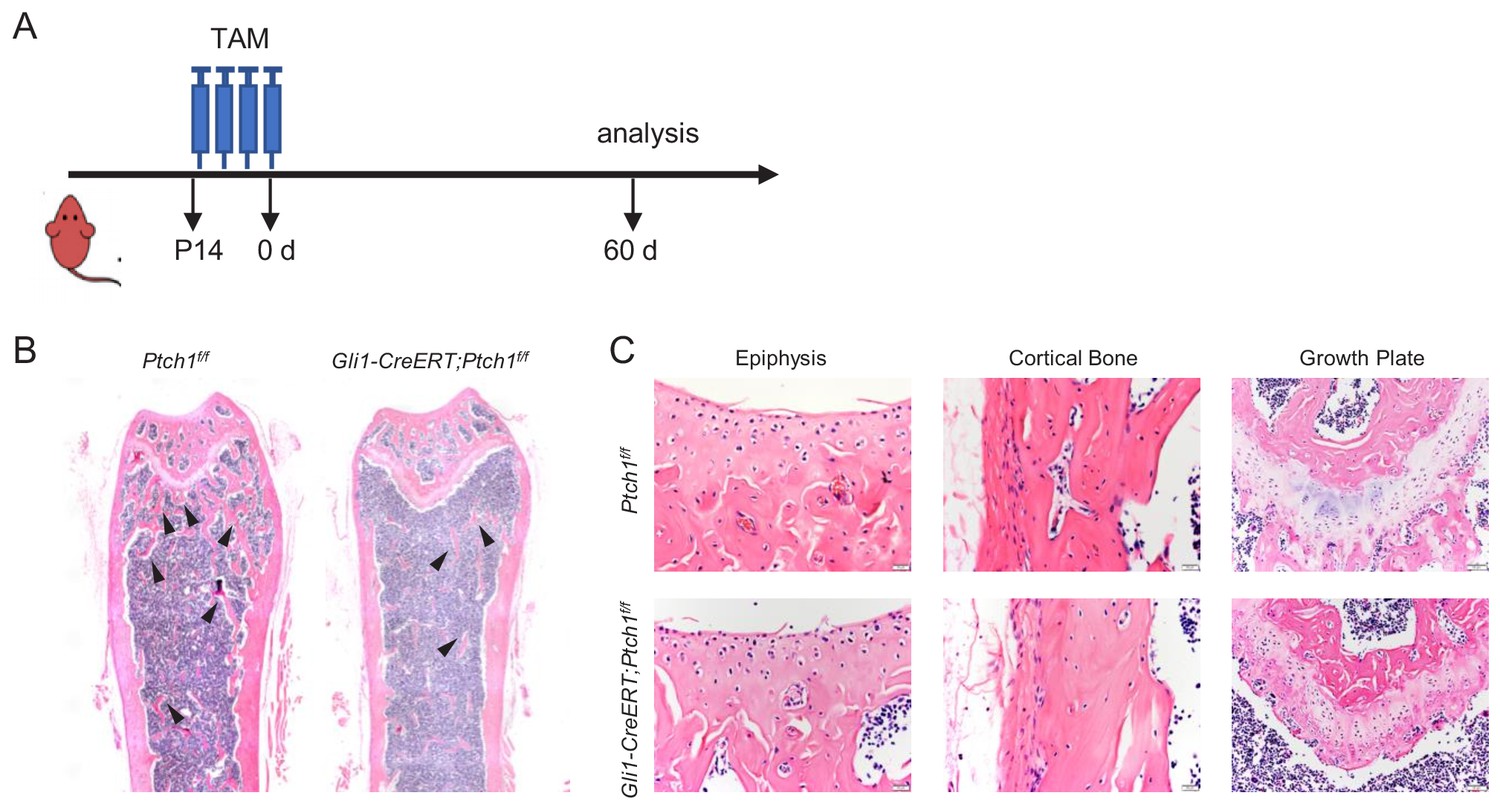
Deletion of Ptch1 in Gli1+ cells did not lead to development of enchondroma or osteosarcoma.
(A) A diagram showing the time for TAM administration. (B) H/E staining of femur sections of Gli1-CreERT;Ptch1f/f and control mice. Arrows indicate trabecular bones in bone marrow. (C) H/E staining of epiphysis, cortical bone, and growth plate of Gli1-CreERT;Ptch1f/f and control mice.
Figure 4
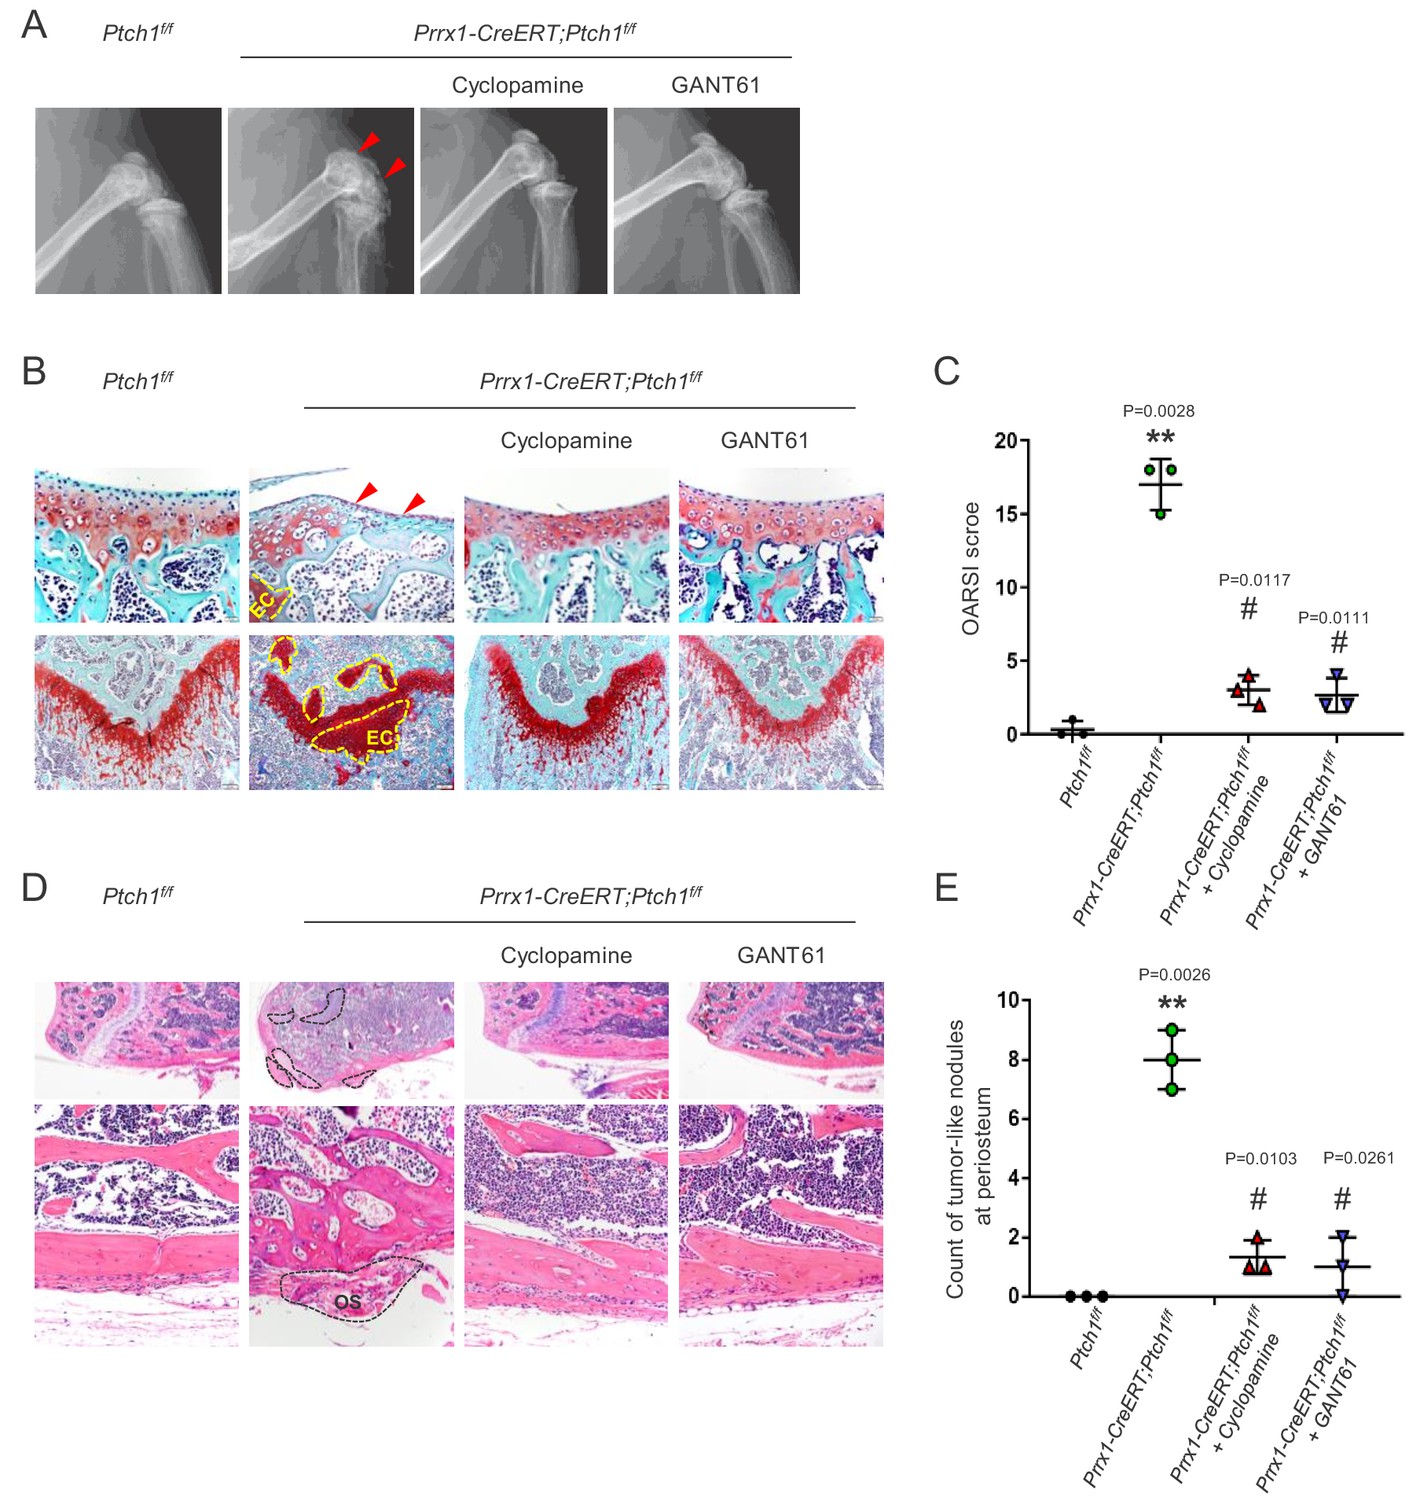
Ptch1 deficiency induced cartilage/bone tumor formation via Smo-Gli1/2.
(A) Radiographic images of Prrx1-CreERT; Ptch1f/f and control mice treated with cyclopamine or GANT61. (B) Safranin O staining showed that Cyclopamine or GANT61 rescued the disrupted articular cartilage and formation of enchondroma in Prrx1-CreERT; Ptch1f/f mice. (C) OARSI scores of control and Prrx1-CreERT; Ptch1f/f mice treated with either vehicle, Cyclopamine, or GANT61. **p<0.01 compared to the Ptch1f/f group; # p<0.05 compared to the vehicle-treated Prrx1-CreERT; Ptch1f/f group, n = 3 per group. (D) H/E staining showed that Cyclopamine or GANT61 rescued the osteosarcoma-like lesions in Prrx1-CreERT; Ptch1f/f mice. (E) Counts of osteogenic tumor-like nodules in control and Prrx1-CreERT; Ptch1f/f mice treated with either vehicle, Cyclopamine, or GANT61. **p<0.01 compared to the Ptch1f/f group; # p<0.05 compared to the vehicle-treated Prrx1-CreERT; Ptch1f/f group, n = 3 per group.
Figure 5 with 2 supplements
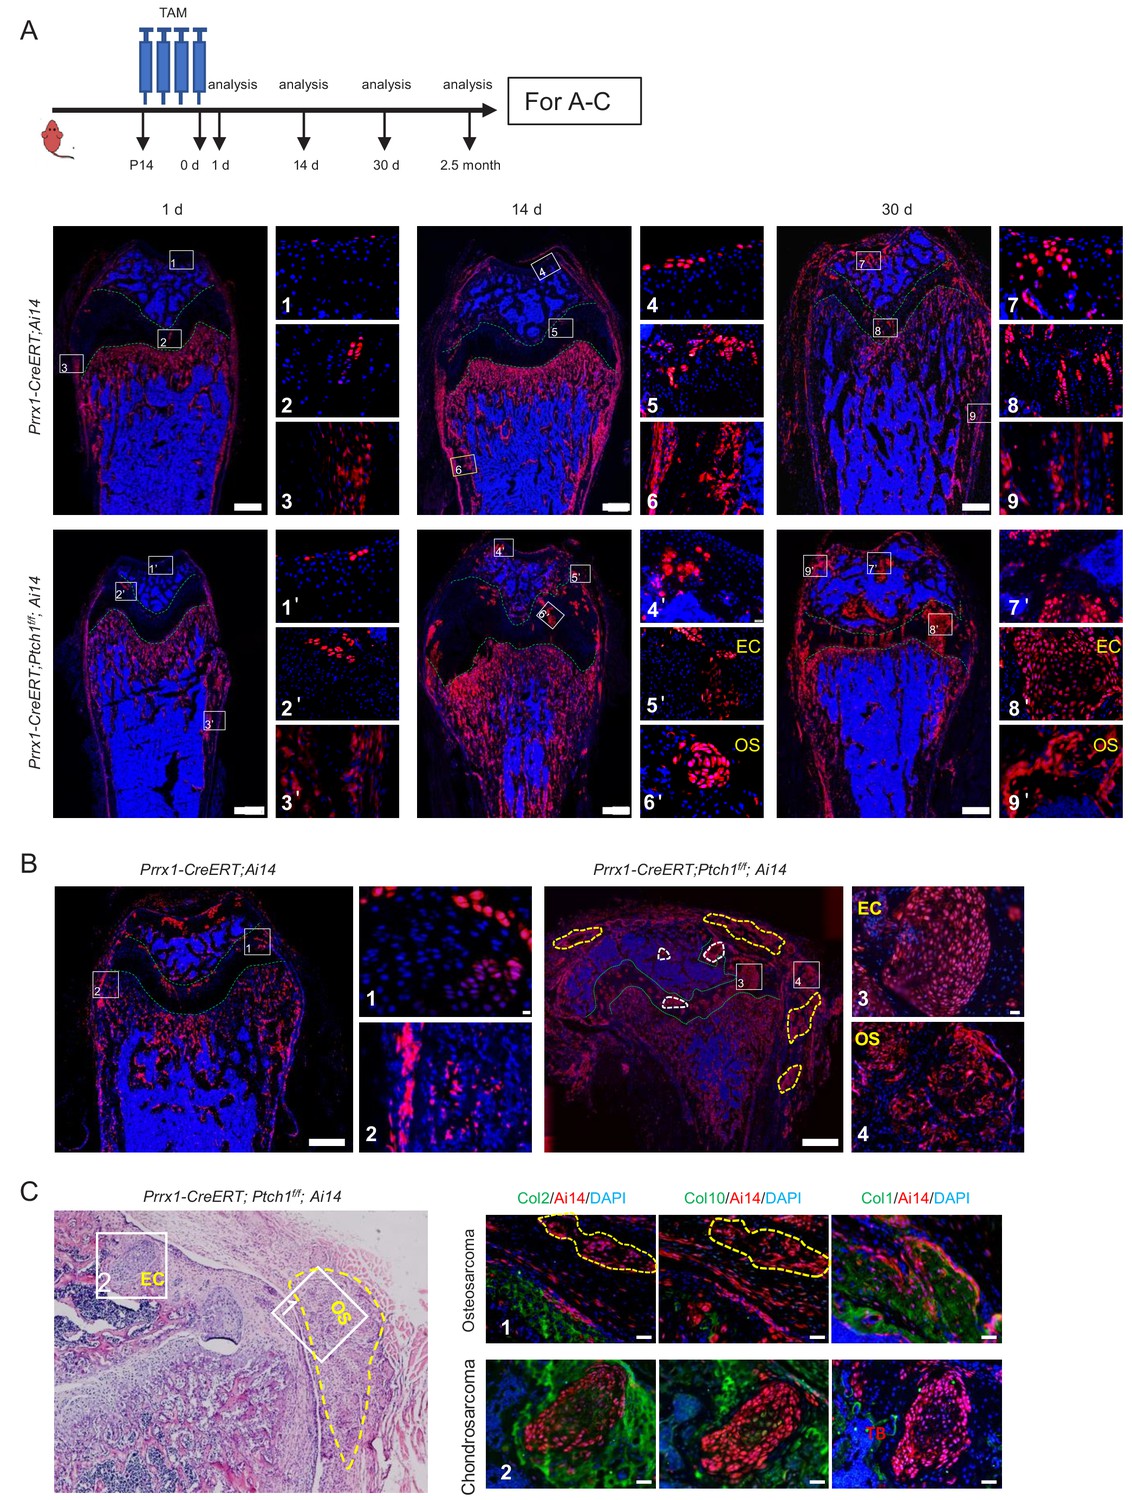
Ptch1 deficiency-induced cartilage/bone tumors were originated from Prrx1 lineage cells.
(A) Tracing results of 1, 14, and 30 days after 4 doses of TAM injection in Prrx1-CreERT;Ptch1f/f; Ai14 and Prrx1-CreERT; Ai14 mice. EC, enchondroma; OS, osteosarcoma. Upper panel: a schematic for the experimental design. (B) Lineage tracing of Prrx1-CreERT; Ptch1f/f;Ai14 and Prrx1-CreERT;Ai14 mice 2.5 months after TAM injection. Images showed that cells in the tumor region are Prrx1+ (red). White circles, enchondroma; yellow circles, osteosarcoma. EC, enchondroma; OS, osteosarcoma. (C) Immunostaining of chondrocyte and osteoblast markers on bone tumor sections. Left panel: H/E staining.
Figure 5—figure supplement 1

Marking of growth plate and vertebrae by Prrx1 in Prrx1-CreERT;Ptch1f/f mice.
(A) Fluorescent images of femur section of Prrx1-CreERT;Ai14 mice without TAM administration. (B) Fluorescent images of growth plate in Prrx1-CreERT;Ptch1f/f;Ai14 and Prrx1-CreERT;Ai14 mice. RZ, resting zone; PZ, proliferative zone; HZ, hypertrophic zone. No difference was observed. (C) Prrx1 marked limited numbers of osteoblasts but not chondrocytes in the vertebrae. Lineage tracing of vertebrae in Prrx1-CreERT;Ai14 mice at 1 day and 30 days after TAM injection. Upper panel: a diagram showing the time for TAM administration. (D) Separated fluorescent images related to Figure 4C.
Figure 5—figure supplement 2

Prrx1+periosteal cells showed features of MSC.
(A) Representative fluorescent images of adherent BM-MSC from Prrx1-CreERT;Ai14 mice. (B) Representative bright-field view images of Prrx1+periosteal cells (C) Images of CFU colony formed by Prrx1+periosteal cells. (D) Representative images showing multi-lineage differentiation of Prrx1+periosteal cells.
Figure 6 with 2 supplements
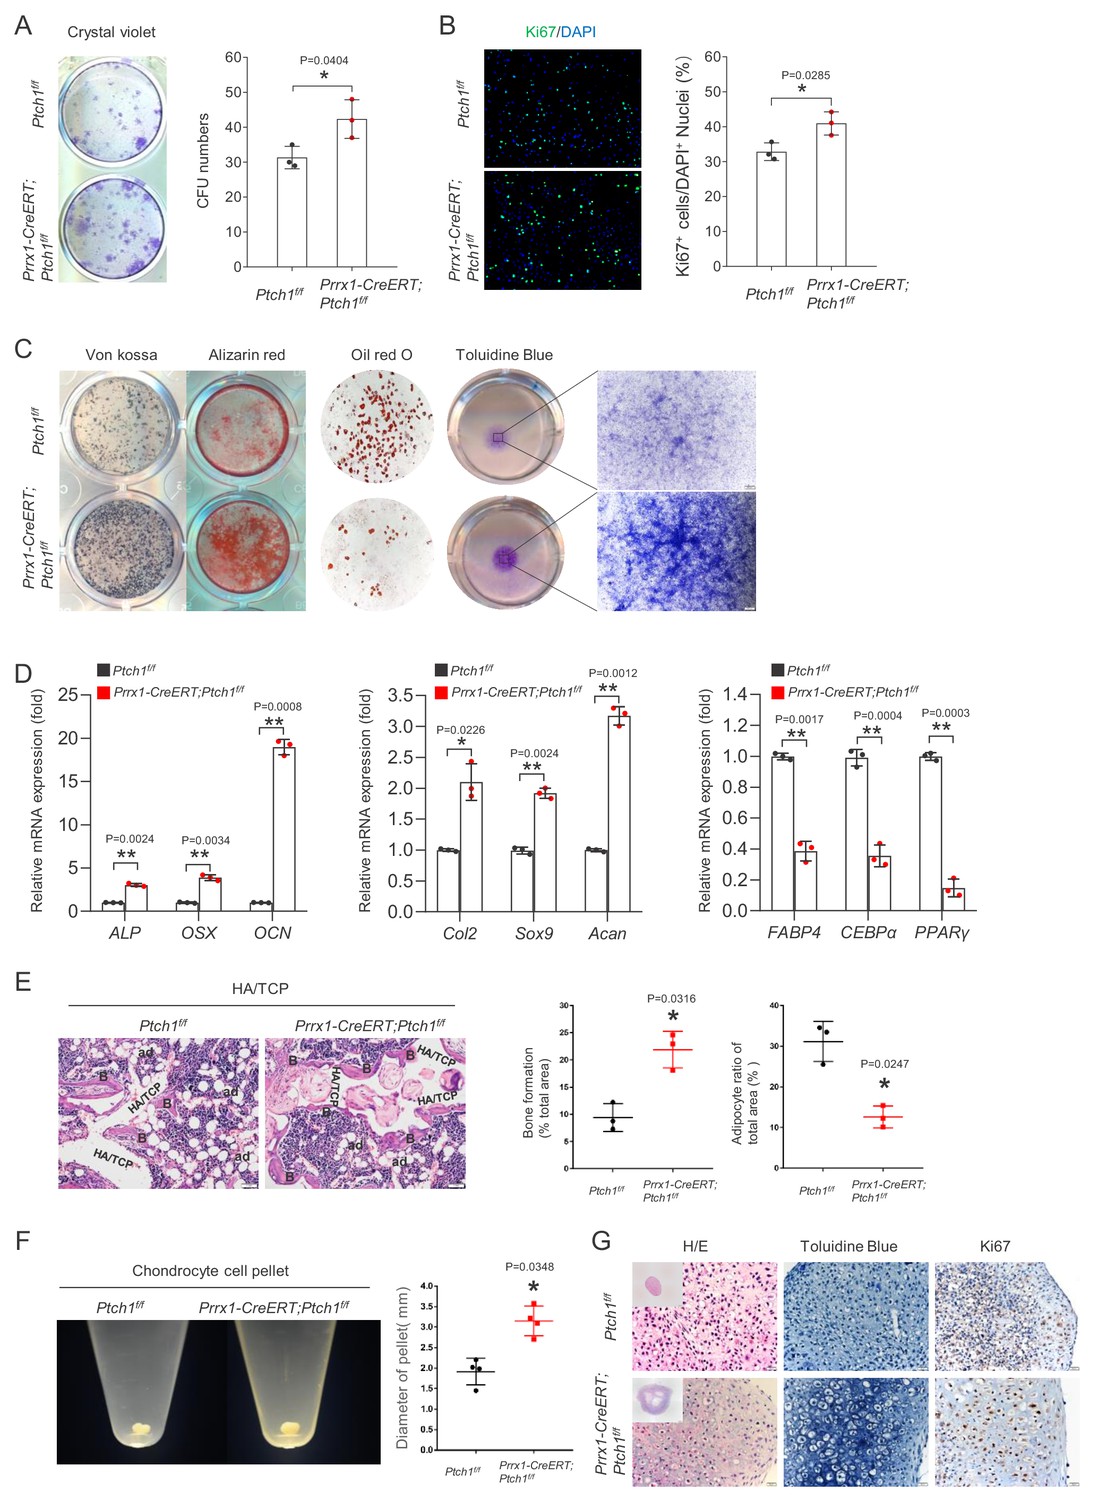
Critical roles for Hh signaling in MSC proliferation and differentiation.
(A) Colony forming efficiency assay of BM MSCs isolated from Prrx1-CreERT; Ptch1f/f and control mice. These plates were stained with crystal violet. Right panels, quantitation data, *p<0.05, n = 3. (B) Cell proliferation of MSCs isolated from Prrx1-CreERT; Ptch1f/f and control mice by Ki67 staining. Right panel: quantitation data. *p<0.05, n = 3. (C) Prrx1-CreERT; Ptch1f/f MSCs showed an alteration in tri-lineage differentiation activities. Osteoblast differentiation was judged by Von Kossa and Alizarin Red staining, chondrocyte differentiation was judged by Toluidine Blue staining, and adipocyte differentiation was judged by Oil Red O staining. (D) Quantitative PCR analysis of lineage-specific markers of Ptch1-/- and control MSCs cultured with osteoblast medium, chondrocyte medium or adipocyte medium. All samples were normalized to GAPDH and then to the controls, *p<0.05, **p<0.01, n = 3. (E) H/E staining of histological sections from implanted Ptch1-/- and control MSC-scaffolds. Right panel, quantitative analysis of amount of bone and adipocytes that formed on the HA/TCP particles using Image-Pro Plus software based on H/E staining. HA/TCP, hydroxyapatite/tricalcium phosphate; B, bone; ad, adipocytes. Right panel: quantitation data. *p<0.05, n = 3. (F) Chondrocyte cells pellet images of differentiated Ptch1-/- and control BM MSCs. Right panel, quantitative data of pellet sizes. *p<0.05, n = 4. (G) Chondrocyte cell pellet assays of differentiation of Ptch1-/- and control BM MSCs. The same numbers of mutant and control MSCs were induced to differentiate into chondrocytes and the section were stained with H/E (left), toluidine blue (middle), or Ki67 (right).
Figure 6—figure supplement 1
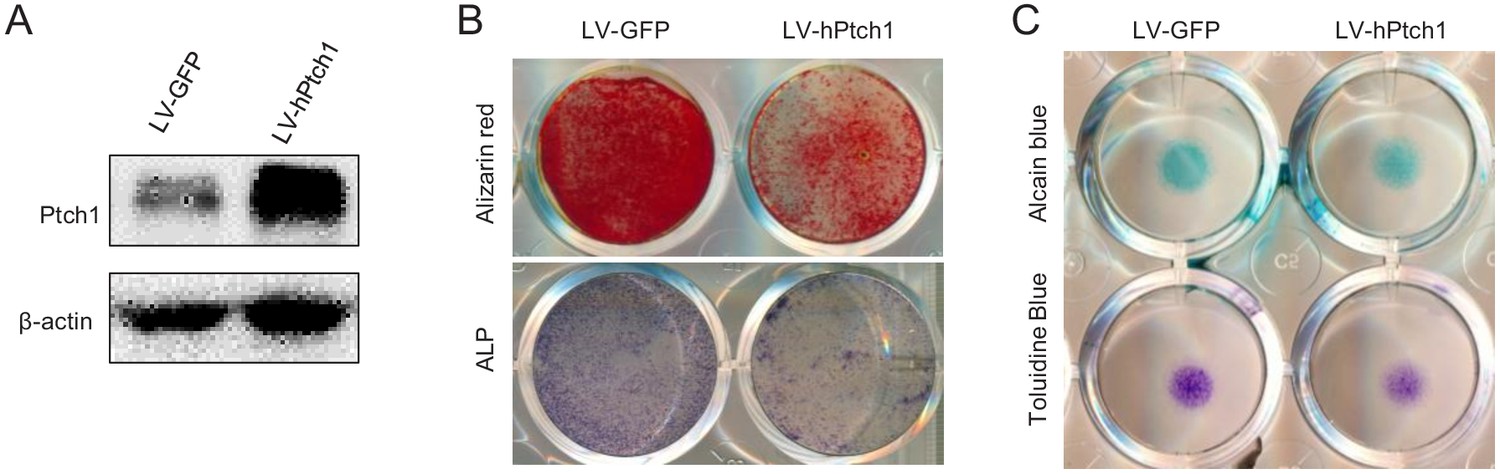
Overexpression of Ptch1 inhibited BM-MSC osteoblast and chondrocyte differentiation.
(A) Western blot results showed Ptch1 overexpression in MSCs. (B) Overexpression of Ptch1 in BM-MSCs suppressed osteoblast differentiation. (C) Overexpression of Ptch1 in BM-MSCs suppressed chondrocyte differentiation.
Figure 6—figure supplement 2

Adipogenesis was decreased in femurs of Prrx1-CreERT; Ptch1f/f mice.
Immunostaining of Perilipin in femur sections of Prrx1-CreERT; Ptch1f/f and control mice. Top: proximal femur location; lower: distal femur location.
Figure 7 with 2 supplements
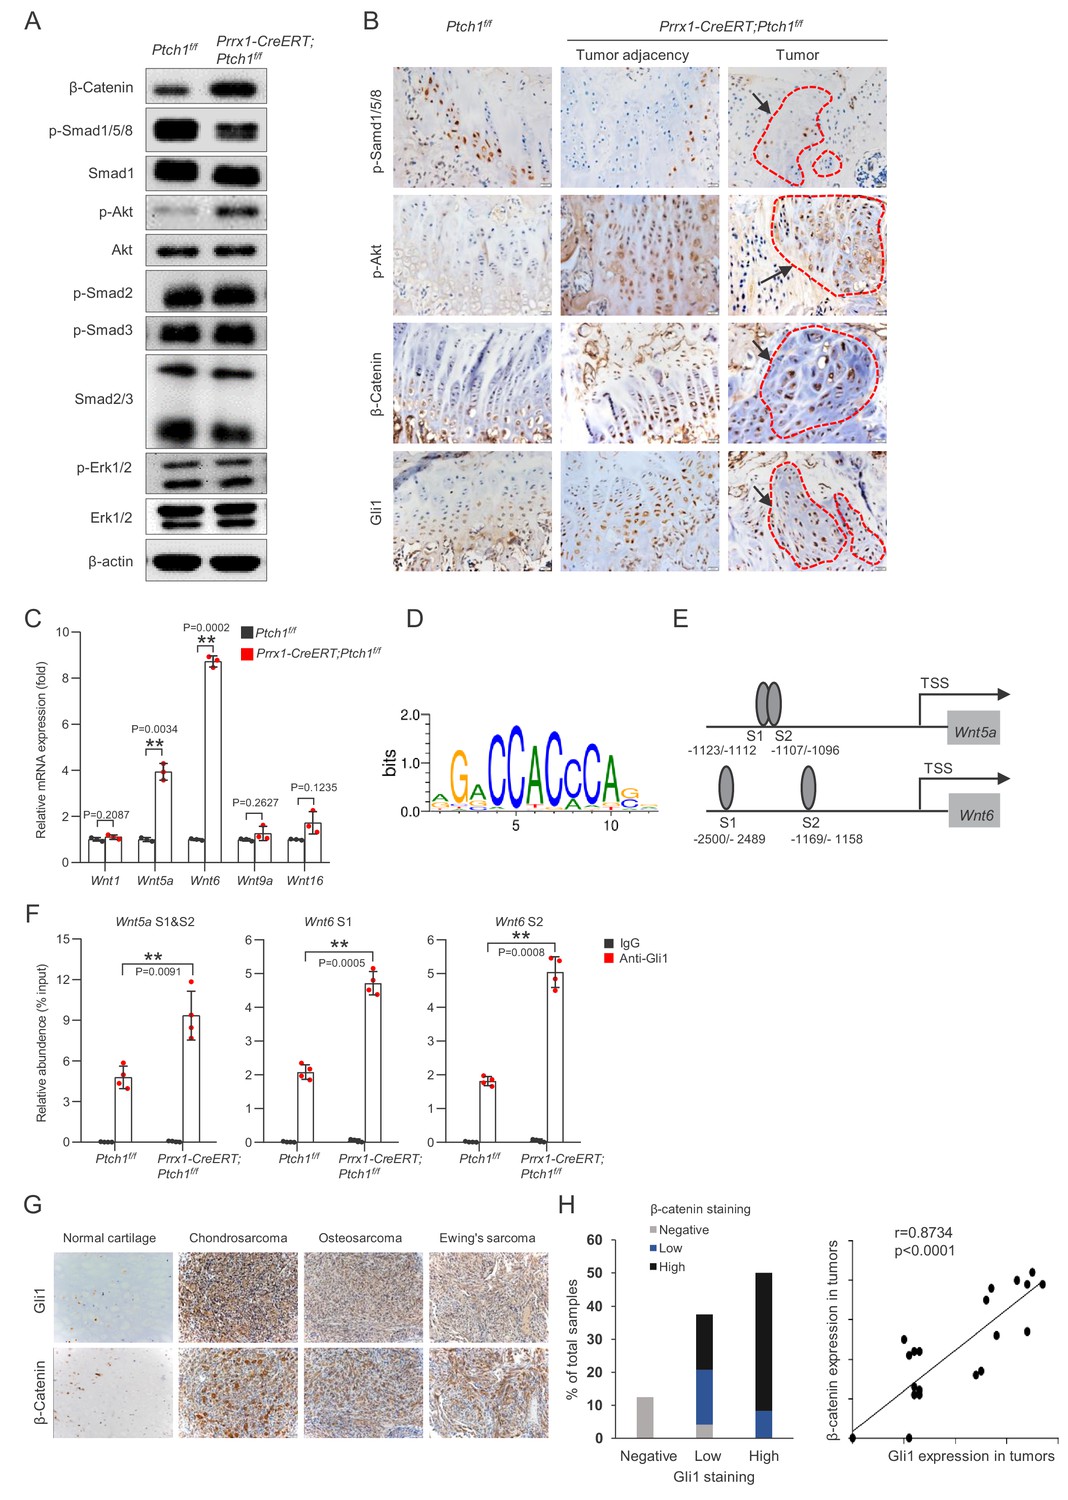
Wnt/β-Catenin signaling was activated in Ptch1-/- MSCs and human bone/cartilage tumors.
(A) Western blot results indicated that MSCs isolated from Prrx1-CreERT; Ptch1f/f mice showed enhanced activation of β-Catenin and Akt1 but decreased activation of Smad1/5/8. (B) Immunohistochemical staining confirmed that Prrx1-CreERT; Ptch1f/f mouse bone section showed increased β-Catenin and p-Akt1 signals but decreased p-Smad1/5/8 signals. Red circle, tumor region. (C) Quantitative PCR analysis of Wnt expression in MSCs isolated from Prrx1-CreERT; Ptch1f/f and control mice. All samples were normalized to GAPDH and then to the controls, **p<0.01, n = 3. (D) Sequence logos of 12-mer Gli1 binding motif was shown. (E) Schematic presentation of the putative Gli1-binding sites in the promoter region of mouse Wnt5a and Wnt6. (F) Quantitative PCR analysis of the immunoprecipitated DNA in separate experiments. **p<0.01 compared to the Ptch1f/f anti-Gli1 group. N = 4. (G) Representative images of Gli1 and β-Catenin expression in cartilage tumors by immunohistochemical staining. (H) Relationship between the protein levels of Gli1 and β-Catenin in human cartilage/bone tumors. Left: Bar graph presentation of co-expression between Gli1 and β-Catenin. Right: correlation analysis between Gli1 and β-Catenin, r = 0.8734, p<0.0001.
Figure 7—figure supplement 1
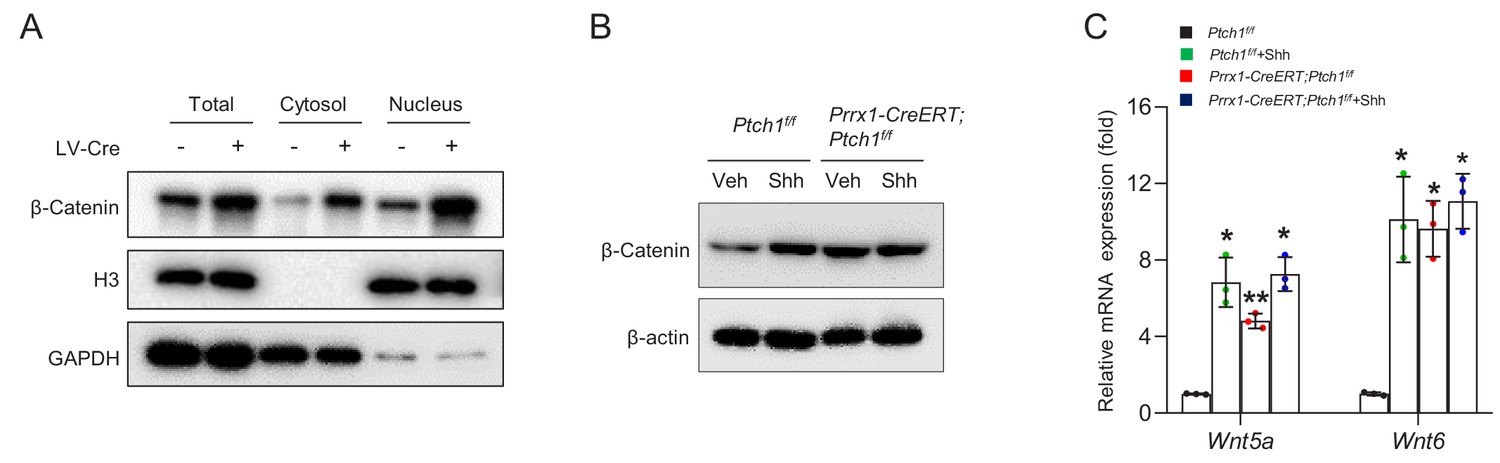
SHH or Ptch1 deficiency can activate β-Catenin and increase expression of Wnt5a and Wnt6.
(A) Western blot results indicated that MSCs isolated from Ptch1f/f mice treated with Cre-expressing virus infection showed increases in both cytoplasmic and nuclear β-Catenin. (B) Western blot results showed that recombinant SHH protein treatment enhanced activation of β-Catenin. (C) Quantitative PCR assays showed that the mRNA levels of Wnt5a and Wnt6 were increased in BM-MSCs by SHH treatment (5 μg/ml) for 24 hr. *p<0.05, **p<0.01, n = 3.
Figure 7—figure supplement 2
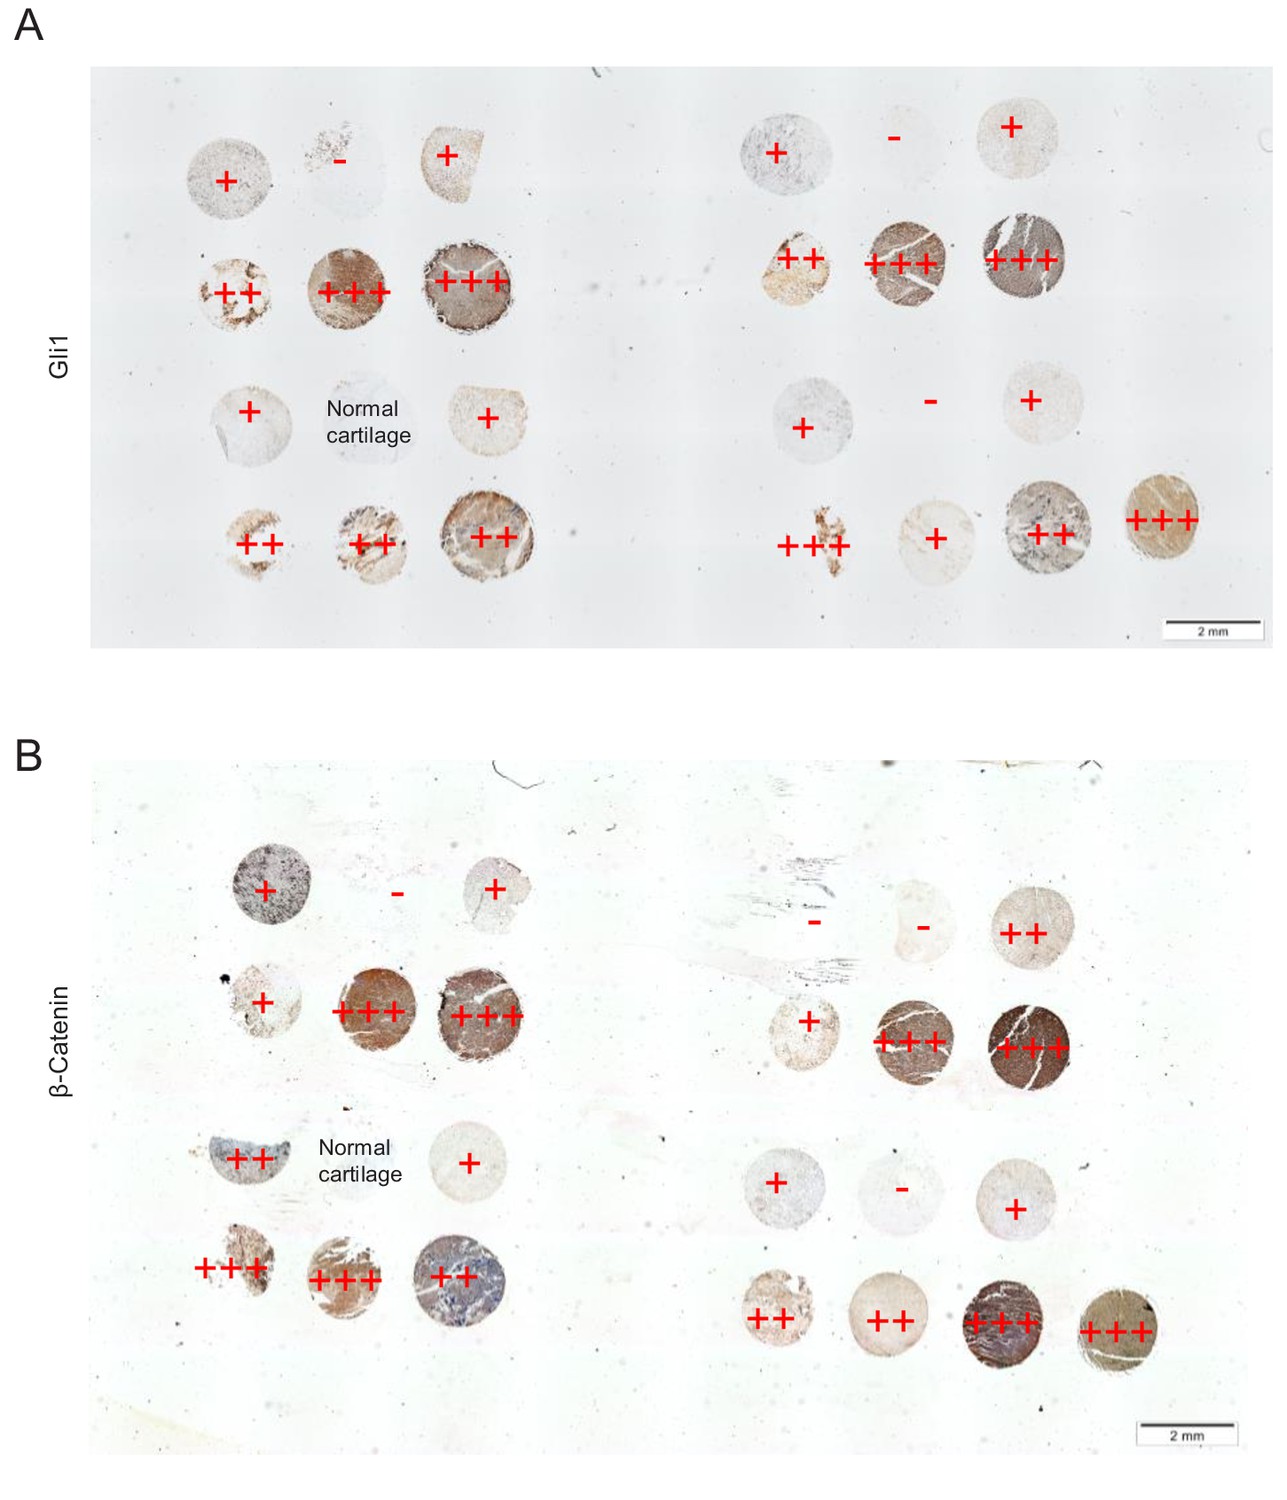
Images of human cartilage/bone tumor tissue arrays.
(A) Immuno-staining of Gli1 in human cartilage/bone tumor samples. (B) Immuno-staining of β-Catenin in human cartilage/bone tumor samples.
Figure 8 with 2 supplements
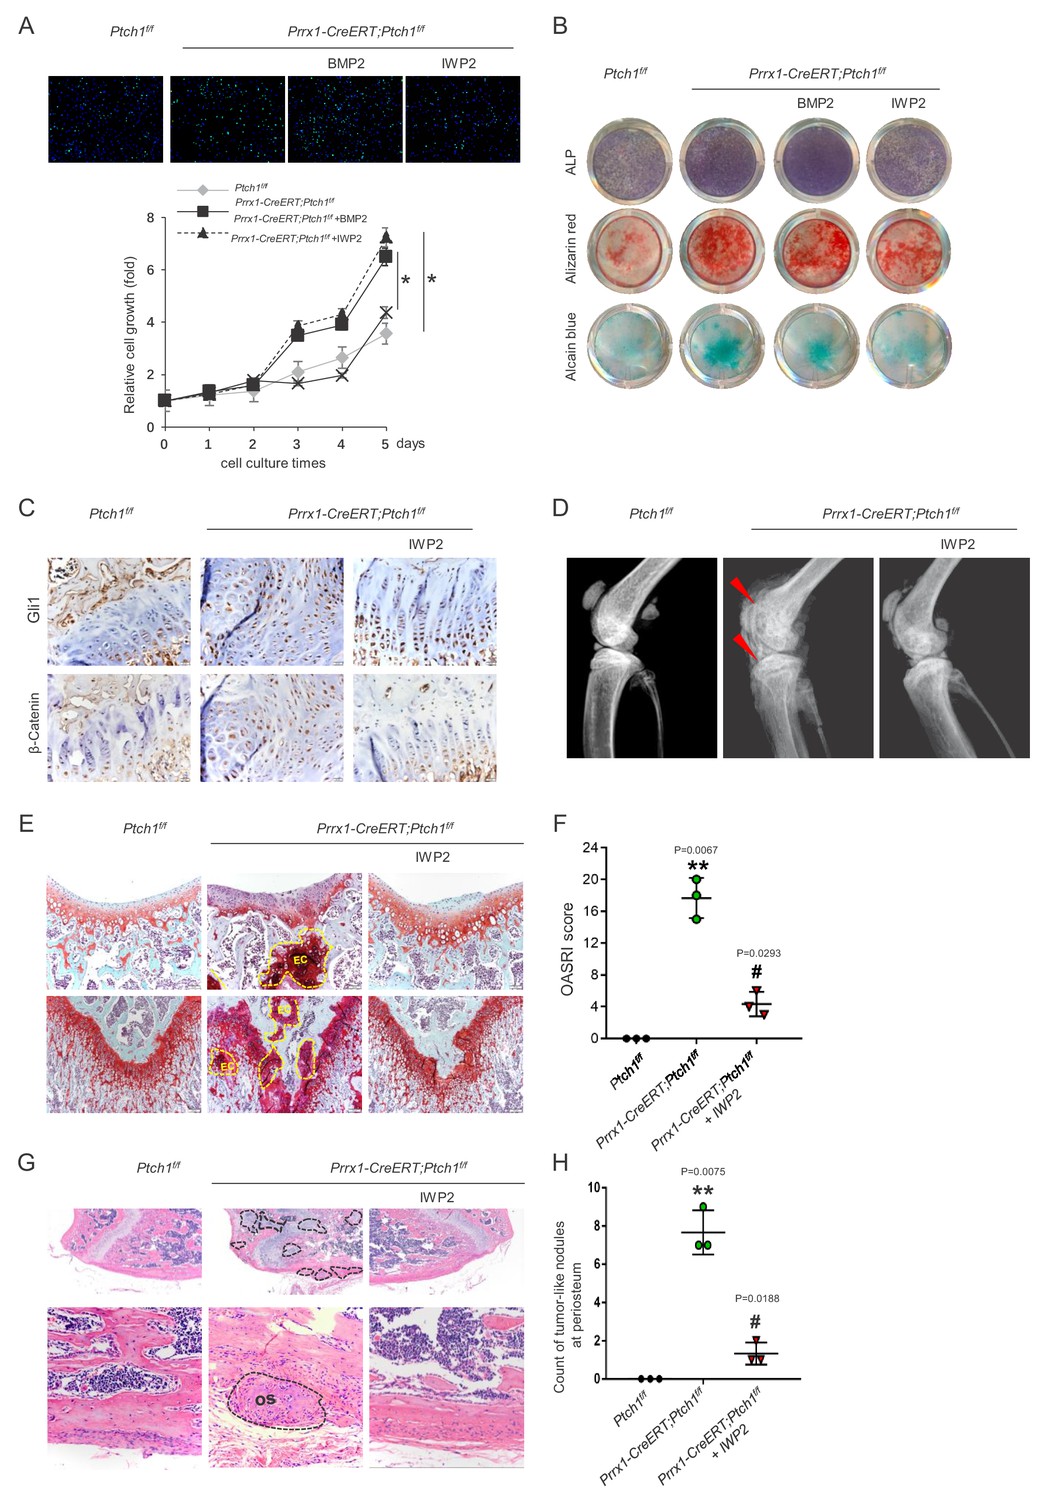
Wnt/β-Catenin mediated the pro-tumorigenic activity of Ptch1 ablation.
(A) IWP2 suppressed proliferation of BM-MSCs isolated from Prrx1-CreERT; Ptch1f/f mouse. Top, Ki67 staining; lower, cck8 assay. *p<0.05. (B) IWP2 rescued the enhanced osteogenic and chondrogenic differentiation of BM MSCs isolated from Prrx1-CreERT; Ptch1f/f mouse. (C) IWP2 inhibited Wnt/β-Catenin signaling without affecting the levels of Gli1. (D) Radiographic images showed that IWP2 rescued joint disruption and exostoses in Prrx1-CreERT; Ptch1f/f mouse. (E) Safranin O staining showed that IWP2 rescued joint disruption and cartilage tumor formation in Prrx1-CreERT; Ptch1f/f mouse. (F) OARSI scores of control and Prrx1-CreERT; Ptch1f/f mice treated with either vehicle or IWP2. **p<0.01 compared to the Ptch1f/f group; # p<0.05 compared to the vehicle-treated Prrx1-CreERT; Ptch1f/f group, n = 3 per group. (G) H/E-staining showed that IWP2 rescued bone tumor formation in Prrx1-CreERT; Ptch1f/f mouse. (H) Osteogenic tumor-like nodules counts in control and Prrx1-CreERT; Ptch1f/f mice treated with either vehicle or IWP2. **p<0.01 compared to the Ptch1f/f group; #p<0.05 compared to the vehicle-treated Prrx1-CreERT; Ptch1f/f group, n = 3 per group.
Figure 8—figure supplement 1
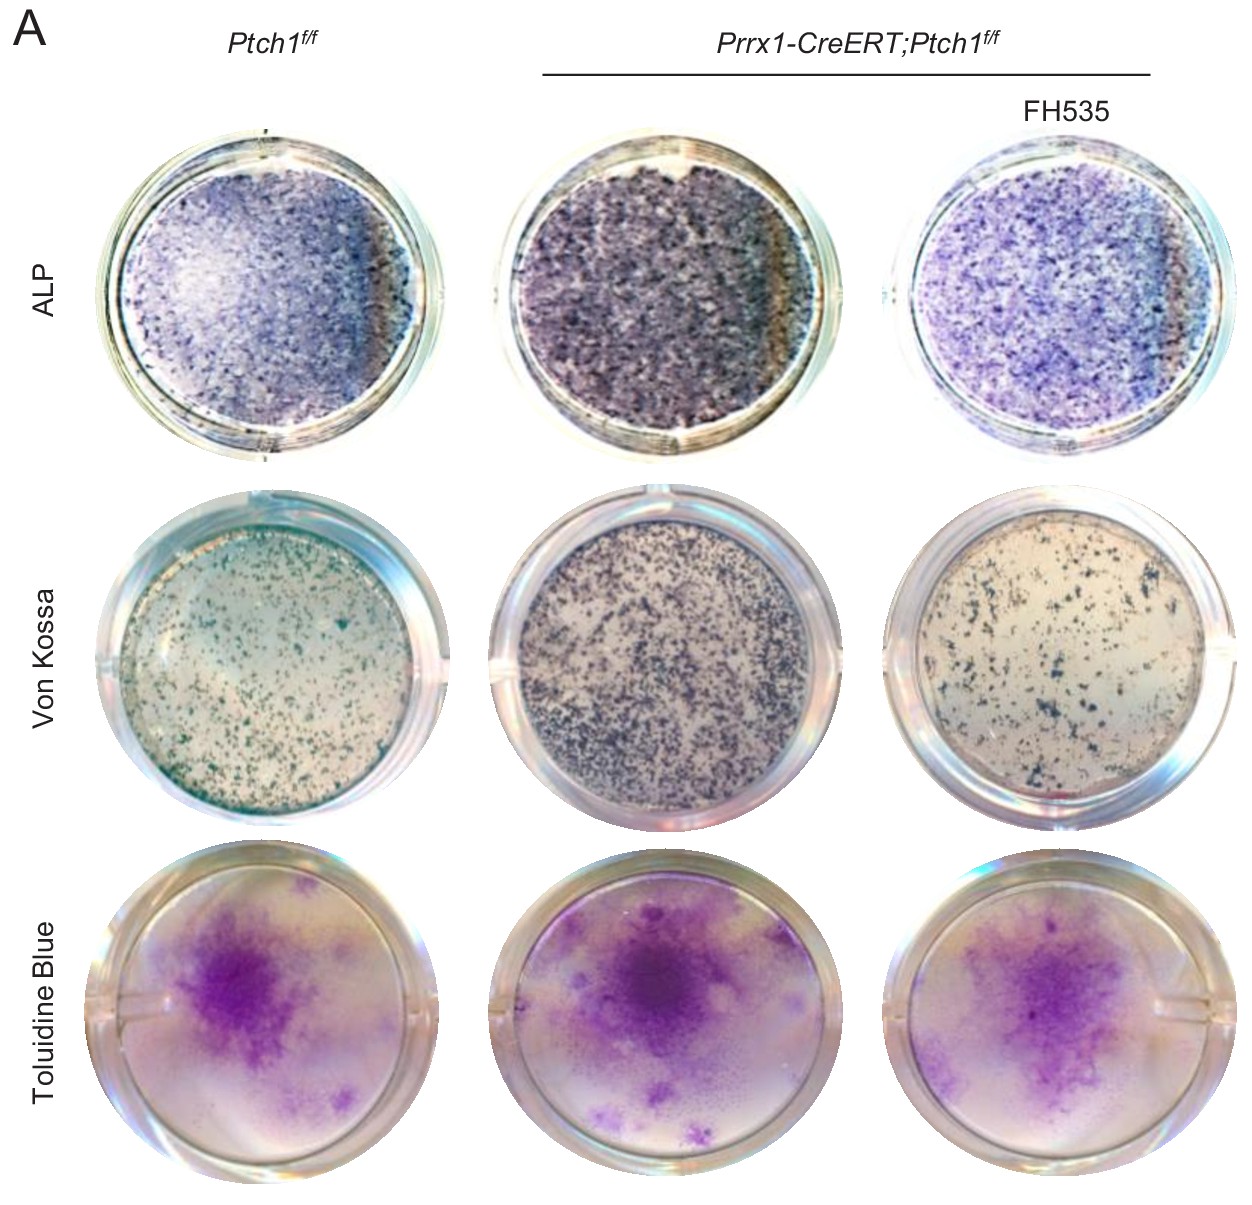
FH353 rescued accelerated MSC osteogenic and chondrogenic differentiation caused by Ptch1 ablation.
The experiments were done just like in Figure 8B except that FH353 was used to replace IWP2.
Figure 8—figure supplement 2
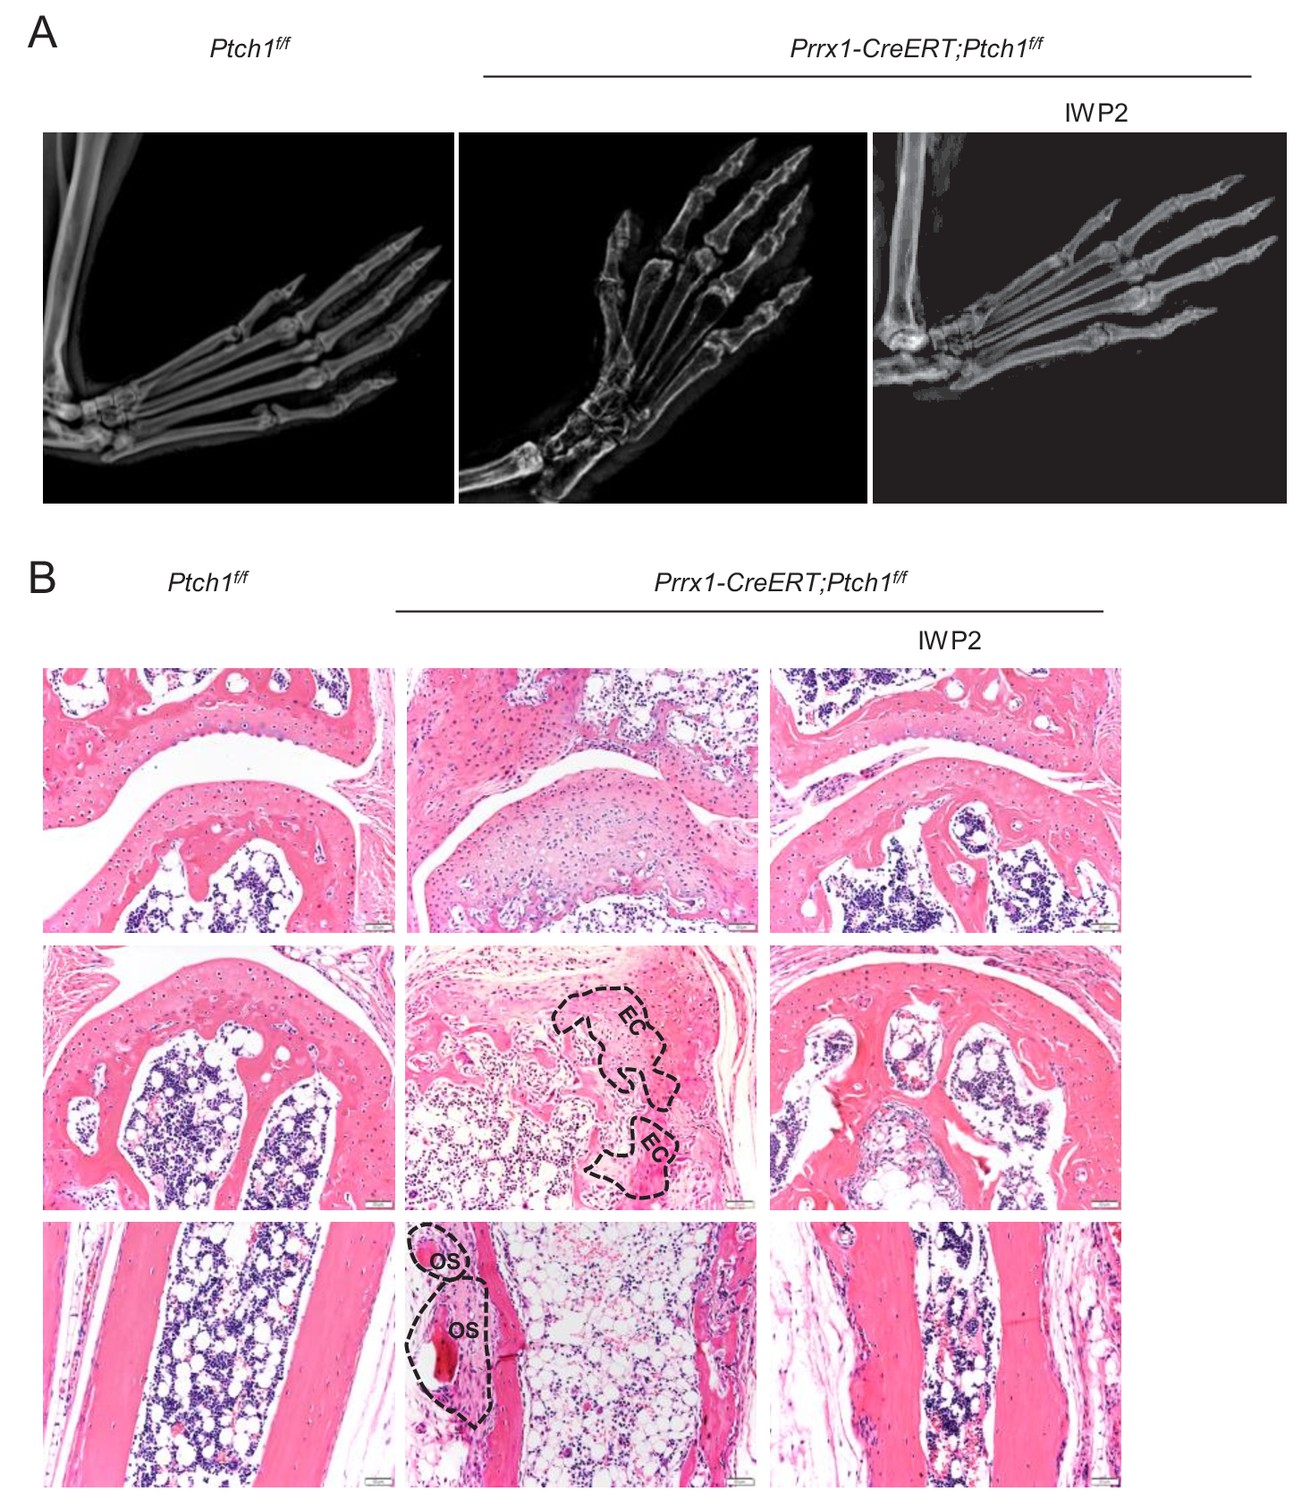
IWP2 rescued the anomalies of the paws of Prrx1-CreERT; Ptch1f/f mice.
(A) Radiographic images of hind paws of Prrx1-CreERT; Ptch1f/f mice treated with IWP2. (B) H/E-staining of paw sections of Prrx1-CreERT; Ptch1f/f mice treated with IWP2.
Additional files
-
Supplementary file 1
Key resources table.
- https://doi.org/10.7554/eLife.50208.024
-
Supplementary file 2
The primers for qPCR analysis.
- https://doi.org/10.7554/eLife.50208.025
Download links
A two-part list of links to download the article, or parts of the article, in various formats.
Downloads (link to download the article as PDF)
Open citations (links to open the citations from this article in various online reference manager services)
Cite this article (links to download the citations from this article in formats compatible with various reference manager tools)
Activation of hedgehog signaling in mesenchymal stem cells induces cartilage and bone tumor formation via Wnt/β-Catenin
eLife 8:e50208.
https://doi.org/10.7554/eLife.50208


