CNApp, a tool for the quantification of copy number alterations and integrative analysis revealing clinical implications
- Institut D'Investigacions Biomèdiques August Pi i Sunyer (IDIBAPS), Hospital Clínic de Barcelona, Centro de Investigación Biomédica en Red de Enfermedades Hepáticas y Digestivas (CIBEREHD), Universitat de Barcelona, Spain
- CIBEREHD, Spain
- Icahn School of Medicine at Mount Sinai, United States
- Institució Catalana de Recerca i Estudis Avançats (ICREA), Spain
- Universitat Autònoma de Barcelona, Spain
Figures
Figure 1 with 1 supplement
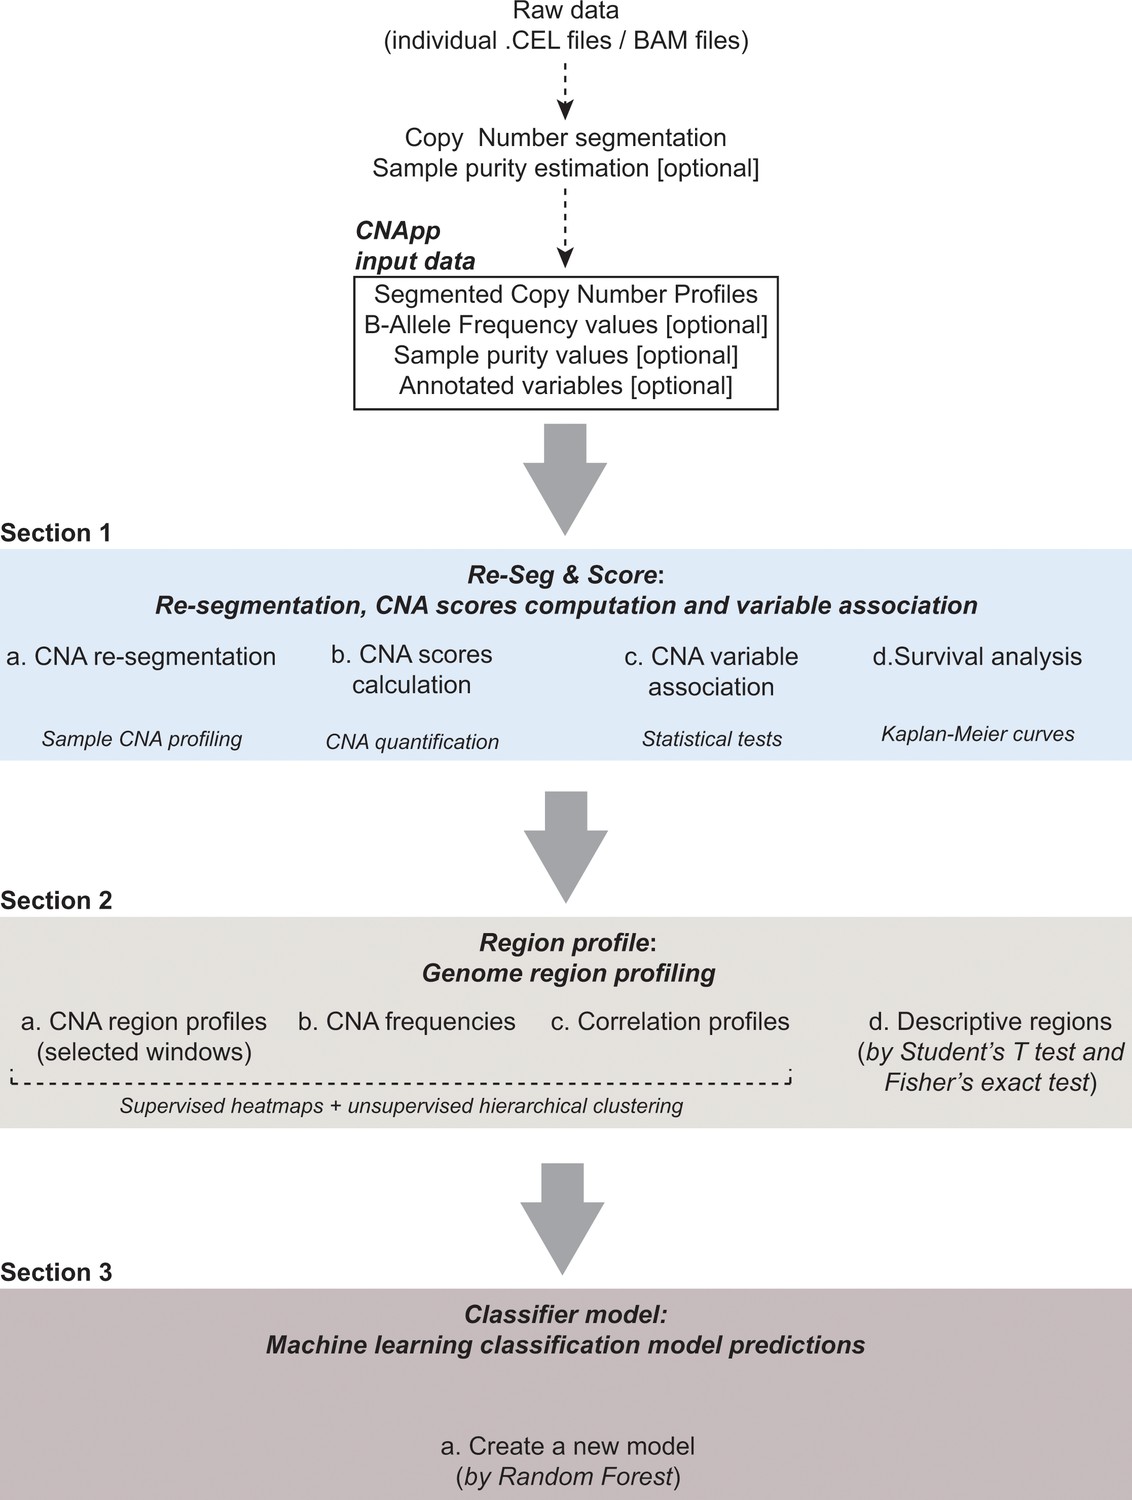
CNApp workflow.
The diagram depicts the overall processes performed by CNApp and indicates the output for each section.
Figure 1—figure supplement 1
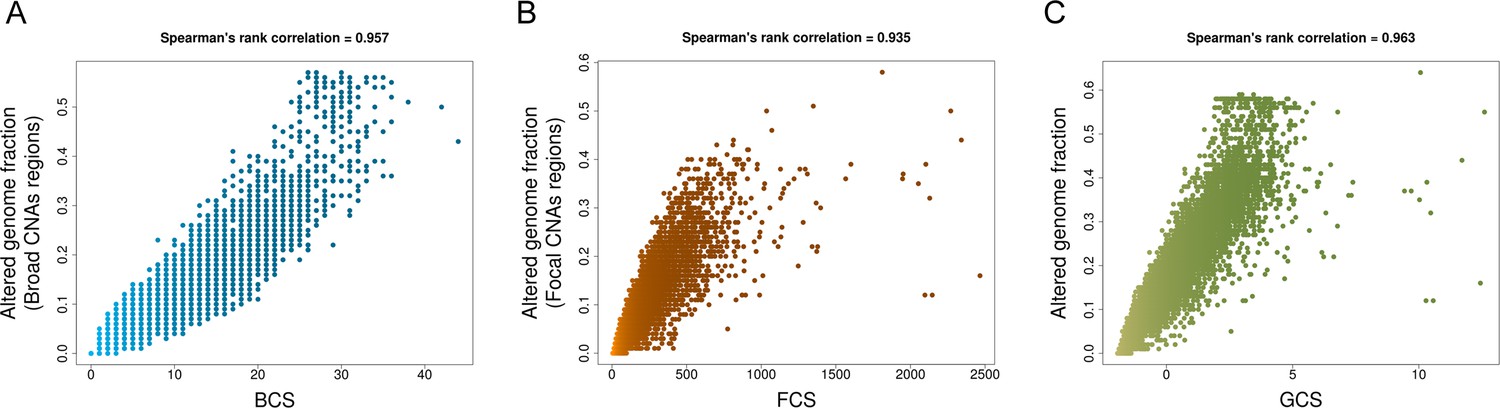
Spearman’s rank correlations between CNA scores and fractions of altered genome.
(A) Broad CNA Score (BCS) and fractions of altered genome affected by broad CNA events (whole chromosome and arm-level alterations) in each respective sample (Figure 1—figure supplment 1—source data 1). (B) Focal CNA Score (FCS) and the fraction of altered genome by focal CNA events in each respective sample (Figure 1—figure supplment 1—source data 1). (C) Global CNA Score (GCS) and the overall fraction of altered genome in each respective sample (Figure 1—figure supplment 1—source data 1). (TIFF 572 KB).
-
Figure 1—figure supplement 1—source data 1
Data used for Spearman’s rank correlation analyses between CNA scores and fractions of altered genome.
- https://cdn.elifesciences.org/articles/50267/elife-50267-fig1-figsupp1-data1-v2.xlsx
Figure 2 with 2 supplements
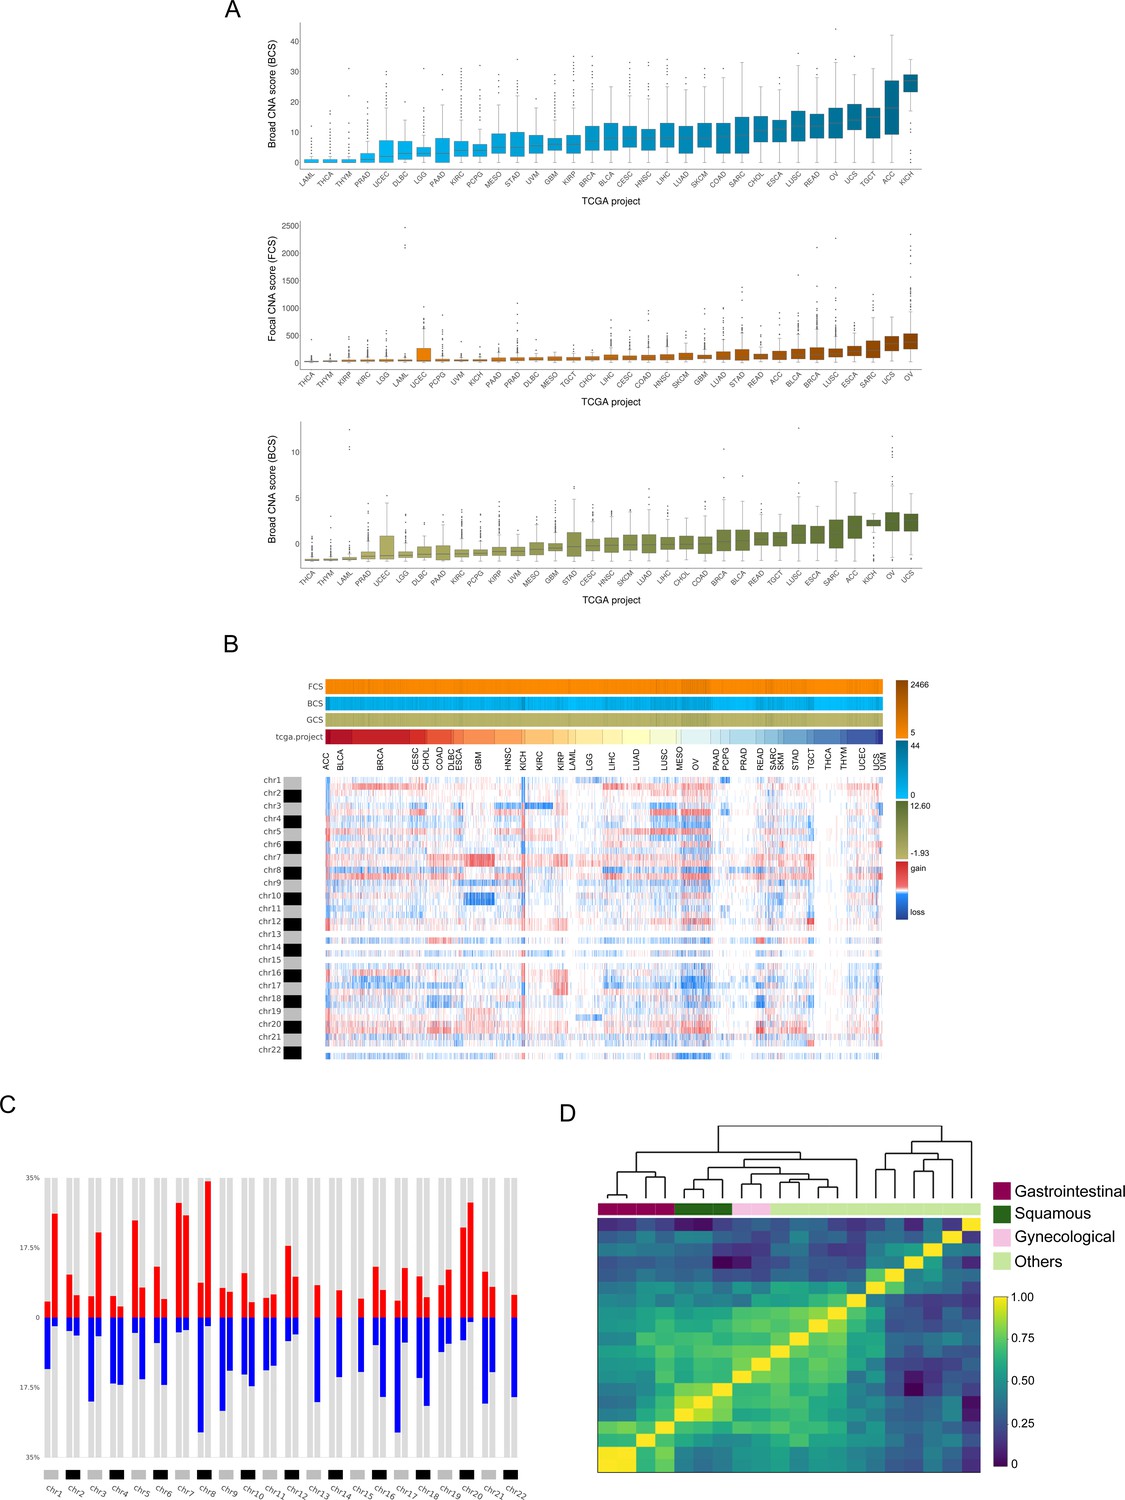
Analysis of the TCGA pan-cancer dataset and clustering by tumor type.
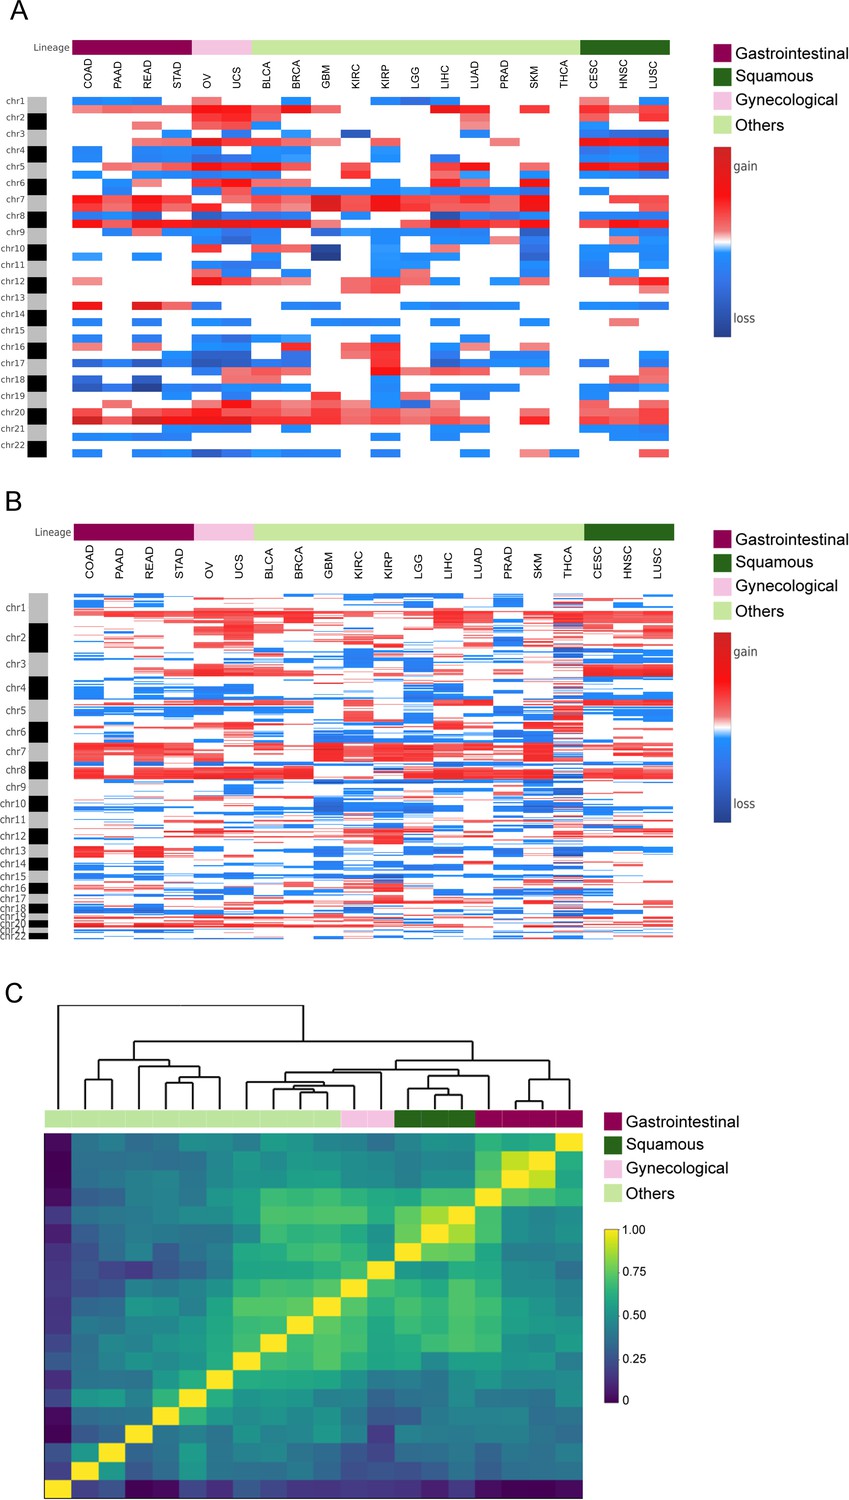
CNApp outputs to characterize pan-cancer 10,635 samples including 33 TCGA cancer types. (A) Broad, Focal and Global CNA scores (BCS, FCS and GCS, respectively) distribution across the 33 cancer types (Figure 2—source data 1). (B) Genome-wide chromosome arm CNA profile heatmap for 10,635 samples considering broad and focal events. Annotation tracks for FCS, BCS and GCS are presented. (C) Arm regions frequencies as percentages relative to the TCGA pan-cancer dataset (red for gains and blue for losses). (D) Heatmap plot showing 20 out of the 33 TCGA cancer type profile correlations, by Pearson's method, hierarchically clustered by tissue of origin. Gastrointestinal, gynecological and squamous cancers are clustering consistently in their respective groups.
-
Figure 2—source data 1
Broad, Focal and Global CNA scores across the pan-cancer cohort.
- https://cdn.elifesciences.org/articles/50267/elife-50267-fig2-data1-v2.xlsx
Figure 2—figure supplement 1
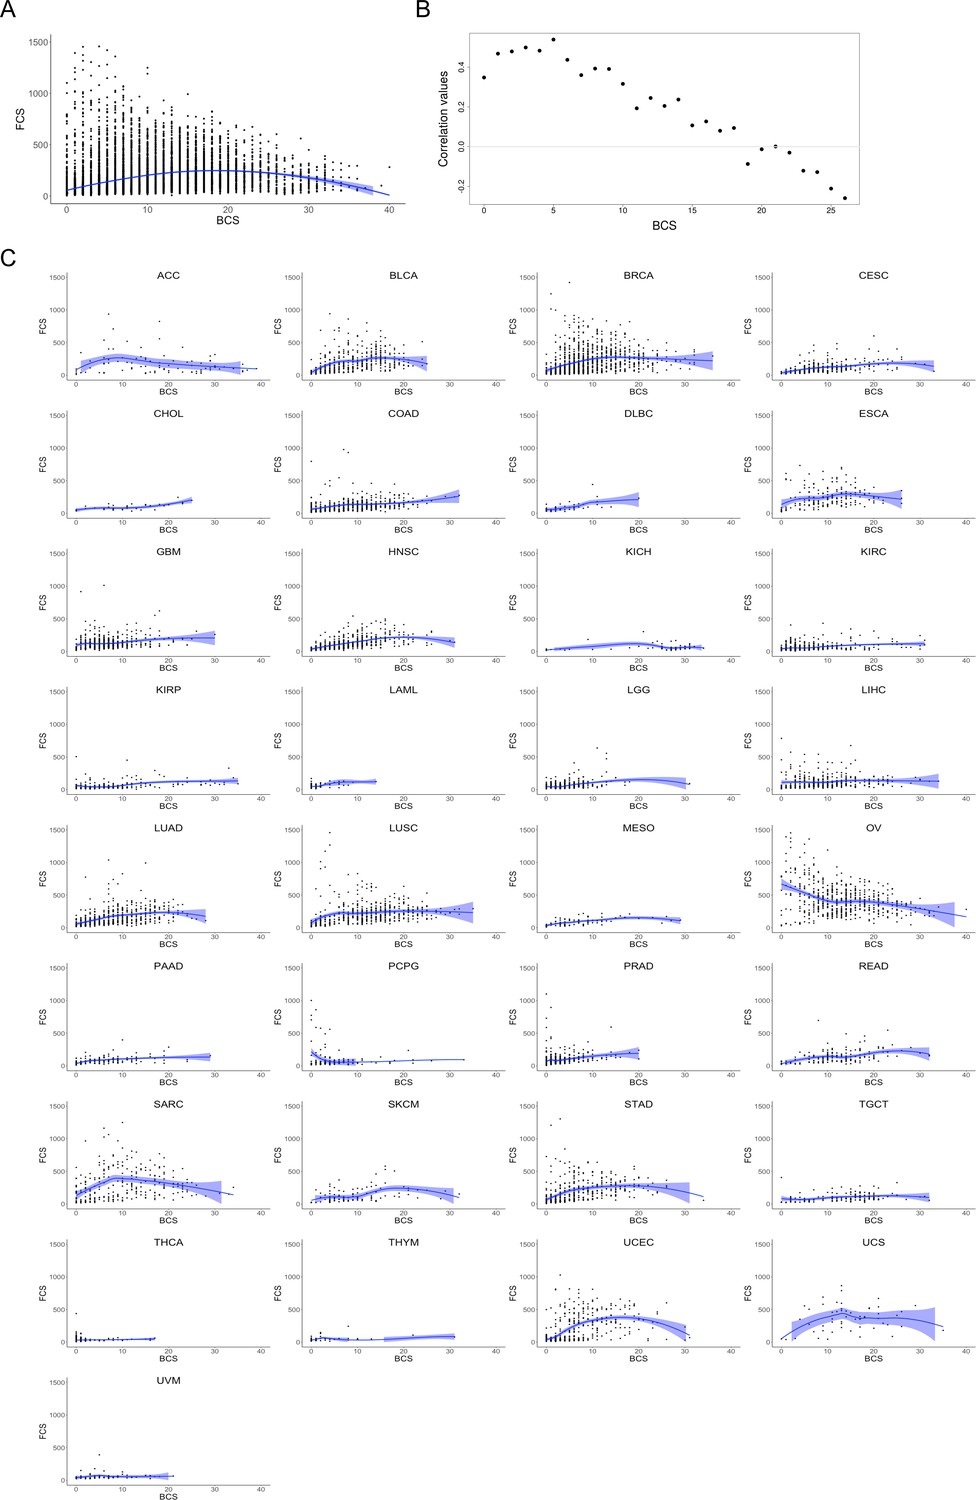
Correlation plots between FCS and BCS.
(A) BCS values (x-axis) and FCS values (y-axis) scatterplot for 10,635 samples from pan-cancer cohort. Scatterplot smoothing by loess regression curve (in blue) and confidence interval. (B) Correlation plot showing broad and focal CNA score values for the TCGA pan-cancer dataset. Spearman’s rank correlation test between broad and focal CNA scores (BCS and FCS, respectively) was performed. Sample subsets were computed by selecting 500 random samples from those displaying BCS ±5 for each BCS value. Values of BCS and FCS for each subset of samples were correlated. (C) Scatterplots for the 33 cancer types with BCS values (x axis) and FCS values (y axis) in samples. Scatterplot smoothing by loess regression curve (in blue) and confidence interval. (TIFF 3.7 MB).
Figure 2—figure supplement 2
Clustering analysis between cancer types.
(A) Heatmap analysis showing mean chromosome arm region profiles taking into account both broad and focal alterations, spanning 20 cancer type, for 8653 samples from the TCGA pan-cancer dataset. Cancer types were indicated in the column ID from the input file. Annotation track displays tumor types, including squamous cell carcinomas, gynecological cancers, gastrointestinal cancers, and others. (B) Heatmap analysis showing mean 5 Mb region profiles taking into account only focal alterations, spanning 20 cancer type, for 8653 samples from the TCGA pan-cancer dataset. Cancer types were indicated in the column ID from the input file. Annotation track displays tumor types, including squamous cell carcinomas, gynecological cancers, gastrointestinal cancers, and others. (C) Heatmap plot showing 20 out of the 33 TCGA cancer type profile (by 5 Mb genomic regions and accounting only for focal alterations) correlations, by Pearson's method, hierarchically clustered by tissue of origin. Gastrointestinal, gynecological and squamous cancers are clustering consistently in their respective groups. (TIFF 2.8 MB).
Figure 3 with 1 supplement
Identification of recurrent broad and focal CNAs.
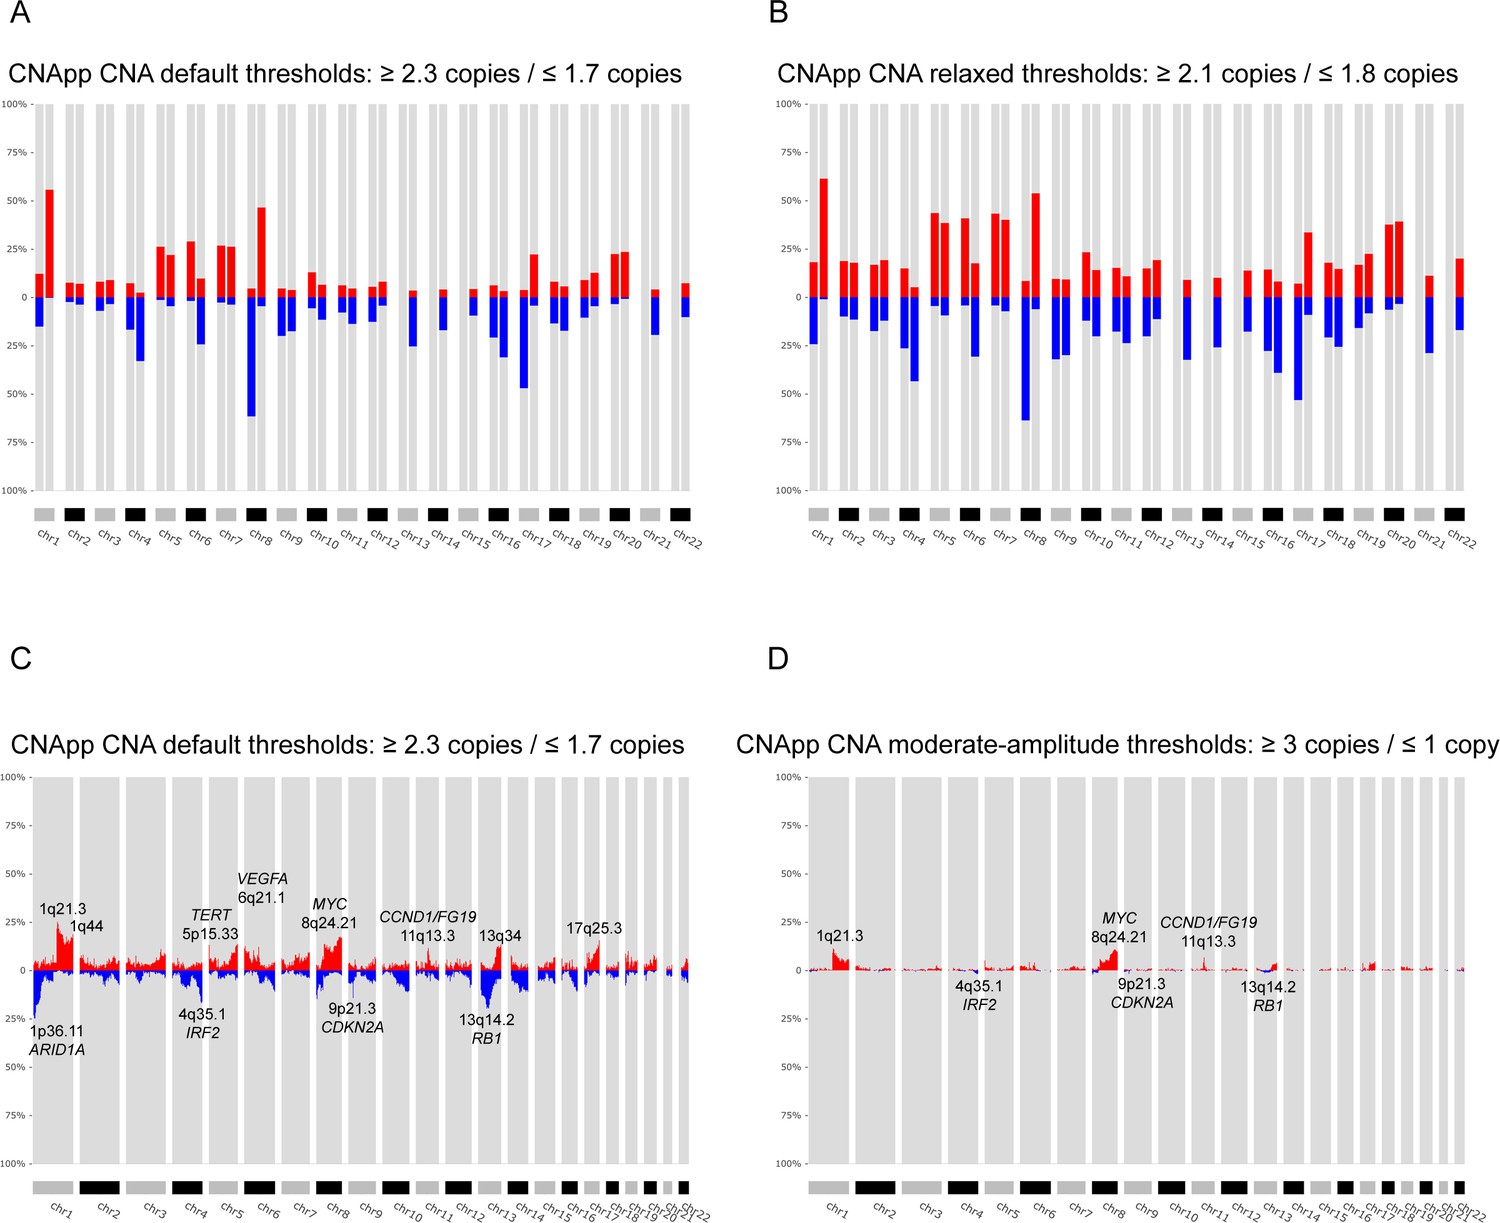
Calculation of broad and focal CNA frequencies using several parameters in CNApp in order to describe the genomic landscape of LIHC. (A) CNApp frequencies for chromosome arm regions using default cutoffs, corresponding to 2.3/1.7 copies for gains and losses, respectively. (B) CNApp frequencies for chromosome arm regions relaxing cutoffs to make them equivalent to those of GISTIC2.0. (C) CNApp frequencies of focal events using default thresholds and sub-cytobands genomic regions. (D) Frequencies of focal events from moderate- to high-amplitude levels using sub-cytobands genomic regions.
Figure 3—figure supplement 1
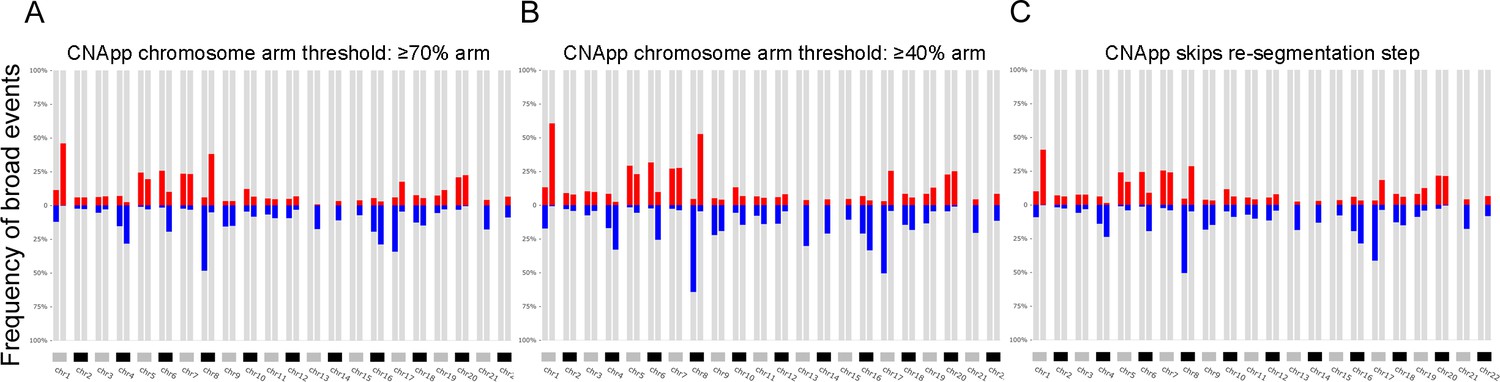
Genomic profiles corresponding to the LIHC dataset using alternative thresholds.
(A) The threshold of the relative length to the chromosome arm was set at ≥70% to classify segments as chromosome arm-level. (B) Lowering the threshold of the relative length to the chromosome arm to ≥40%. (C) Frequency plot using input data without the re-segmentation step. (TIFF 721 KB).
Figure 4 with 1 supplement
Genomic characterization of colon cancer according to the CMS classification.
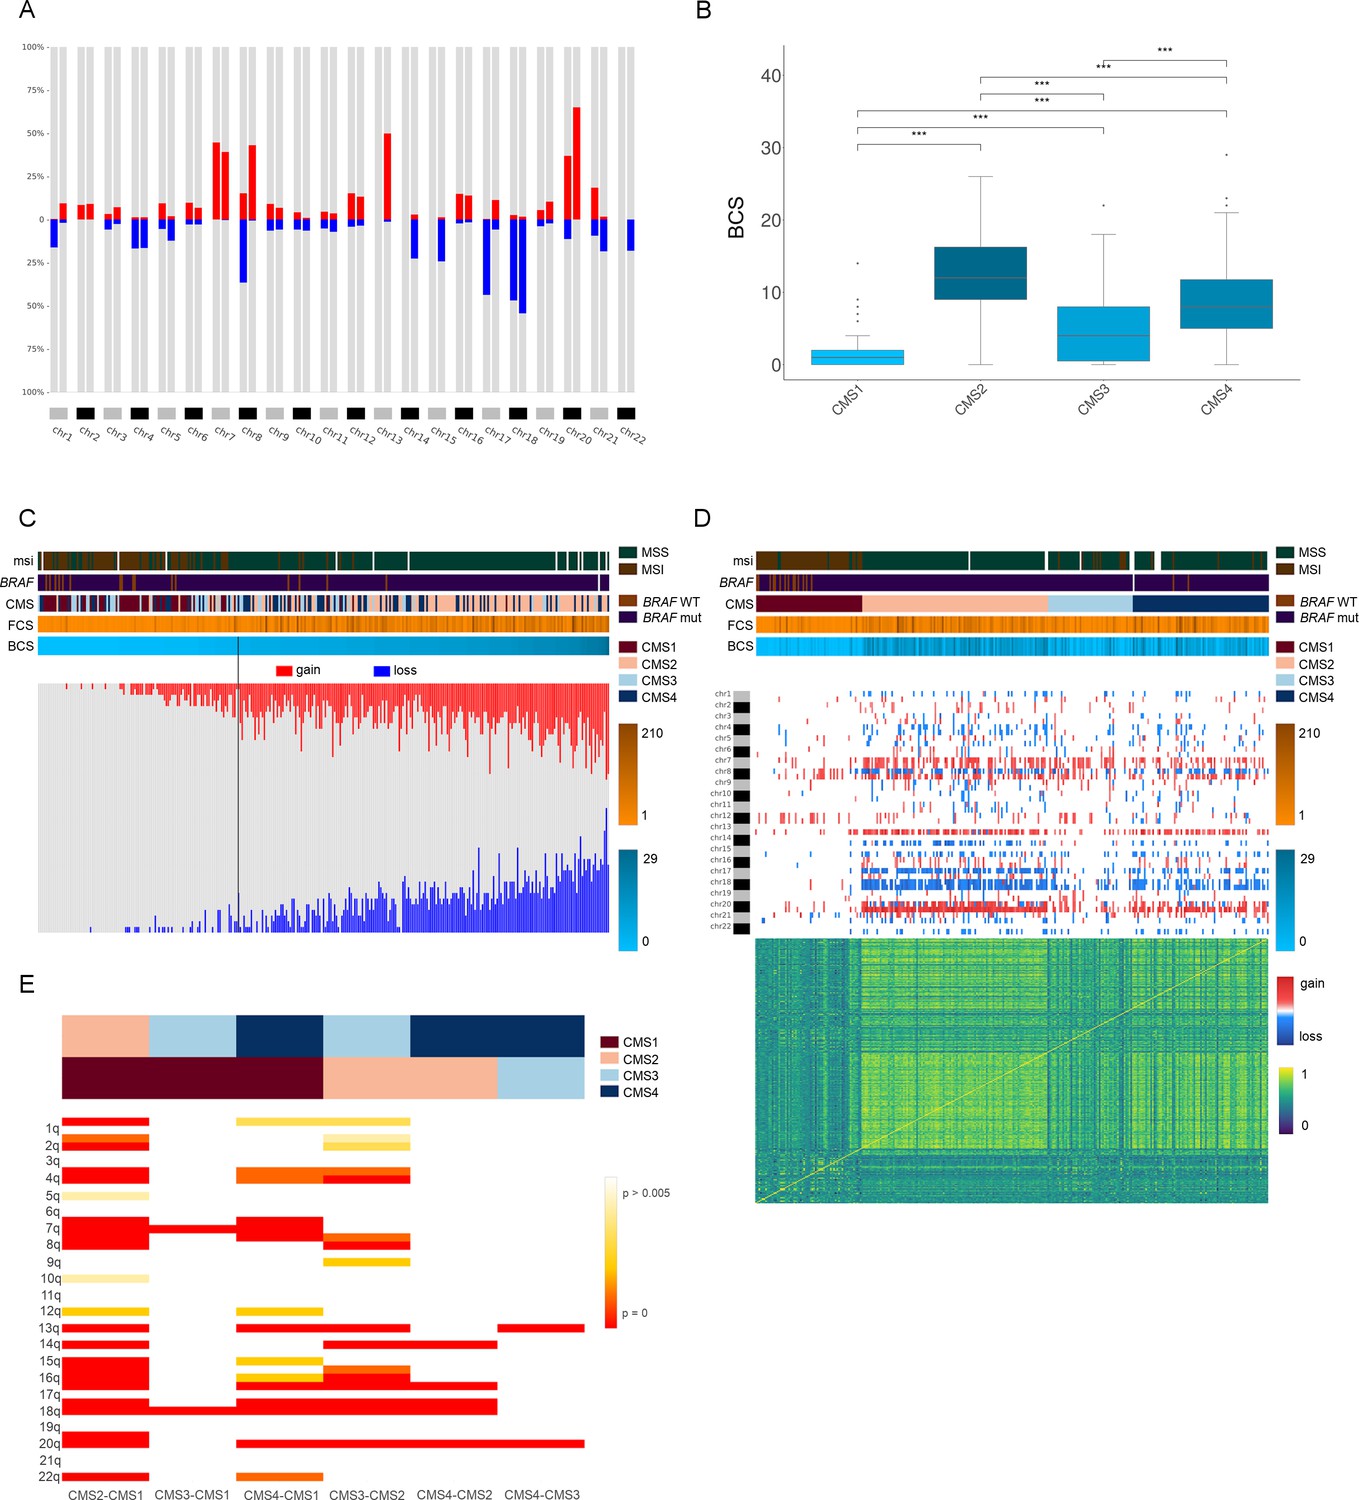
(A) Arm-region frequencies of 309 colon cancer samples using CNApp default thresholds for CNAs. (B) BCS distribution by CMS sample groups (Figure 4—source data 1). FCS distribution by CMS sample groups is presented in Figure 4—figure supplement 1C. Wilcoxon rank-sum test significance is shown as p-value≤0.001 (***); p-value≤0.01 (**); p-value≤0.05 (*); p-value>0.05 (ns). (C) Number of gained and lost chromosome arms for each sample distributed according to the BCS values. Note that a cutoff at four is indicated with a black line. Annotation tracks for microsatellite instability (msi), BRAF mutated samples (braf_mut), CMS groups (cms_label), FCS and BCS are displayed. (D) Genome-wide profiling by chromosome arms distributed according to the CMS group. Annotation tracks for microsatellite instability (msi), BRAF mutated samples (braf_mut), CMS groups (cms_label), FCS and BCS are displayed. Sample-to-sample correlation heatmap plot by Pearson’s method is shown below. (E) Differentially altered chromosome arm regions between CMS groups (CMS1, CMS2, CMS3 and CMS4). Heatmap plot displaying the significance between CMS groups paired comparisons. Student’s T-test was applied and multiple testing correction by BH method was used to assess differences in chromosome arm values between groups. Adjusted p-values are displayed.
-
Figure 4—source data 1
BCS by CMS sample group.
- https://cdn.elifesciences.org/articles/50267/elife-50267-fig4-data1-v2.xlsx
Figure 4—figure supplement 1
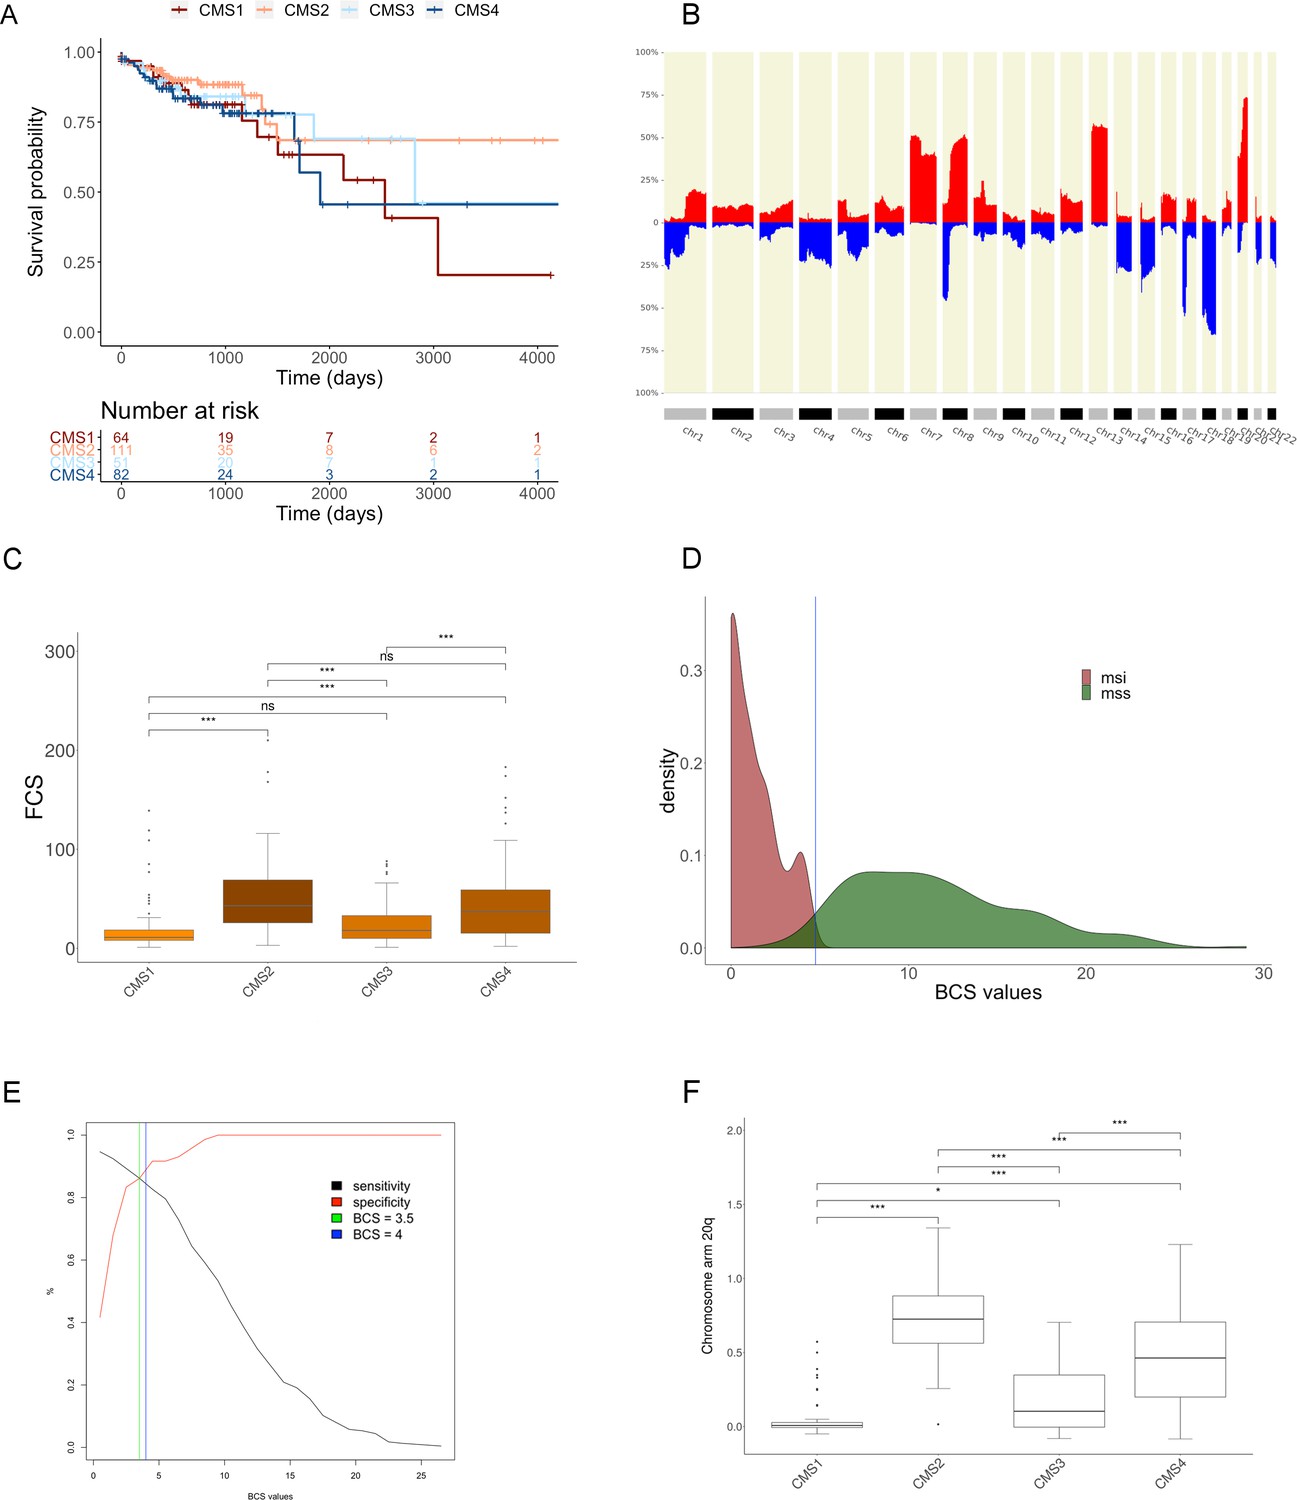
Genomic analysis of the COAD cohort.
(A) Kaplan-Meier survival analysis across CMS groups for overall survival (see Materials and methods section for clinical data extracted from TCGA data portal). (B) CNA profile bar plot with CNA alterations frequencies of 462 colon adenocarcinoma (TCGA-COAD cohort) and 164 rectum adenocarcinoma (TCGA-READ) samples using CNApp default thresholds (read for gains and blue for losses). (C) Box plot showing the distribution of FCS according to the CMS groups for 309 colon adenocarcinoma samples (Figure 4—figure supplement 1—source data 1). Wilcoxon rank-sum test was performed for each pair of groups to assess significant differences. Significance is expressed as: p-value≤0.001 (***); p -value ≤ 0.01 (**); p -value ≤ 0.05 (*); p -value > 0.05 (ns). (D) BCS values density plot for MSI (brown) and MSS (green) sample groups after Classifier model section implementation selecting BCS as classifier variable (N = 297 colon cancer samples). Vertical blue line at BCS = 4.75, as interception value between groups. (E) Sensitivity and specificity curves in ROC analysis across BCS threshold values showing the intersection value of 3.75 (green vertical line). The blue line shows our proposed threshold of BCS = 4. (F) Distribution of chromosome arm 20q copy-number amplitude values according to the CMS groups. Wilcoxon rank-sum test was performed for each pair of groups to assess significant differences. Significance is shown as p-value≤0.001 (***); p-value≤0.01 (**); p-value≤0.05 (*); p-value>0.05 (ns). (TIFF 664 KB).
-
Figure 4—figure supplement 1—source data 1
FCS by CMS sample group.
- https://cdn.elifesciences.org/articles/50267/elife-50267-fig4-figsupp1-data1-v2.xlsx
Author response image 1
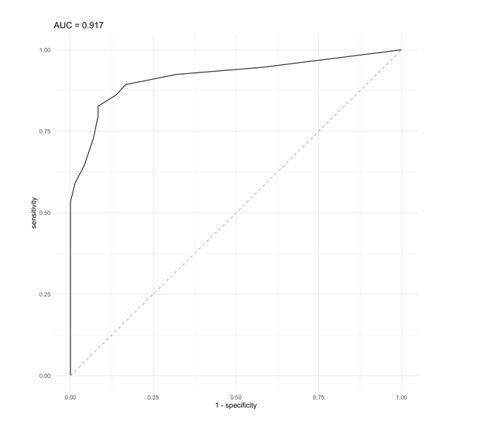
ROC curve analysis using a BCS value as classifier proxies resulted in AUC = 0.917.
Author response image 2
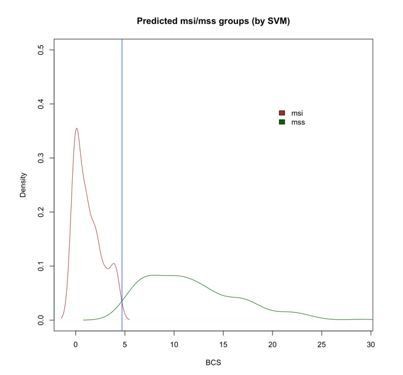
Density plot of BCS values across MSI and MSS-predicted samples with SVM showing the intersection at 4.7 (blue vertical line).
Author response image 3
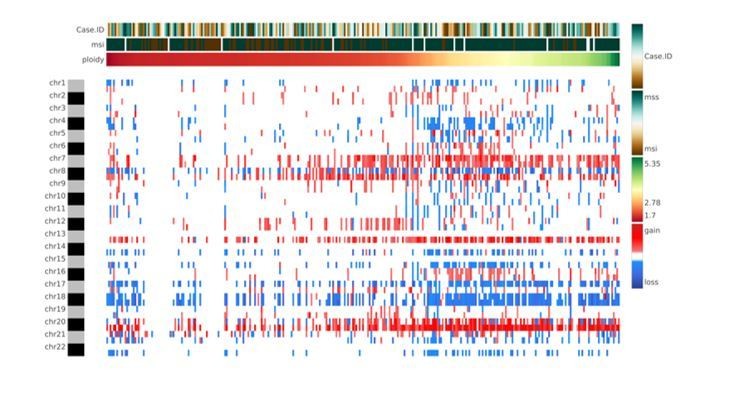
Heatmap showing chromosome-arm level CNAs for the COAD cohort with integration of the ploidy values for each sample.
Tables
Table 1
Corresponding weights (A) for each threshold, CNA level and its absolute copy number.
| Thresholds (Log2ratio values) | CNA level | Copy number | Weights (A) |
|---|---|---|---|
| 1 | High-level gain | ≥4 copies | 3 |
| 0.58 | Medium-level gain | [3–4) copies | 2 |
| 0.2 | Low-level gain | [2.3–3] copies | 1 |
| −0.2 | Low-level loss | (1–1.7] copies | 1 |
| -1 | Medium-level loss | (0.6–1] copies | 2 |
| −1.74 | High-level loss | ≤0.6 copies | 3 |
| [−0.2–0.2] | Copy-neutral loss-of-heterozygosity (CN-LOH) | [1.7–2.3] copies BAF ≥ 0.25 | 2 |
Table 2
Coverage punctuation (L) for focal events.
| % chromosome-arm coverage | Coverage punctuation (L) |
|---|---|
| ≤5% | 1 |
| >5% to≤15% | 2 |
| >15% to≤30% | 3 |
| >30% | 4 |
Table 3
Statistical tests used in CNApp.
| Parametric | Non-parametric | ||
|---|---|---|---|
| Categoric | n = 2 | Student’s T-test | Wilcoxon rank-sum test |
| n > 2 | ANOVA | ANOVA: Kruskal test | |
| Numerical | Pearson's rank correlation | Spearman's rank correlation |
-
n = groups defined by annotation variable.
Additional files
-
Supplementary file 1
Comparative analysis of broad CNA frequencies between CNApp and GISTIC2.0.
This table displays the comparison between GISTIC and CNApp in terms of broad CNAs by dividing the genome in chromosome arms. First set of columns shows GISTIC frequencies of amplifications (Amp_Freq) and deletions (Del_Freq) with a threshold set at |0.1|. Remaining columns include results from CNApp, using different parameters. CNApp default CNA thresholds are |0.2|, whereas CNApp relaxed CNA thresholds were dropped to |0.1|. CNApp resegmentation parameters (reseg) are indicated accordingly. (XLSX 15 KB)
- https://cdn.elifesciences.org/articles/50267/elife-50267-supp1-v2.xlsx
-
Supplementary file 2
Frequencies of focal alterations identified by CNApp using minor sub-cytobands genomic windows.
First three columns (No CNA, CN Gain, CN Loss) display the number of samples with no CNA, gains or losses at each minor sub-cytoband using CNApp default thresholds. Next columns (‘low-level’ amplitude thresholds) indicate frequencies for each alteration (FreqGain, FreqLoss) using CNApp default thresholds. Percentile 90th indicates if this region is among the top recurrent altered regions. The last set of columns (‘Moderate’ amplitude thresholds) refers to frequencies of gains and losses when amplitude thresholds are set at log2 values of 0.58 (gains) and −1 (losses). (XLSX 70 KB)
- https://cdn.elifesciences.org/articles/50267/elife-50267-supp2-v2.xlsx
-
Supplementary file 3
Comparison between significant regional peaks of amplification and deletion identified by GISTIC2.0 and CNApp in the LIHC cohort.
Statistically significant focal genomic peaks identified by GISTIC2.0 (Q-value and residual Q-value) and the corresponding frequency reported by CNApp in the equivalent minor sub-cytoband genomic windows. Percentile 90th indicates if this region is among the top recurrent altered regions. (XLSX 16 KB)
- https://cdn.elifesciences.org/articles/50267/elife-50267-supp3-v2.xlsx
-
Transparent reporting form
- https://cdn.elifesciences.org/articles/50267/elife-50267-transrepform-v2.docx
Download links
A two-part list of links to download the article, or parts of the article, in various formats.
Downloads (link to download the article as PDF)
Open citations (links to open the citations from this article in various online reference manager services)
Cite this article (links to download the citations from this article in formats compatible with various reference manager tools)
CNApp, a tool for the quantification of copy number alterations and integrative analysis revealing clinical implications
eLife 9:e50267.
https://doi.org/10.7554/eLife.50267


