Mechanisms of hyperexcitability in Alzheimer’s disease hiPSC-derived neurons and cerebral organoids vs isogenic controls
- The Scripps Research Institute, United States
- Scintillon Institute, United States
- University of California, San Diego, United States
Figures
Figure 1 with 2 supplements

AD neurons show enhanced excitability compared to isogenic control neurons.
(A) Spontaneous action potentials (sAP) at resting membrane potential (RMP). WT/WT hiPSC-derived cerebrocortical neuron data in black, M146V/WT and APPswe/WT in red. (B) Quantification of sAP frequency. (C) Evoked APs in neurons hyperpolarized to −60 mV. Single traces (insets). (D–H) Neuronal membrane and AP properties. Quantification of resting membrane potential (RMP, (D), AP threshold (APthreshold, (E); AP height (F); width at AP half height (G); AP decay slope (H). (I). Quantification of cell capacitance (Cm), reflecting neuronal size. Data are mean ± SEM. Statistical significance analyzed by ANOVA with post hoc Dunnett’s test. Exact p values for comparison to WT are listed in the bar graphs in this and subsequent figures. Unless otherwise stated, total number of neurons quantified is listed above the bars in this and subsequent electrophysiology figures.
-
Figure 1—source data 1
Excel files containing data shown as summary bar graph in Figure 1B,D–I.
- https://cdn.elifesciences.org/articles/50333/elife-50333-fig1-data1-v2.xlsx
Figure 1—figure supplement 1

AD hiPSC-derived neuronal cultures express cortical neuronal markers and aberrant Aβ levels compared to isogenic controls.
(A) DNA sequencing to confirm the presence of mutations in hiPSC-derived neural progenitor cells with WT/WT, M146V/WT, and APPswe/WT genotypes. (B) hiPSC-derived neurons showing FOXG1 and Tuj1 expression. (C) hiPSC-derived neurons showing FOXG1 and CTIP2 expression. (D) Ratio of Aβ42/Aβ40 quantified by ELISA from cultures at 5 weeks. (E) Quantification of Aβ levels normalized to total protein from lysates at 5 weeks. Data are mean ± SEM. Statistical significance analyzed by ANOVA with post hoc Dunnett’s test for multiple comparisons. Number of independent experiments listed above the bars.
Figure 1—figure supplement 2
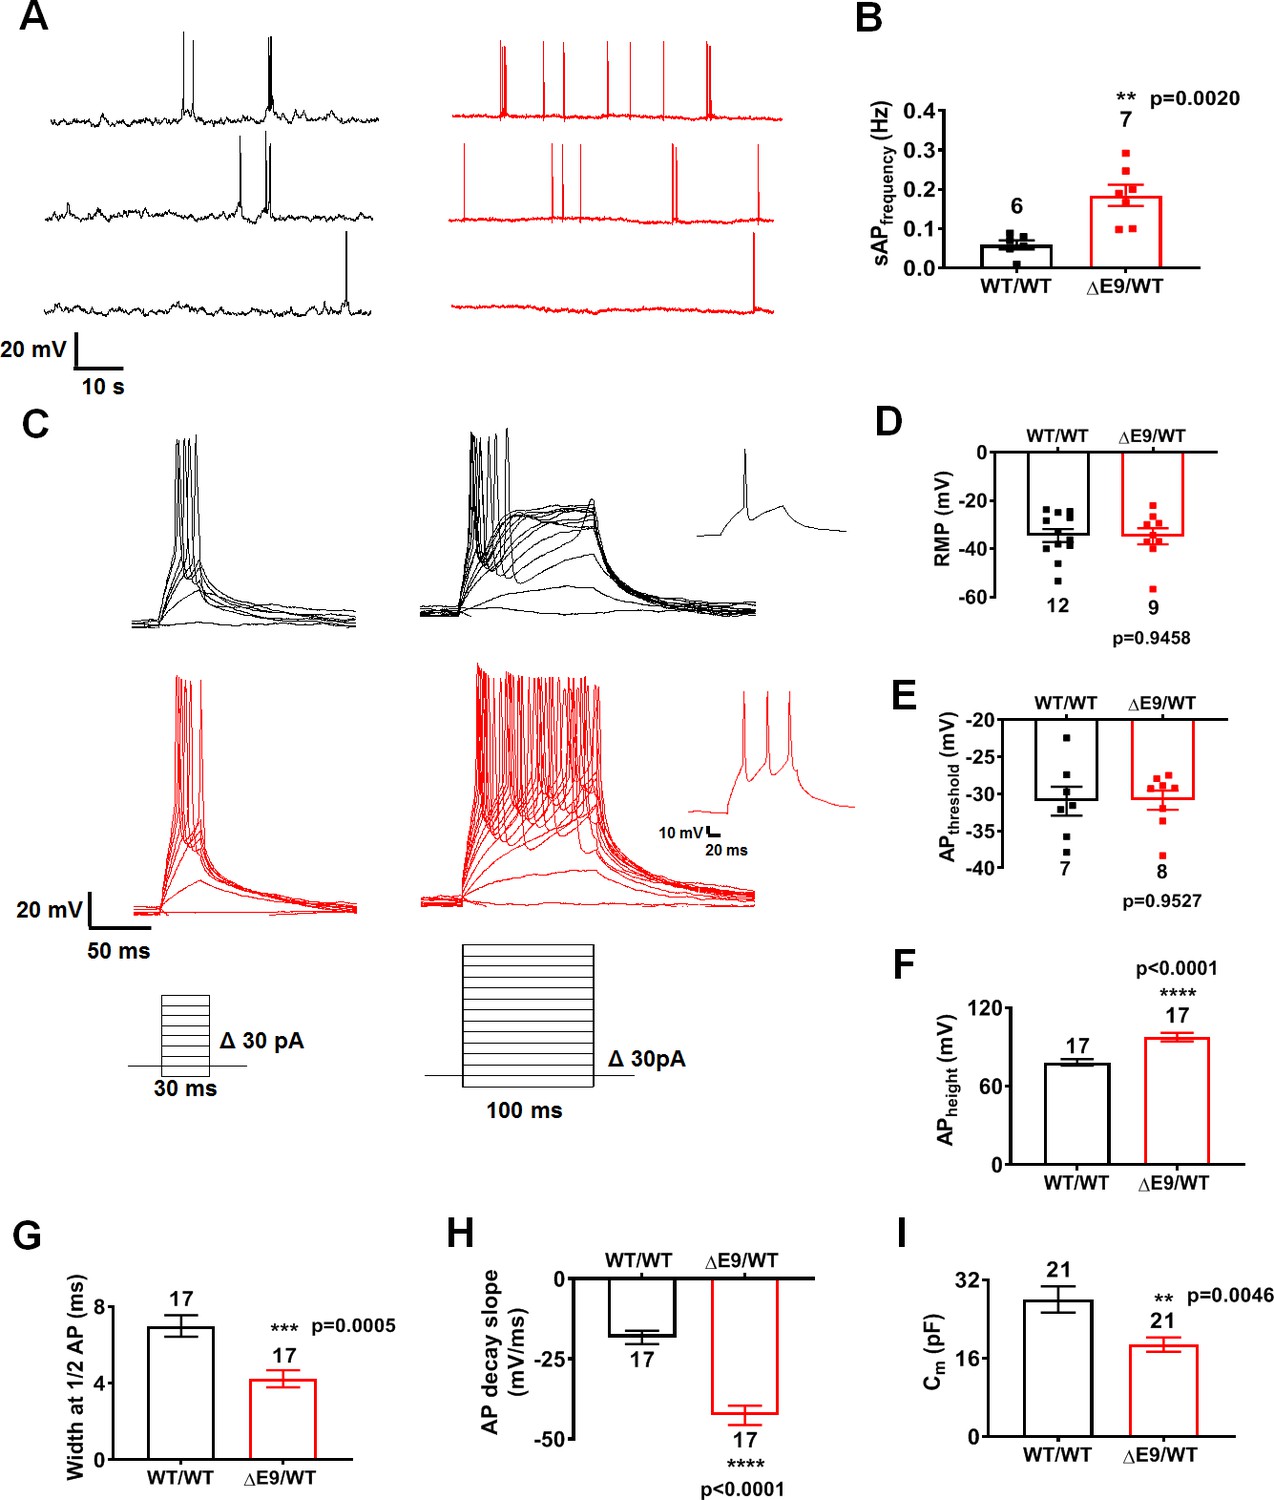
ΔE9/WT neurons show enhanced excitability compared to isogenic control neurons.
(A) Spontaneous action potentials (sAP) at resting membrane potential (RMP). WT/WT hiPSC-derived cerebrocortical neuron data in black, ΔE9/WT in red. (B) Quantification of sAP frequency. (C) Evoked APs in neurons hyperpolarized to −60 mV. Single traces (insets). (D–H) Neuronal membrane and AP properties. Quantification of resting membrane potential (RMP, (D), AP threshold (APthreshold, (E); AP height (F); width at AP half height (G); AP decay slope (H). (I) Quantification of cell capacitance (Cm), reflecting overall neuronal size. Data are mean ± SEM. Statistical significance analyzed by two-tailed unpaired Student’s t-test.
Figure 2 with 2 supplements
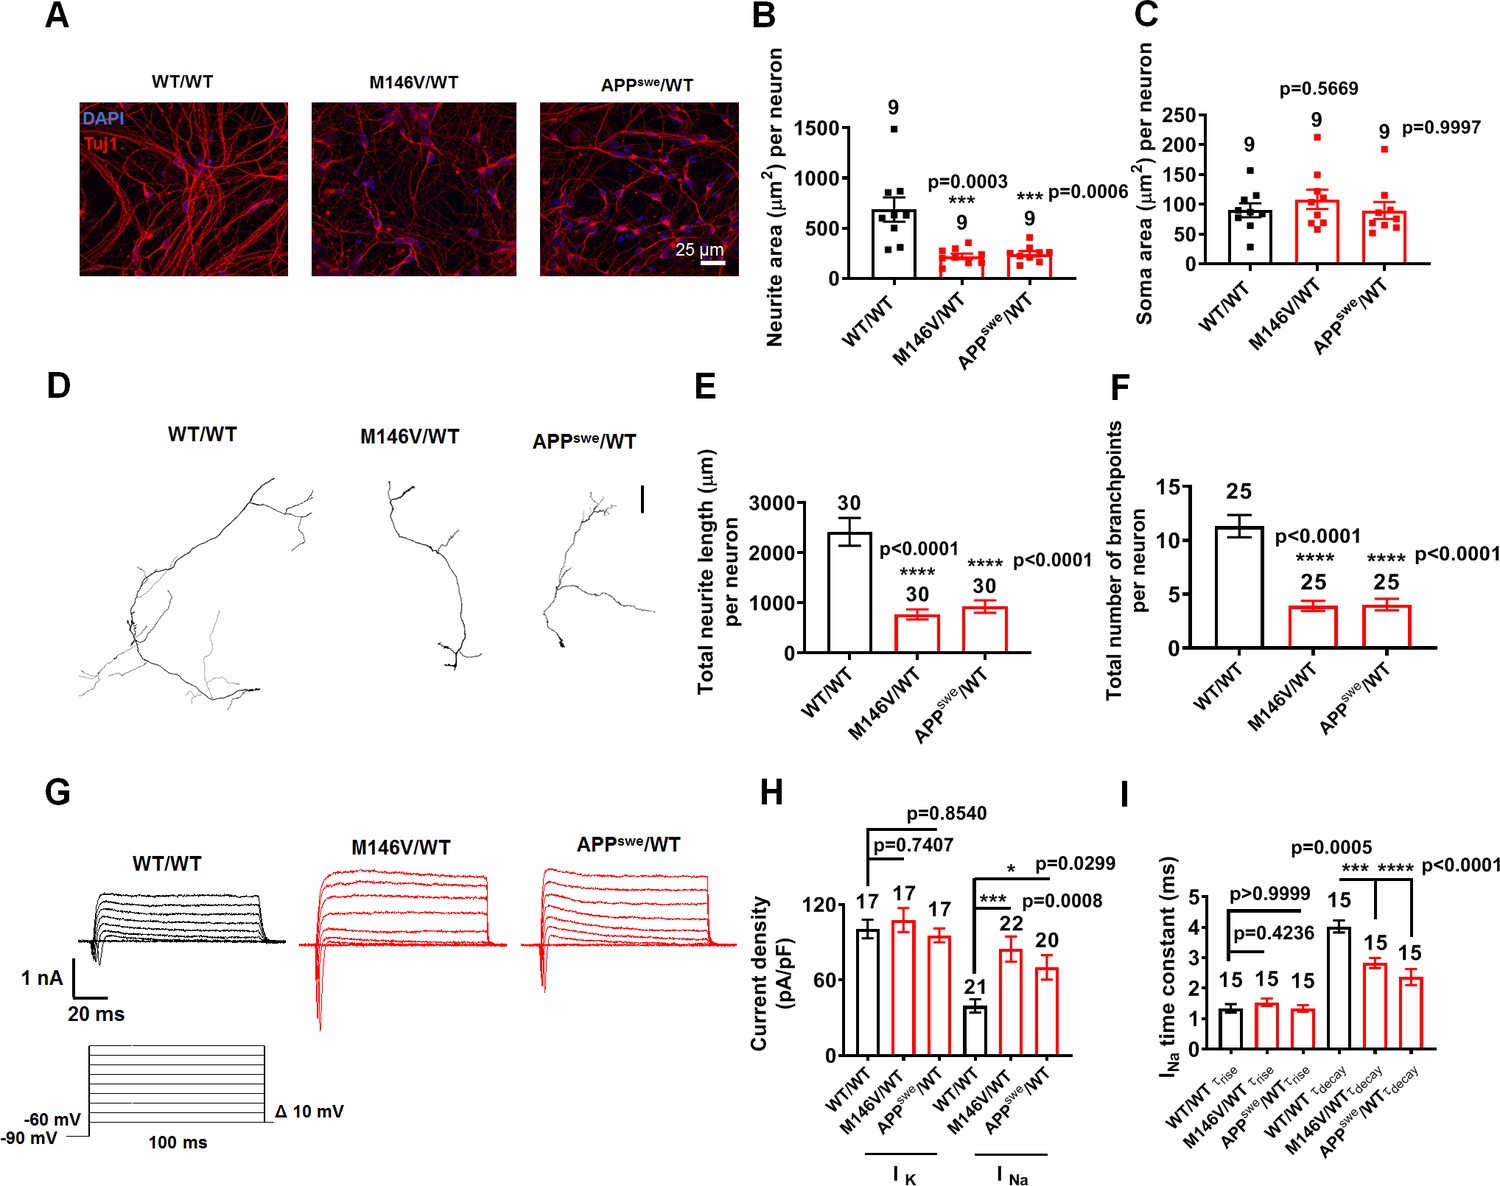
AD neurons show differences in morphology and sodium channel properties compared to WT neurons.
WT/WT hiPSC-derived cerebrocortical neuron data in black, M146V/WT and APPswe/WT in red at 5 weeks of culture. (A) Representative images of cells expressing the neuronal marker Tuj1. (B) Quantification of area covered by neurites expressing Tuj1 normalized to total number of neurons. (C) Quantification of somal area normalized to total number of neurons. Total number of random fields of neuronal cultures analyzed in three separate experiments is listed above the bars in B,C. (D) Representative tracings of neurites from WT/WT, APPswe/WT, and M146V/WT AD lines. Scale bar: 100 µm. (E) Quantification of total neurite length. (F) Quantification of total number of neurite branchpoints. Total number of neurons analyzed in three separate neuronal cultures is listed above the bars in E,F. (G) Representative sodium and potassium currents recorded from neurons clamped at −70 mV. (H) Current densities. (I) Sodium current (INa) rise time (τrise) and decay time (τdecay). Data are mean ± SEM. Statistical significance analyzed by ANOVA with post hoc Dunnett’s test.
-
Figure 2—source data 1
Excel files containing data shown as summary bar graph in Figure 2E,F,H,I.
- https://cdn.elifesciences.org/articles/50333/elife-50333-fig2-data1-v2.xlsx
Figure 2—figure supplement 1
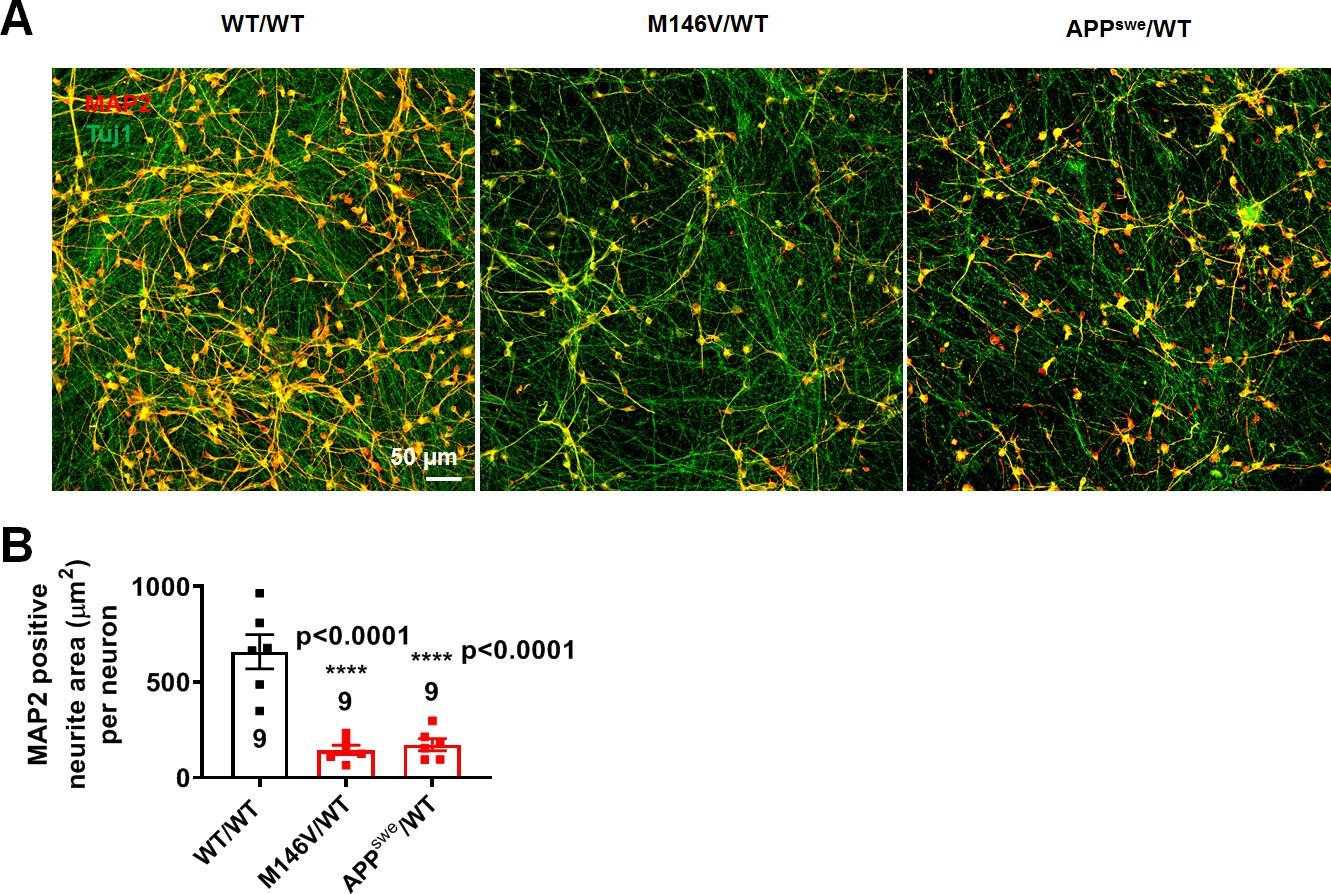
Changes in MAP2 and Tuj1 expression.
(A) Representative images of neurons expressing MAP2 (red) and Tuj1 (green). (B) Quantification of area covered by neurites expressing MAP2 normalized to total number of Tuj1 and DAPI-positive neurons in nine random fields from three different cultures. Data are mean ± SEM. Statistical significance analyzed by ANOVA with post hoc Dunnett’s test (p<0.0001).
Figure 2—figure supplement 2

Changes in Tuj1 expression and sodium channel properties in ΔE9/WT neurons.
(A) Representative images of neurons expressing Tuj1. (B) Quantification of area covered by neurites expressing Tuj1 normalized to total number of neurons. (C) Quantification of somal area normalized to total number of neurons. Total number of random fields of neuronal cultures analyzed in three separate experiments is listed above the bars in B,C. (D) Representative sodium and potassium currents recorded from neurons voltage-clamped at −70 mV. Magnified sodium current traces shown at right. WT/WT hiPSC-derived cerebrocortical neuron data in black, ΔE9/WT AD neurons in red. (E) Sodium (INa) and potassium (IK) current densities. (F) INa rise time (τrise) and decay time (τdecay). Data are mean ± SEM. Statistical significance analyzed by two-tailed unpaired Student’s t-test.
Figure 3 with 2 supplements
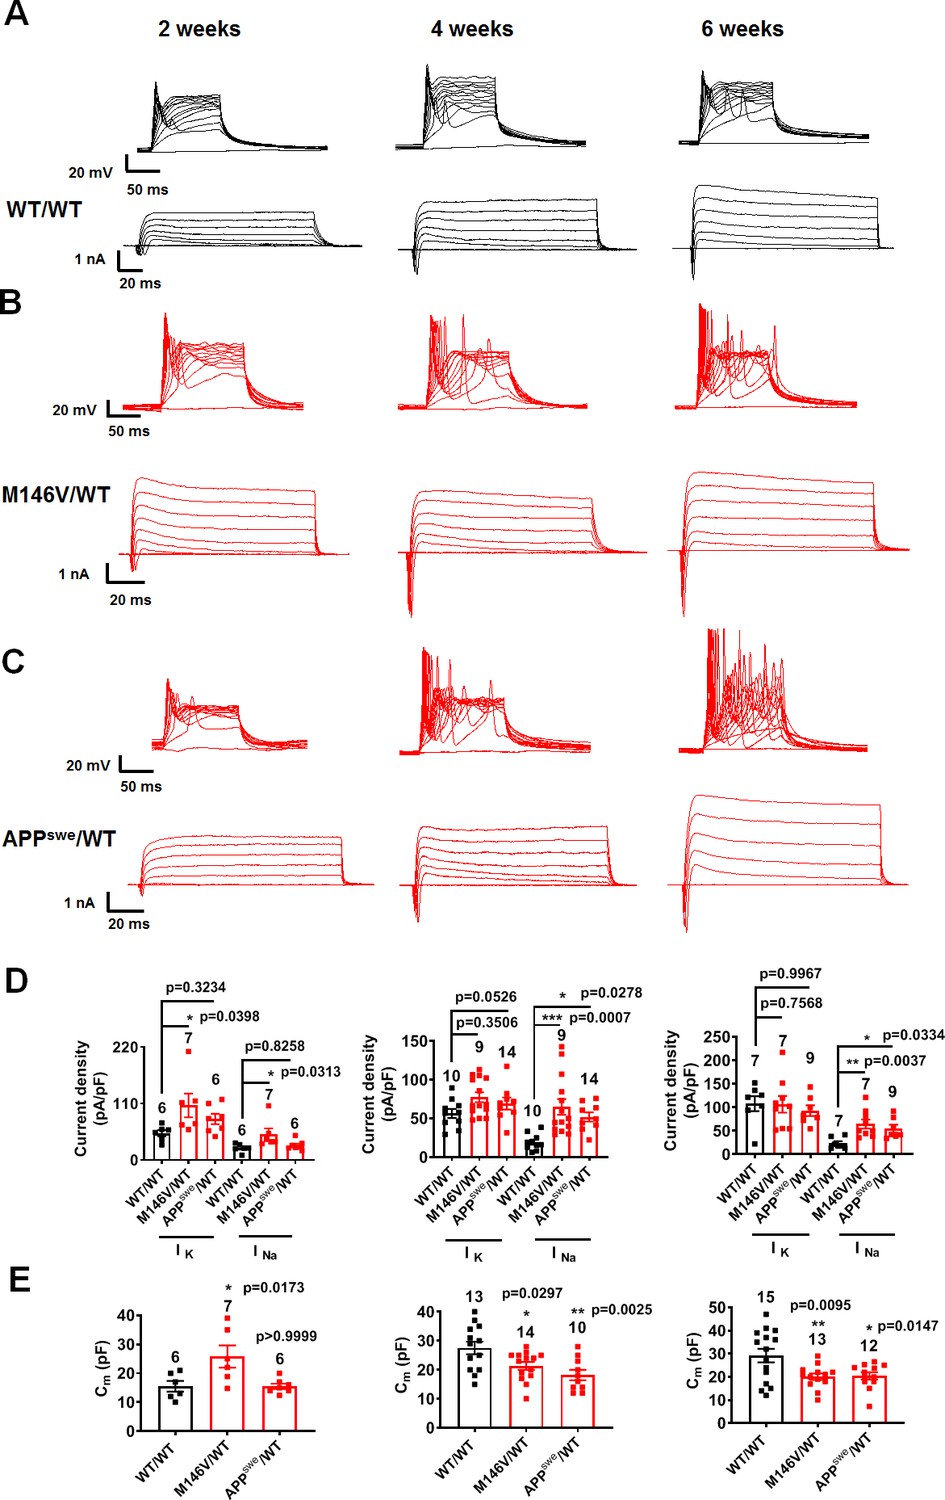
Developmental timeline of AD neurons compared to isogenic control neurons.
WT/WT hiPSC-derived cerebrocortical neuron data in black, M146V/WT and APPswe/WT AD neurons in red. (A–C) Representative evoked APs and sodium/potassium currents recorded from WT/WT (A), M146V/WT (B), and APPswe/WT (C) hiPSC-derived cerebrocortical neurons in culture for 2 weeks (Left), 4 weeks (Middle) and 6 weeks (Right). (D) Sodium (INa) and potassium (IK) current densities. (E) Quantification of cell capacitance (Cm). Note that potassium current density and cell size were significantly greater in M146V/WT compared to WT/WT at the 2 week timepoint, but at later timepoints there was no difference in potassium current density but the cell capacitance of AD neurons significantly decreased. Data are mean ± SEM. Statistical significance analyzed by ANOVA with post-hoc Dunnett’s test.
-
Figure 3—source data 1
Excel files containing data shown as summary bar graph in Figure 3D (2 weeks, 4 weeks and 6 weeks); Figure 3E (2 weeks, 4 weeks and 6 weeks).
- https://cdn.elifesciences.org/articles/50333/elife-50333-fig3-data1-v2.xlsx
Figure 3—figure supplement 1
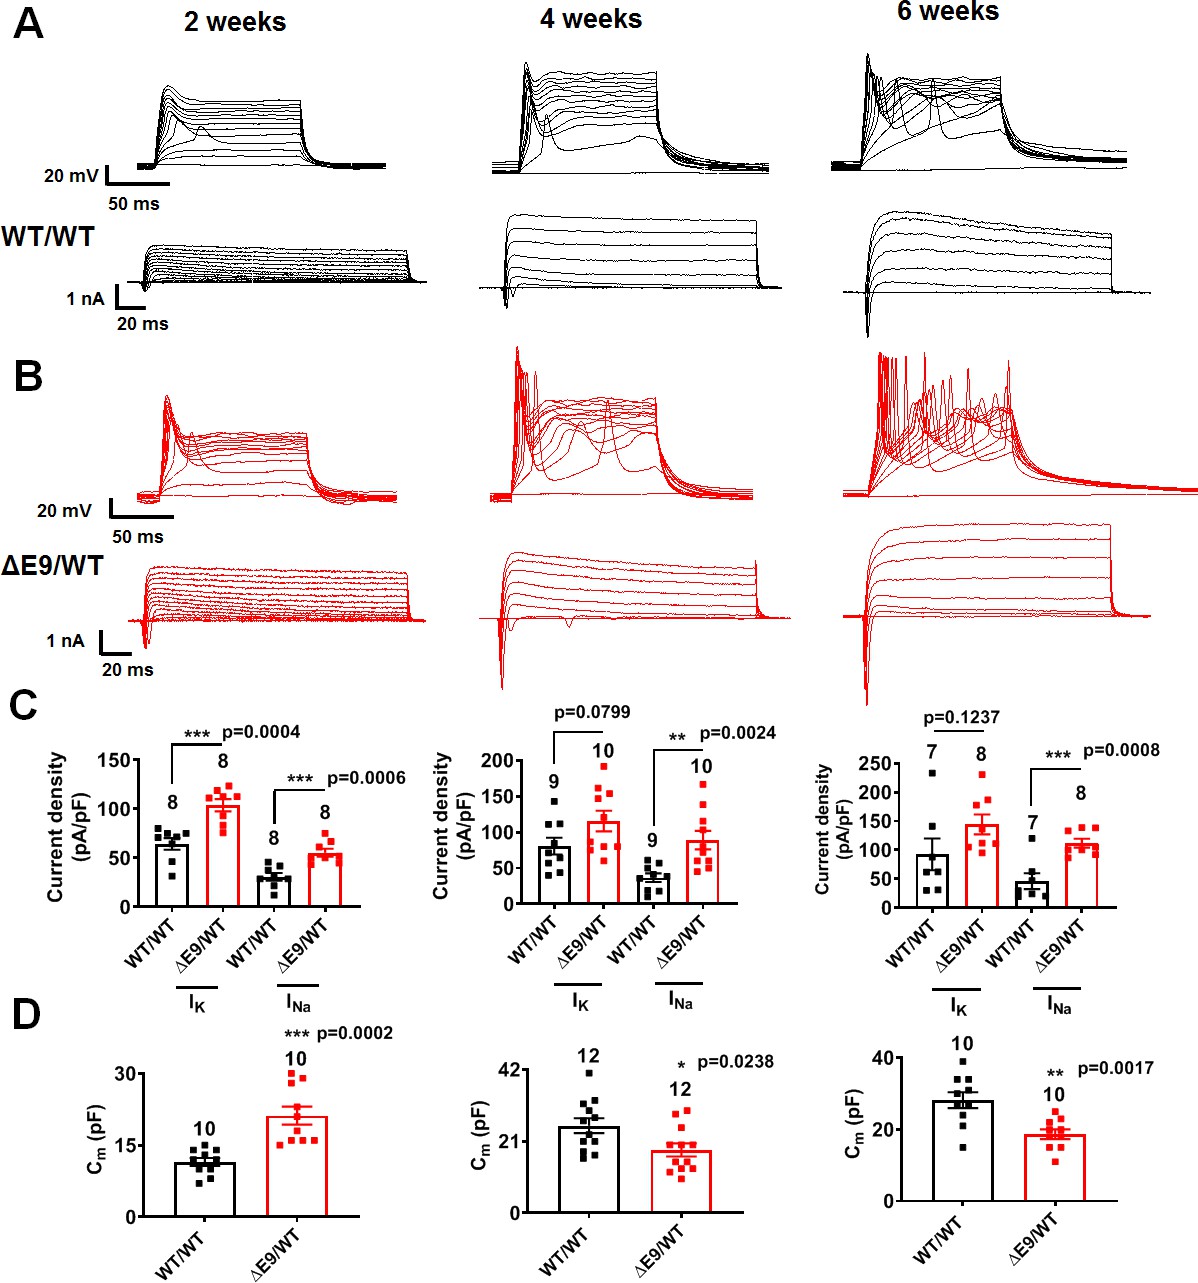
Developmental timeline of ΔE9/WT neurons compared to isogenic control neurons.
(A,B) Representative evoked APs and sodium/potassium currents recorded from WT/WT (A) and ΔE9/WT (B) hiPSC-derived cerebrocortical neurons in culture for 2 weeks (left), 4 weeks (middle) and 6 weeks (right). (C) Sodium (INa) and potassium (IK) current densities. (D) Quantification of cell capacitance (Cm). Data are mean ± SEM. Statistical significance analyzed by two-tailed unpaired Student’s t-test.
Figure 3—figure supplement 2
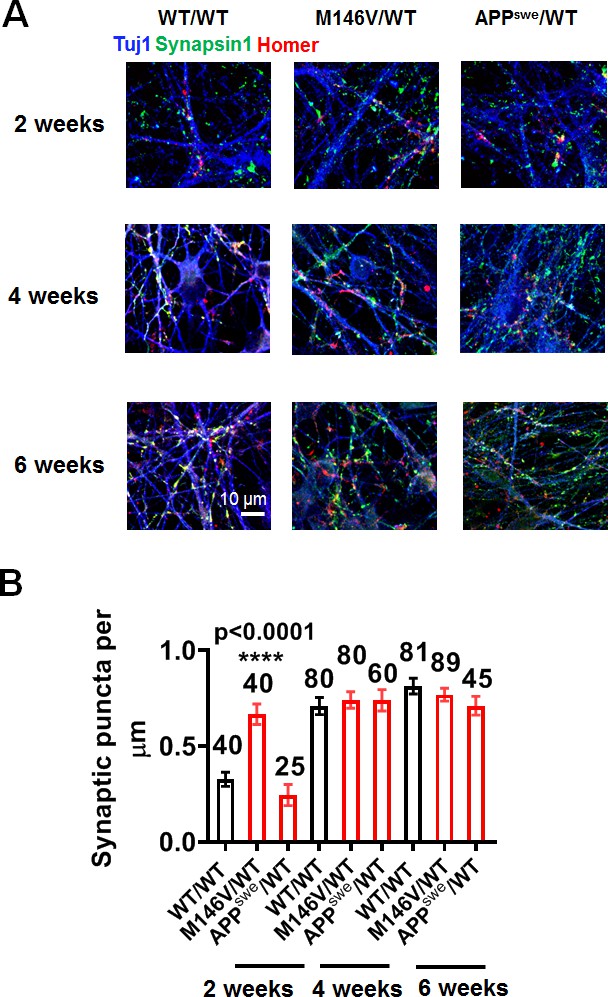
Synaptic development in hiPSC-derived AD neurons vs WT neurons.
(A) Representative images showing presynaptic (synapsin; green) and postsynaptic (homer; red) staining in WT/WT, M146V/WT, and APPswe/WT cultures at 2 weeks, 4 weeks and 6 weeks. (B) Quantification of number of synapses, represented by colocalization of synapsin and homer puncta per µm of neurite length. Data are mean ± SEM. Statistical significance analyzed by ANOVA with post hoc Dunnett’s test. Total number of neurites analyzed for each condition listed above each bar for 4–5 experiments.
Figure 4 with 2 supplements
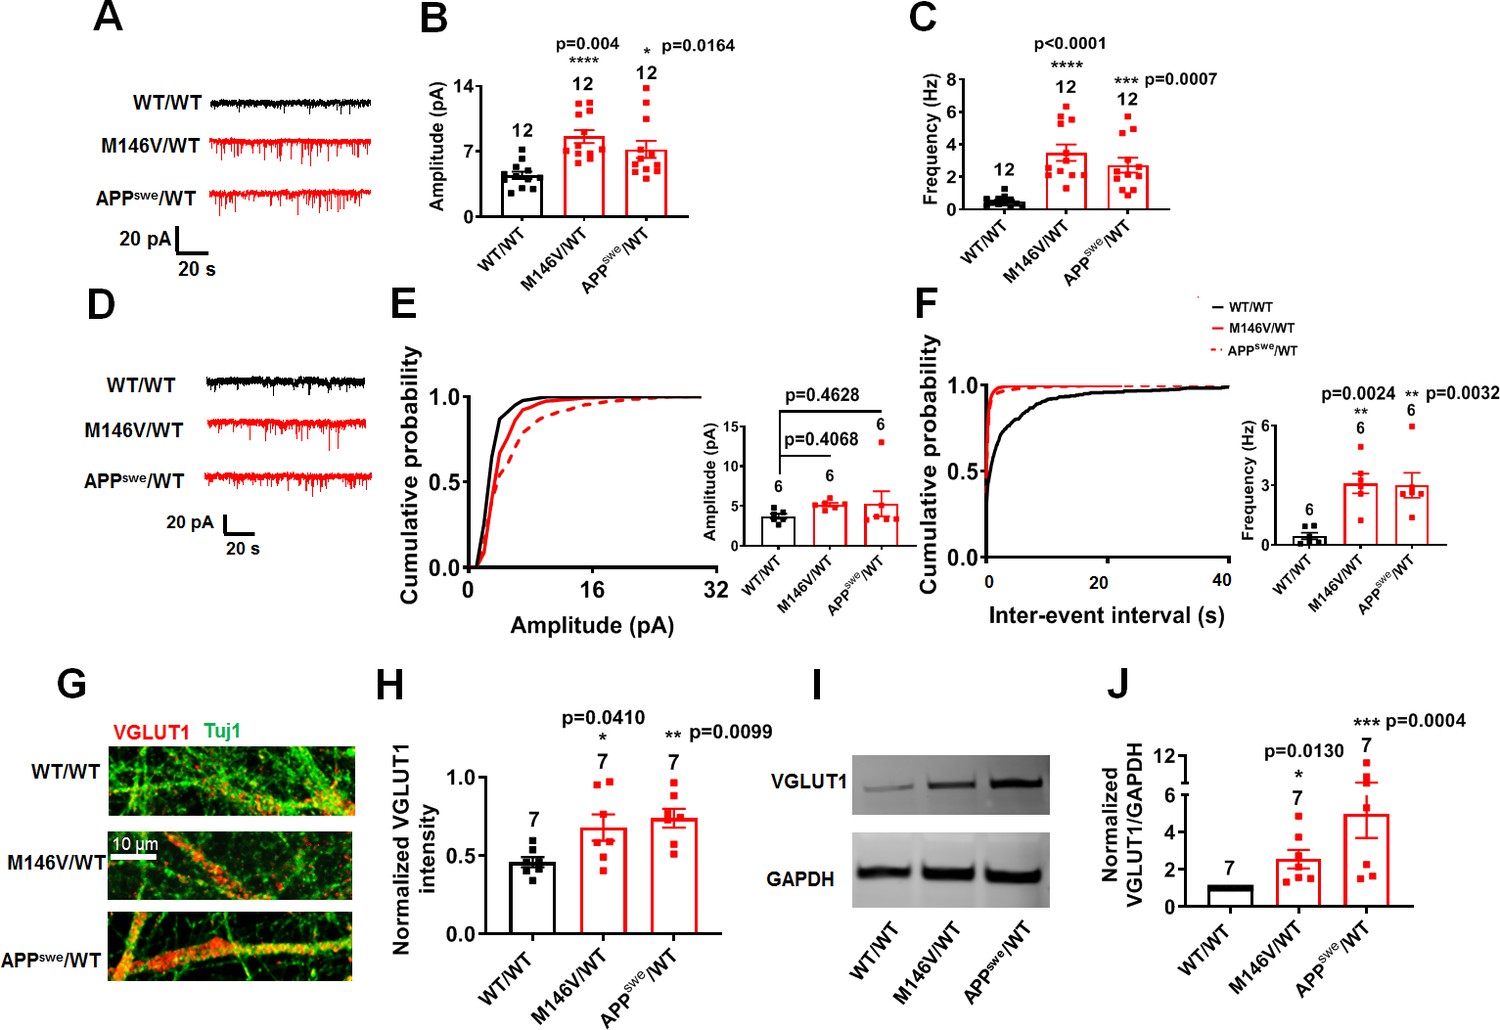
AD neurons show disrupted excitatory synaptic transmission compared to isogenic control neurons.
(A) Representative spontaneous excitatory postsynaptic currents (sEPSC) recorded at −70 mV from WT/WT, M146V/WT and APPswe/WT hiPSC-derived cerebrocortical neurons in culture for 5 weeks. (B,C) Quantification of sEPSC parameters. Quantification of mean amplitude (B) and quantification of mean frequency (C). (D) Representative miniature excitatory postsynaptic currents (mEPSCs) recorded at −70 mV from WT/WT, M146V/WT and APPswe/WT hiPSC-derived cerebrocortical neurons at 5 weeks in culture. (E,F) Cumulative probability of mEPSC amplitude (inset: quantification of mean amplitude, E) and mEPSC inter-event interval (inset: quantification of mean frequency, -F). (G) Representative images of VGLUT1 immunostaining. (H) Quantification of VGLUT1 intensity normalized to Tuj1 intensity. Total number of random fields of neuronal cultures analyzed in three separate experiments is listed above the bars. (I) Representative western blot images showing VGLUT1 protein levels. (J) Ratio of VGLUT1/GAPDH normalized to the value of WT VGLUT1/GAPDH. Data are mean ± SEM. Statistical significance analyzed by ANOVA with post-hoc Dunnett’s test, or, for immunoblot analysis, by a Kruskal Wallis test followed by Dunn’s multiple comparisons (Deyts et al., 2016). Number of independent experiments listed above bars.
-
Figure 4—source data 1
Excel files containing data shown as summary bar graph in Figure 4B,C.
- https://cdn.elifesciences.org/articles/50333/elife-50333-fig4-data1-v2.xlsx
Figure 4—figure supplement 1
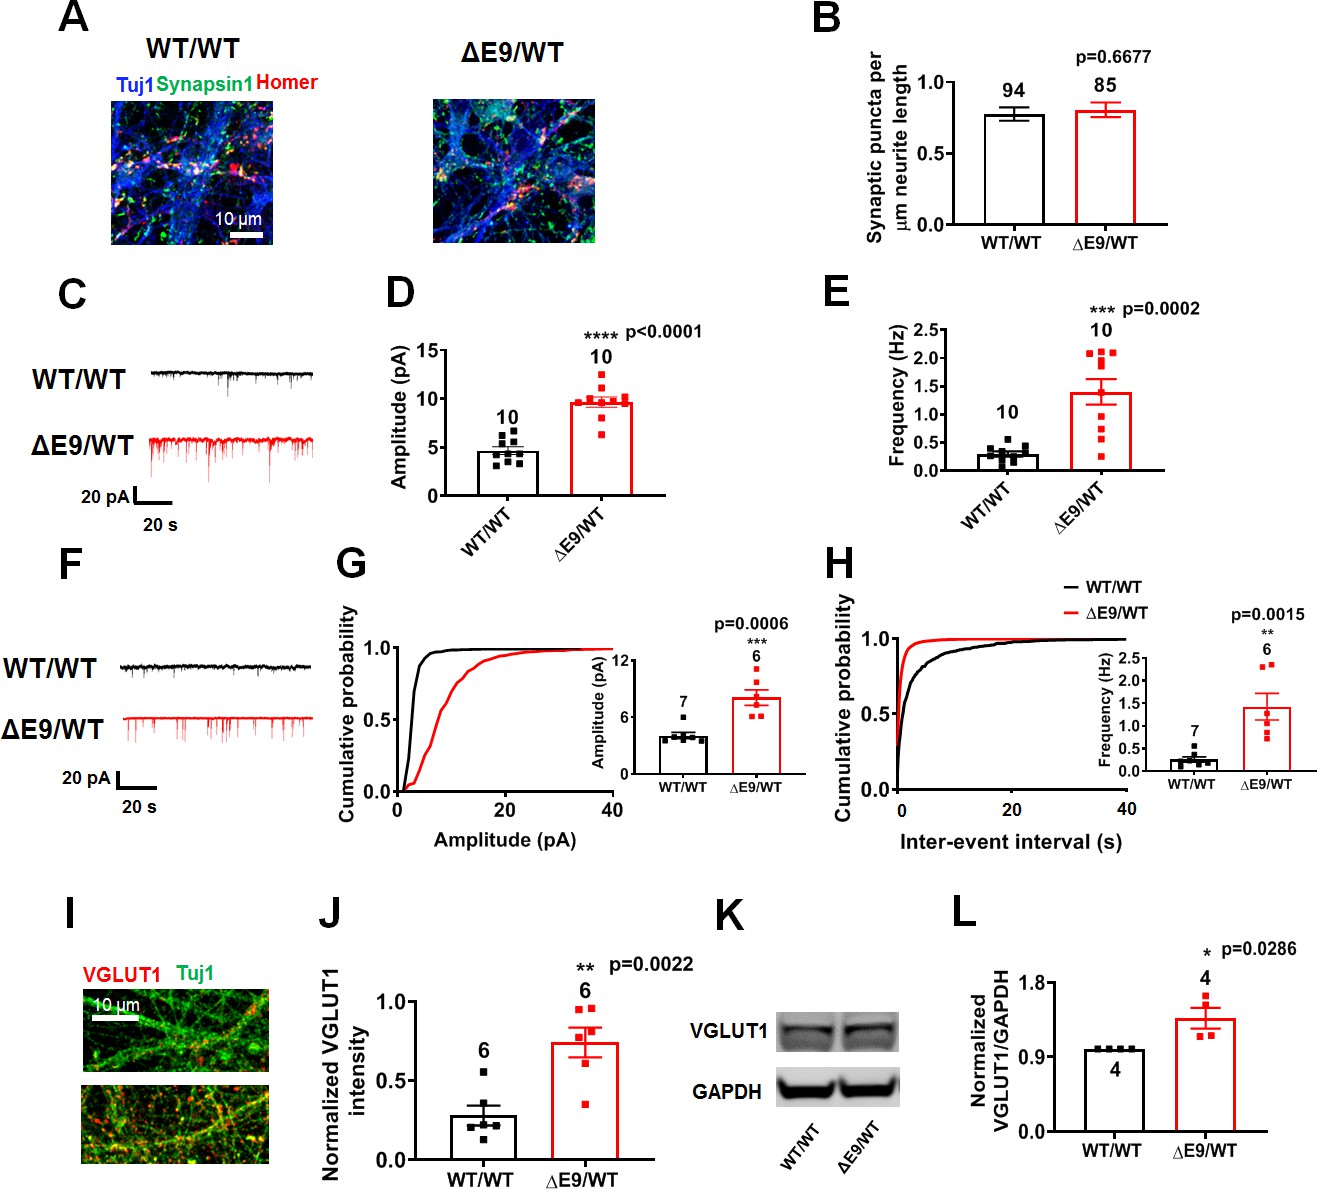
ΔE9/WT neurons show increased excitatory synaptic activity compared to isogenic control neurons.
WT/WT hiPSC-derived cerebrocortical neuron data in black, ΔE9/WT in red. (A) Representative images showing presynaptic (synapsin; green) and postsynaptic (homer; red) staining in WT/WT and ΔE9/WT cultures. (B) Quantification of number of synapses, represented by colocalization of synapsin (green) and homer (red) puncta per µm of neurite length. Total number of neurites analyzed in 4–5 experiments for each condition listed above bars. (C) Representative spontaneous excitatory postsynaptic current (sEPSC) recorded at −70 mV from WT/WT and ΔE9/WT hiPSC-derived cerebrocortical neurons in culture for 5 weeks. (D,E) Quantification of sEPSC parameters. Quantification of mean amplitude (D) and quantification of mean frequency (E). (F) Representative miniature excitatory postsynaptic currents (mEPSCs) recorded from WT/WT and ΔE9/WT hiPSC-derived cerebrocortical neurons at 5 weeks in culture. (G,H) Cumulative probability of mEPSC amplitude (inset: quantification of mean amplitude) and mEPSC inter-event interval (inset: quantification of mean frequency). (I) Representative images of VGLUT1 immunostaining. (J) Quantification of VGLUT1 intensity normalized to Tuj1 intensity. Total number of random fields of neuronal cultures analyzed in three separate experiments is listed above the bars. (K) Representative western blot images showing expression of VGLUT1. (L) Ratio of VGLUT1/GAPDH normalized to the value of WT VGLUT1/GAPDH. Data are mean ± SEM. Statistical significance analyzed by Student’s t test or, for immunoblot analysis, Mann Whitney U test. Number of independent experiments listed above bars in D, E, G, H, J and L.
Figure 4—figure supplement 2

Depletion of readily releasable pool in AD and WT neurons.
(A) Representative EPSC recorded at −70 mV upon application of 500 mM sucrose containing hypertonic solution in WT/WT, M146V/WT, and APPswe/WT hiPSC-derived AD cerebrocortical neurons in culture for 5 weeks. (B) Quantification of the readily releasable pool size (nC). Data are mean ± SEM. Statistical significance analyzed by ANOVA with post hoc Dunnett’s test.
Figure 5 with 2 supplements
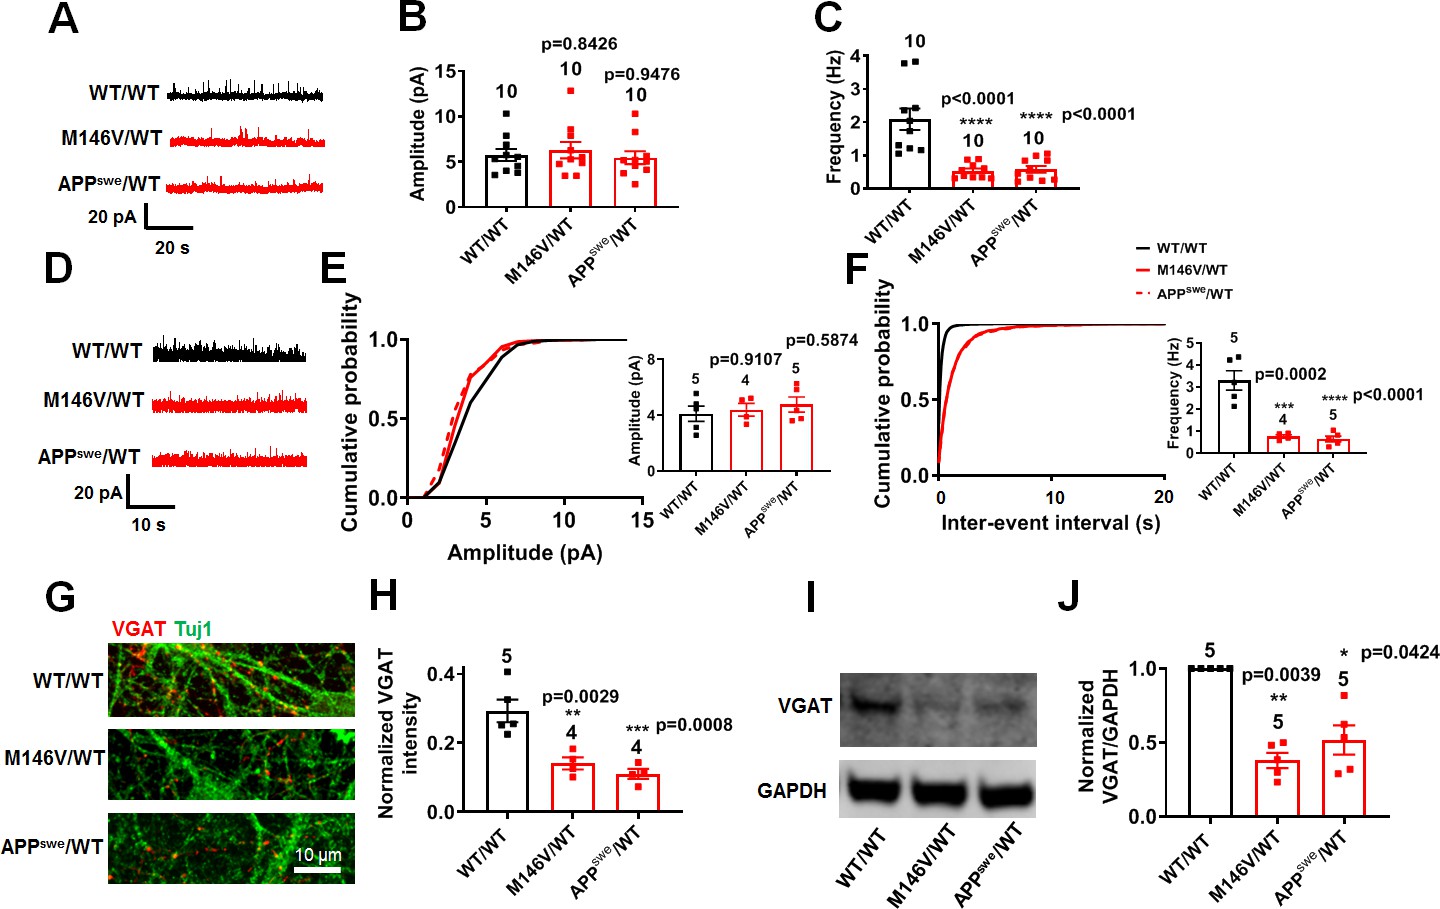
AD neurons show diminished inhibitory synaptic transmission compared to isogenic control neurons.
WT/WT hiPSC-derived cerebrocortical neuron data in black, M146V/WT and APPswe/WT in red. (A) Representative spontaneous inhibitory postsynaptic currents (sIPSCs) recorded at 0 mV from WT/WT, M146V/WT, and APPswe/WT hiPSC-derived cerebrocortical neurons in culture for 5 weeks. (B,C) Quantification of sIPSC amplitude and frequency. (D) Representative miniature inhibitory postsynaptic currents (mIPSCs) recorded at 0 mV from WT/WT, APPswe/WT, and M146V/WT hiPSC-derived cerebrocortical neurons at 5 weeks in culture. (E,F) Cumulative probability of mIPSC amplitude (inset: quantification of mean amplitude) and mIPSC inter-event interval (inset: quantification of mean frequency). (G) Representative images of VGAT immunostaining. (H) Quantification of VGAT intensity normalized to Tuj1 intensity. Total number of random fields of neuronal cultures analyzed in three separate experiments is listed above the bars. (I) Representative western blot images showing expression of VGAT. (J) Ratio of VGAT/GAPDH normalized to the value of WT VGAT/GAPDH. Data are mean ± SEM. Statistical significance analyzed by ANOVA with post-hoc Dunnett’s test, or by Kruskal Wallis test followed by Dunn’s test for western blot quantification). Number of independent experiments listed above bars.
Figure 5—figure supplement 1
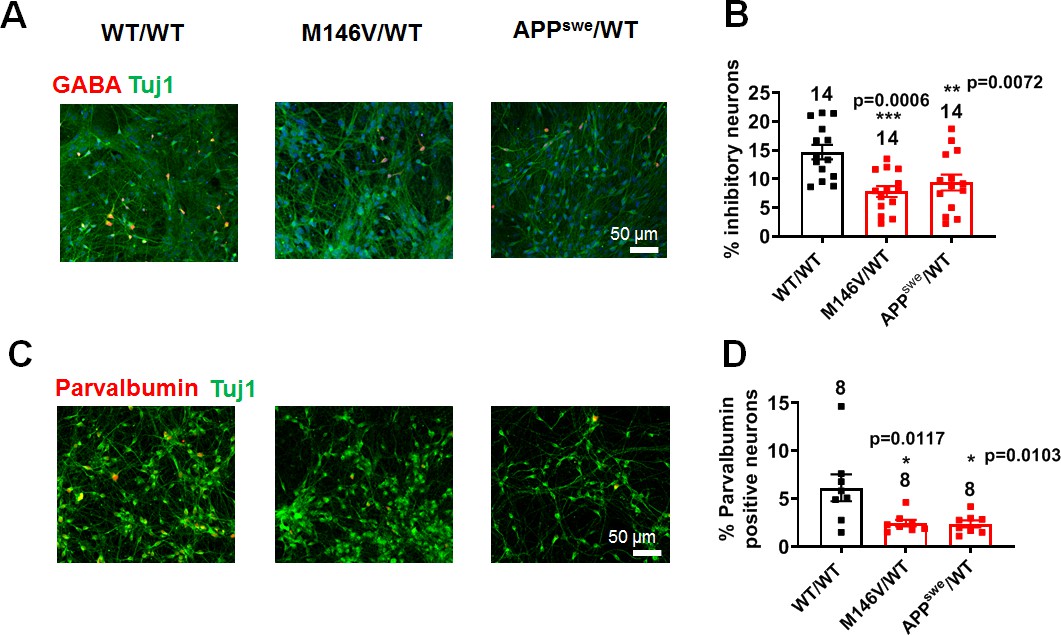
APPswe/WT and M146V/WT AD cultures contain decreased number of inhibitory neurons compared to WT/WT cultures.
(A) Representative images of GABA immunostaining in WT/WT, M146V/WT, and APPswe/WT neurons cultured for 5 weeks. (B) Quantification of percentage of GABA-positive inhibitory neurons. (C) Representative images of PV immunostaining in WT/WT, M146V/WT, and APPswe/WT neurons. (D) Quantification of percentage of PV-positive neurons. Data are mean ± SEM. Statistical significance analyzed by ANOVA with post hoc Dunnett’s test. Total number of random fields of neuronal cultures analyzed in 3–4 separate experiments is listed above the bars.
Figure 5—figure supplement 2
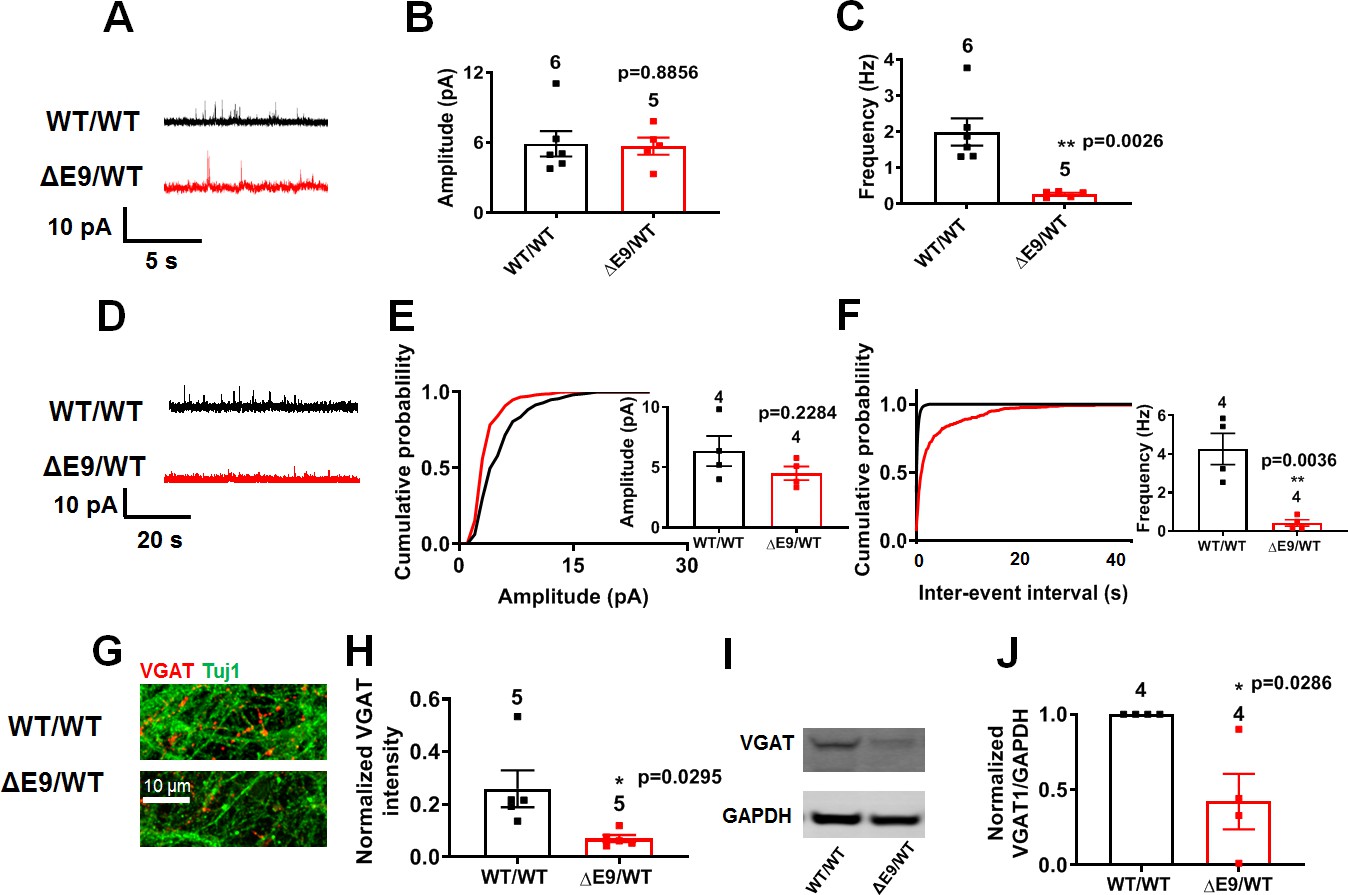
ΔE9/WT neurons show decreased inhibitory synaptic activity compared to isogenic control neurons.
(A) Representative spontaneous inhibitory postsynaptic currents (sIPSCs) recorded at 0 mV from WT/WT and ΔE9/WT hiPSC-derived cerebrocortical neurons in culture for 5 weeks. (B,C) Quantification of sIPSC parameters. Quantification of mean amplitude and quantification of mean frequency. (D) Representative miniature inhibitory postsynaptic currents (mIPSCs) recorded from WT/WT and ΔE9/WT hiPSC-derived cerebrocortical neurons at 5 weeks in culture. (E,F) Cumulative probability of mIPSC amplitude (inset: quantification of mean amplitude) and mIPSC inter-event interval (inset: quantification of mean frequency. (G) Representative images of VGAT immunostaining. (H) Quantification of VGAT intensity normalized to Tuj1 intensity. Total number of random fields of neuronal cultures analyzed in three separate experiments is listed above the bars. (I) Representative western blot images showing expression of VGAT. (J) Ratio of VGAT/GAPDH normalized to the value of WT VGAT/GAPDH. Data are mean ± SEM. Statistical significance analyzed by Student’s t test or, for immunoblot analysis, Mann Whitney U test. Number of independent experiments listed above bars.
Figure 6

γ-Secretase inhibitor or BACE1 inhibitor prevent the hyperexcitability of AD neurons.
(A) Spontaneous action potentials (sAP) at resting membrane potential (RMP) in the presence of γ-secretase inhibitor (GSi) for 2 days or BACE1 inhibitor (BACEi) for 4 days. WT/WT (left, in black) hiPSC-derived cerebrocortical neuron data, M146V/WT (center, in red), and APPswe/WT (right, in red). (B) Quantification of sAP frequency. (C) Representative sodium and potassium currents recorded from neurons clamped at −70 mV. (D) Current densities. (E) Representative spontaneous excitatory postsynaptic currents (sEPSCs) recorded at −70 mV from WT/WT and ΔE9/WT hiPSC-derived cerebrocortical neurons in culture for 5 weeks. (F,G) Quantification of sEPSC parameters. Quantification of mean amplitude (F) and quantification of mean frequency (G). Data are mean ± SEM. Statistical significance analyzed by ANOVA with post hoc Dunnett’s test for multiple comparisons and by Student’s t test for comparison between two groups.
-
Figure 6—source data 1
Excel files containing data shown as summary bar graph in Figure 6B (WT/WT, M146V/WT, APPswe/WT); Figure 6D (WT/WT, M146V/WT, APPswe/WT).
- https://cdn.elifesciences.org/articles/50333/elife-50333-fig6-data1-v2.xlsx
Figure 7 with 1 supplement
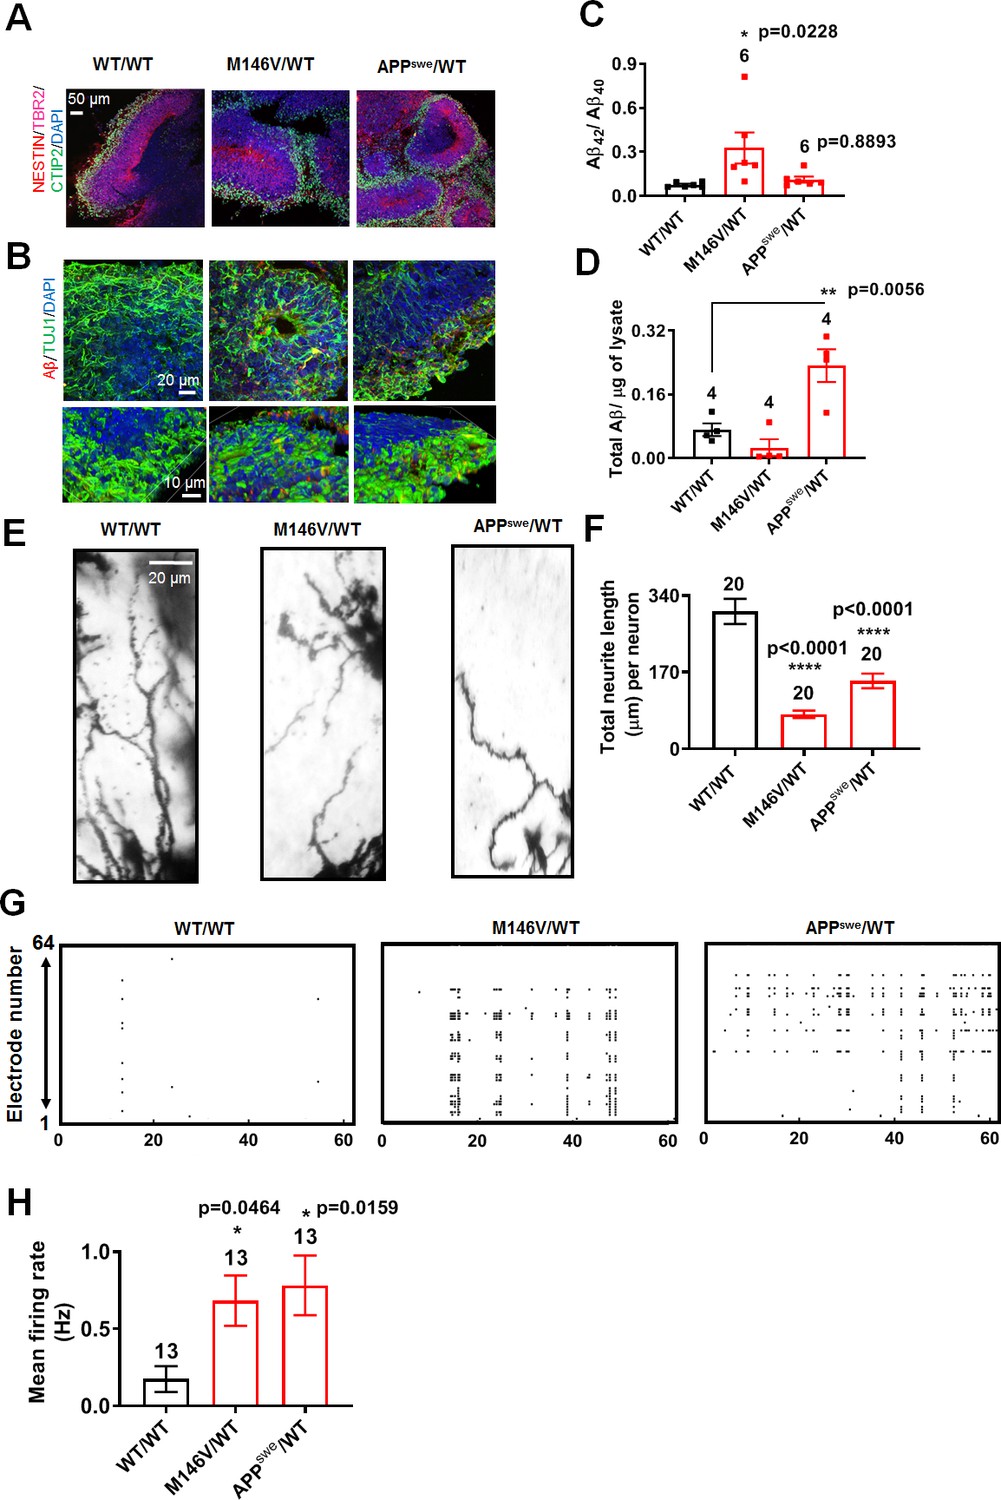
AD cerebral organoids show increased synchronous burst activity compared to WT.
(A) Representative immunostaining images of Nestin, TBR2, and CTIP2 in 2-month-old WT/WT, M146V/WT, and APPswe/WT organoids showing cortical layer formation. (B) Representative Aβ immunostaining in WT/WT, M146V/WT, and APPswe/WT cerebral organoids; lower panel shows 3D projection of Aβ immunostaining. Note increased Aβ deposition in 2-month-old AD organoids. (C) Ratio of Aβ42/Aβ40 quantified by ELISA from cultures at 2 months. (D) Quantification of Aβ levels normalized to total protein from lysates at 2 months. (E) Golgi staining of neurons in 200 µm sections of organoids. (F) Quantification of total dendrite length. Total number of neurons analyzed in 3–4 separate experiments is listed above the bars. (G) Representative raster plots of MEA recordings in WT/WT, M146V/WT, and APPswe/WT cerebral organoids at 2 months. (H) Quantification of mean firing rate. Data are mean ± SEM. Statistical significance analyzed by ANOVA with post-hoc Dunnett’s test. Number of independent experiments listed above the bars.
-
Figure 7—source data 1
Excel files containing data shown as summary bar graph in Figure 7F,H.
- https://cdn.elifesciences.org/articles/50333/elife-50333-fig7-data1-v2.xlsx
Figure 7—figure supplement 1

AD cerebral organoids show increased VGLUT1 levels and decreased VGAT levels compared to WT.
(A) Representative VGLUT1 and VGAT staining in 2-month-old WT/WT, M146V/WT, and APPswe/WT organoids. (B) Quantification of ratio of VGLUT1 to VGAT intensity normalized to Tuj1 intensity. Data are mean ± SEM. Statistical significance analyzed by Kruskal-Wallis test with post-hoc Dunn’s test. Number of independent experiments listed above bars.
Tables
Key resources table
| Reagents or resource | Designation | Source or reference | Identifiers | Additional information |
|---|---|---|---|---|
| Cell culture | Matrigel | Corning | Cat # 354230 | |
| Cell culture | mTeSR 1 | STEMCELL Technologies | Cat # 85850 | |
| Cell culture | Dorsomorphin | Tocris | Cat # 3093 | |
| Cell culture | A83-01 | Stemgent | Cat # 04–0014 | |
| Cell culture | PNU74654 | Tocris | Cat # 3534 | |
| Cell culture | DMEM/F12 | ThermoFisher | Cat # 10565018 | |
| Cell culture | N2 | ThermoFisher | Cat # 17502048 | |
| Cell culture | B27 | ThermoFisher | Cat # 17504044 | |
| Cell culture | FGF | R and D | Cat # 4114-TC | |
| Cell culture | p-ornithine | Millipore Sigma | Cat # 27378490 | |
| Cell culture | laminin | Trevigen | Cat # 340001001 | |
| Cell culture | Knockout Serum Replacement | ThermoFisher | Cat # 10828028 | |
| Cell culture | β-Mercaptoethanol | ThermoFisher | Cat # 21985023 | |
| Cell culture | BDNF | Peprotech | Cat # AF-450–02 | |
| Cell culture | GDNF | Peprotech | Cat # AF-450–10 | |
| Cell culture | ES-FBS | ThermoFisher | Cat # 16141079 | |
| Organoid culture | Cerebral Organoid Kit | STEMCELL Technologies | Cat # 08570 | |
| Critical commercial assay | V-PLEX Plus Aβ Peptide Panel 1 (6E10) Kit | Meso Scale Discovery | Cat # K15200 | |
| Electrophysiology | K-Gluconate | Millipore Sigma | Cat # P1847 | |
| Electrophysiology | Cs-Gluconate | Hello Bio | Cat # HB4822 | |
| Electrophysiology | KCl | Millipore Sigma | Cat # 60128 | |
| Electrophysiology | CsCl | Millipore Sigma | Cat # C4036 | |
| Electrophysiology | MgCl2 | Fluka | Cat # 63020 | |
| Electrophysiology | HEPES | Millipore Sigma | Cat # H4034 | |
| Electrophysiology | EGTA | Millipore Sigma | Cat # 3889 | |
| Electrophysiology | Mg-ATP | Millipore Sigma | Cat # A9187 | |
| Electrophysiology | HBSS | ThermoFisher | Cat # 14175079 | |
| Electrophysiology | CaCl2 | Millipore Sigma | Cat # C5080 | |
| Electrophysiology | Glycine | Millipore Sigma | Cat # G2879 | |
| Electrophysiology | Tetrodotoxin citrate | Hello Bio | Cat # HB 1035 | |
| Electrophysiology | β-Secretase Inhibitor IV | EMD Millipore | Cat # 565788 | |
| Electrophysiology | Compound E | EMD Millipore | Cat # 565790 | |
| Immunocytochemistry (ICC) | PFA | Alfa Aesar | Cat # 43368 | |
| ICC | BSA | Millipore Sigma | Cat # A0336 | |
| ICC | Triton X-100 | Millipore Sigma | Cat # T8532 | |
| ICC antibody | DAPI | Invitrogen | Cat # D1306; RRID:AB_2629482 | 1:500 |
| ICC antibody | Chicken polyclonal Anti-Tuj1 | Abcam | Cat # ab41489; RRID:AB_727049 | 1:200 |
| ICC antibody | Mouse monoclonal Anti-Synapsin 1 | Synaptic Systems | Cat # 106 011; RRID:AB_2619772 | 1:500 |
| ICC antibody | Rabbit polyclonal Anti-Homer 1 | Synaptic Systems | Cat # 160 003; RRID:AB_887730 | 1:200 |
| ICC antibody | Mouse monoclonal Anti-VGAT | Synaptic Systems | Cat # 131 011; RRID:AB_887868 | 1:200 |
| ICC antibody | Rabbit polyclonal Anti-VGLUT1 | EMD Millipore | Cat # ABN1647; RRID:AB_2814811 | 1:500 |
| ICC antibody | Rabbit polyclonal Anti-GABA | Sigma | Cat # A2052; RRID:AB_477652 | 1:100 |
| ICC antibody | Mouse monoclonal Anti-Parvalbumin | EMD Millipore | Cat # MAB1572; RRID:AB_2174013 | 1:100 |
| ICC antibody | Rabbit polyclonal Anti-FOXG1 | Abcam | Cat # ab18259; RRID:AB_732415 | 1:250 |
| ICC antibody | Rat monoclonal Anti-CTIP2 | Abcam | Cat # ab18465; RRID:AB_2064130 | 1:200 |
| ICC antibody | Rabbit polyclonal Anti-TBR2 | Abcam | Cat # ab23345; RRID:AB_778267 | 1:300 |
| ICC antibody | Mouse monoclonal Anti-Nestin | Abcam | Cat # ab22035; RRID:AB_446723 | 1:200 |
| ICC antibody | Anti-Amyloid β 1–16 | Biolegend | Cat # 803001; RRID:AB_2564653 | 1:2000 |
| Immunoblot antibody | Mouse monoclonal Anti-VGAT | Synaptic Systems | Cat # 131011; RRID:AB_887868 | 1:500 |
| Immunoblot antibody | Rabbit polyclonal Anti-VGLUT1 | Synaptic Systems | Cat # 135303; RRID:AB_887875 | 1:1000 |
| Software and Algorithms | Clampex v10.6 (pClamp) | Molecular Devices | RRID:SCR_011323 | |
| Software and Algorithms | Clampfit v10.6 (pClamp) | Molecular Devices | RRID:SCR_011323 | |
| Software and Algorithms | Mini Analysis | Synapstosoft | http://www.synaptosoft.com/MiniAnalysis/; RRID:SCR_002184 | |
| Software and Algorithms | ImageJ | NIH | https://imagej.nih.gov/ij/; RRID:SCR_003070 | |
| Software and Algorithms | Prism7 | GraphPad | http://www.graphpad.com; RRID:SCR_002798 |
Additional files
Download links
A two-part list of links to download the article, or parts of the article, in various formats.
Downloads (link to download the article as PDF)
Open citations (links to open the citations from this article in various online reference manager services)
Cite this article (links to download the citations from this article in formats compatible with various reference manager tools)
Mechanisms of hyperexcitability in Alzheimer’s disease hiPSC-derived neurons and cerebral organoids vs isogenic controls
eLife 8:e50333.
https://doi.org/10.7554/eLife.50333


