Organic electrochemical transistor arrays for real-time mapping of evoked neurotransmitter release in vivo
- Department of Biomedical Engineering, City University of Hong Kong, China
- Department of Applied Physics, Hong Kong Polytechnic University, China
- Department of Rehabilitation, Shenzhen Hospital of Guangzhou University of Chinese Medicine, China
- Shenzhen Research Institute, City University of Hong Kong, China
- Center of Super-Diamond and Advanced Films (COSDAF), City University of Hong Kong, China
Figures
Figure 1
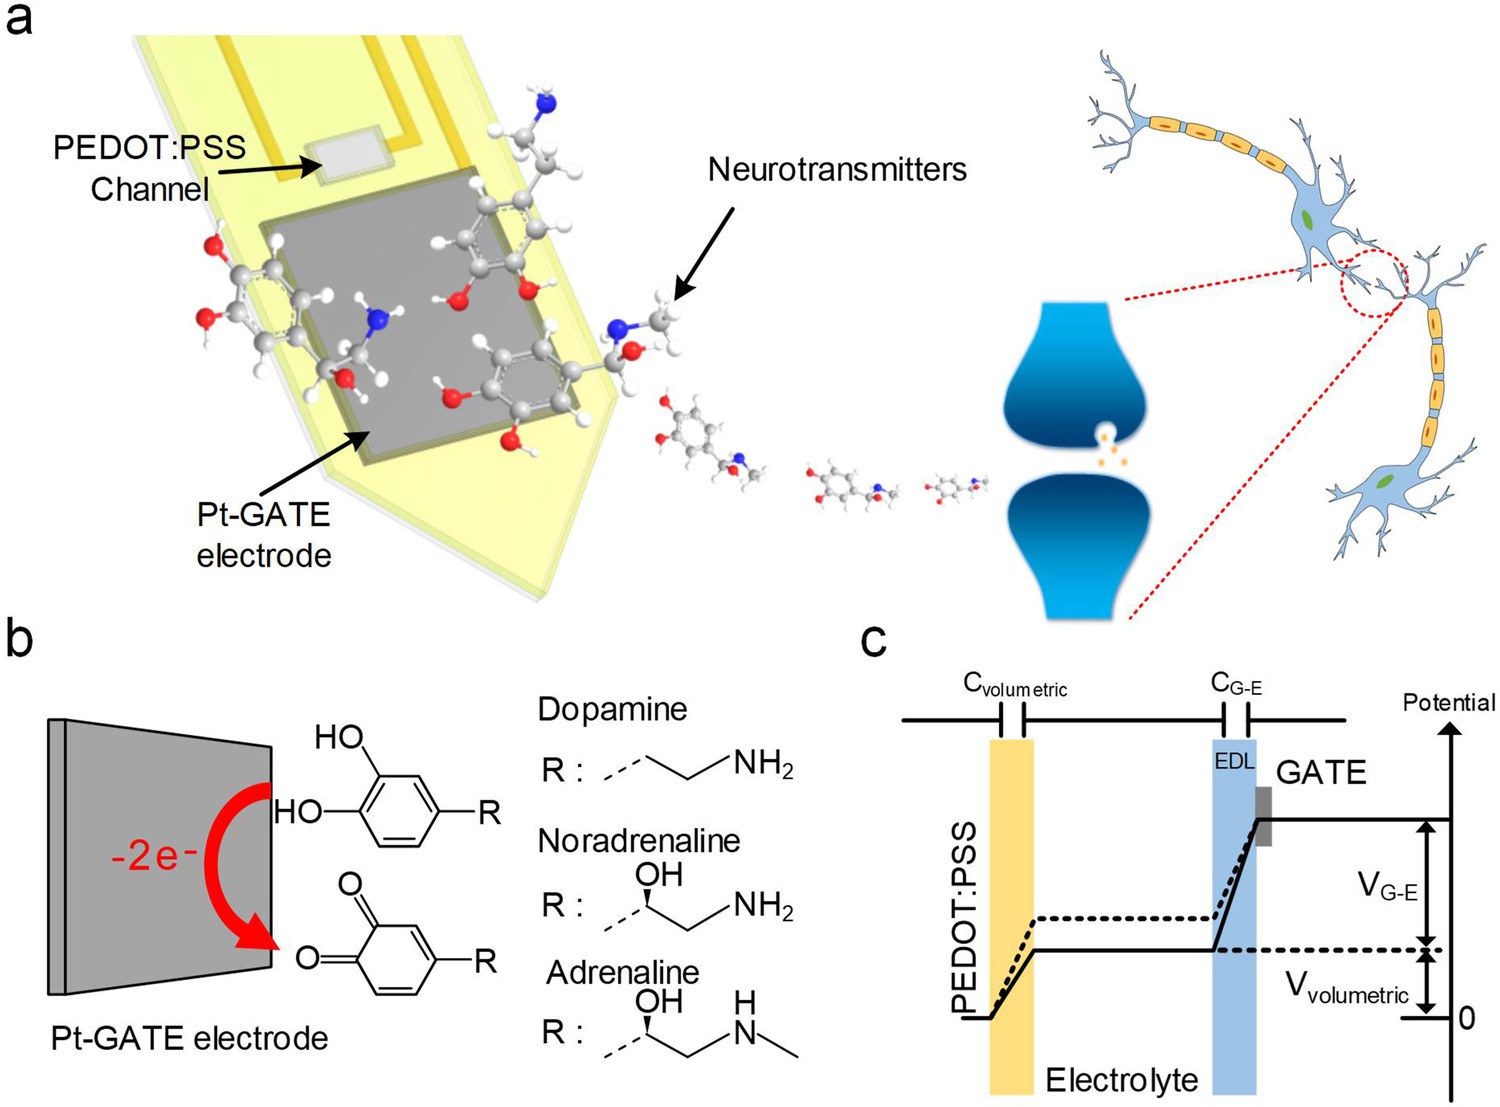
System schematic diagram and OECT-array working principle for CA-NT detection.
(a) Systematic diagram of using the OECT for monitoring neurotransmitter release. (b) Illustration of CA-NT’s electro-oxidation reaction on the surface of the Pt-GATE electrode. (c) Diagram showing the working principle of an OECT device. Cvolumetric and CG-E denotes the volumetric capacitance across the PEDOT:PSS active layer and the capacitance between the GATE electrode and the electrolyte respectively. Vvolumetric and VG-E denotes voltage across the active PEDOT:PSS layer and between the GATE electrode and the electrolyte respectively.
Figure 2 with 2 supplements
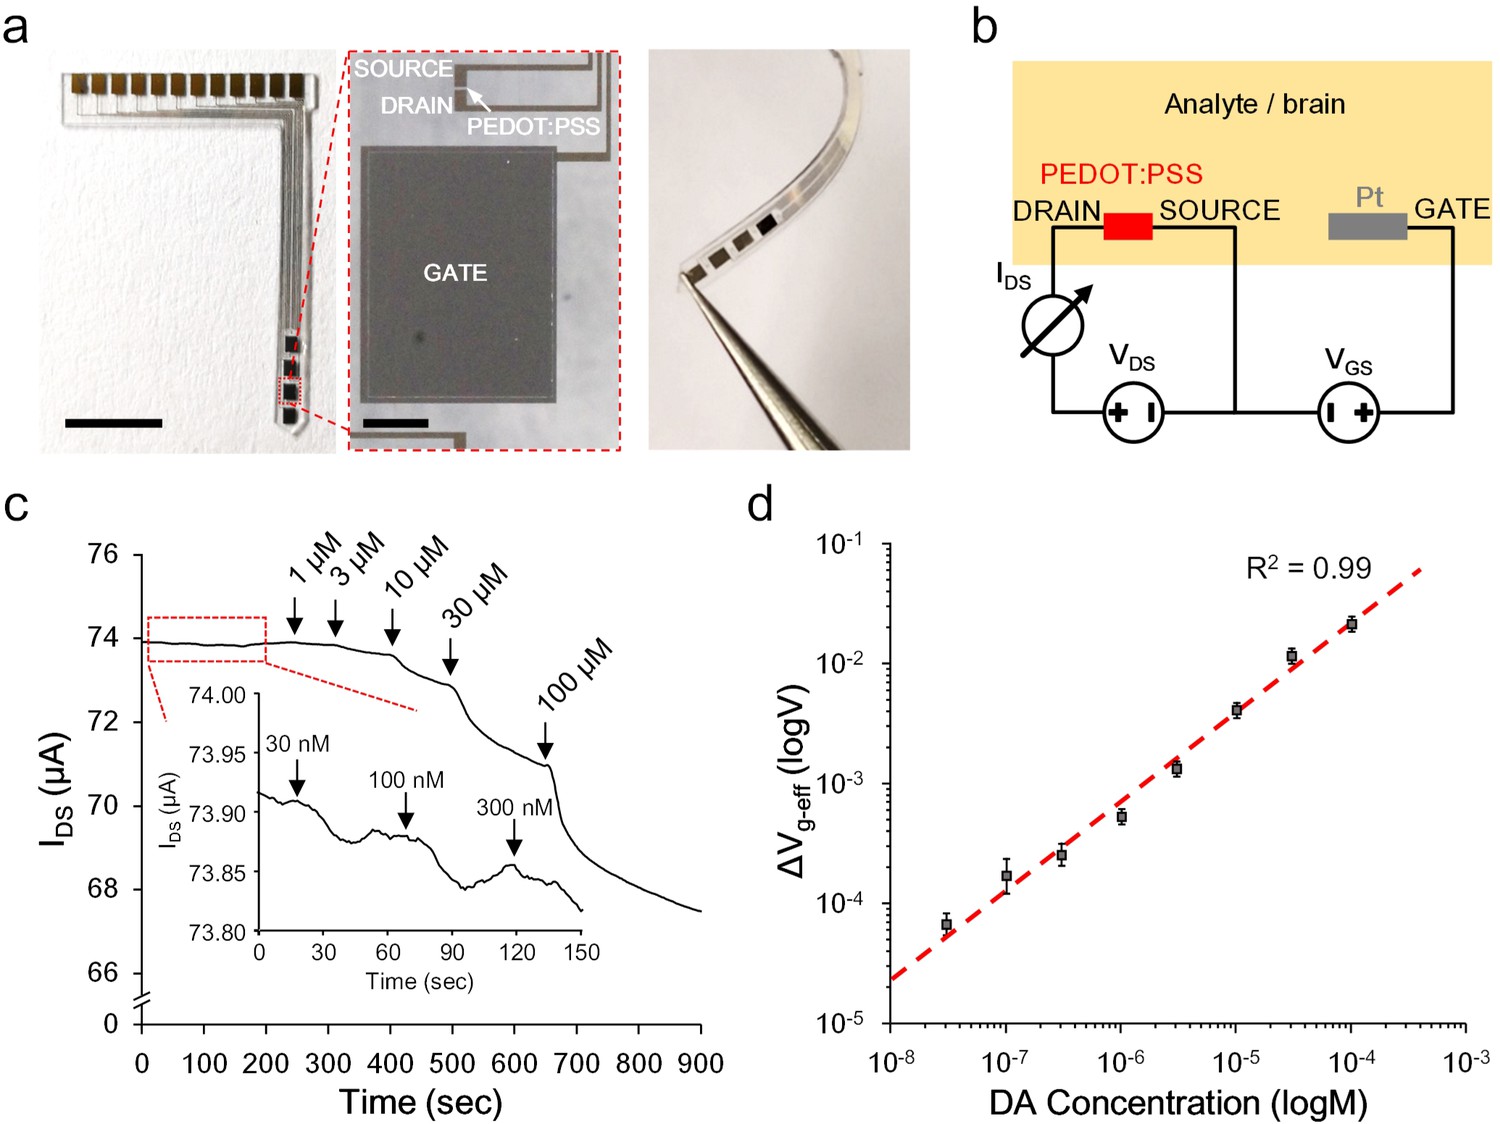
Ex vivo characterization of the OECT-array.
(a) Photographs showing the overall (left), enlarged (middle) and bent view of the flexible OECT-array. Scale bar indicates 5 mm in left panel and 200 μm in the middle panel. (b) Wiring diagram showing the working setup of an OECT-array. (c) Ex vivo recording of IDS changes in response to artificially added dopamine to ACSF containing a high level of ascorbate acid (1.28 mM; VDS = 0.06 V; VGS = 0.6 V). (d) The calibration curve showing the relationship between the measured ΔVg-eff and changes of dopamine concentrations, n = 3, error bars indicate standard error. The dash line shows linear fitting of the data.
-
Figure 2—source data 1
Data for ex vivo device characterization.
- https://cdn.elifesciences.org/articles/50345/elife-50345-fig2-data1-v2.xlsx
Figure 2—figure supplement 1

The dimension of the OECT-array.
Hchannel = 10 μm, denoting the height of the exposed PEDOT:PSS channel (distance between the SOURCE and DRAIN electrode connected with the channel). Wchannel = 40 μm, denoting the width of the exposed PEDOT:PSS channel (width of the SOURCE and DRAIN electrode connected with the channel). Hgate = 800 μm, denoting the height of the GATE electrode exposed in the patterned SU-8 insulation layer. Wgate = 600 μm, denoting the width of the GATE electrode exposed in the patterned insulation layer. Dunit = 1,200 μm, denoting the distance between the adjacent OECT-units.
Figure 2—figure supplement 2

Ex vivo characterization of the OECT-array.
(a) Representative IDS curve (black) and corresponding transconductance (red) curve recorded from an OECT-device in PBS. (b–f) Response of an OECT-device to concentration change of different neurotransmitters, including dopamine (b), adrenaline (c), noradrenaline (d), γ-aminobutyric acid (GABA; e) and glutamate (f) as characterized in PBS. n = 3, error bars indicate standard error.
Figure 3 with 1 supplement
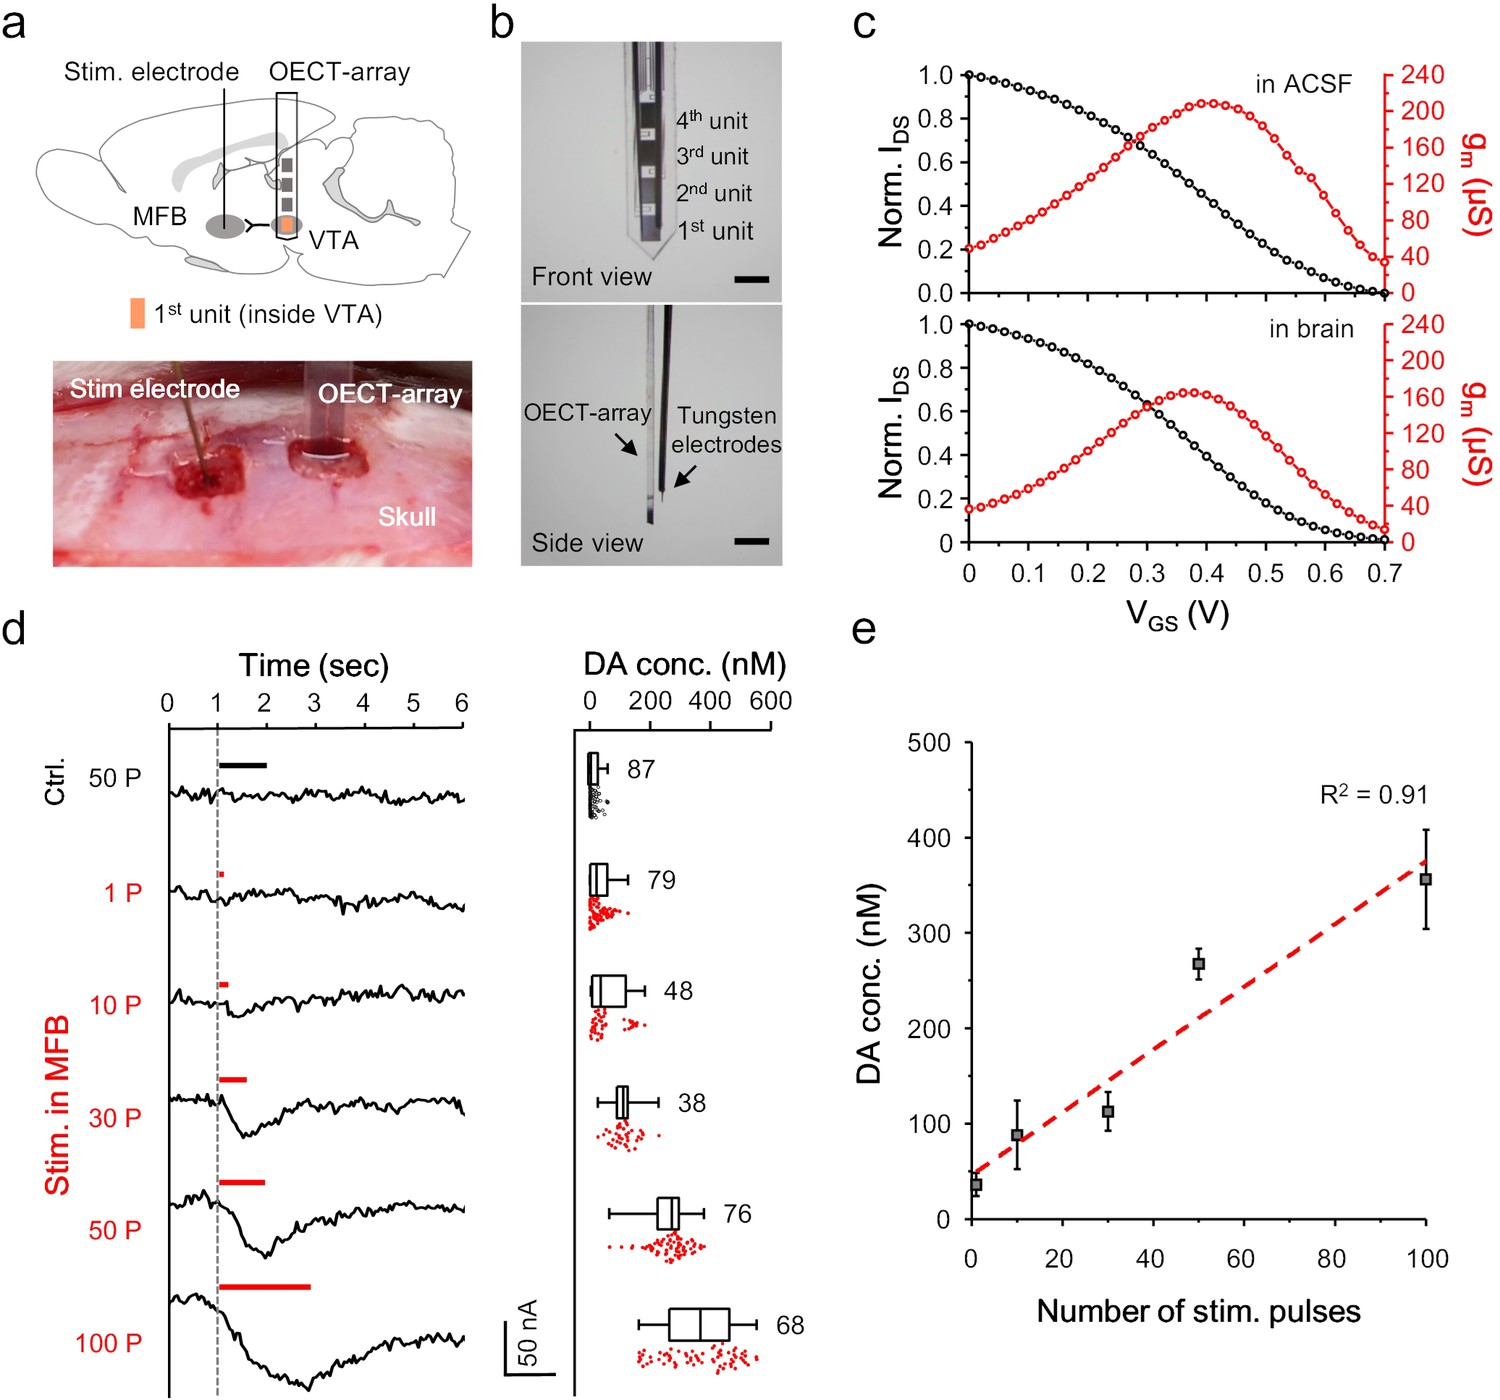
OECT-array for monitoring in VTA.
(a) Schematic diagram (upper) and surgical photogram (lower) of the experimental setup. The 1st unit (orange) of an OECT-array was implanted to VTA to monitor somatodendritic dopamine release evoked by electrical stimulation in MFB. (b) Front (upper) and side (lower) view of the device bundle containing an OECT-array and a recording tungsten electrode. Scale bar, 1 mm. (c) Representative transfer (black) and transconductance (red) curve of an OECT device placed ex vivo in the ACSF (upper; VDS = 0.06V; VGS = 0.6V) or in vivo in a rat brain (lower; VDS = 0.06V; VGS = 0.6V). (d) The IDS recording (left) from an OECT-unit in the VTA in response to neural stimulation in MFB using different number of electrical pulses. The corresponding measurements of dopamine release from multiple trials were shown in the right boxplot. The whisker range is 1 ~ 99%, and each box show 25, 50% and 75% percentile of the data collected from three animals. For the control experiments, the stimulation was made off the MFB. (e) The correlation between the intensity of dopamine release in VTA and the number of electrical pulses in MFB, n = 3, error bars indicate standard error. The dash line shows linear fitting of the data.
-
Figure 3—source data 1
Data for OECT recording in VTA.
- https://cdn.elifesciences.org/articles/50345/elife-50345-fig3-data1-v2.xlsx
Figure 3—figure supplement 1
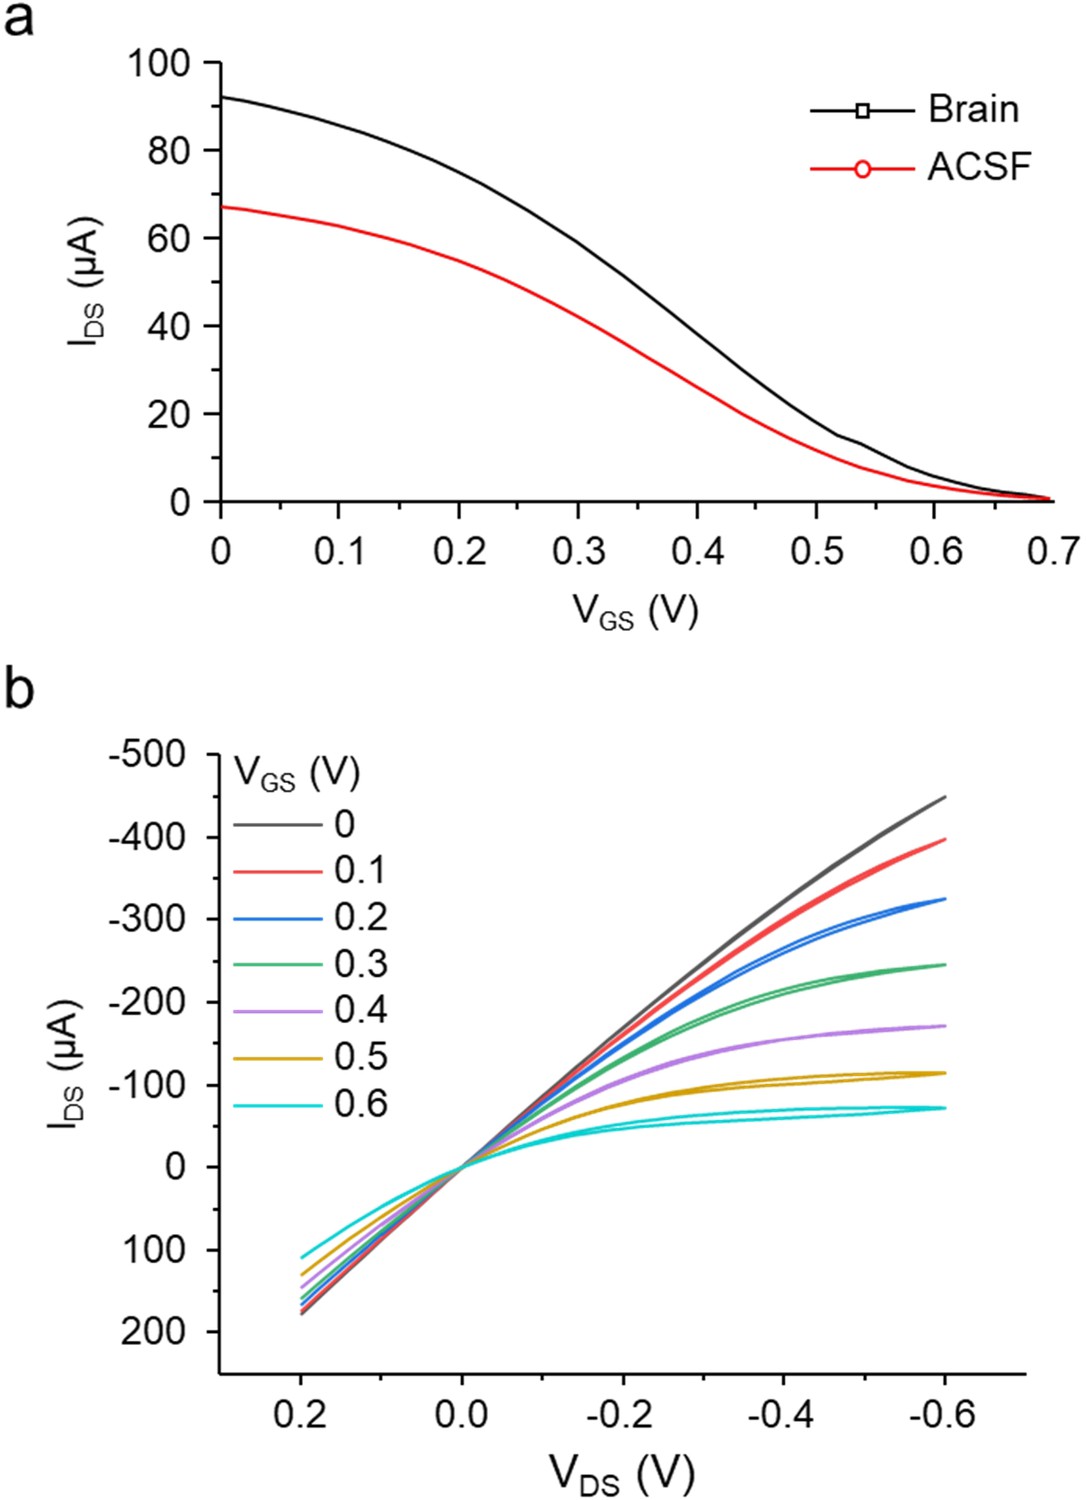
Characterization of OECT-array.
(a) Raw transfer curve (VDS = 0.06 V) in brain (black) and ACSF (red). (b) Output characterization upon different VGS (color-coded) in PBS.
Figure 4 with 2 supplements

OECT-array for mapping dopamine release along the mesolimbic pathway.
(a) Schematic diagram of using an OECT-array to map dopamine release around NAc region in response to neural stimulation of VTA. (b) Immunostaining of brain tissues in NAc (upper) or VTA (lower) after the electrochemical measurements. The NAc brain slices were stained for dopaminergic axon terminals (TH+, red) and cell nuclei (DAPI, cyan); the VTA brain slices were stained for dopaminergic neurons (TH+, red) and neural activation marker (c-Fos+, green). The implantation track of the OECT-array (in NAc) and the stimulation electrode (in VTA) were indicated by the dashed lines. Scale bar, 100 μm. (c) The IDS recorded from the OECT-unit placed in NAc in response to electrical stimulation of VTA (2 ms pulse width, 50 Hz, 50 pulses; VDS = 0.05V; VGS = 0.65V). The gray curves are the raw IDS recording from multiple VTA-stimulation trials, the solid red curve shows the average of all 34 trials, and the red shade indicates the range of standard error. (d) Quantitative measurements of dopamine release in NAc in response to VTA-stimulation, n = 3, * indicates p<0.05 by student t-test. (e) Frequency-dependent dopamine release in the NAc as evoked by VTA stimulation (2 ms pulse width, 1 s duration, 30, 50, or 100 Hz), n = 3. (f) Comparison of dopamine release simultaneously measured by the 1st (inside NAc) and the 2nd (outside NAc) OECT-unit in response to VTA-stimulation (2 ms pulse width, 50 Hz, 1 s duration), n = 8, ** indicates p<0.005 by student t-test. For panel d-f, error bars indicate standard error.
-
Figure 4—source data 1
Data for OECT mapping along the mesolimbic pathway.
- https://cdn.elifesciences.org/articles/50345/elife-50345-fig4-data1-v2.xlsx
Figure 4—figure supplement 1

Confirmation of correct OECT-unit placement in NAc.
Nissl blue staining of the coronal section of NAc region showing the surgical track of an OECT-array (left) and a tungsten electrode (right) after an experiment. Slice thickness, 50 μm. Scale bar, 1 mm.
Figure 4—figure supplement 2
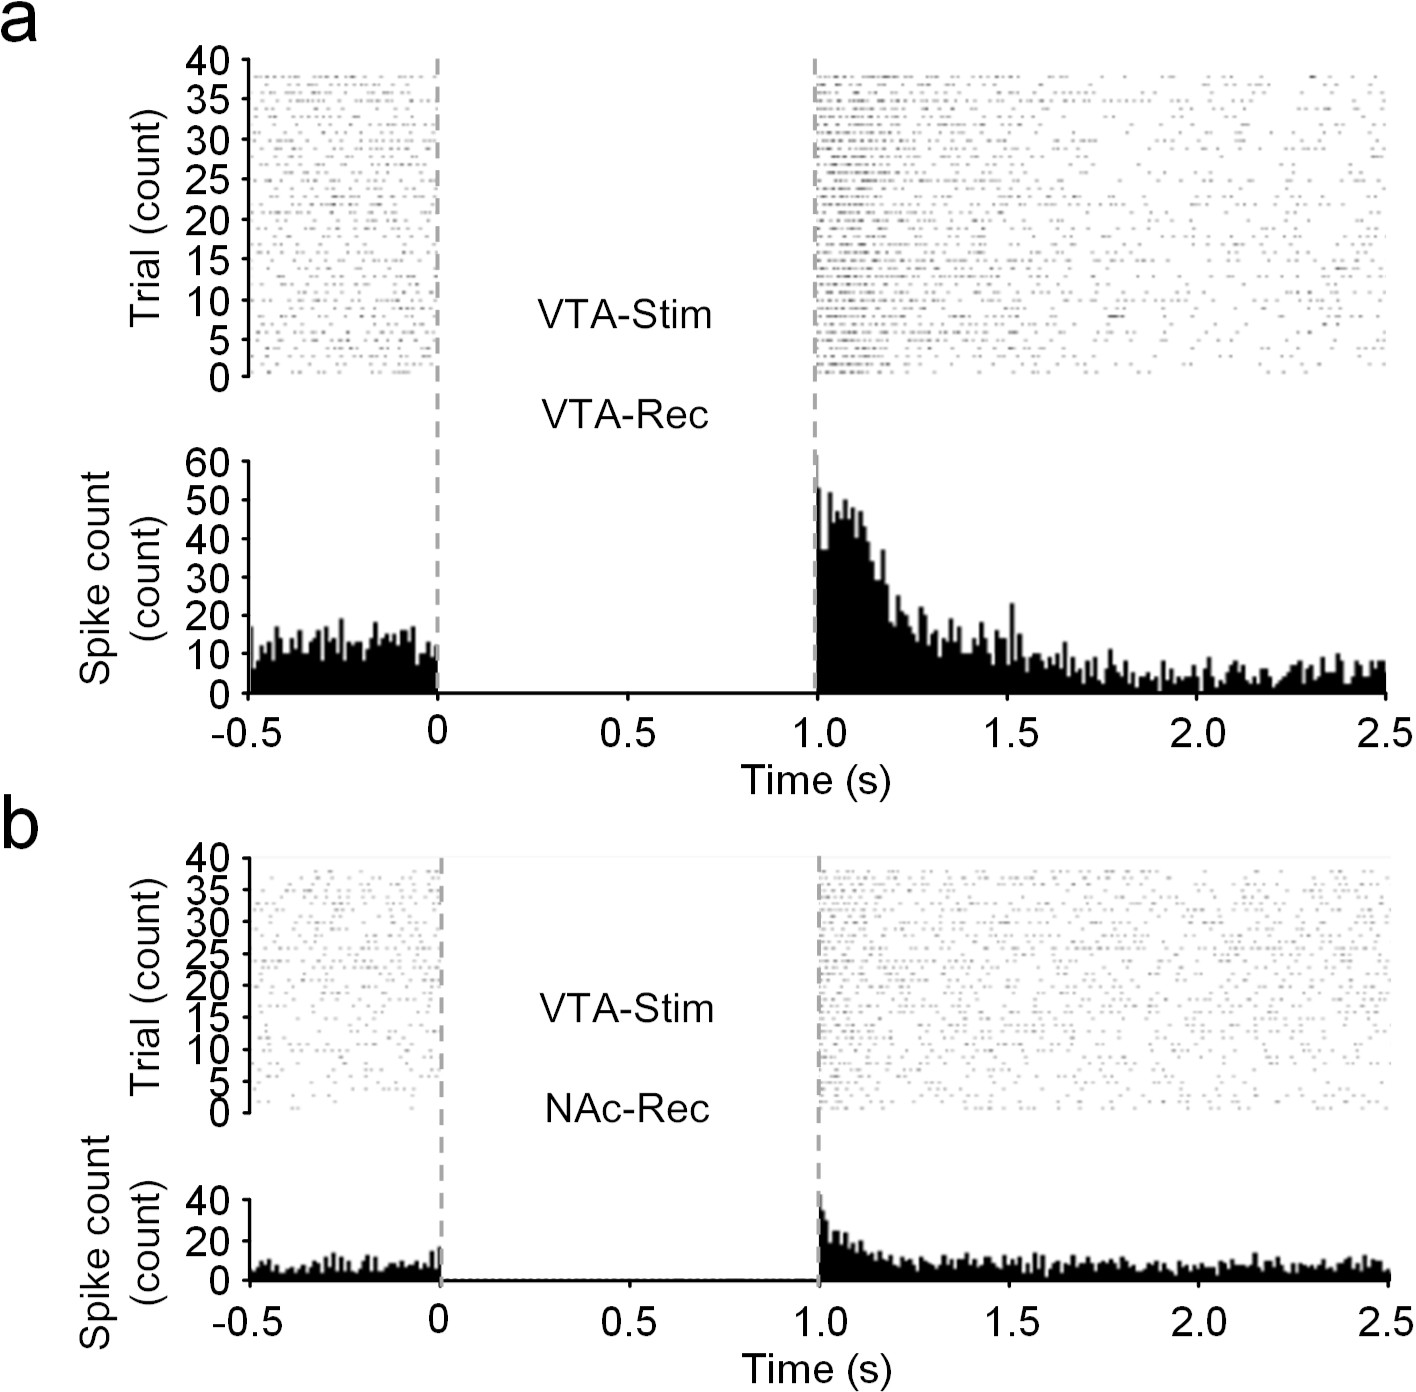
Electrophysiological characterization in the NAc in response to VTA-stimulation.
Electrophysiological recording in parallel with dopamine monitoring in NAc upon VTA-stimulation. The raster plot (upper) and post-stimulation time histogram (lower) in VTA (a) and NAc (b) upon electrical stimulation in VTA. Data from 38 trials were shown.
Figure 5
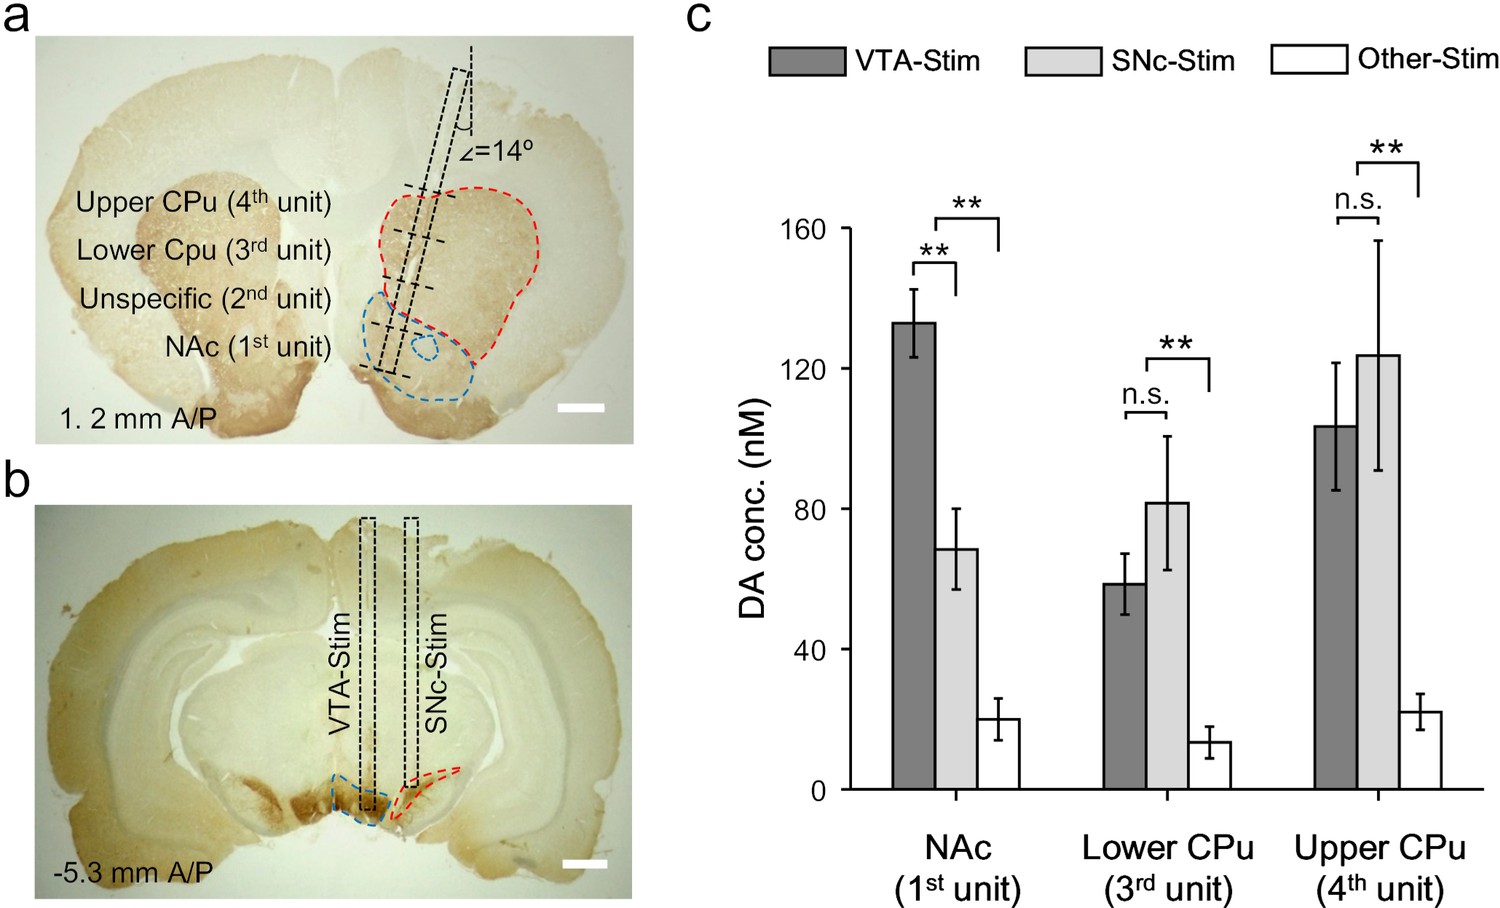
Dopamine mapping across the mesolimbic and nigrostriatal pathways.
(a) Immunohistochemical staining for TH in the CPu and the NAc after an electrochemical measurement. The surgical track of the OECT-array was indicated by the dashed box. The location of each OECT-unit was denoted by dashed lines. Scale bar, 1 mm. (b) Immunohistochemical staining for TH in the VTA and SNc. The surgerical tracks of the stimulation electrodes in VTA or SNc were indicated by dashed boxes. Scale bar, 1 mm. (c) Quantitative analysis of dopamine release in NAc and different parts of CPu simultaneously measured by multiple OECT-units upon electrical stimulation of the mesolimbic (in VTA) or the nigrostriatal (in SNc) pathways. n = 10, the error bars indicate error, ** indicates p<0.005 by student t-test, n.s. stands for ‘not significant’.
-
Figure 5—source data 1
Data for multi-region recording of dopamine release.
- https://cdn.elifesciences.org/articles/50345/elife-50345-fig5-data1-v2.xlsx
Figure 6 with 1 supplement
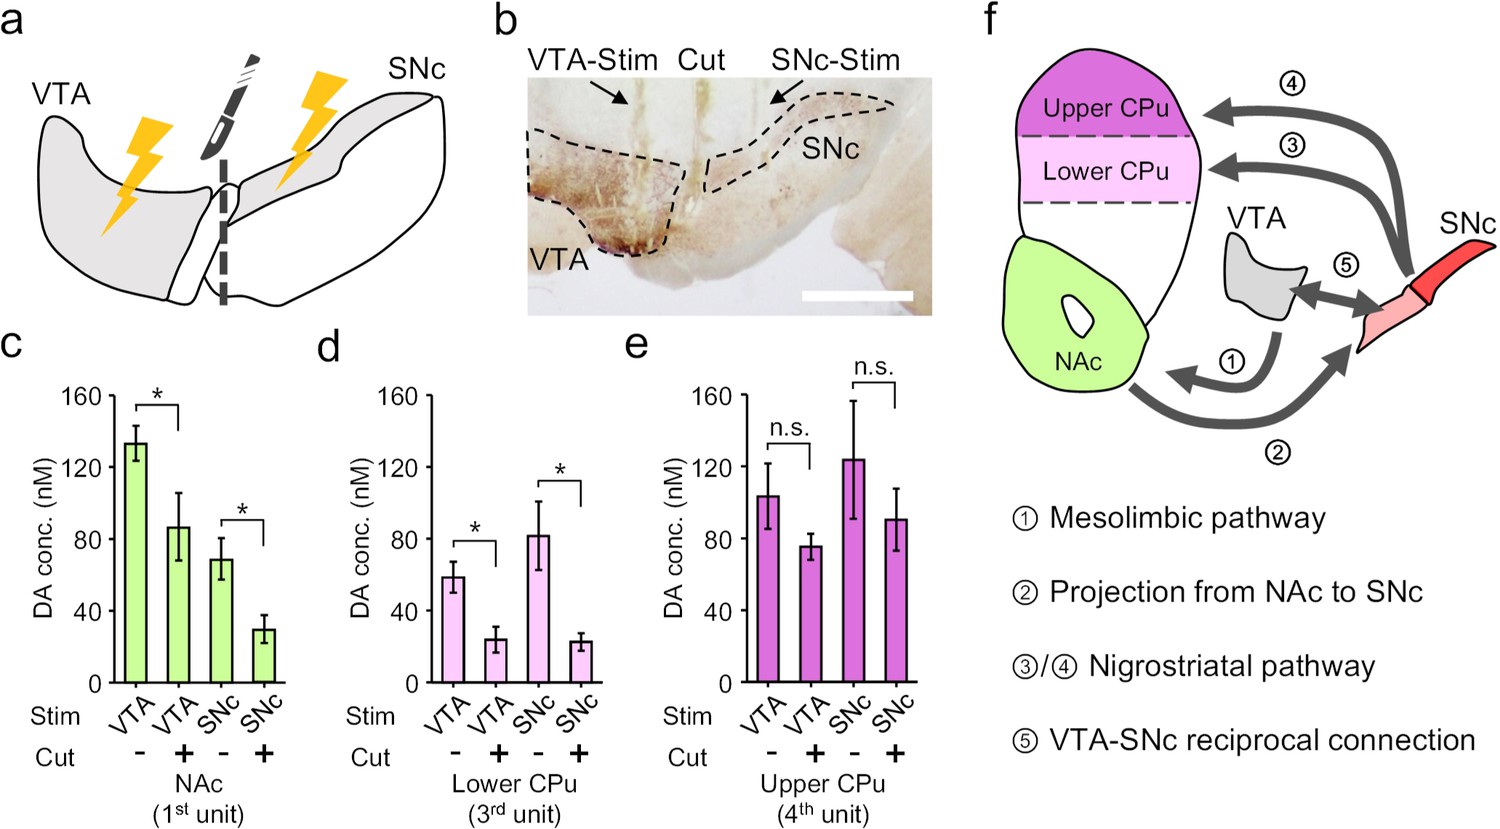
Electrochemical cross-talk between the mesolimbic and nigrostriatal signalling.
(a) Schematic diagram of dopamine mapping in the NAc and CPu in response to surgically isolated VTA- or SNc-stimulation. (b) Immunohistochemical staining for TH in a brain slice showing the surgical tracks of the stimulation electrode in the VTA or SNc, and the mechanical lesion between these two regions. Scale bar, 1 mm. (c–e) Quantitative analysis of the change in dopamine release pattern at different brain regions across mesolimbic and nigrostriatal pathways, including the NAc (c), lower CPu (d) and upper CPu (e), in response to VTA- or SNc-stimulation before and after the surgical lesion to mechanically break the mutual connections between VTA and SNc. n = 6, error bars indicate standard error, *indicates p<0.05 by student t-test; n.s. stands for ‘not significant’. +/- indicates that the measurements were conducted with/without the VTA-SNc surgical lesion. (f) Summary of the identified complex cross-talk between the mesolimbic and nigrostriatal pathways as regulated by the mutual connection between VTA and SNc.
-
Figure 6—source data 1
Data for change in dopamine release after VTA-SNc surgical lesion.
- https://cdn.elifesciences.org/articles/50345/elife-50345-fig6-data1-v2.xlsx
Figure 6—figure supplement 1

Reciprocal connection between VTA and SNc characterized by electrophysiology.
(a) The raster plot (upper) and post stimulation time histogram (PSTH; lower) in SNc upon electrical stimulation in VTA. (b) The raster plot (upper) and PSTH (lower) in VTA upon electrical stimulation in SNc. (c) Representative waveform of the spontaneous spiking of the dopaminergic neurons (>100 spikes). These spikes typically have a long action potential duration greater than 3 ms. (d) Quantitative analysis of the spike count 100 ms after electrical stimulation. The post-stimulation counts were normalized to before-stimulation counts, n = 6, error bars indicate standard error, * indicates p<0.05 by student t-test. For panel (a) and (b), the stimulation is 2 ms pulse width, 50 Hz, 5 pulses, 200 μA amplitude.
Tables
Key resources table
| Reagent type (species) or resource | Designation | Source or reference | Identifiers | Additional information |
|---|---|---|---|---|
| Strain, strain background | Sprague Dawley rat | Chinese University of Hong Kong | ||
| Antibody | rabbit anti-tyrosine hydroxylase | Abcam | Cat# ab112 | IF(1:1000) |
| Antibody | sheep anti-c-Fos antibody | Abcam | Cat# ab6167 | IF(1:1000) |
| Chemical compound, drug | AZ 5214 photoresist | MicroChem | ||
| Chemical compound, drug | AZ 400K developer | MicroChem | ||
| Chemical compound, drug | PEDOT:PSS | Heraeus | Clevios PH-500 | |
| Chemical compound, drug | GOPS | International Laboratory | Cat# 1094601 | |
| Software, algorithm | Matlab | Matlab | 2014a/2015a |
Additional files
-
Source code 1
Matlab code for signal and data processing.
- https://cdn.elifesciences.org/articles/50345/elife-50345-code1-v2.m
-
Transparent reporting form
- https://cdn.elifesciences.org/articles/50345/elife-50345-transrepform-v2.docx
Download links
A two-part list of links to download the article, or parts of the article, in various formats.
Downloads (link to download the article as PDF)
Open citations (links to open the citations from this article in various online reference manager services)
Cite this article (links to download the citations from this article in formats compatible with various reference manager tools)
Organic electrochemical transistor arrays for real-time mapping of evoked neurotransmitter release in vivo
eLife 9:e50345.
https://doi.org/10.7554/eLife.50345


