A proline-rich motif on VGLUT1 reduces synaptic vesicle super-pool and spontaneous release frequency
- Interdisciplinary Institute for Neuroscience, Université de Bordeaux, France
- Interdisciplinary Institute for Neuroscience CNRS UMR 5297, France
- Max Planck Institute of Experimental Medicine, Germany
- Neuroscience Paris Seine NPS, Université Pierre et Marie Curie INSERM U1130 CNRS UMR8246, France
- Bordeaux Imaging Center, Université de Bordeaux, CNRS UMS 3420, INSERM US4, France
- Institut Pasteur, CNRS UMR 3571, Unité NISC, France
- Commissariat à l'Energie Atomique et aux Energies Alternatives (CEA), Direction de laRecherche Fondamentale (DRF), Institut de Biologie François Jacob (IBFJ), MolecularImaging Research Center (MIRCen), France
- Douglas Mental Health University Institute, McGill University, Canada
Figures
Figure 1 with 1 supplement
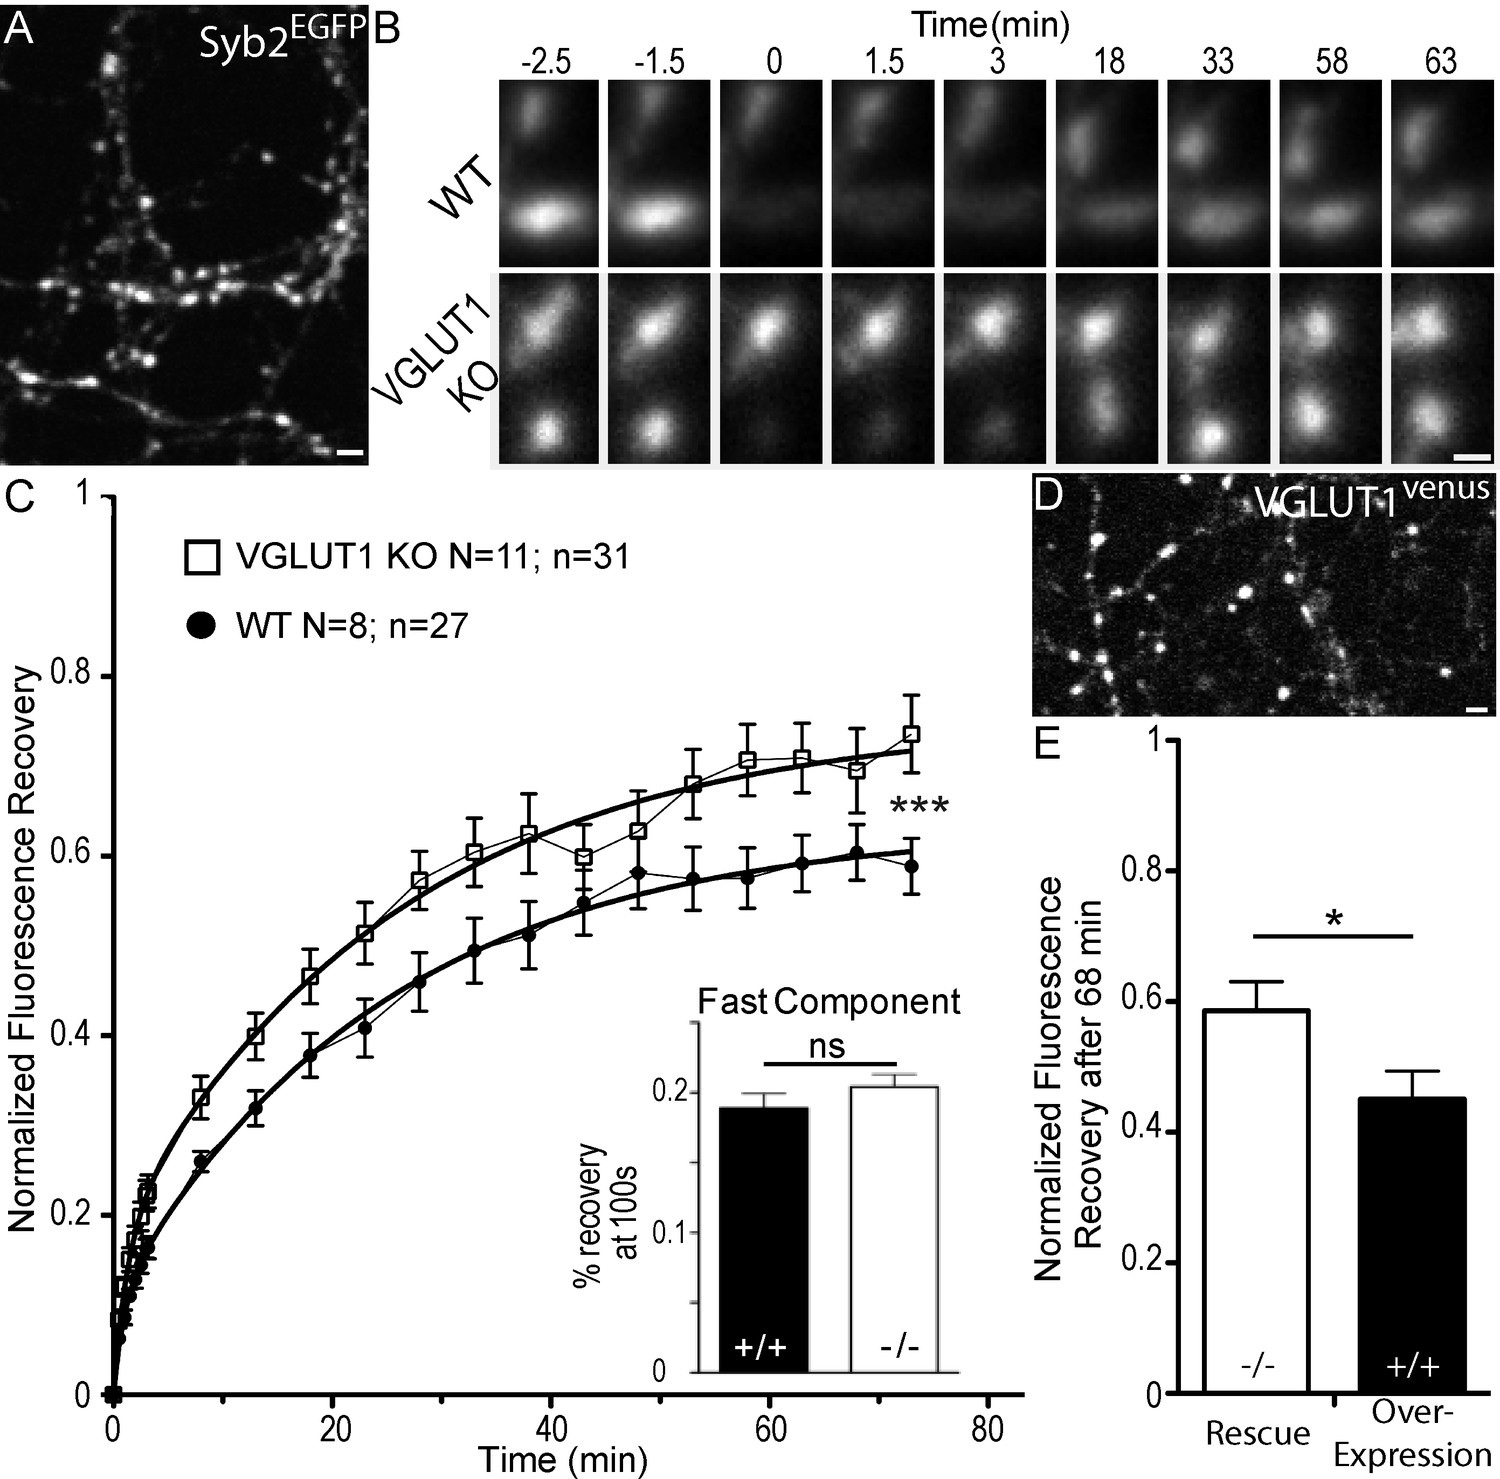
Dose dependent regulation of SV super-pool size by VGLUT1.
(A) Expression of Synaptobrevin2 fused to Enhanced Green Fluorescent Protein (Syb2EGFP) in hippocampal neurons at 18 days in culture. (B) examples of FRAP sequences from both Slc17a7 (VGLUT1) +/+ and - /- genotypes. Boutons are imaged for 3 min, bleached, and recovery is recorded for 73 min. (C) average FRAP kinetics. 27 synapses from +/+ and 31 synapses from - /- were measured by FRAP and the average traces are displayed here (for +/+ N = 8 cultures; for - /- N = 11 cultures). The two traces were fitted using double exponential components equations and the convergence of the traces to a common fit was tested using the extra sum of squares F test. The F test indicates that the traces are best fitted by two divergent models (F ratio = 19.32; p<0.0001). Fast FRAP recovery was monitored every 5 s in an independent set of experiments (inset). (D) Expression of transduced VGLUT1venus in hippocampal neurons. (E) Average FRAP recovery of VGLUT1venus at 68 min post-bleach in rescue or over-expression. Over-expression reduces the mobility of SVs (Unpaired t test, p=0.0385, t = 2.176. For overexpression: N = 4 cultures, n = 14 synapses; for rescue: N = 3 cultures, n = 15 synapses). scale bar: 2 µm in A and D, 1 µm in B.
-
Figure 1—source data 1
Raw data for FRAP experiments with VGLUT1 WT and KO culture.
- https://doi.org/10.7554/eLife.50401.004
-
Figure 1—source data 2
Raw data for FRAP experiments with VGLUT1 rescued and VGLUT1 overexpressed culture.
- https://doi.org/10.7554/eLife.50401.005
Figure 1—figure supplement 1

VGLUT2 does not rescue SV super-pool size in VGLUT1 knock out neurons.
(A) Average FRAP kinetics obtained upon rescue of VGLUT1 KO cells by either VGLUT1venus or VGLUT2venus lentivirus. 24 synapses from VGLUT1venus and 20 synapses from VGLUT2venus were measured by FRAP and the average traces are displayed (VGLUT1venusrescue N = 7 cultureVGLUT2venus N = 7 cultures). The two traces were fitted using double exponential components equations and the convergence of the traces to a common fit was tested using the extra sum of squares F test. The F test indicates that the traces are best fitted by two divergent models (F ratio = 19.27; p<0.0001).
-
Figure 1—figure supplement 1—source data 1
Raw data for FRAP experiments with VGLUT1 and VGLUT2 rescued culture.
- https://doi.org/10.7554/eLife.50401.006
Figure 2

Structure of VGLUT1 and expression of mutants in neurons.
(A) schematic of VGLUT1 structure with 560 amino acids, 12 transmembrane domains, N- and C-termini facing the cytoplasmic side, and N-glycosylation at the first luminal loop. In blue the three residues mutated to silence VGLUT1 transport (sVGLUT1 see Figure 3). Red bars mark the three deletions used (∆C-term, ∆PRD1+2, ∆PRD2). Red residues were mutated to alanine in order to test their role in the super-pool regulation supported by VGLUT1. All mutations carried a venus tag at the C-terminus. (B) examples of expression patterns obtained with VGLUT1 WT and mutants upon transduction in hippocampal neurons matching endogenous expression levels. Note the dense punctate expression and low somatic signal typical of VGLUT1 distribution. Scale bar 10 µm. (C) Measurement of bouton area. None of the mutants displayed a shift in bouton size compared to WT controls. (D) Measurement of fluorescence intensity. None of the mutants displayed a significant shift in fluorescence intensity compared to WT controls.
-
Figure 2—source data 1
Raw data for Bouton size and intensity in VGLUT1 WT and mutants rescued culture.
- https://doi.org/10.7554/eLife.50401.008
Figure 3 with 2 supplements
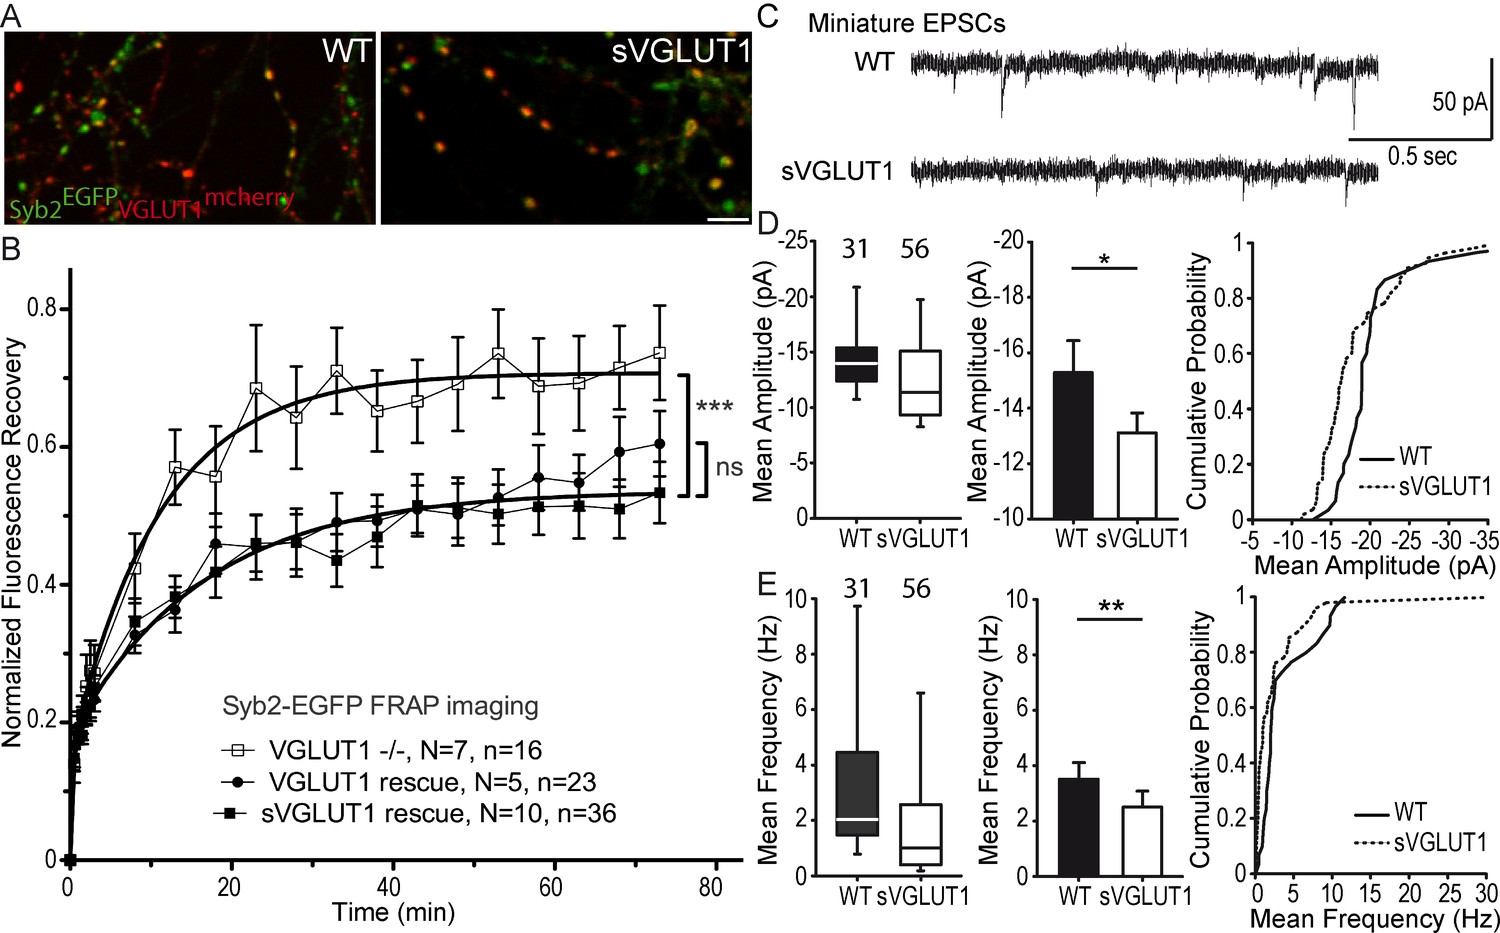
Glutamate transport and SV tonicity are not involved in the reduction of SV super-pool size.
(A) Expression of VGLUT1mCherry, sVGLUT1mCherry and Syb2EGFP in hippocampal neurons. FRAP was performed on Syb2EGFP at axons, both on those with, and those without mCherry signal. Scale bar 5 µm. (B) Average FRAP kinetics from knock-out cells rescued by VGLUT1mCherry, sVGLUT1mCherry, and VGLUT1 KO synapses not rescued. Synapses from each genotype were measured by FRAP and the average traces are displayed (N = 7 independent cultures, 16 synapses for -/-; N = 5 cultures, 23 synapses for WT rescue, and N = 10 cultures, 36 synapses for sVGLUT1 rescue). The three traces were fitted using double exponential components equations and the convergence of the traces to a common fit was tested using the extra sum of squares F test. The F test indicates that the traces are best fitted by two divergent models (one for - /- synapses and the other one for both rescues, F ratio = 30.25; p<0.0001). FRAP kinetics for the 2 types of rescued synapses are best fitted by one convergent model (F ratio = 1.235; p=0.294). (C) Spontaneous excitatory activity in VGLUT1 KO rescued neurons. Example traces of mEPSC activity in wild type and sVGLUT1 rescue conditions. (D) Comparison of the amplitude of mEPSC events in wild type and sVGLUT1 rescue conditions (N = 3 independent cultures, n = 31 cells, mean amplitude = 15.3 pA ± 1.15 SEM for wild type rescue; N = 3 independent cultures, n = 56 cells, mean amplitude = 13.12 pA ± 0.71 SEM for sVGLUT1 rescue; unpaired t-test p=0.011). (E) Comparison of the frequency of mEPSC events in wild type and sVGLUT1 rescue conditions. (N = 3 independent cultures, n = 31 cells, mean frequency = 3.51 Hz ± 0.6 SEM for wild type rescue; N = 3 independent cultures, n = 56 cells, mean frequency = 2.51 Hz ± 0.58 SEM for sVGLUT1 rescue; unpaired t-test p=0.008). Note that sVGLUT1 conditions are both significantly smaller than wild type rescue conditions.
-
Figure 3—source data 1
Raw data for FRAP experiments with VGLUT1 WT, sVGLUT1 rescued and non-rescued culture.
- https://doi.org/10.7554/eLife.50401.013
-
Figure 3—source data 2
Raw data for Electrophysiological recording with VGLUT1 WT and sVGLUT1 rescued culture.
- https://doi.org/10.7554/eLife.50401.014
Figure 3—figure supplement 1
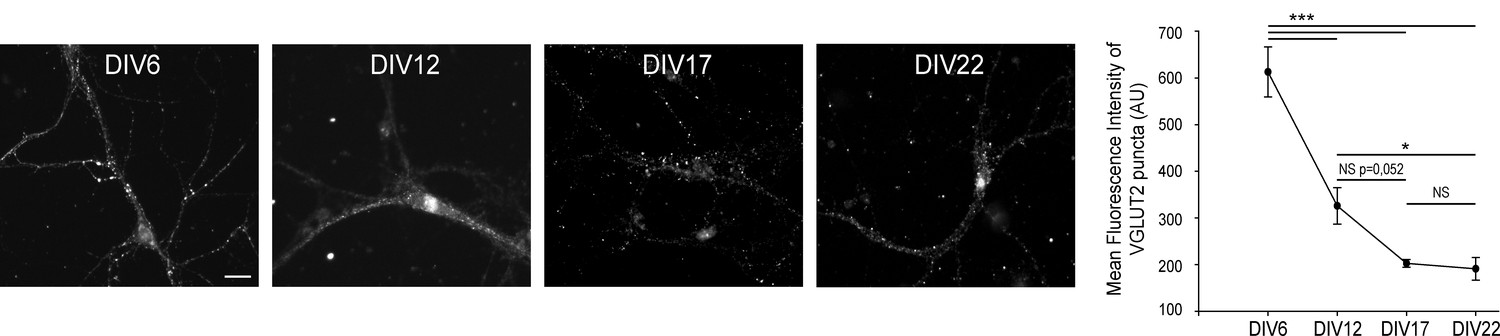
VGLUT2 expression diminishes in hippocampal neurons until DIV17.
(A) Immunofluorescence of VGLUT2 on hippocampal neurons at DIV 6, 12, 17, and 22. Scale bar 40 µm. (B) Quantification of VGLUT2 expression during hippocampal neuron culture development. Note the 3-fold reduction of VGLUT2 level between DIV 6 and 17, while the expression reached a low plateau between DIVB17 and 22. DIV6, N = 4, mean intensity = 612.8 ± 53.8; DIV12, N = 3, mean intensity = 325.9 ± 39.0; DIV17, N = 7, mean intensity = 202.8 ± 8.2; DIV22, N = 5, mean intensity = 191.2 ± 24.2. One way ANOVA p≤0.001; pair wise comparisons: DIV6 vs. DIV22 p<0,001 ; DIV6 vs. DIV17 p<0,001 ; DIV6 vs. DIV12 p<0,001 ; DIV12 vs. DIV22 p=0,044 ; DIV12 vs. DIV17 p=0,052 ; DIV17 vs. DIV22 p=0989.
-
Figure 3—figure supplement 1—source data 1
Raw data for Electrophysiological recording with VGLUT1 WT and sVGLUT1 rescued culture.
- https://doi.org/10.7554/eLife.50401.015
Figure 3—figure supplement 2
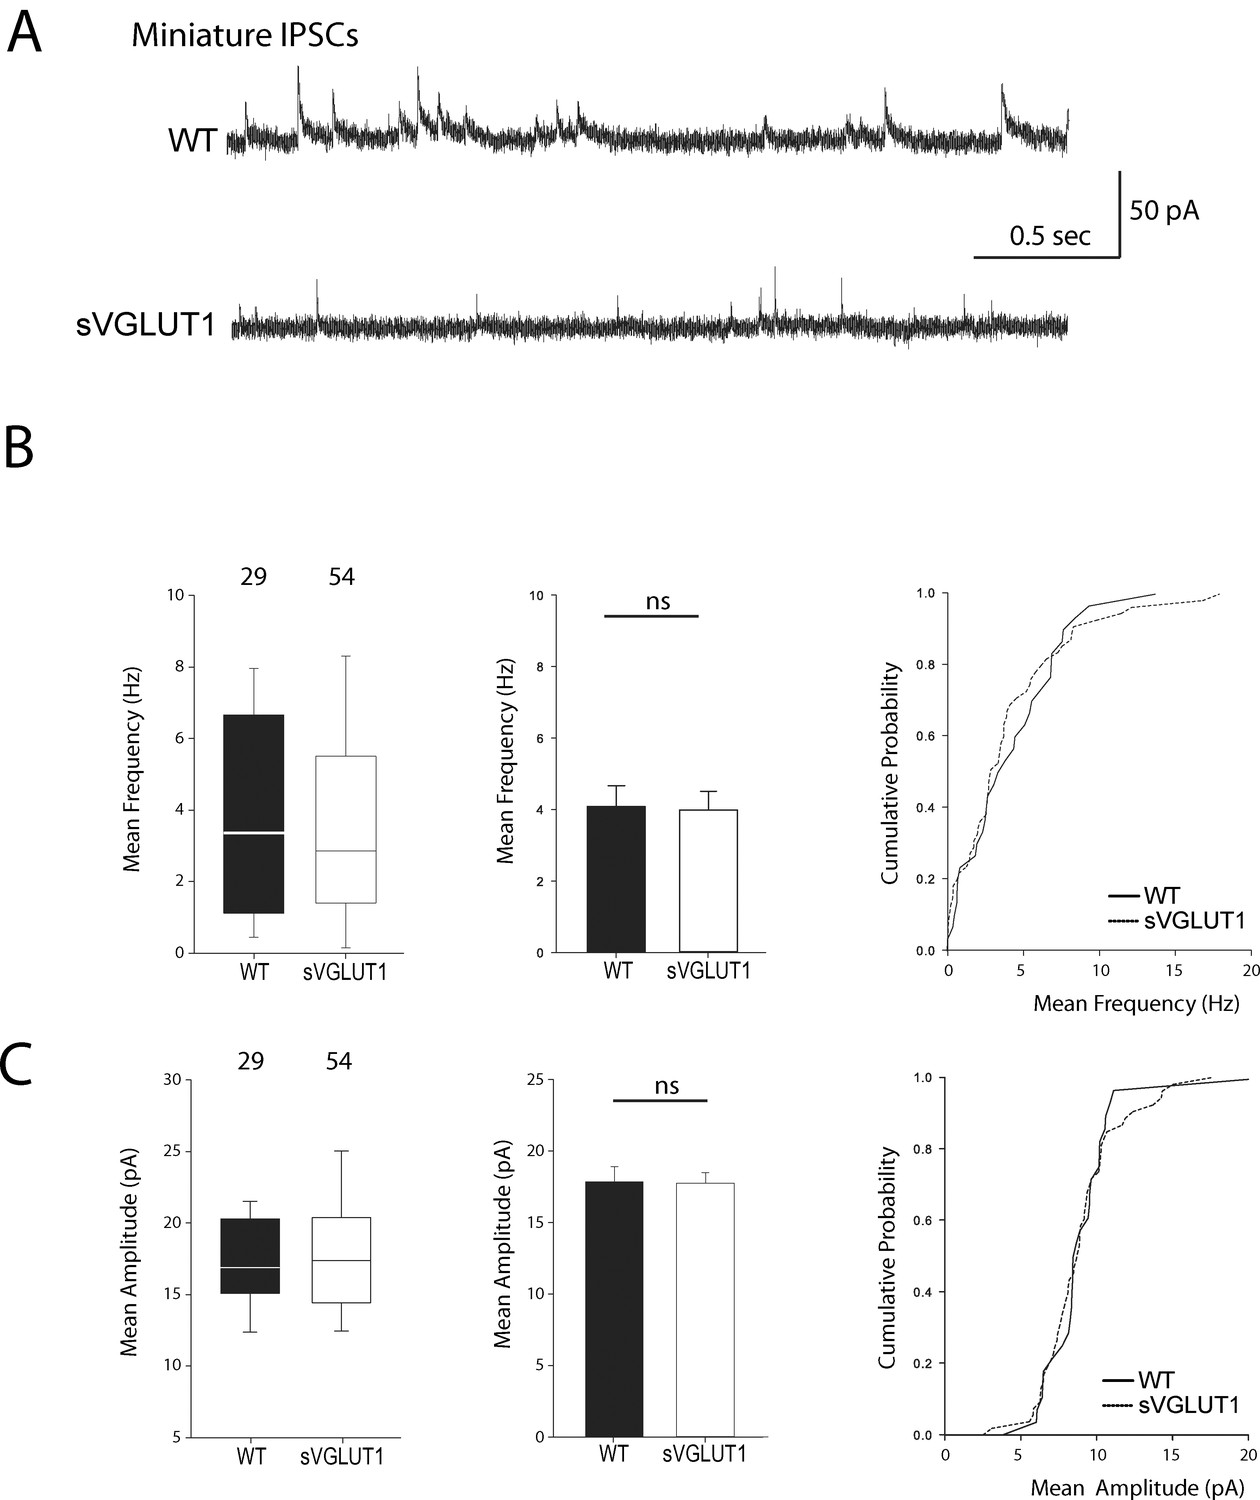
Vesicular glutamate uptake function does not influence mIPSCs features.
(A) Spontaneous inhibitory activity in VGLUT1 KO rescued neurons. Example traces of mIPSC activity in wild type and sVGLUT1 rescue conditions. B: Comparison of the frequency of mIPSC events in wild type and sVGLUT1 rescue conditions (N = 3 independent cultures, n = 31 cells, mean frequency = 4.08 Hz ± 0.59 SEM for wild type rescue; N = 3 independent cultures, n = 56 cells, mean frequency = 3.99 Hz ± 0.52 SEM for sVGLUT1 rescue; unpaired t-test p=0.62). C: Comparison of the amplitude of mIPSC events in wild type and sVGLUT1 rescue conditions (N = 3 independent cultures, n = 31 cells, mean amplitude = 18.06 pA ± 1.07 SEM for wild type rescue; N = 3 independent cultures, n = 56 cells, mean amplitude = 17.69 pA ± 0.73 SEM for sVGLUT1 rescue; unpaired t-test p=0.70).
Figure 4 with 2 supplements
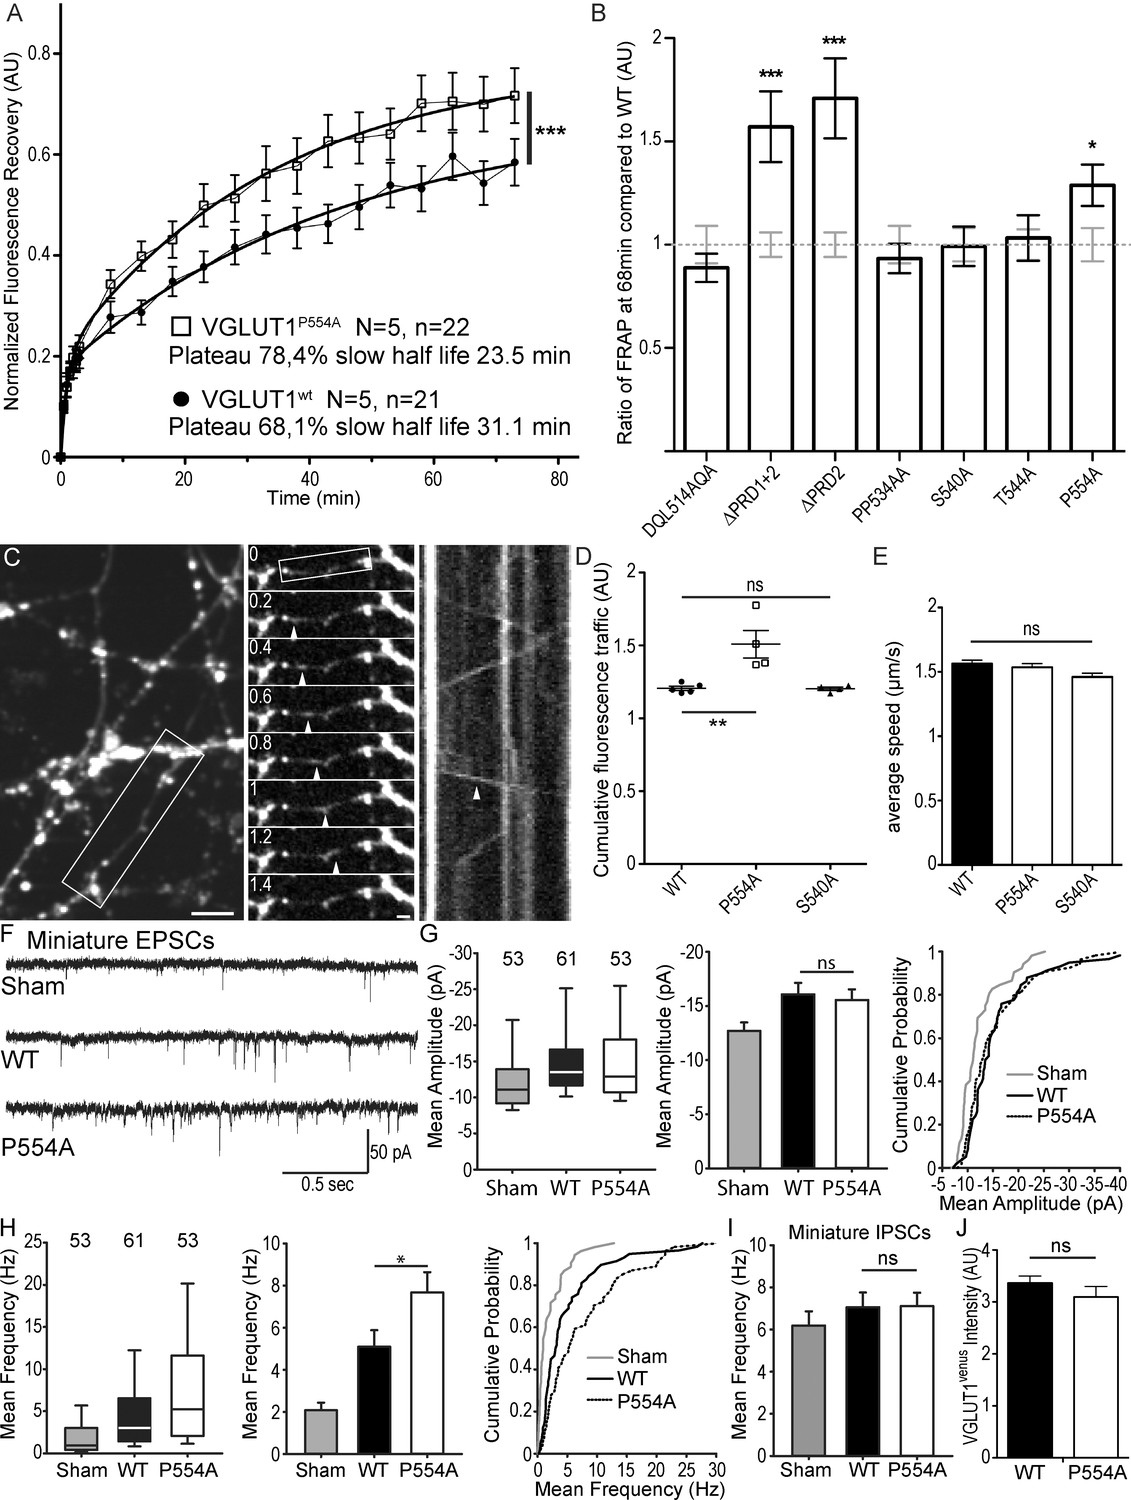
The VGLUT1 PRD2 domain mediates SV super-pool size and mEPSC frequency reductions.
(A) Comparison of VGLUT1venus and VGLUT1P554A-venus rescues of VGLUT1 KO on SV exchange rates at synapses. 21 (WT) and 22 (P554A) synapses from each rescue were measured by FRAP and the average traces are displayed (N = 5 cultures for WT and N = 5 cultures for P554A). The two traces were fitted using double exponential components equations and the convergence of the traces to a common fit was tested using the extra sum of squares F test. The F test indicates that the traces are best fitted by two divergent models (F ratio = 19.64; p<0.0001). (B) Similar experiments where performed for ∆PRD1+2, ∆PRD2, DQL514AQA, PP534AA, S540A and T544A. The results are displayed here as a comparison of fluorescence recovery to the corresponding WT control 68 min after bleaching. Only mutants affecting PRD2 display a lack of reduction to WT levels and a significantly higher SV exchange rate (t test, WT vs. ∆PRD1+2: p=0.0005, t = 3.790; vs. ∆PRD2: p<0.0001, t = 4.369; vs. P554A: p=0.0293, t = 2.266). (C) Time lapse imaging of SV axonal transport. VGLUT1venus, or VGLUT1P554A-venus, or VGLUT1S540A-venus were expressed in VGLUT1 KO neurons. Example sequence extracted from the boxed fiber (left) sampled every 200 ms over 30 s (middle). Vertical arrowhead points to a venus fluorescent dot traveling along the axon. Kymograph of fluorescence movements within the example fiber (boxed in middle panel). Vertical arrowhead points to the same traced event shown in the middle panel. Scale bar: left 5 µm, middle 2 µm. (D) Cumulative axonal fluorescence traffic measured over time-lapse sequences. A significant increase in VGLUT1venus traffic is seen when P554A is expressed compared to WT and S540A mutant (unpaired t test, WT vs. P554A: p=0.0092, t = 3.564; vs. S540A: p=0.8963, t = 0.1351. N = 5 cultures for WT, and N = 4 cultures for both P554A and S540A.). (E) Average speed of VGLUT1venus dots was extracted from kymographs. No significant changes in speed was seen for mutants tested compared to WT (One-way ANOVA, p=0.0634, F ratio = 2.431. Speed for each mutant, WT: 1.564 ± 0.02692 µm/s; P554A: 1.536 ± 0.02860 µm/s; S540A: 1.460 ± 0/02942 µm/s). (F) Spontaneous excitatory activity in VGLUT1 KO neurons rescued by wild type and P554A VGLUT1 constructs. Example traces of mEPSC activity in sham controls, wild type and VGLUT1P554A rescue conditions. (G) Comparison of the amplitude of mEPSC events in wild type and VGLUT1P554A rescue conditions (N = 3 independent cultures, n = 53 cells, mean amplitude = 12.73 pA ± 0.79 SEM for sham controls; N = 3 independent cultures, n = 61 cells, mean amplitude = 16.05 pA ± 1.05 SEM for wild type rescue; N = 3 independent cultures, n = 53 cells, mean amplitude = 15.59 pA ± 1.02 SEM for vglut1P554A rescue; Mann-Whitney test of wild type versus VGLUT1P554A, p=0.485). Note that both wild type and VGLUT1P554A rescue mEPSC amplitudes significantly and to the same extent compared to sham controls. (H) Comparison of the frequency of mEPSC events in wild type and VGLUT1P554A rescue conditions (N = 3 independent cultures, n = 53 cells, mean frequency = 2.14 Hz ± 0.37 SEM for sham controls; N = 3 independent cultures, n = 61 cells, mean frequency = 5.53 Hz ± 0.87 SEM for wild type rescue; N = 3 independent cultures, n = 53 cells, mean frequency = 7.59 Hz ± 0.97 SEM for VGLUT1P554A rescue; Mann-Whitney test of wild type versus VGLUT1P554A, p=0.031). Note that VGLUT1P554A mEPSC events are significantly more frequent than wild type rescue conditions. (I) Comparison of the frequency of mIPSC events in wild type and VGLUT1P554A rescue conditions (N = 3 independent cultures, n = 53 cells, mean frequency = 6.21 Hz ± 0.69 SEM for sham controls; N = 3 independent cultures, n = 61 cells, mean frequency = 7.28 Hz ± 0.69 SEM for wild type rescue; N = 3 independent cultures, n = 53 cells, mean frequency = 6.79 Hz ± 0.63 SEM for VGLUT1P554A rescue; Mann-Whitney test of wild type versus VGLUT1P554A, p=0.781). Note that all groups are equivalent regarding mIPSC amplitudes (Figure 4—figure supplement 2 displays the full IPSC data set). (J) Post-hoc analysis of VGLUT1venus average fluorescence integrated intensity at boutons in cultures monitored in electrophysiology. (N = 2 independent cultures, mean integrated intensity of punctate VGLUT1venussignal = 3.28 AU ± 0.15 SEM for wild type rescue; N = 2 independent cultures, mean integrated intensity of punctate VGLUT1venussignal = 3.11 AU ± 0.31 SEM for VGLUT1P554A rescue; T test, p=0.348).
-
Figure 4—source data 1
Raw data for FRAP experiments with VGLUT1 WT and P554A rescued culture.
- https://doi.org/10.7554/eLife.50401.019
-
Figure 4—source data 2
Raw data for FRAP experiments with VGLUT1 WT, ΔPRD 1+2 and ΔPRD 2 rescued culture.
- https://doi.org/10.7554/eLife.50401.020
-
Figure 4—source data 3
Raw data for FRAP experiments with VGLUT1 WT and DQL514AQA rescued culture.
- https://doi.org/10.7554/eLife.50401.021
-
Figure 4—source data 4
Raw data for FRAP experiments with VGLUT1 WT and PP534AA rescued culture.
- https://doi.org/10.7554/eLife.50401.022
-
Figure 4—source data 5
Raw data for FRAP experiments with VGLUT1 WT and S540A rescued culture.
- https://doi.org/10.7554/eLife.50401.023
-
Figure 4—source data 6
Raw data for FRAP experiments with VGLUT1 WT and T544A rescued culture.
- https://doi.org/10.7554/eLife.50401.024
-
Figure 4—source data 7
Raw data for Cumulative SV axonal transport in VGLUT1 WT, P554A and S540A rescued culture.
- https://doi.org/10.7554/eLife.50401.025
-
Figure 4—source data 8
Raw data for SV axonal transport speed in VGLUT1 WT, P554A and S540A rescued culture.
- https://doi.org/10.7554/eLife.50401.026
-
Figure 4—source data 9
Raw data for Electrophysiological recording with VGLUT1 WT and P554A rescued and non-rescued culture.
- https://doi.org/10.7554/eLife.50401.027
Figure 4—figure supplement 1
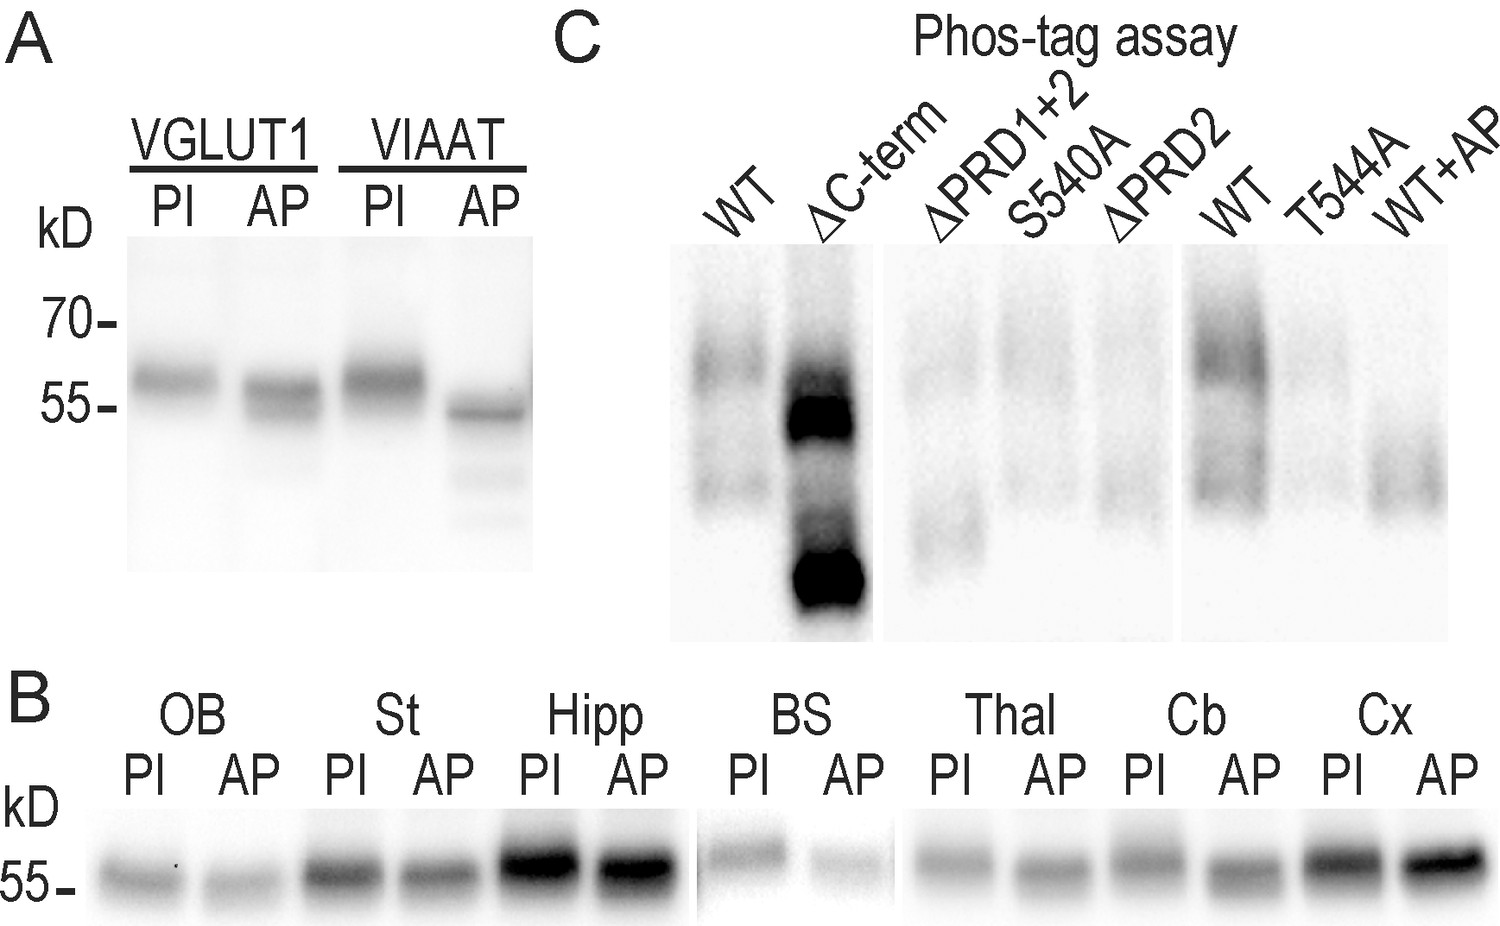
VGLUT1 is phosphorylated but not at the conserved 540-SYGAT motif.
(A) Effect of alkaline phosphatase on the electrophoretic mobility of VGLUT1 from forebrain homogenates (and positive control VIAAT ; Vesicular Inhibitory Amino-Acid Transporter). (B) regional distribution of VGLUT1 phosphorylation state. Homogenates of several brain regions where probed for VGLUT1 signal as in panel A. OB: olfactory bulb, St: Striatum, Hipp: Hippocampus, BS: Brain Stem, Thal: Thalamus, Cb: Cerebellum, Cx: Cortex. (C) PhosTag assay on VGLUT1 KO primary neuron cultures rescued with VGLUT1venus WT and C-terminal mutant constructs. Note that PhosTag assays prevent from using a size ladder. All constructs display a phospho-shifted band that disappeared upon desphosphorylation by alkaline phosphatase. PI : phosphatase inhibitors; AP: alkaline phosphatase. Selected lanes blotted on the same membranes were reorganized for display purpose.
Figure 4—figure supplement 2
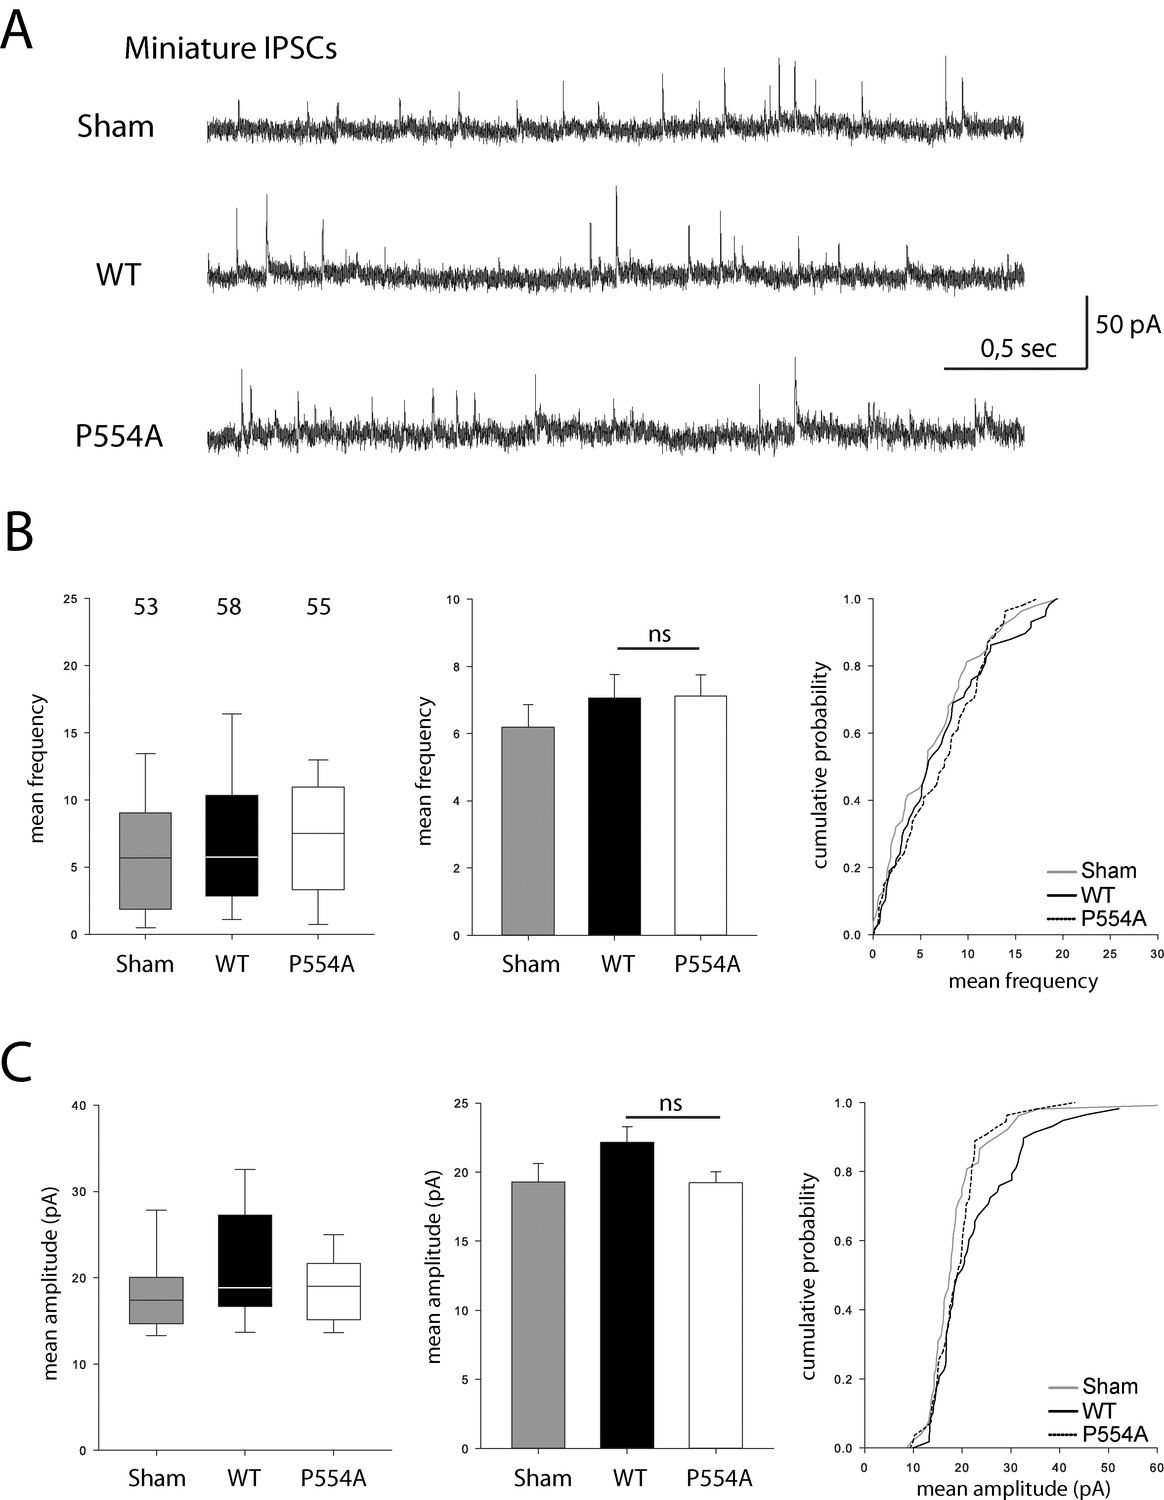
VGLUT1 PRD2 domain removal does not affect mIPSCs features.
(A) Spontaneous inhibitory activity in VGLUT1 KO neurons rescued by wild type and VGLUT1 P554A constructs. Example traces of mIPSC activity in sham controls, wild type and VGLUT1P554A rescue conditions. (B) Comparison of the frequency of mIPSC events in wild type and VGLUT1P554A rescue conditions (N = 3 independent cultures, n = 53 cells, mean frequency = 6.21 Hz ± 0.69 SEM for sham controls; N = 3 independent cultures, n = 61 cells, mean frequency = 7.28 Hz ± 0.69 SEM for wild type rescue; N = 3 independent cultures, n = 53 cells, mean frequency = 6.79 Hz ± 0.63 SEM for VGLUT1P554A rescue; Mann-Whitney test of wild type versus VGLUT1P554A, p=0.781). (C) Comparison of the amplitude of mIPSC events in wild type and VGLUT1P554A rescue conditions (N = 3 independent cultures, n = 53 cells, mean amplitude = 19.29 pA ± 1.34 SEM for sham controls; N = 3 independent cultures, n = 61 cells, mean amplitude = 22.47 pA ± 1.13 SEM for wild type rescue; N = 3 independent cultures, n = 53 cells, mean amplitude = 19.24 pA ± 0.78 SEM for VGLUT1P554A rescue; Mann-Whitney test of wild type versus VGLUT1P554A, p=0.137).
-
Figure 4—figure supplement 2—source data 1
Raw data for Electrophysiological recording with VGLUT1 WT and P554A rescued and non-rescued culture.
- https://doi.org/10.7554/eLife.50401.028
Figure 5 with 1 supplement
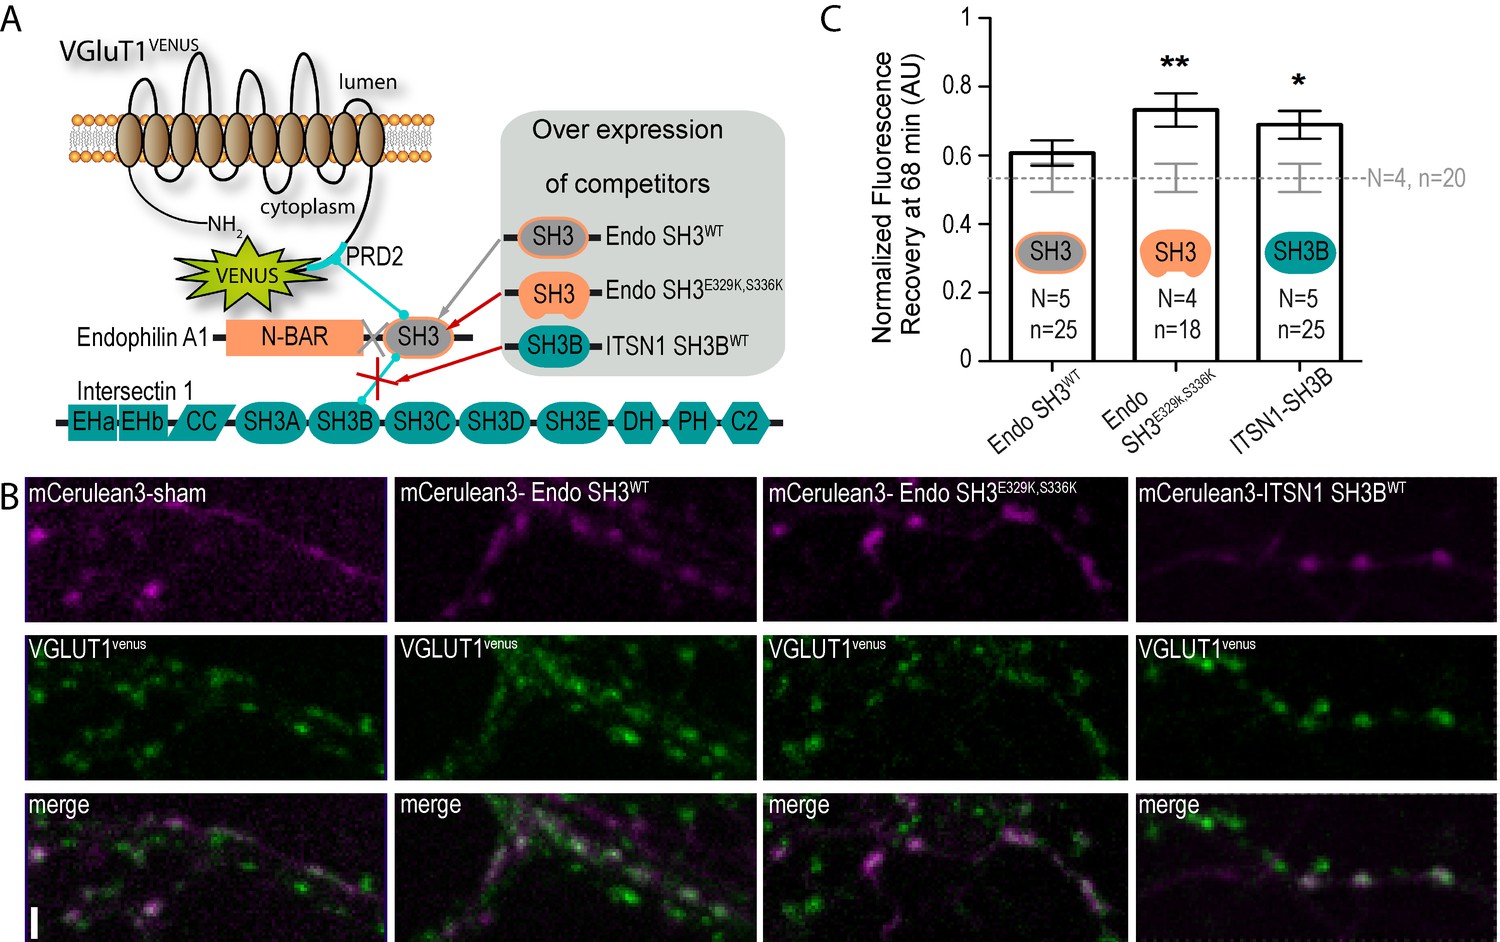
A tripartite complex between VGLUT1, endophilinA1 and intersectin1 mediates SV super-pool reduction.
(A) Schematic model of the competition experiment designed to test for the effective recruitment of intersectin1 at the VGLUT1/endophilinA1 complex (Pechstein et al., 2015). The three SH3 domains over-expressed in this competition assay disrupt distinct parts of the tripartite complex. The SH3 domain of endophilinA1 displaces the endogenous endophilinA1 BAR domain (Endo SH3WT). The SH3 domain of endophilinA1 mutated at E329K and S336K disrupts the interaction of intersectin1 with the VGLUT1/endophilinA1 complex (Pechstein et al., 2015). Finally, the SH3B domain of intersectin1 should displace the endogenous intersectin1 and allows us to assess whether the full-length intersectin1 is required. (B) Over-expression of SH3 domains fused with mCerulean3 in VGLUT1venus neurons. Axons filled with mCerulean3 were selected for FRAP experiments. Scale bar 2 µm. (C) FRAP measurement of SV super-pool in SH3 domains competition experiments. Synapses from each over-expression condition were measured by FRAP and the average recovery after 68 min are displayed (0.5346 ± 0.04128, N = 4 and n = 20 for sham; 0.6071 ± 0.03705, N = 5 and n = 25 for Endo-SH3WT; 0.7323 ± 0.04909, N = 4 and n = 18 for Endo-SH3E329K,S336K; 0.6894 ± 0.04036, N = 5 and n = 25 for ITSN1-SH3B). Sham and Endo-SH3WT converged to a lower SV exchange recovery (Mann-Whitney test, p=0.141) while Endo-SH3E329K,S336K (Mann-Whitney test, p=0.005 **) and ITSN1-SH3B (Mann-Whitney test, p=0.014 *) generated higher SV exchange recovery curves.
-
Figure 5—source data 1
Raw data for FRAP experiments with SH3 domain mutant overexpressed VGLUT1venusculture.
- https://doi.org/10.7554/eLife.50401.031
Figure 5—figure supplement 1
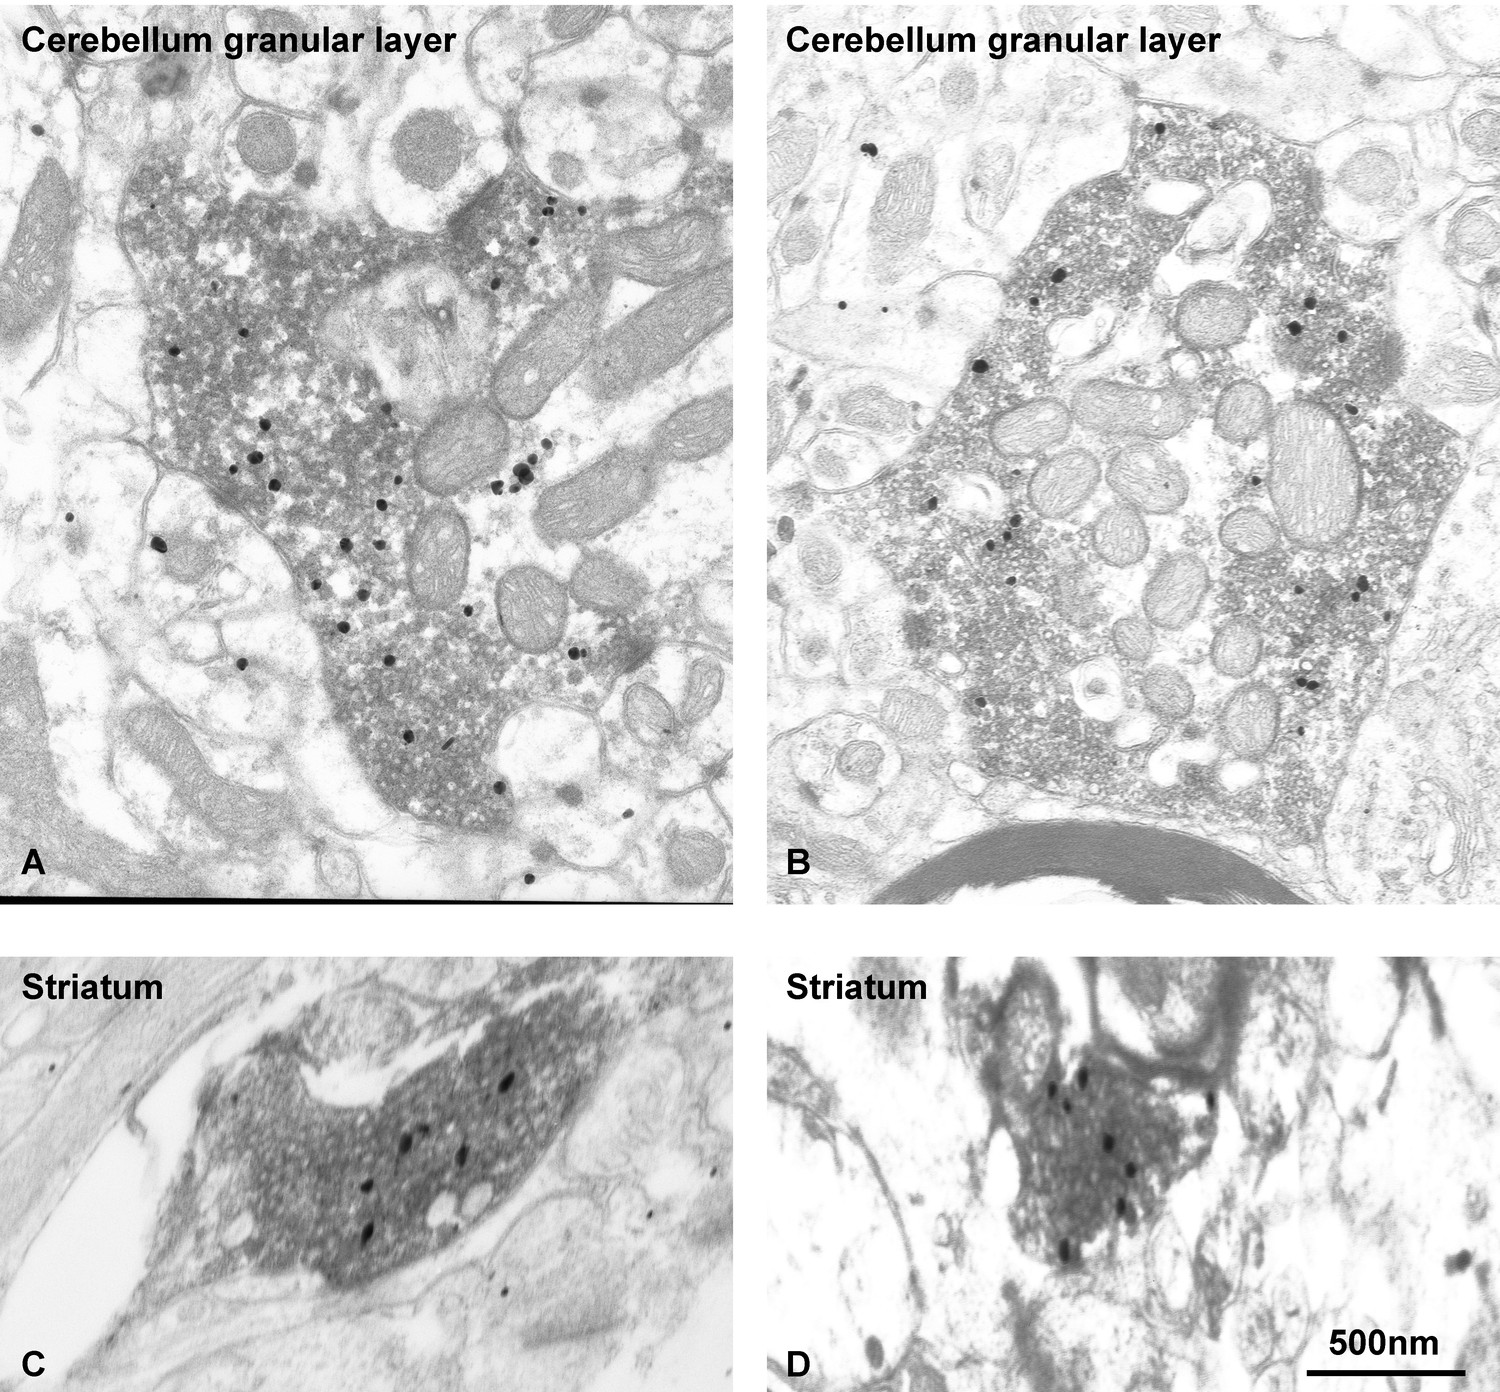
EndophilinA1 accumulates at synaptic vesicle clusters of VGLUT1 synapses.
Subcellular distribution of EndophilinA1 in VGLUT1 immunopositive terminals in mossy fiber terminals of the cerebellum (A,B) and cortico-striatal projections (C,D). We used pre-embedding immunogold (EndophilinA1) combined with immunoperoxidase (VGLUT1) methods. VGLUT1 immunoreaction product was visible at the level of SV throughout the axoplasm of the terminals. Immunoparticles for EndophilinA1 are detected throughout the axoplasm all over the clusters of VGLUT1 immunopositive vesicles. Scale bar : 500 nm.
Tables
Table 1
List of mutant constructs tested.
https://doi.org/10.7554/eLife.50401.009| Mutation | Domain/Motif | Name | Putative function | |
|---|---|---|---|---|
| VGLUT1 | R80Q/R176K/R314Q | TM1;TM4;TM7 | sVGLUT1 | Glutamate transport |
| ∆504–560 | Whole C-terminus | ∆C-term | SV/VGLUT Trafficking | |
| DQL514AQA | PDZ type three binding | DQL514AQA | Unknown | |
| ∆530–560 | Proline Rich Domains 1+2 | ∆PRD1+2 | SH3 domain binding | |
| PP534AA | Proline Rich Domain1 | PP534AA | SH3 domain binding | |
| S540A | SYGAT | S540A | Unknown | |
| T544A | SYGAT | T544A | Unknown | |
| ∆550–560 | Proline Rich Domain 2 | ∆PRD2 | Endophilin binding | |
| P554A | Proline Rich Domain 2 | P554A | Endophilin binding | |
| EndoA1 290–352 | SH3 | SH3 | Binds PRD and ITSN1 SH3B | |
| EndoA1 290-352E329K,S336K | SH3 | SH3E329K,S336K | Binds PRD and ITSN1 SH3B | |
| ITSN1 903–971 | SH3B | SH3B | Endo SH3 binding through E329 and S336 |
Key resources table
| Reagent type (species) or resource | Designation | Source or reference | Identifiers | Additional information |
|---|---|---|---|---|
| Strain, strain background (Mus musculus) | Slc17a7-/-(VGLUT1 KO) mice | PMID: 15103023 | available upon request to Dr Sonja M. Wojcik wojcik@em.mpg.de | |
| Strain, strain background (Mus musculus) | Slc17a7v/v(VGLUT1venus KI) mice | PMID: 22031900 | available upon request to corresponding author | |
| Transfected construct (Homo sapiens) | F(syn)W-RBN::Synaptobervin2-EGFP | PMID: 23581566 | available upon request to Dr. Etienne Herzog | Figure 1, Figure 3 and related results part. Lentiviral vector expressing Syb2EGPF. |
| Transfected construct (Rattus norvegicus) | F(syn)W-RBN::VGLUT1-venus | PMID: 23581566 | available upon request to Dr. Etienne Herzog | Figure 1, Figure 4 and related results part. Lentiviral vector expressing VGLUT1venus. |
| Transfected construct (Rattus norvegicus) | F(syn)W-RBN::VGLUT2-venus | This paper | available upon request to Dr. Etienne Herzog | Figure 1—figure supplement 1–S1 and related results part. Lentiviral vector expressing VGLUT2venus. |
| Transfected construct (Rattus norvegicus) | F(syn)W-RBN::VGLUT1 ∆C-term-venus | This paper | available upon request to Dr. Etienne Herzog | Figure 4 and related results part. Lentiviral vector expressing VGLUT1∆C-term-venus. |
| Transfected construct (Rattus norvegicus) | F(syn)W-RBN::VGLUT1 DQL514AQA-venus | This paper | available upon request to Dr. Etienne Herzog | Figure 4 and related results part. Lentiviral vector expressing VGLUT1DQL514AQA-venus. |
| Transfected construct (Rattus norvegicus) | F(syn)W-RBN::VGLUT1 ∆PRD1+2-venus | This paper | available upon request to Dr. Etienne Herzog | Figure 4 and related results part. Lentiviral vector expressing VGLUT1∆PRD1+2-venus. |
| Transfected construct (Rattus norvegicus) | F(syn)W-RBN::VGLUT1 PP534AA-venus | This paper | available upon request to Dr. Etienne Herzog | Figure 4 and related results part. Lentiviral vector expressing VGLUT1PP534AA-venus. |
| Transfected construct (Rattus norvegicus) | F(syn)W-RBN::VGLUT1 S540A-venus | This paper | available upon request to Dr. Etienne Herzog | Figure 4 and related results part. Lentiviral vector expressing VGLUT1S540A-venus. |
| Transfected construct (Rattus norvegicus) | F(syn)W-RBN::VGLUT1 T544A-venus | This paper | available upon request to Dr. Etienne Herzog | Figure 4 and related results part. Lentiviral vector expressing VGLUT1T544A-venus. |
| Transfected construct (Rattus norvegicus) | F(syn)W-RBN::VGLUT1 ∆PRD2-venus | This paper | available upon request to Dr. Etienne Herzog | Figure 4 and related results part. Lentiviral vector expressing VGLUT1∆PRD2-venus. |
| Transfected construct (Rattus norvegicus) | F(syn)W-RBN::VGLUT1 P554A-venus | This paper | available upon request to Dr. Etienne Herzog | Figure 4 and related results part. Lentiviral vector expressing VGLUT1P554A-venus. |
| Transfected construct (Rattus norvegicus) | AAV9::VGLUT1mCherry-miniSOG | This paper | available upon request to Dr. Etienne Herzog | Figure 3 and related results part. Lentiviral vector expressing VGLUT1mCherry-miniSOG. |
| Transfected construct (Rattus norvegicus) | AAV9::sVGLUT1mCherry-miniSOG | This paper | available upon request to Dr. Etienne Herzog | Figure 3 and related results part. Lentiviral vector expressing sVGLUT1mCherry-miniSOG. |
| Transfected construct (Homo sapiens) | AAV9::mCerulean3-EndophilinA1SH3 | This paper | available upon request to Dr. Etienne Herzog | Figure 5 and related results part. Lentiviral vector expressing mCerulean3-EndophilinA1SH3. |
| Transfected construct (Homo sapiens) | AAV9::mCerulean3-EndophilinA1SH3E329K, S336K | This paper | available upon request to Dr. Etienne Herzog | Figure 5 and related results part. Lentiviral vector expressing mCerulean3-EndophilinA1SH3E329K, S336K. |
| Transfected construct (Homo sapiens) | AAV9::mCerulean3-IntersectinSH3B | This paper | available upon request to Dr. Etienne Herzog | Figure 5 and related results part. Lentiviral vector expressing mCerulean3-IntersectinSH3B. |
| Antibody | GFP, Mouse, monoclonal | Roche | Cat. 11814460001 RRID:AB_390913 | 1:1000 |
| Antibody | VIAAT, Guinea pig, polyclonal | SYSY | Cat. 131004 RRID:AB_887873 | 1:1000 |
| Antibody | VGLUT2, Guinea pig, polyclonal | Millipore | Cat. AB2251 RRID:AB_1587626 | 1:2000 |
| Antibody | VGLUT1, guinea pig, polyclonal | Merck | Cat. AB5905 RRID:AB_2301751 | 1:5000 |
| Antibody | EndophilinA1, rabbit, polyclonal | PMID: 16606361 | available upon request to Dr. Etienne Herzog | 1:500 |
| Peptide, recombinant protein | FastAP Thermosensitive Alkaline Phosphatase | Thermo Scientific | Cat. EF0651 | |
| Peptide, recombinant protein | Haltphosphatase inhibitor cocktail | Thermo Scientific | Cat. 78420 | |
| Chemical compound, drug | Phos-tag Acrylamid | Wako | Cat. AAL-107 | |
| Software, algorithm | FRAP Analysis Plugin | This paper | The plugin is available at: https://github.com/fabricecordelieres/IJ-Macro_FRAP-MM | |
| Software, algorithm | KymoToolbox Plugin | PMID: 23374344 | The plugin is available at: https://github.com/fabricecordelieres/IJ-Plugin_KymoToolBox |
Additional files
-
Supplementary file 1
Supplementary tables collating statistical analysis.
- https://doi.org/10.7554/eLife.50401.032
-
Supplementary file 2
Seal test recording of every cell in the electrophysiology analysis.
- https://doi.org/10.7554/eLife.50401.033
-
Transparent reporting form
- https://doi.org/10.7554/eLife.50401.034
Download links
A two-part list of links to download the article, or parts of the article, in various formats.
Downloads (link to download the article as PDF)
Open citations (links to open the citations from this article in various online reference manager services)
Cite this article (links to download the citations from this article in formats compatible with various reference manager tools)
A proline-rich motif on VGLUT1 reduces synaptic vesicle super-pool and spontaneous release frequency
eLife 8:e50401.
https://doi.org/10.7554/eLife.50401


