Drosophila macrophages switch to aerobic glycolysis to mount effective antibacterial defense
- University of South Bohemia, Czech Republic
- Indiana University, United States
- Biology Centre CAS, Czech Republic
Figures
Figure 1
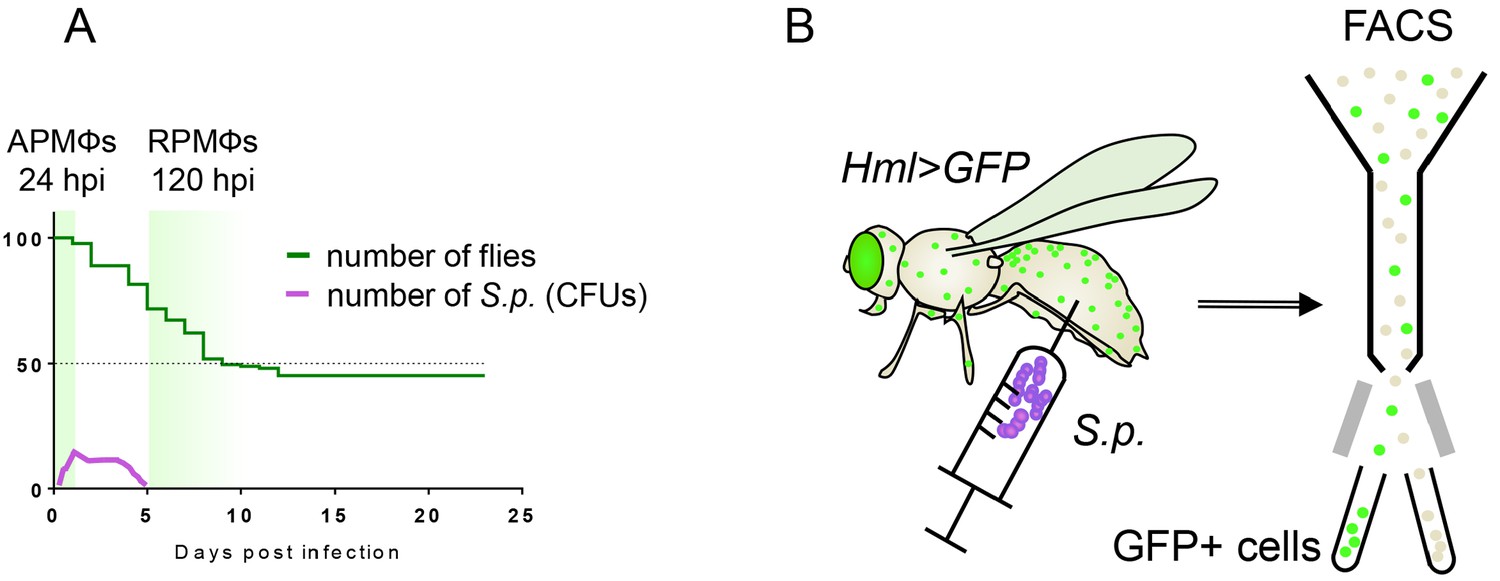
Graphical representation of the experimental approach.
(A) The natural progress of streptococcal infection, with highlighted sampling times during the acute and resolution phases of infection. The Y axis indicates the percentage of surviving adults. (B) The approach used to isolate hemocytes, which are subsequently assayed for gene expression and enzymatic activities. Macrophages sorted from flies at the respective time points post-infection represent acute-phase macrophages (APMФs; 24 hpi) and resolution-phase macrophages (RPMФs; 120 hpi). Control flies were analyzed at the same time points after receiving injection of phosphate-buffered saline (PBS). hpi, hours post-infection; FACS, fluorescence-activated cell sorting; S.p., Streptococcus pneumoniae.
Figure 2 with 1 supplement

Streptococcal infection enhances glycolysis in acute-phase macrophages.
(A–B) Fluorescent images of the dorsal view of the abdomens of infected and control (both Hml >GFP) flies at 24 and 120 hpi, showing NBDG the distribution among the tissues (A) and at a higher magnification (B). Images represent a minimum of ten observations of a similar pattern. (C) Scheme of glycolysis and the TCA cycle, highlighting significant changes in the quantified expression of the indicated genes at 24 and 120 hpi. The expression levels of the mRNA were measured relative to that of the ribosomal protein 49 (rp49), and the statistical significance (p<0.05) was tested using ANOVA (for data see Figure 2—figure supplement 1). Upregulated genes are shown in red, downregulated genes in green; gray indicates no statistically significant difference. (D–F) Enzymatic activities of phosphoglucose isomerase (Pgi) (D) and lactate dehydrogenase (Ldh) (E), as well as the level of NADH (F), at 24 and 120 hpi measured in the homogenate of hemocytes isolated from infected and control flies. The levels of enzymatic activity and NADH concentration were normalized per ten thousand cells per sample. (G) The concentration of circulating lactate measured in the hemolymph of infected and control flies at 24 and 120 hpi. In all plots (D–G), individual dots represent biological replicates. Values are mean ± SD, asterisks mark statistically significant differences (*p<0.05; **p<0.01; ***p<0.001).
-
Figure 2—source data 1
Metabolic characterization of macrophages post-infection.
- https://doi.org/10.7554/eLife.50414.007
Figure 2—figure supplement 1
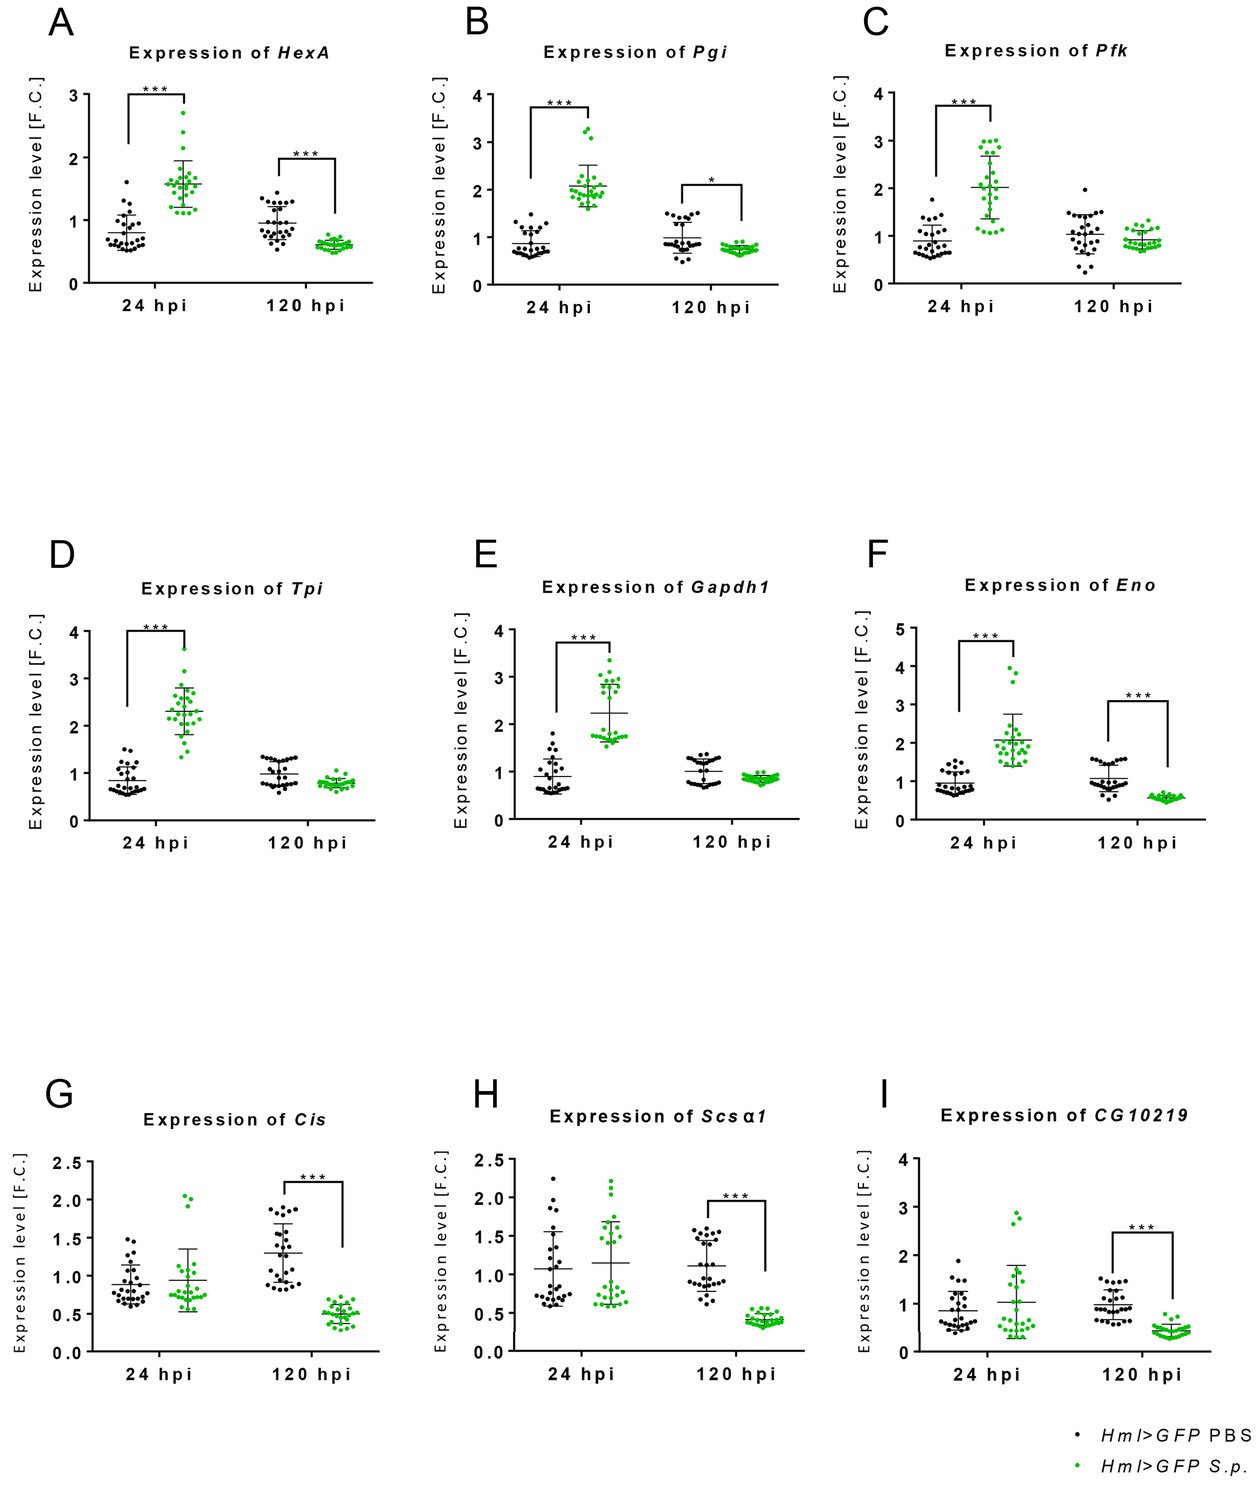
Gene expression of glycolytic enzymes is increased in acute-phase macrophages.
Gene expression of glycolytic (HexA (A), Pgi (B), Pfk (C), Tpi (D), Gapdh1 (E), Eno (F)) and TCA (Cis (G), Scsα1 (H), CG10219 (I)) genes in the hemocytes of infected and control flies (both Hml >GFP) at 24 and 120 hpi. The mRNA expression levels, normalized against rp49, are given as fold change (F.C.) relative to the expression of noninfected controls. Individual dots represent biological replicates. Values are mean ± SD, asterisks mark statistically significant differences (*p<0.05; **p<0.01; ***p<0.001).
-
Figure 2—figure supplement 1—source data 1
Expression of metabolic genes in macrophages post-infection.
- https://doi.org/10.7554/eLife.50414.006
Figure 3
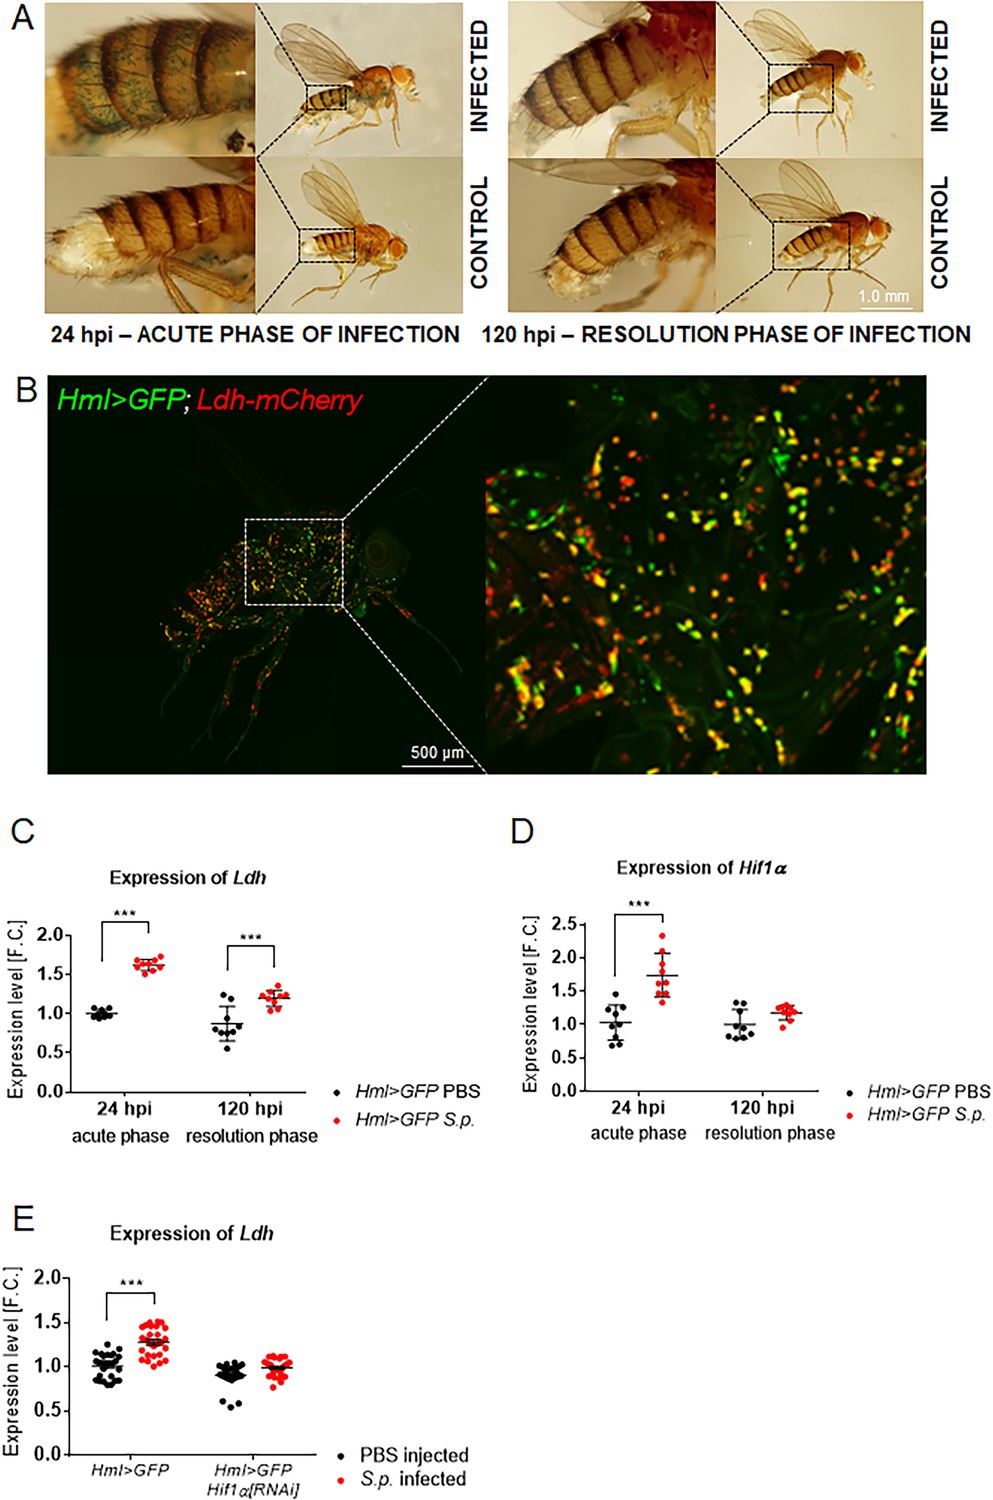
Macrophage-specific activities of Hif1α and Ldh increase upon infection.
(A) X-gal staining of infected and control flies bearing the HRE-LacZ reporter construct. Images represent a minimum of ten observations of a similar pattern. (B) An uninfected Hml >GFP, Ldh-mCherry adult fly (24 hpi) shows localization of the Ldh reporter activity (red) in many of the immune cells (green). The image is a Z-stack at maximal projection of 25 confocal slices. (C, D) Expression of Ldh (C) and Hif1α (D) mRNAs in hemocytes isolated from infected and control flies (both Hml >GFP; 24 and 120 hpi). (E) Expression of Ldh mRNA in hemocytes of infected and control Hml >GFP flies with and without a hemocyte-specific knockdown of Hif1α at 24 hpi. In all plots (C–E), expression levels, normalized against rp49, are given as fold change (F.C.) relative to levels in PBS-injected Hml >GFP controls (24 hpi), which were arbitrarily set to 1. Individual dots represent biological replicates. Values are mean ± SD, asterisks mark statistically significant differences (*p<0.05; **p<0.01; ***p<0.001).
-
Figure 3—source data 1
Expression pattern of Hif1α and Ldh genes.
- https://doi.org/10.7554/eLife.50414.009
Figure 4 with 1 supplement
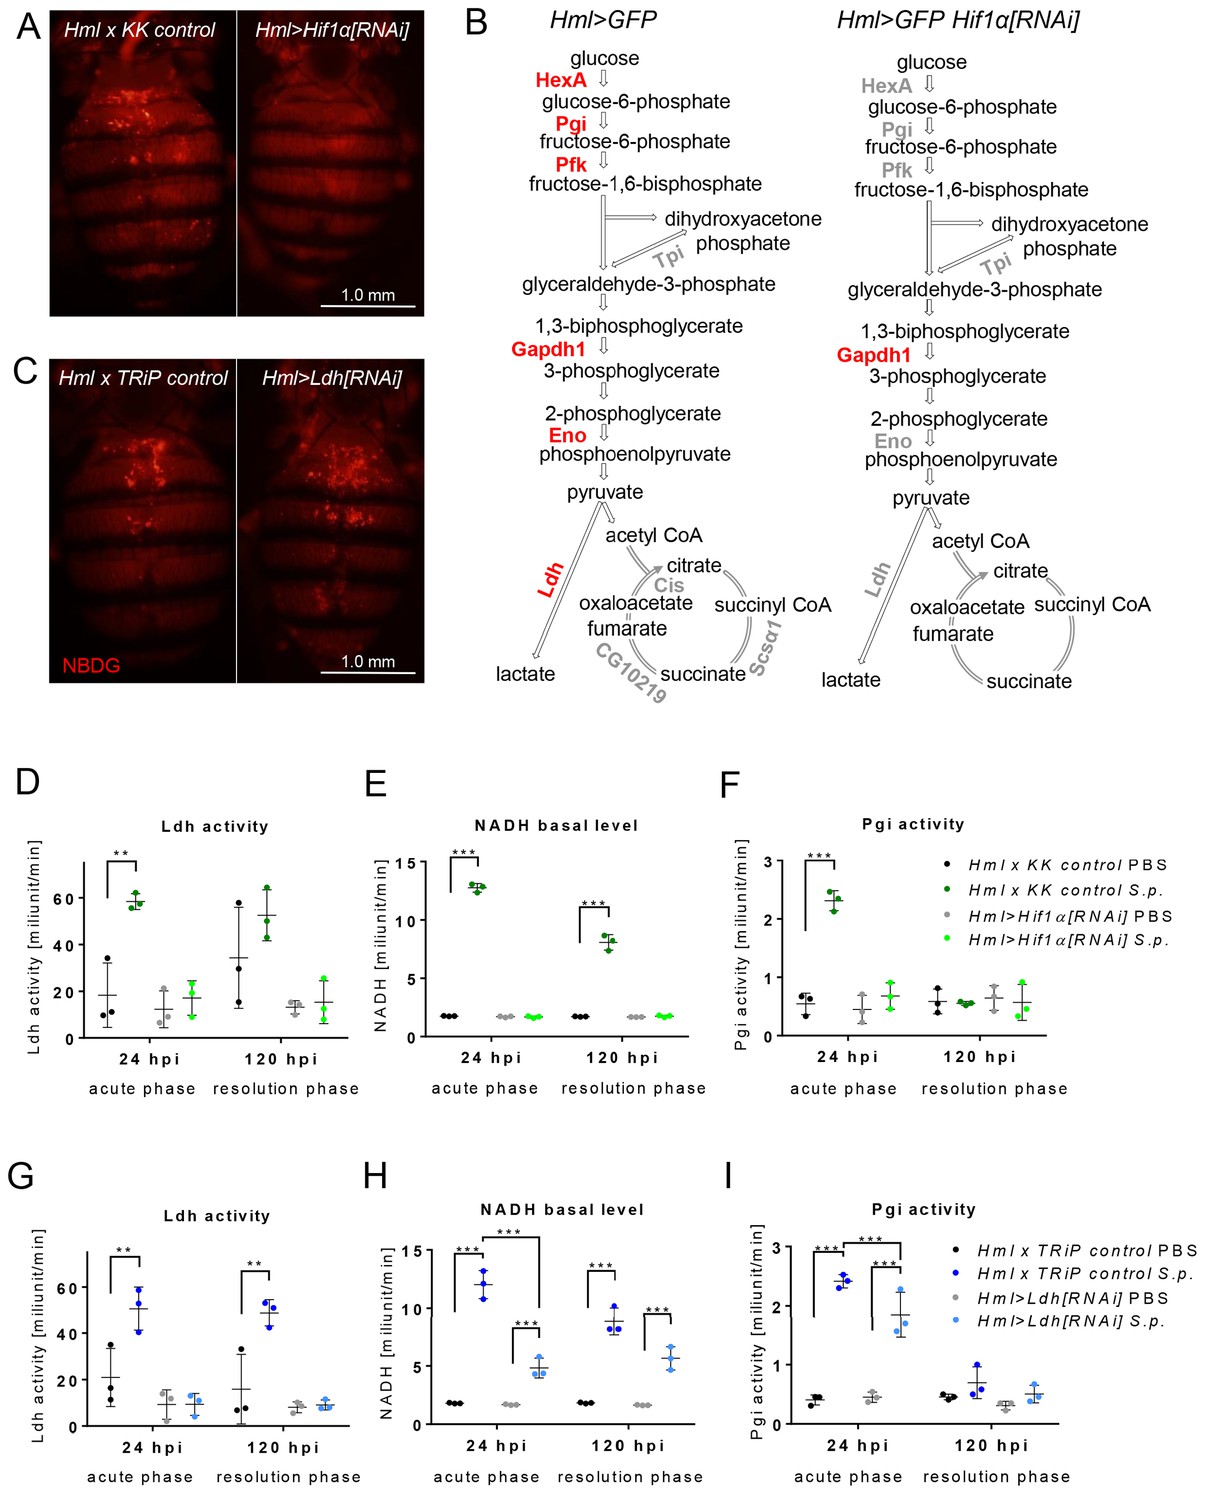
Effects of Hif1α and Ldh hemocyte-specific knockdown on macrophage metabolism.
(A) Dorsal view of the abdomens of S.p.-infected flies (24 hpi) showing the distribution of the fluorescent NBDG probe. Controls (left) are compared to flies subjected to hemocyte-specific knockdown of Hif1α. Images represent a minimum of ten observations of a similar pattern. (B) Schematic representation of the expression of genes encoding metabolic enzymes in the hemocytes of infected control flies (left) and of flies with Hif1α hemocyte-specific knockdown (right) at 24 hpi. The expression levels of the mRNAs were measured relative to that of rp49, and the statistical significance (p<0.05) was tested using ANOVA (for data see Figure 4—figure supplement 1). Upregulated genes are shown in red; gray indicates no statistically significant difference. (C) Dorsal view of the abdomens of S.p.-infected flies (24 hpi) showing the distribution of the fluorescent NBDG probe. Controls (left) are compared to flies subjected to hemocyte-specific knockdown of Ldh. Images represent a minimum of ten observations of a similar pattern. (D–F) Enzymatic activity of Ldh (D), level of NADH (E), and enzymatic activity of Pgi (F) at 24 and 120 hpi measured in lysates of hemocytes isolated from infected and non-infected control flies and from flies with Hif1α hemocyte-specific knockdown. (G–I) Enzymatic activity of Ldh (G), level of NADH (H), and enzymatic activity of Pgi (I) at 24 and 120 hpi measured in lysates of hemocytes isolated from infected and non-infected control flies and from flies with Ldh hemocyte-specific knockdown. In all plots (D–I), the enzyme activities and NADH concentrations were normalized per ten thousand cells per sample. Individual dots represent biological replicates. Values are mean ± SD, asterisks mark statistically significant differences (*p<0.05; **p<0.01; ***p<0.001).
-
Figure 4—source data 1
Effect of macrophage-specific Hif1α knockdown on metabolic features of macrophages.
- https://doi.org/10.7554/eLife.50414.013
Figure 4—figure supplement 1
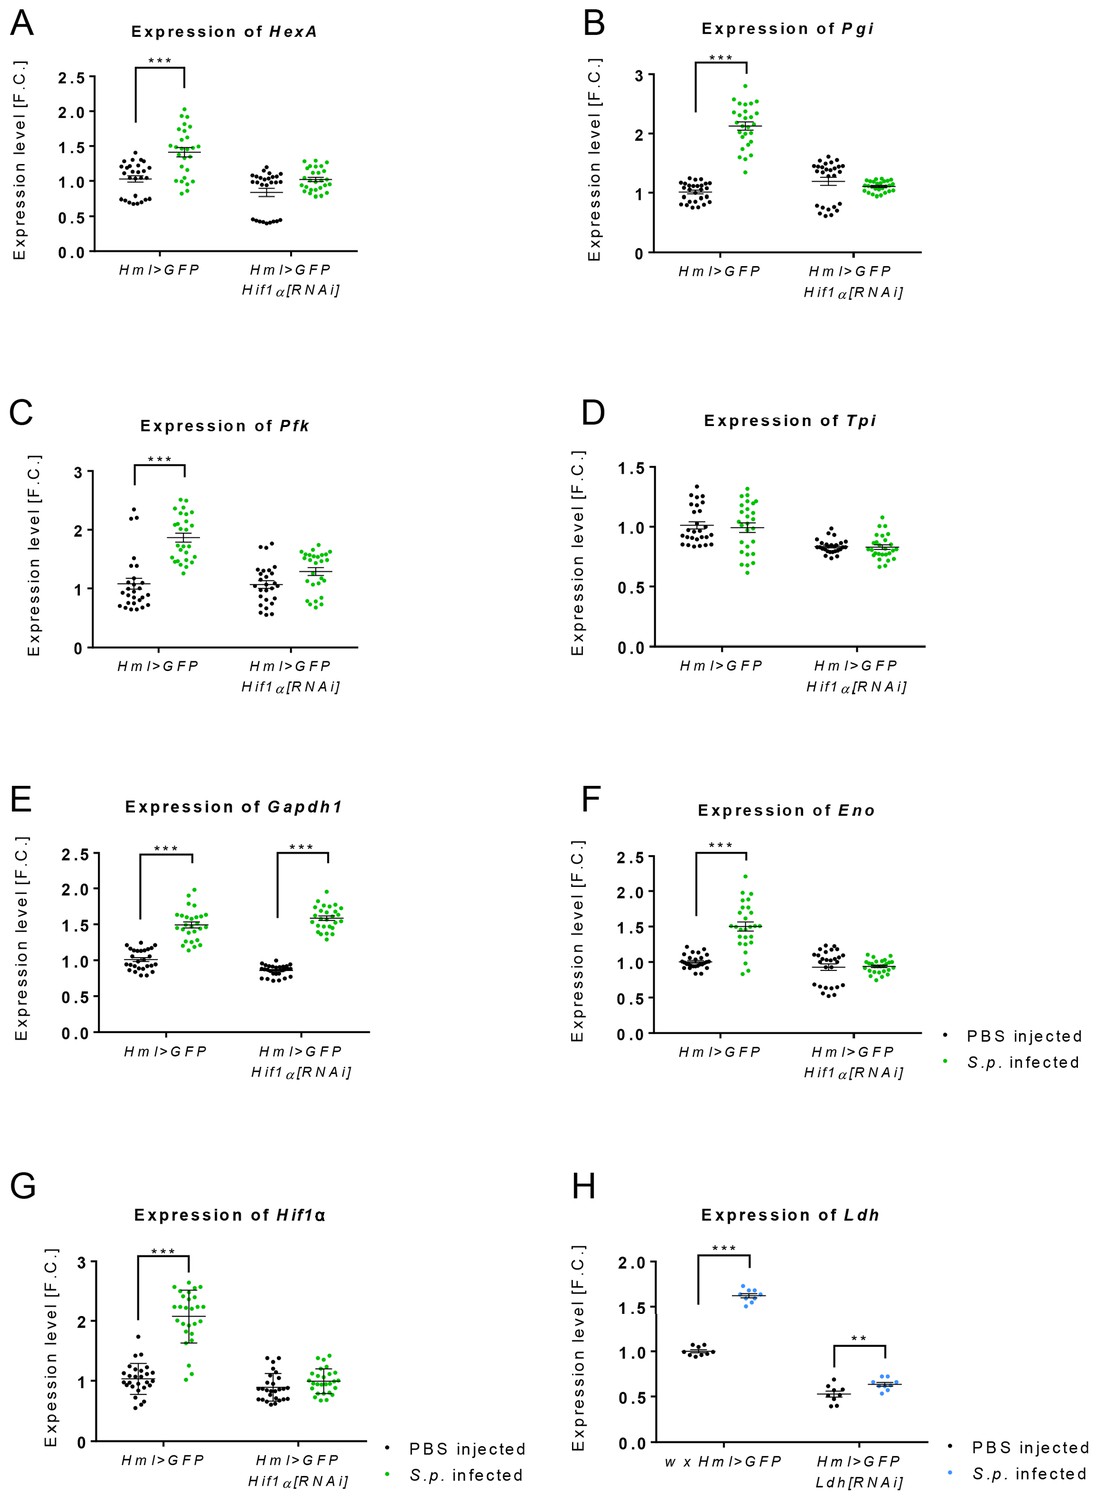
Expression of genes encoding glycolytic enzymes is not increased in acute-phase macrophages with Hif1α knock-down.
(A–F) Gene expression of glycolytic genes (HexA (A), Pgi (B), Pfk (C), Tpi (D), Gapdh1 (E) and Eno (F)) in the hemocytes of infected and control Hml >GFP flies and of flies with hemocyte-specific Hif1α knockdown at 24 hpi. (G, H) Gene expression of Hif1α (G) and Ldh (H) at 24 hpi in infected and control Hml >GFP flies and in flies with hemocyte-specific Hif1α knockdown representing the efficiency of RNAi treatment. The mRNA expression levels, normalized against rp49, are given as fold change (F.C.) relative to the expression in noninfected controls. Individual dots represent biological replicates. Values are mean ± SD, asterisks mark statistically significant differences (*p<0.05; **p<0.01; ***p<0.001).
-
Figure 4—figure supplement 1—source data 1
Effect of macrophage-specific Hif1α knockdown on expression of metabolic genes.
- https://doi.org/10.7554/eLife.50414.012
Figure 5
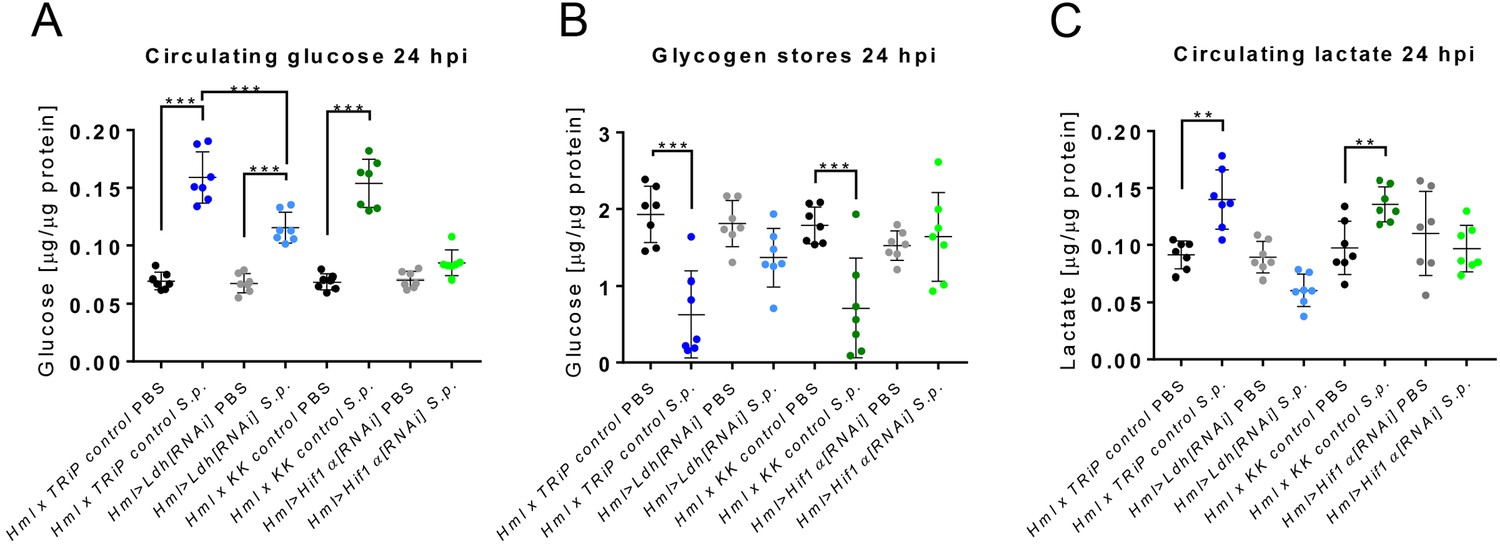
Systemic effects of Hif1α and Ldh hemocyte-specific knockdown.
(A–C) The concentration of circulating glucose (A), glycogen stores (B) and circulating lactate (C) in infected and non-infected flies with Hif1α or Ldh hemocyte-specific knockdown and their respective controls at 24 hpi. The concentrations of metabolites were normalized to the amount of proteins in each sample. Individual dots in the plot represent biological replicates. Values are mean ± SD, asterisks mark statistically significant differences (*p<0.05; **p<0.01; ***p<0.001).
-
Figure 5—source data 1
Effect of macrophage-specific Hif1α and Ldh knockdown on systemic carbohydrate metabolism.
- https://doi.org/10.7554/eLife.50414.015
Figure 6
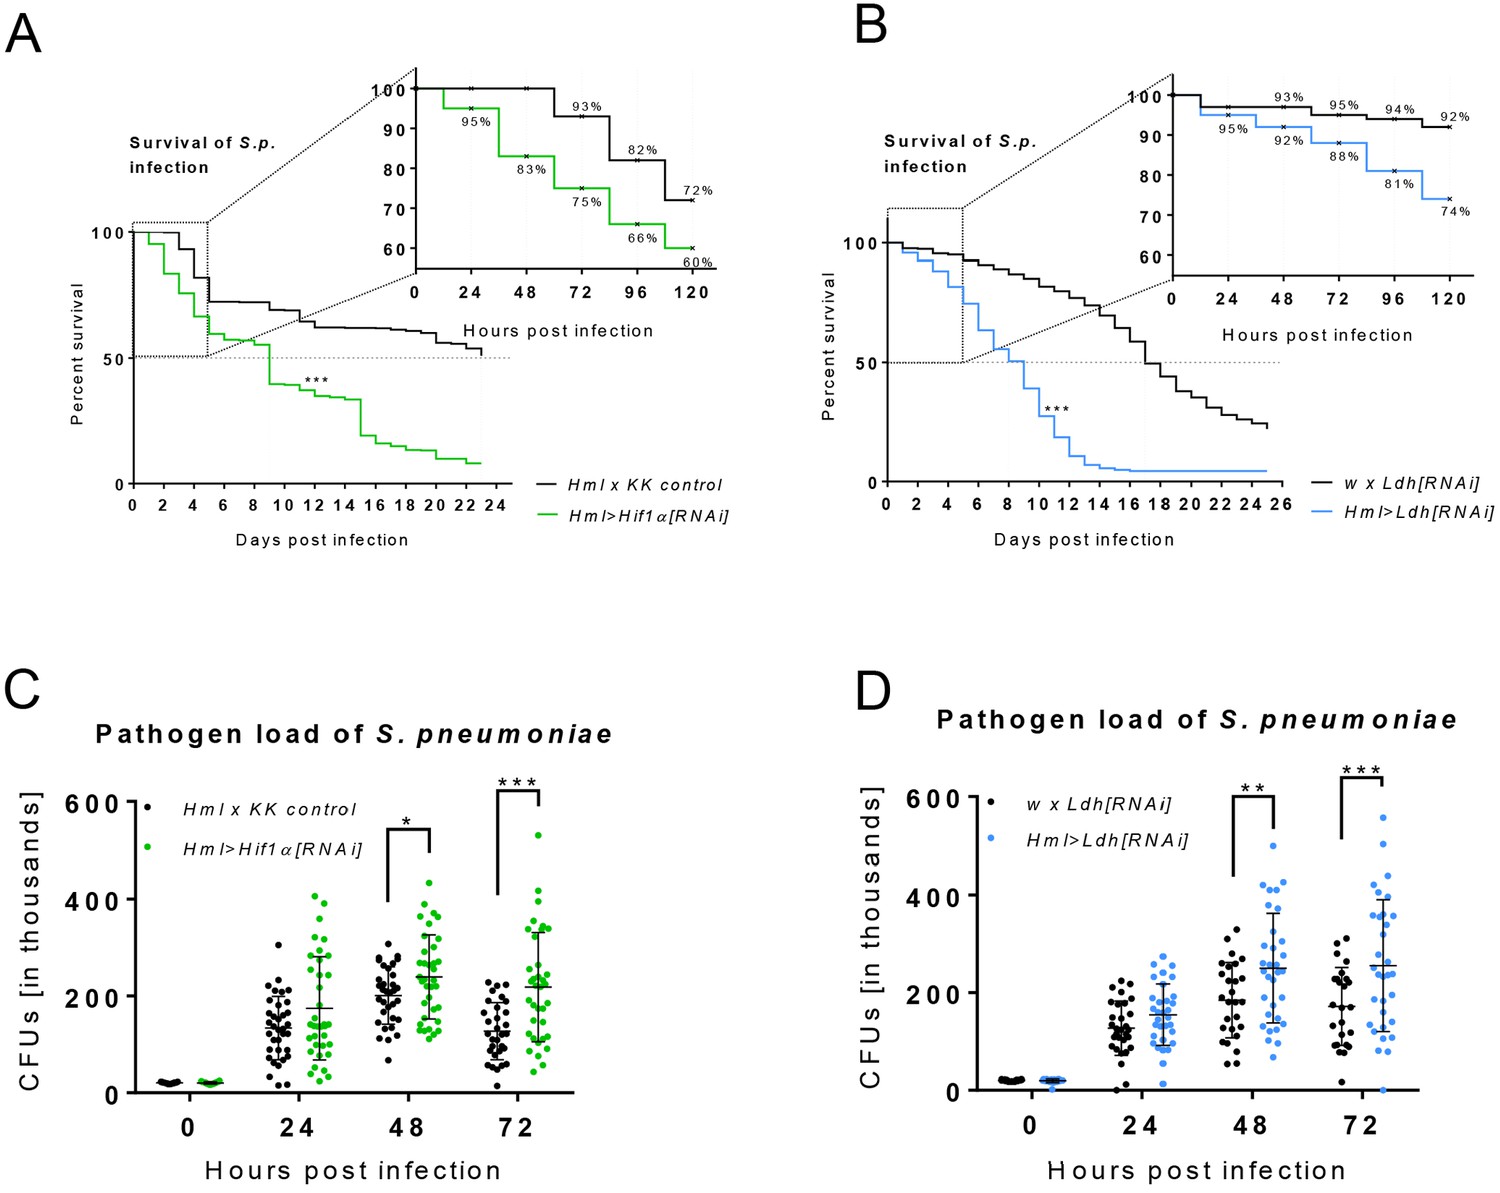
Effects of Hif1α and Ldh hemocyte-specific knockdown on resistance to infection.
(A–B) The survival rate of infected flies of the control genotype and of flies with hemocyte-specific Hif1α (A) and Ldh (B) knockdown. Vertical dotted lines denote medium time to death for each genotype; survival rate during the first 120 hr is shown in detail. Three independent experiments were performed and combined into one survival curve. The average number of individuals per replicate was more than 500 for each genotype. (C, D) Colony forming units (CFUs) obtained from infected flies of control genotype and from flies with hemocyte-specific Hif1α (C) and Ldh (D) knockdown at 0, 24, 48, and 72 hpi. Individual dots in the plot represent the number of bacteria raised from one individual. The data show results merged from three independent biological replicates.
-
Figure 6—source data 1
Effect of macrophage-specific Hif1α and Ldh knockdown on the resistance to bacterial infection.
- https://doi.org/10.7554/eLife.50414.017
Tables
Key resources table
| Reagent type (species) or resource | Designation | Source reference | Identifier | Additional information |
|---|---|---|---|---|
| Strain, strain background (Streptococcus pneumoniae) | EJ1 strain | Provided by David Schneider | Dilution 20,000 units | |
| Chemical compound, drug | TRIzol Reagent | Invitrogen | Cat# 15-596-018 | |
| Chemical compound, drug | Superscript III Reverse Transcriptase | Invitrogen | Cat# 18080044 | |
| Chemical compound, drug | 2x SYBR Master Mix | Top-Bio | Cat# T607 | |
| Chemical compound, drug | 2-NBDG | Thermo Fisher Scientific | Cat# N13195 | |
| Chemical compound, drug | X-gal | Sigma | Cat# B4252 | |
| Commercial assay, kit | Glucose (GO) Assay Kit | Sigma | Cat# GAGO20-1KT | |
| Commercial assay, kit | Bicinchoninic Acid Assay Kit | Sigma | Cat# BCA1 | |
| Commercial assay, kit | Lactate Assay Kit | Sigma | Cat# MAK064 | |
| Commercial assay, kit | Lactate Dehydrogenase Activity Assay Kit | Sigma | Cat# MAK066 | |
| Commercial assay, kit | Phosphoglucose Isomerase Colorimetric Assay Kit | Sigma | Cat# MAK103 | |
| Genetic reagent (Drosophila melanogaster) | HmlG4G80: w*; HmlΔ-Gal4*; P{tubPGal80ts}* | Cross made in our laboratory by Tomas Dolezal | ||
| Genetic reagent (D. melanogaster) | Hml > GFP: w; HmlΔ-Gal4 UAS-eGFP | Provided by Bruno Lemaitre | ||
| Genetic reagent (D. melanogaster) | Hif1α[RNAi]: P{KK110834}VIE-260B | Vienna Drosophila Resource Center | VDRC: v106504 | FBst0478328 |
| Genetic reagent (D. melanogaster) | TRiP control: y(1) v(1); P{y[+t7.7]=CaryP}attP2 | Bloomington Drosophila Stock Center | BDSC: 36303 | FBst0036303 |
| Genetic reagent (D. melanogaster) | KK control: y, w[1118];P{attP,y[+],w[3`]} | Bloomington Drosophila Stock Center | BDSC: 60100 | FBst0060100 |
| Genetic reagent (D. melanogaster) | Ldh[RNAi]: y(1) v(1); P{y[+t7.7] v[+t1.8]=TRiP.HMS00039}attP2 | Bloomington Drosophila Stock Center | BDSC: 33640 | FBst0033640 |
| Genetic reagent (D. melanogaster) | HRE-LacZ: HRE-HRE-CRE-LacZ | Provided by Pablo Wappner (Lavista-Llanos et al., 2002) | ||
| Genetic reagent (D. melanogaster) | Ldh-mCherry | Provided by Jason Tennessen | ||
| Genetic reagent (D. melanogaster) | w: w1118 | Genetic background based on CantonS | ||
| Sequence-based reagent | Cis forward: 5′TTCGATTGACTCCAGCCTGG3′ | KRD | CG14740 | FBgn0037988 |
| Sequence- based reagent | Cis reverse: 5′AGCCGGGAACCACCTGTCC3′ | KRD | CG14740 | FBgn0037988 |
| Sequence-based reagent | Ldh forward: 5′CAGAGAAGTGGAACGAGCTG3′ | KRD | CG10160 | FBgn0001258 |
| Sequence- based reagent | Ldh reverse: 5′CATGTTCGCCCAAAACGGAG3′ | KRD | CG10160 | FBgn0001258 |
| Sequence-based reagent | Eno forward: 5′CAACATCCAGTCCAACAAGG3′ | KRD | CG17654 | FBgn0000579 |
| Sequence-based reagent | Eno reverse: 5′GTTCTTGAAGTCCAGATCGT3′ | KRD | CG17654 | FBgn0000579 |
| Sequence-based reagent | Gapdh1 forward: 5′TTG TGG ATC TTA CCG TCC GC3′ | KRD | CG12055 | FBgn0001091 |
| Sequence-based reagent | Gapdh1 reverse: 5′CTCGAACACAGACGAATGGG3′ | KRD | CG12055 | FBgn0001091 |
| Sequence-based reagent | HexA forward: 5′ATATCGGGCATGTATATGGG3′ | KRD | CG3001 | FBgn0001186 |
| Sequence-based reagent | HexA reverse: 5′CAATTTCGCTCACATACTTGG3′ | KRD | CG3001 | FBgn0001186 |
| Sequence-based reagent | Pfk forward: 5′AGCTCACATTTCCAAACATCG3′ | KRD | CG4001 | FBgn0003071 |
| Sequence-based reagent | Pfk reverse: 5′TTTGATCACCAGAATCACTGC3′ | KRD | CG4001 | FBgn0003071 |
| Sequence-based reagent | Pgi forward: 5′ACTGTCAATCTGTCTGTCCA3′ | KRD | CG8251 | FBgn0003074 |
| Sequence-based reagent | Pgi reverse: 5′GATAACAGGAGCATTCTTCTCG3′ | KRD | CG8251 | FBgn0003074 |
| Sequence-based reagent | Rp49 forward: 5′AAGCTGTCGCACAAATGGCG3′ | KRD | CG7939 | FBgn0002626 |
| Sequence-based reagent | Rp49 reverse: 5′GCACGTTGTGCACCAGGAAC3′ | KRD | CG7939 | FBgn0002626 |
| Sequence-based reagent | Hif1α forward: 5′CCAAAGGAGAAAAGAAGGAAC3′ | KRD | CG45051 | FBgn0266411 |
| Sequence-based reagent | Hif1α reverse: 5′GAATCTTGAGGAAAGCGATG3′ | KRD | CG45051 | FBgn0266411 |
| Sequence-based reagent | CG10219 forward: 5′GAGATCTCCGTGAGTGCGC3′ | KRD | CG10219 | FBgn0039112 |
| Sequence-based reagent | CG10219 reverse: 5′CTCCACGCCCCAATGGG3′ | KRD | CG10219 | FBgn0039112 |
| Sequence-based reagent | Scsα1 forward: 5′TCACAAGCGCGGCAAGATC3′ | KRD | CG1065 | FBgn0004888 |
| Sequence-based reagent | Scsα1 reverse: 5′TTGATGCCCGAATTGTACTCG3′ | KRD | CG1065 | FBgn0004888 |
| Sequence-based reagent | Tpi forward: 5′AGATCAAGGACTGGAAGAACG3′ | KRD | CG2171 | FBgn0086355 |
| Sequence-based reagent | Tpi reverse: 5′ACCTCCTTGGAGATGTTGTC3′ | KRD | CG2171 | FBgn0086355 |
| Software, algorithm | Graphpad Prism | https://www.graphpad.com/ | Graphpad Prism | RRID:SCR_002798 |
| Software, algorithm | Microsoft Excel | https://www.microsoft.com/ | Microsoft Excel | |
| Software, algorithm | Fiji | ImageJ - https://fiji.sc | ImageJ | RRID:SCR_002285 |
| Other | S3e Cell Sorter | BioRad -http://www.bio-rad.com/ | BioRad | |
| Other | Olympus FluoView 1000 | Olympus -https://www.olympus-global.com/ | Olympus | RRID:SCR_017015 RRID:SCR_014215 |
| Other | Olympus SZX12 | Olympus -https://www.olympus-global.com/ | Olympus | |
| Other | Olympus IX71 | Olympus - https://www.olympus-global.com/ | Olympus |
Additional files
-
Transparent reporting form
- https://doi.org/10.7554/eLife.50414.018
Download links
A two-part list of links to download the article, or parts of the article, in various formats.
Downloads (link to download the article as PDF)
Open citations (links to open the citations from this article in various online reference manager services)
Cite this article (links to download the citations from this article in formats compatible with various reference manager tools)
Drosophila macrophages switch to aerobic glycolysis to mount effective antibacterial defense
eLife 8:e50414.
https://doi.org/10.7554/eLife.50414


