Shifts in myeloarchitecture characterise adolescent development of cortical gradients
- McGill University, Canada
- University of Cambridge, United Kingdom
- National Institute of Mental Health, United States
- The Alan Turing Institute, United Kingdom
- Institut du Cerveau et de la Moelle épinière, UPMC UMRS 1127, Inserm U 1127, CNRS UMR 7225, France
Figures
Figure 1 with 2 supplements
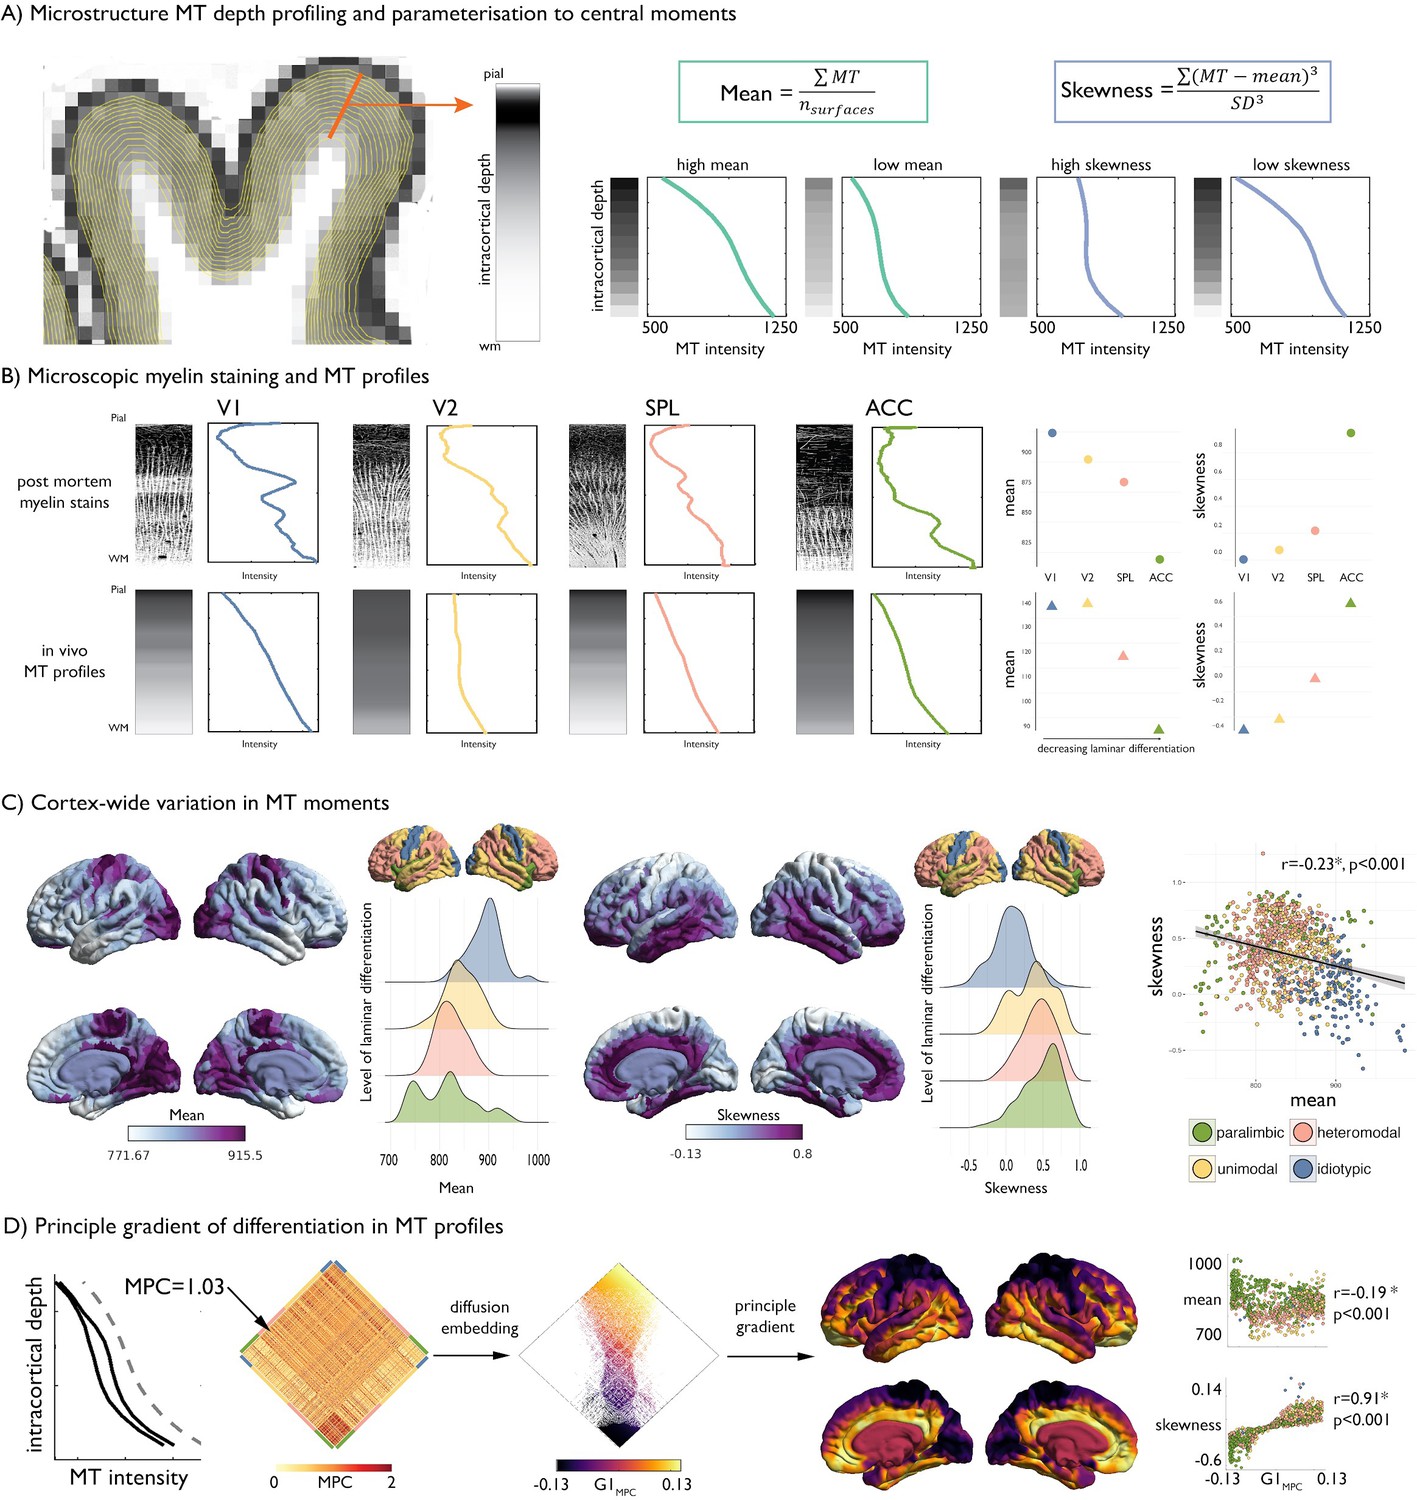
Intracortical MT depth profiling.
(A) Left. Equivolumetric surfaces overlaid on an MT image of a single subject, also showing an example vertex along which MT intensity is sampled (example MT profile in grey, with lighter tones represent higher MT intensity). Right. Schema of first and third moments. (B) Left. Examples of microscopic myelin-stained sections (inverted image shows myelin in lighter tones) (Vogt and Vogt, 1919; Vogt, 1911), with corresponding profiles and group-average MT profile from the same regions extracted in vivo. V1 = primary visual cortex. V2 = secondary visual area. SPL = superior parietal lobule. ACC = anterior cingulate cortex. Right. Dot-plots showing the moments for each exemplar profile. (C) Baseline group-average of first and third moment plotted on the cortical surface, and within levels of laminar differentiation (Mesulam, 2002; Paquola et al., 2019). The scatterplot shows the spatial overlap between first and third moment, coloured by level of laminar differentiation. Findings on the second and fourth moment are shown in Figure 1—figure supplement 1, and with an alternative cytoarchitectural taxonomy in Figure 1—figure supplement 2. (D) Microstructure profile covariance (MPC) was estimated between each pair of nodes based on the partial correlation of two nodes’ MT profiles (black), controlling for the cortex-wide mean intensity profile (grey dashed). Baseline MPC matrices were averaged across the group, and diffusion map embedding was employed to order regions according to the principal gradient of microstructural differentiation (G1MPC). Scatterplots show the relationship between node-wise loadings onto the principle gradient with MT moments.
Figure 1—figure supplement 1

Baseline properties of SD and kurtosis.
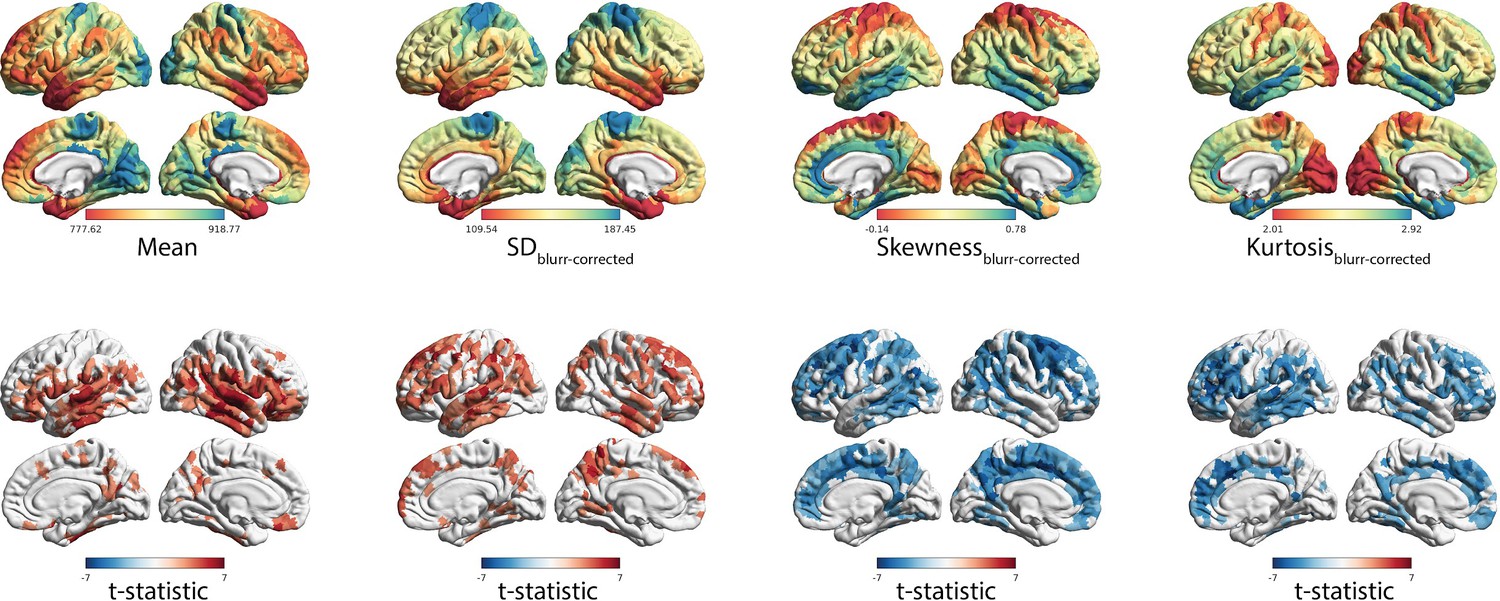
(A) Examples of hyper-stained myelin pictures (Nieuwenhuys and Broere, 2017; Vogt and Vogt, 1919; Vogt, 1911) with corresponding myelin profile and group-average MT profile from the same region. V1 = primary visual cortex. V2 = secondary visual area. SPL = superior parietal lobule. ACC = anterior cingulate cortex. Atlas of laminar differentiation projected on the cortical surface (Nieuwenhuys and Broere, 2017; Vogt, 1911). (B) Moment values across levels of laminar differentiation from the myelin pictures shown in (A). (C) Moment values from across levels of laminar differentiation from the MT profile shown in (A). (D) Group-average MT moment per node projected onto the cortical surface. SD captures a very similar pattern to the mean (spatial overlap: mean ~SD: r = 0.62, p<0.001), whereas kurtosis was correlated to skewness (r = 0.58, p<0.001). (E) Density plots depict the distribution of group-average MT moments for each node within levels of laminar differentiation.
Figure 1—figure supplement 2

Replication with different classification of cytoarchitectural complexity (Von Economo and Koskinas, 2008).
(A) Distribution of values across each cortical class. (B) Z-scores of relative over or under-representation of parcels showing an age-related effect within each class. Classes showing a significant effect of age related changes are denoted by asterixis (***=p < 0.001, *=p < 0.05).
Figure 2 with 1 supplement
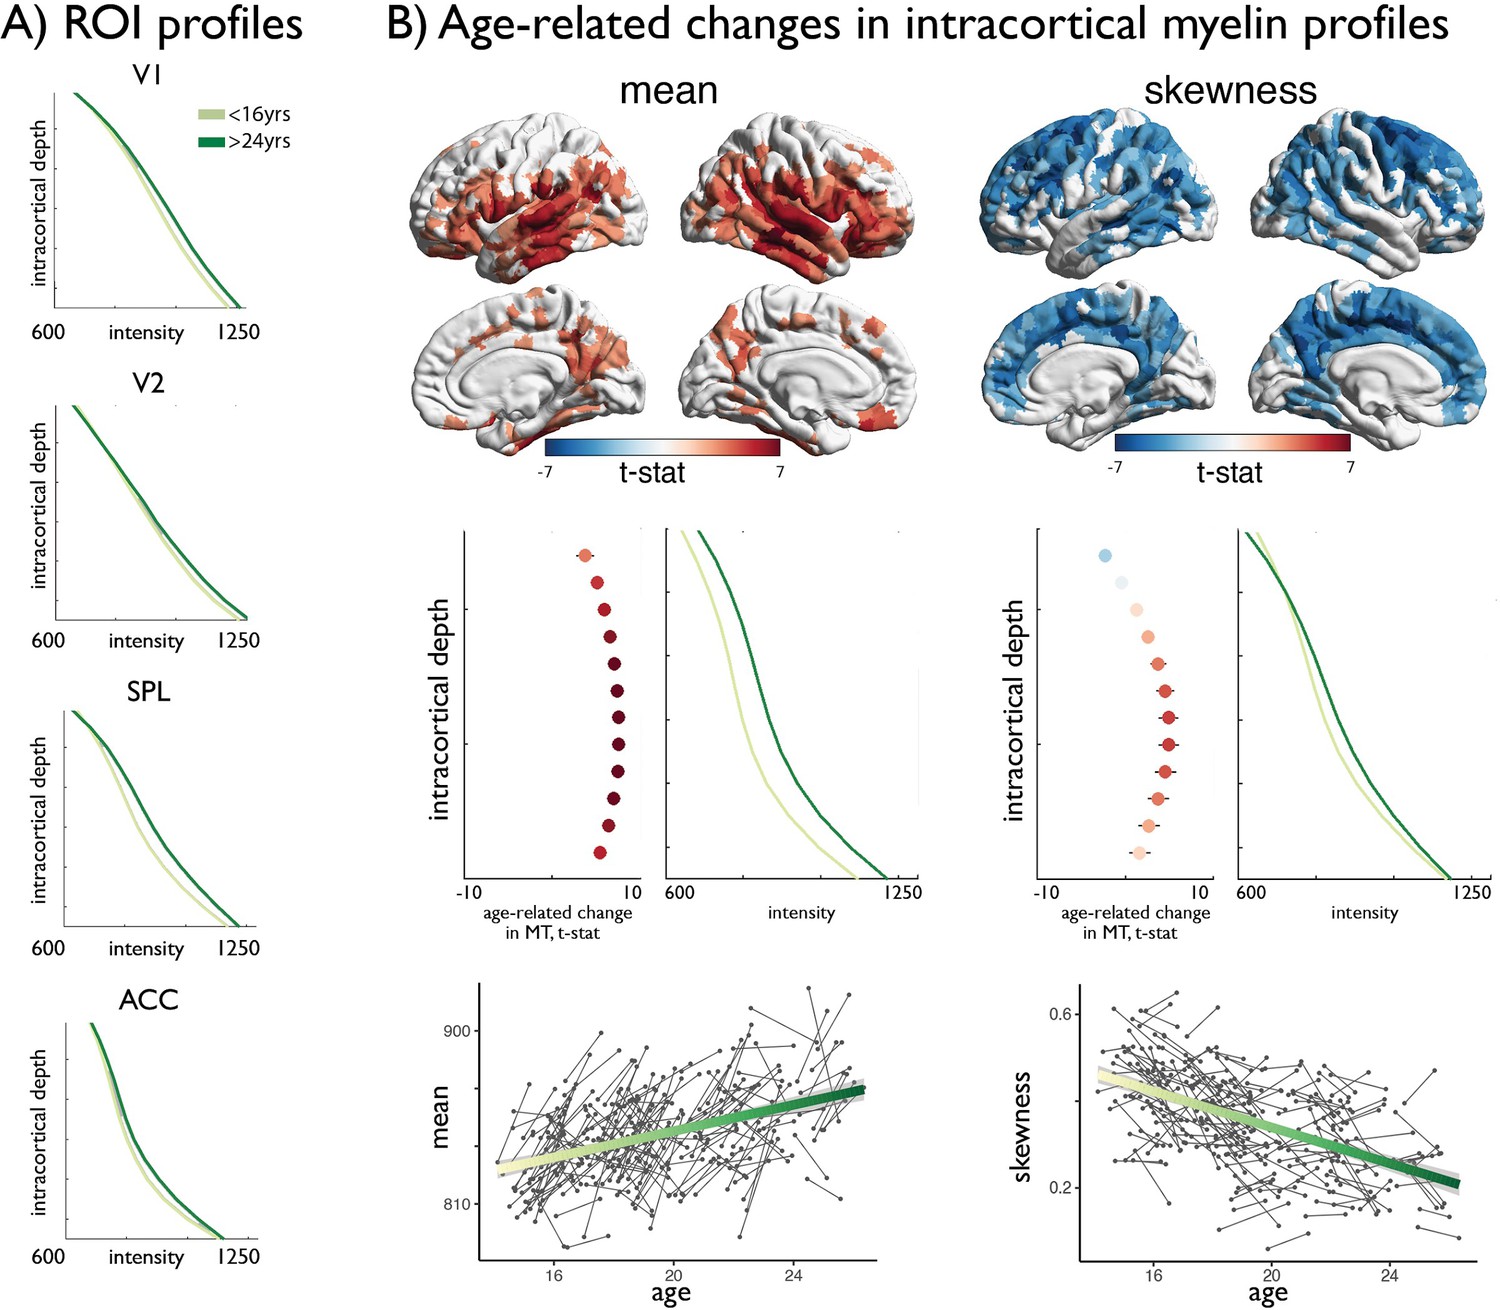
Age-related changes in MT moments.
(A) Shifts in MT profiles and moments from lowest to highest age strata shown for exemplar regions of laminar differentiation (Figure 1). (B) Upper. Age-related changes in MT moments (qFDR <0.00625). Middle. t-statistic (mean ± SD) of age-related changes in MT intensity at each intracortical surface across significant regions. Mean increases were balanced across surfaces, whereas decreases in skewness were driven by preferential intensity increases at mid-to-deeper surfaces. Lower. Individual changes across significant regions, with regression lines depicting age-related changes across the investigated range.
Figure 2—figure supplement 1
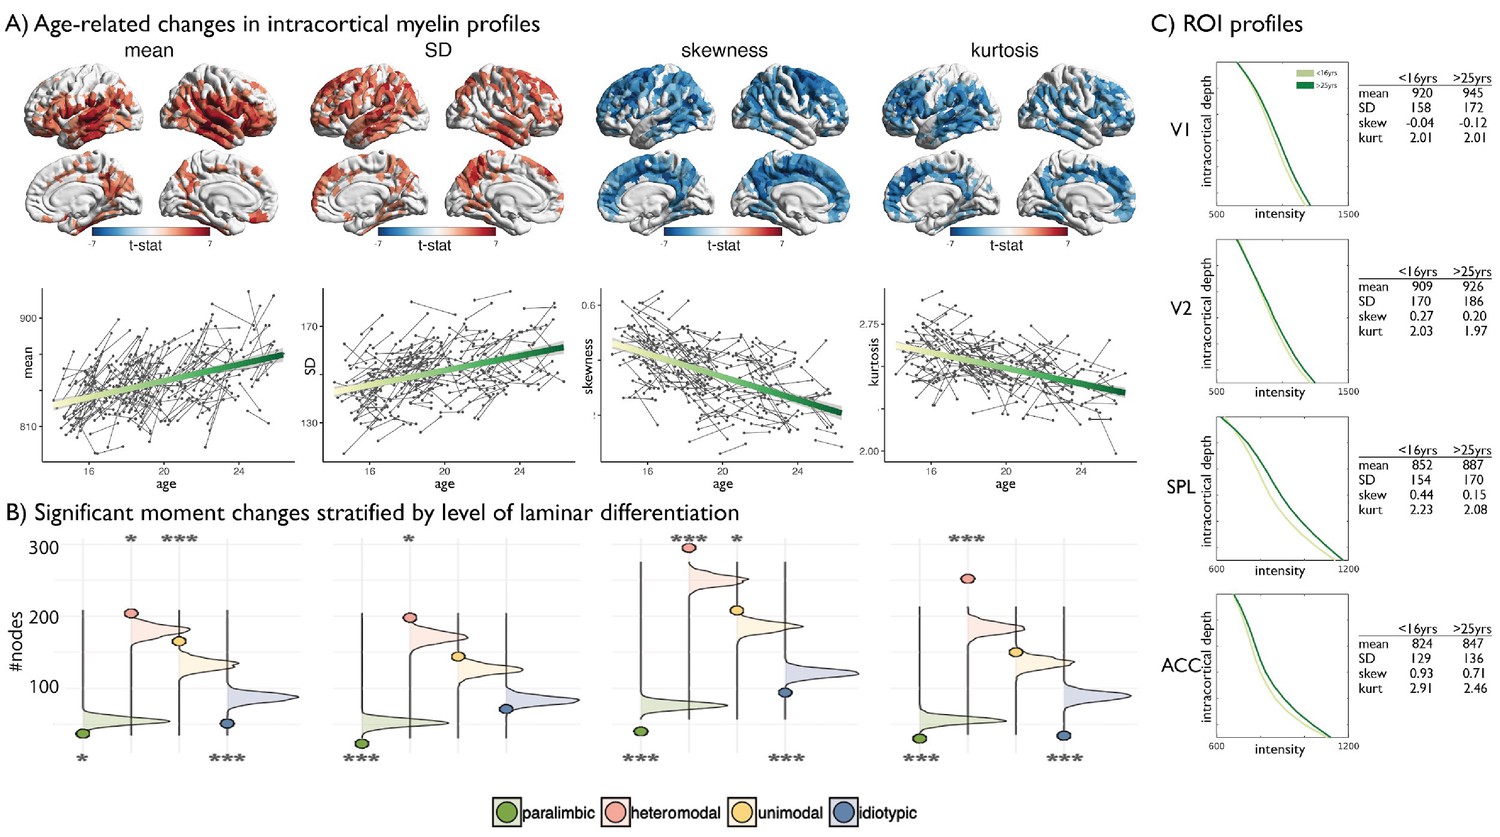
Age-related changes in SD and kurtosis.
(A) Upper t-statistics projected on the cortical surfaces depict significant age-related changes in MT moments. Lower Scatter plots depict individual changes in average moment value across significant regions, with regression lines depicting the age-related changes. SD showed a steady increase during adolescence and preferentially impacted heteromodal cortices (z = 3.42, p=0.012), while paralimbic cortex was under-represented (z = −5.60, p<0.001) as assessed using spin premutation and count tables of significant regions per class of laminar differentiation. Kurtosis showed a steady and robust decrease during adolescent development that preferentially affected heteromodal cortex (z = 8.80, p<0.001). (B) Bar plots show the z-scores of the number of regions passing FDR correction for each class relative to a null-distribution generated from spin permutations of the t-statistic map (Alexander-Bloch et al., 2018). Significance is indicated by asterixis and based on Bonferroni corrected p-values across all moments and classes (***=p < 0.001, *=p < 0.05). Positive significant z-scores indicate that the number of regions passing FDR for that class are significantly higher than expected by chance, negative significant z-scores indicate the number is significantly lower (tables provided below).
Figure 3 with 1 supplement

Gene decoding of age-related changes in skewness against the Allen Institute for Brain Sciences gene expression atlas.
Only genes negatively relating to age-related changes in skewness are shown as only these genes survived FDR < 0.05. No other moments had any significantly associated genes. Cell-type-specific expression, showing selective enrichment for oligodendrocytes, reinforcing the link between profile skewness and myelination. Hexagon rings denote significance at different pSI thresholds (from p<0.05 in the outer ring to 0.00001 in the centre). (B) Developmental cortical enrichment, showing enrichment specifically in adolescence and young adulthood.
Figure 3—figure supplement 1

Gene ontology analyses from baseline profiles of the four moments of the intensity distribution.
Results from this spatial overlap analysis show no clear or unique ontological profile for any of the genes and when p-values were corrected for FDR across the four moments and positive and negative gene-lists, none survived correction.
Figure 4 with 3 supplements
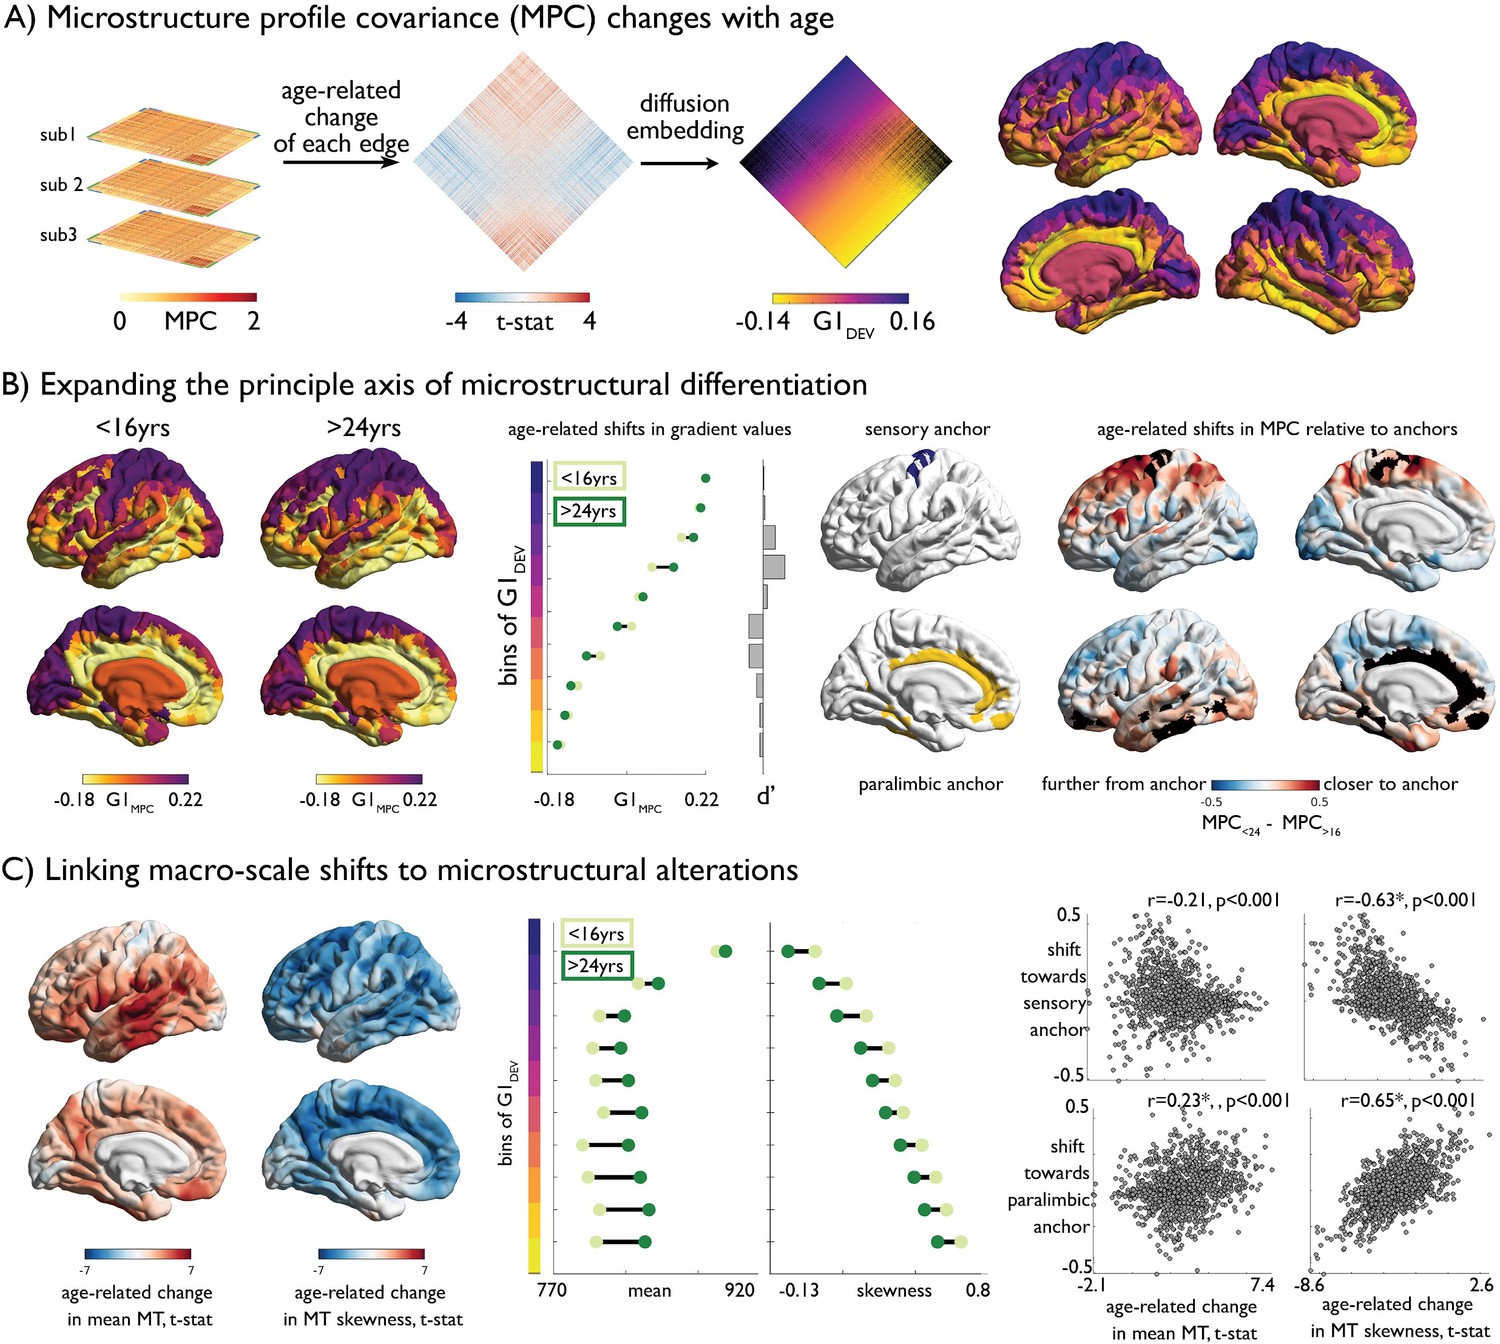
Age-related changes in microstructure profile covariance (MPC).
(A) Subject-specific MPC matrices (stacked) were used in mixed effect models to calculate age-related changes in microstructural similarity between each node pair, generating a t-statistic matrix (middle). Diffusion map embedding ordered this matrix along the principal axis (G1DEV) (right). Rows of the matrix were coloured according to G1DEV. Surface projection of G1DEV illustrates a transition from primary sensory (purple) through association (pink) to limbic cortices (yellow). (B) Left. Principal axis of microstructural differentiation within extreme age strata (G1MPC), show a sensory-fugal axis similar to the baseline and developmental analysis. Middle. Shifts in average G1MPC within ten discrete bins of G1DEV, and corresponding Cohen’s d effect size. Central regions of G1DEV, aligning with association cortices, expand from the centre of G1MPC, towards either sensory or paralimbic anchors. Right. Age-related shifts towards anchors visualised via age-strata difference in MPC. The average MPC to each anchor was calculated within each extreme age-strata then subtracted. Prefrontal and parietal areas increased in microstructural similarity with the sensory anchor (top), whereas temporal regions became more coupled with the paralimbic anchor. (C) Left. Age-related change in MT moments (unthresholded maps from Figure 2B). Middle. Age-related shifts in mean and skewness within each bin of the gradient. Right. Correlation betweeBn age-related change in MT moments (Figure 2B) and shifts to anchors (B right).
Figure 4—figure supplement 1
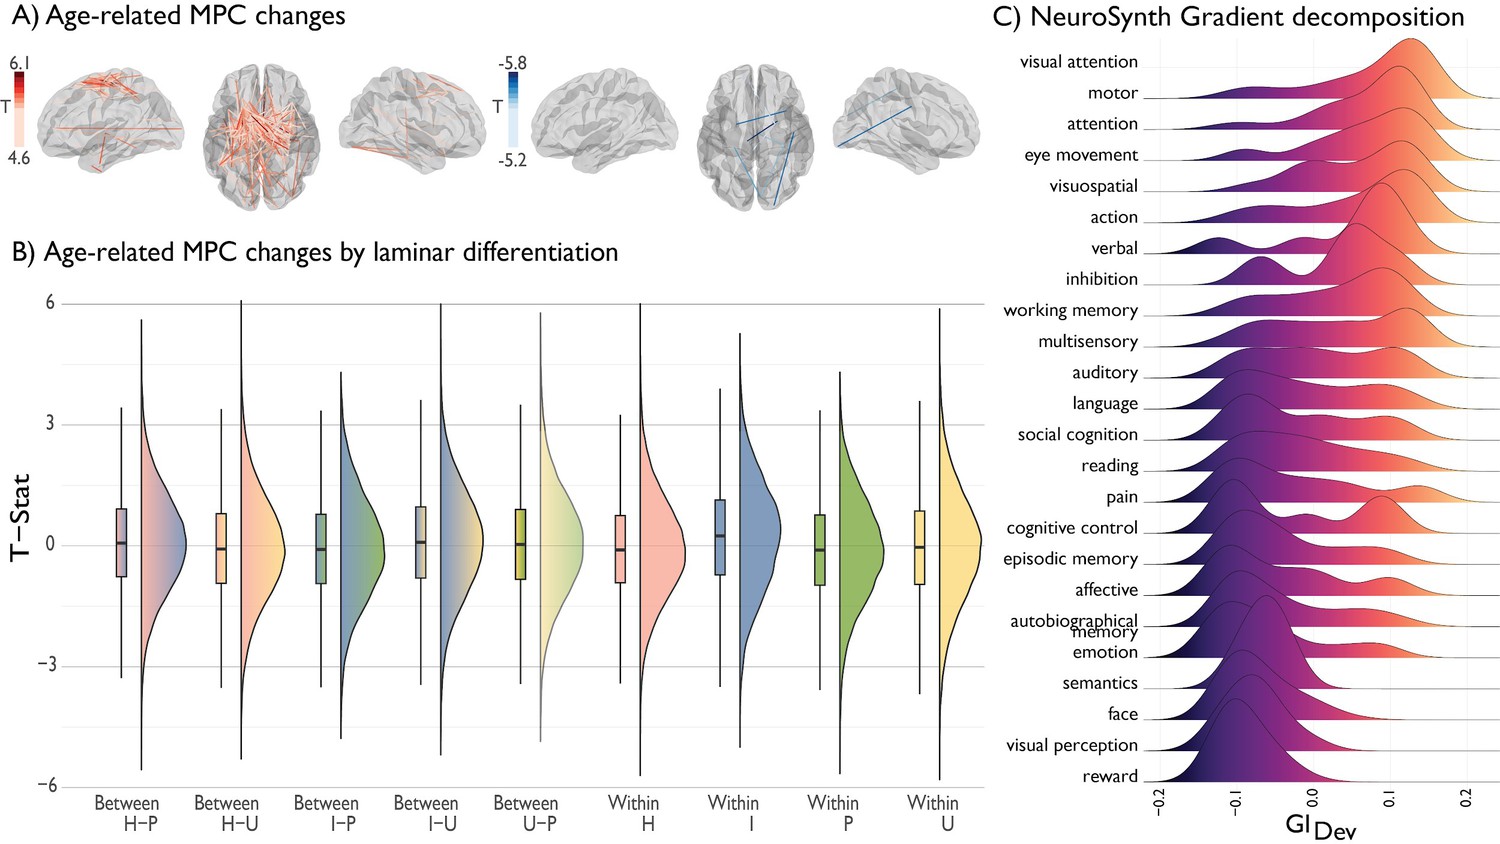
Deconstructing age-related changes in MPC.
(A) Age-related changes in MPC stratified by increases (red) and decreases (blue). (B) Edge-wise changes in MPC were stratified by level of laminar differentiation. Raincloud plots illustrate the range of t-statistic values within and between different classes. Lines depict the 25%, 50% and 75% quartiles. I = idiotypic. U = unimodal. H = heteromodal. p=paralimbic. (C) Ridgeplot depicting distribution of thresholded (z > 2) gradient values across NeuroSynth composite terms, ranked from high to low mean value.
Figure 4—figure supplement 2
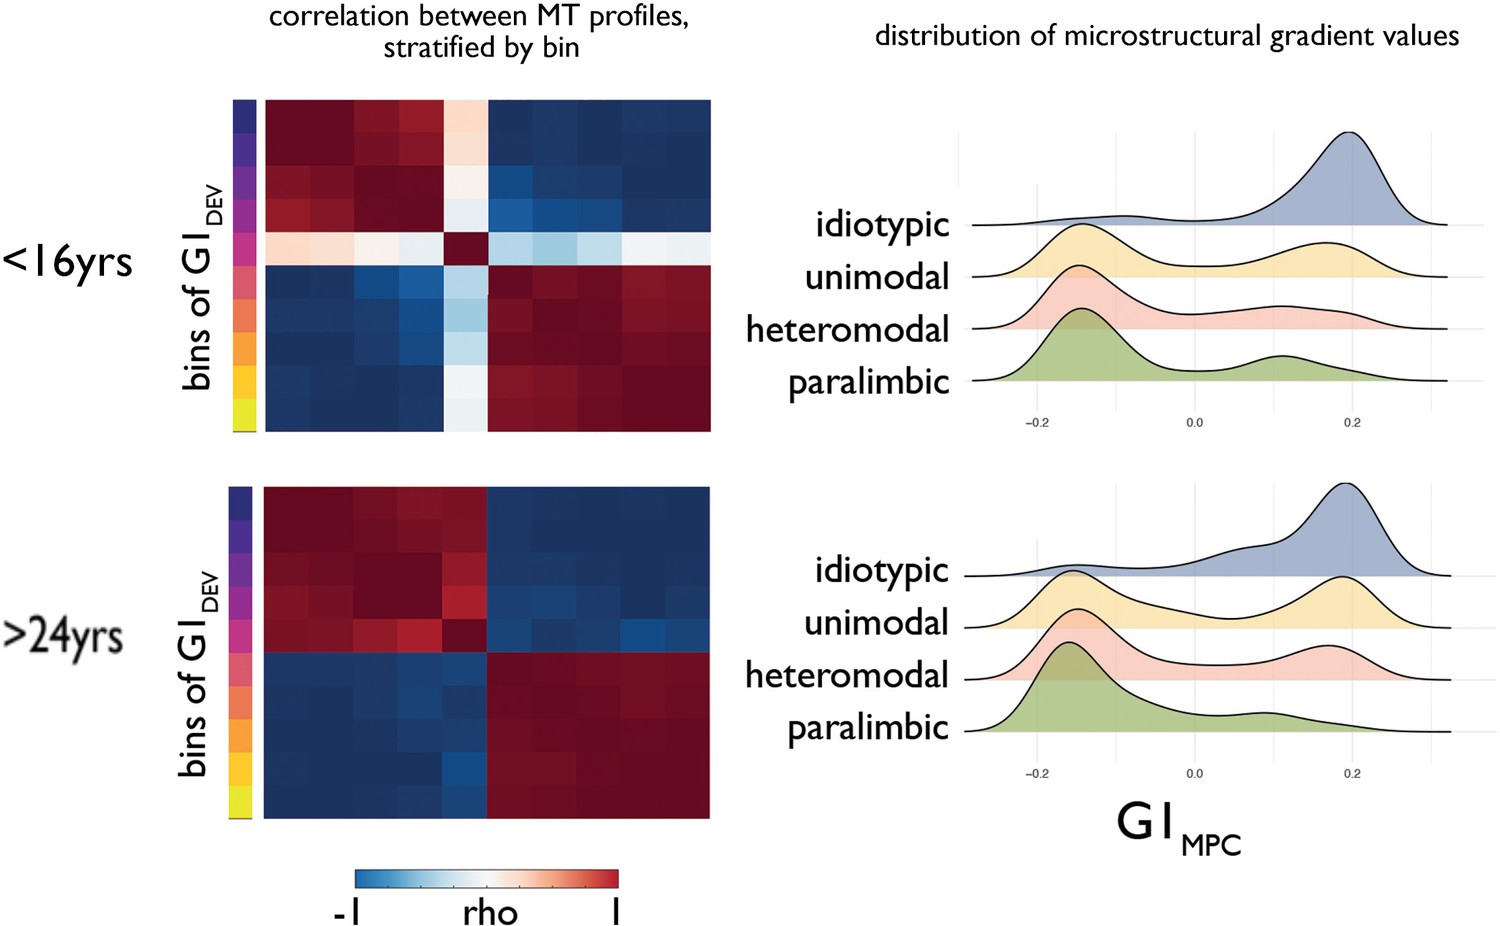
Increasing bimodality of the principle gradient of microstructural differentiation.
(Left) Matrices showing the Pearson correlation between average MT profiles within ten discrete bins of principal developmental gradient (G1Dev) for young (<16 years) and old (>24 years). (Right) Ridge plots of G1MPC by level of laminar differentiation show an increasingly bimodal distribution of G1MPC for association cortices.
Figure 4—figure supplement 3

Developmental gradients derived from moment difference.
Absolute difference in MT moment values between each pair of regions was calculated for each participant and transformed into a node x node matrix. In the same manner as developmental gradient construction, linear mixed effects models estimated the age-related changes of each edge and the resultant t-statistic matrix was subjected to diffusion map embedding. Variance explained by diffusion embedding components, t-statistic matrices ordered by the first components, the first components projected onto the cortical surface, scatterplot depicting the similarity of moment-based developmental gradients (G1AGE-MOMENT) to MPC-based developmental gradients (G1AGE-MPC; Figure 4B).
Appendix 1—figure 1
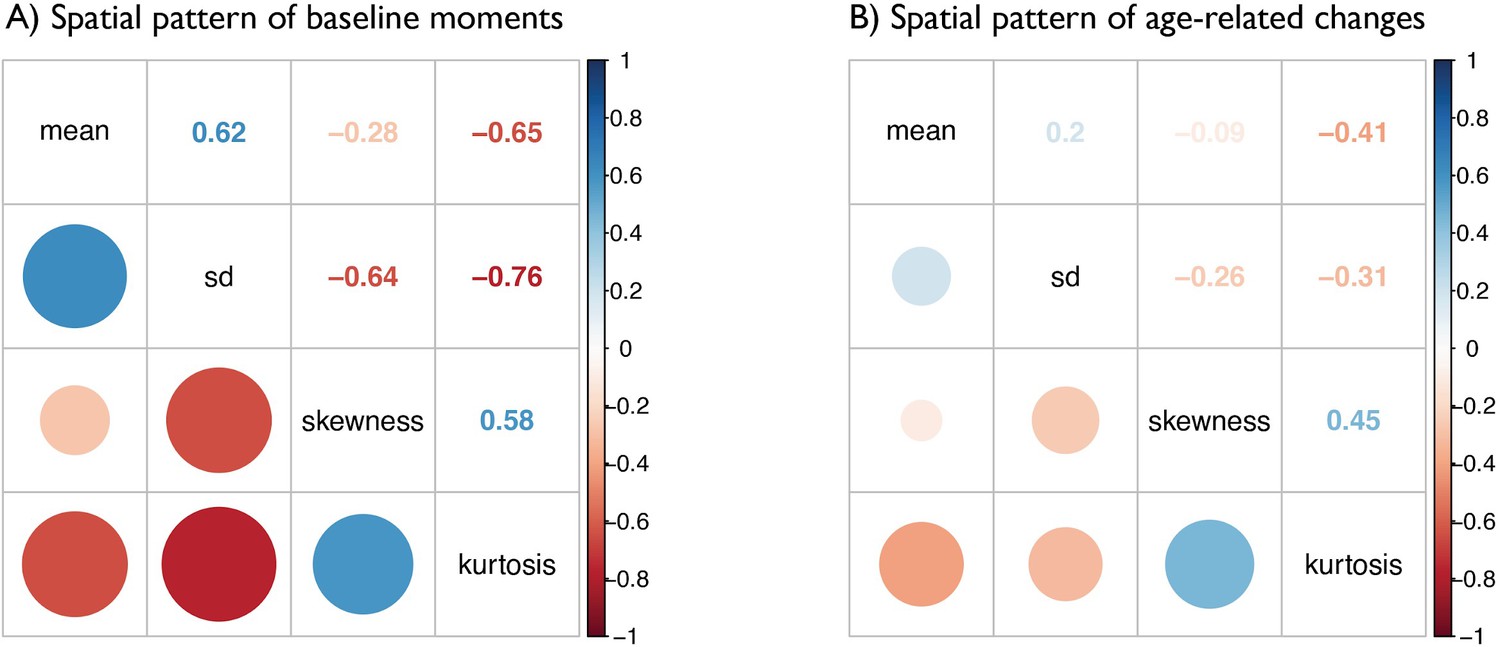
Matrices depict the strength of correlations (r values) between (A) baseline maps of MT moments and (B) t-statistic maps of age-related changes in MT moments.
https://doi.org/10.7554/eLife.50482.016
Appendix 1—figure 2

Independence of effects controlling for cortical thickness.
(A) Spatial distribution of MT moments corrected for cortical thickness (moment(n)~b0 + b1thickness(n) + ε). (B) t-statistics representing the age-related changes in MT moments, with cortical thickness included in the linear mixed effect model as a covariate (moment(n) ~ b0 + b1thickness(n) + b2age + b3sex + (1|subject) + ε).
Appendix 1—figure 3
Independence of effects controlling for interface blurring.
(A) Spatial distribution of MT moments corrected for interface blurring (moment(n)~b0 + blurring(n) + ε). (B) t-statistics representing the age-related changes in MT moments, with interface blurring included in the linear mixed effect model as a covariate (moment(n) ~ b0 + b1blurring(n) + b2age + b3sex + (1|subject) + ε).
Appendix 1—figure 4

Independence of effects controlling for mean MT.
(A) Spatial distribution of MT moments corrected for mean MT (moment(n)~b0 + b1meanMT(n) + ε). (B) t-statistics representing the age-related changes in MT moments, with mean MT included in the linear mixed effect model as a covariate (moment(n) ~ b0 + b1meanMT(n) + b2age + b3sex + (1|subject) + ε).
Appendix 1—figure 5
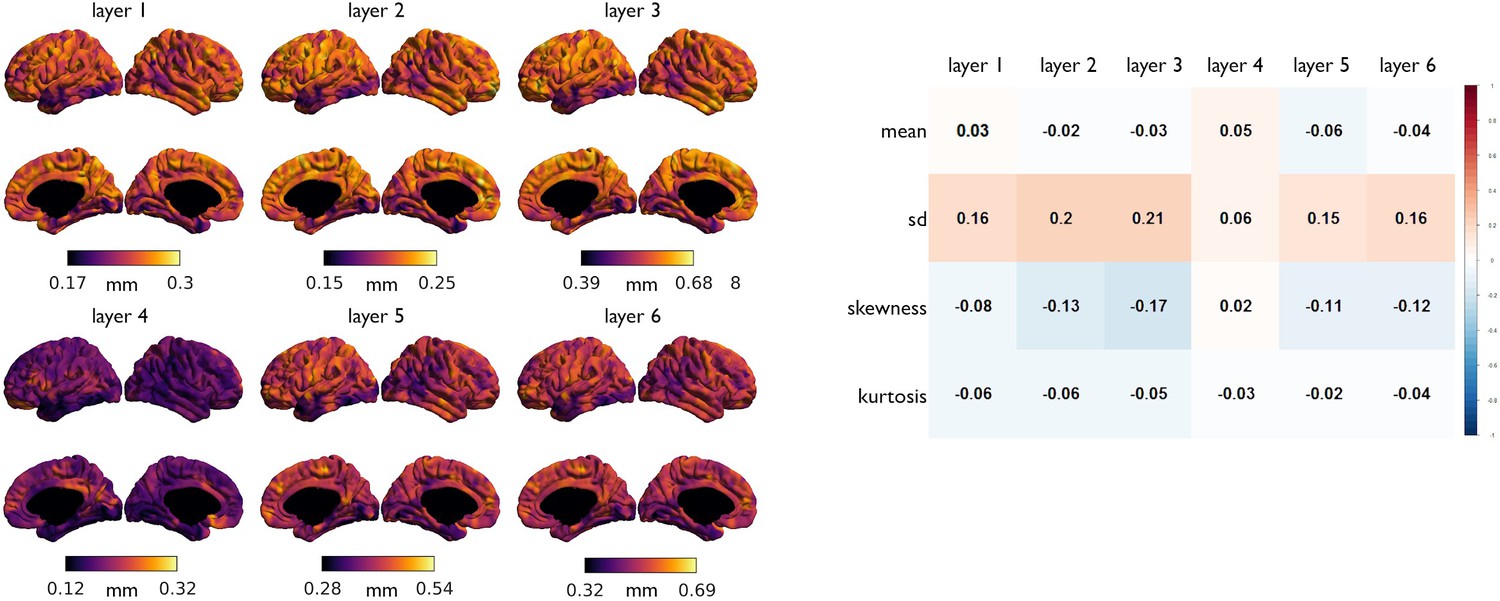
Association of laminar thickness with MT moments.
(Left) Laminar thickness, derived from a post mortem volumetric reconstruction of a Merker stained human brain (Wagstyl et al., 2018). (Right) Spearman correlation coefficients between spatial maps of baseline MT moments with laminar thicknesses.
Appendix 1—figure 6
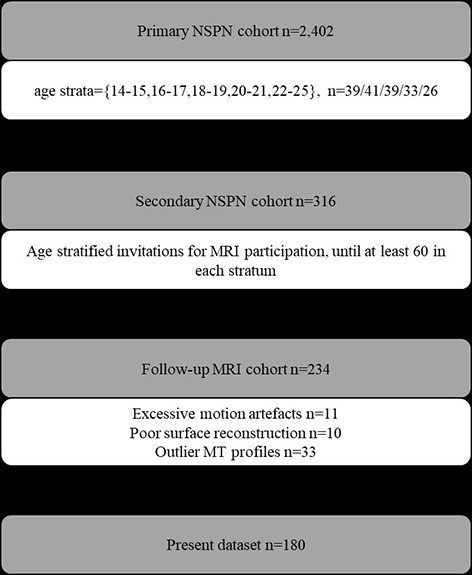
Sampling design.
https://doi.org/10.7554/eLife.50482.021Additional files
-
Supplementary file 1
Supplementary materials.
- https://doi.org/10.7554/eLife.50482.013
-
Transparent reporting form
- https://doi.org/10.7554/eLife.50482.014
Download links
A two-part list of links to download the article, or parts of the article, in various formats.
Downloads (link to download the article as PDF)
Open citations (links to open the citations from this article in various online reference manager services)
Cite this article (links to download the citations from this article in formats compatible with various reference manager tools)
Shifts in myeloarchitecture characterise adolescent development of cortical gradients
eLife 8:e50482.
https://doi.org/10.7554/eLife.50482


