Comprehensive transcriptome analysis of cochlear spiral ganglion neurons at multiple ages
- Chinese Academy of Sciences, China
- Howard Hughes Medical Institute, Janelia Research Campus, United States
- Shanghai Center for Brain Science and Brain-Inspired Intelligence Technology, China
Figures
Figure 1 with 1 supplement
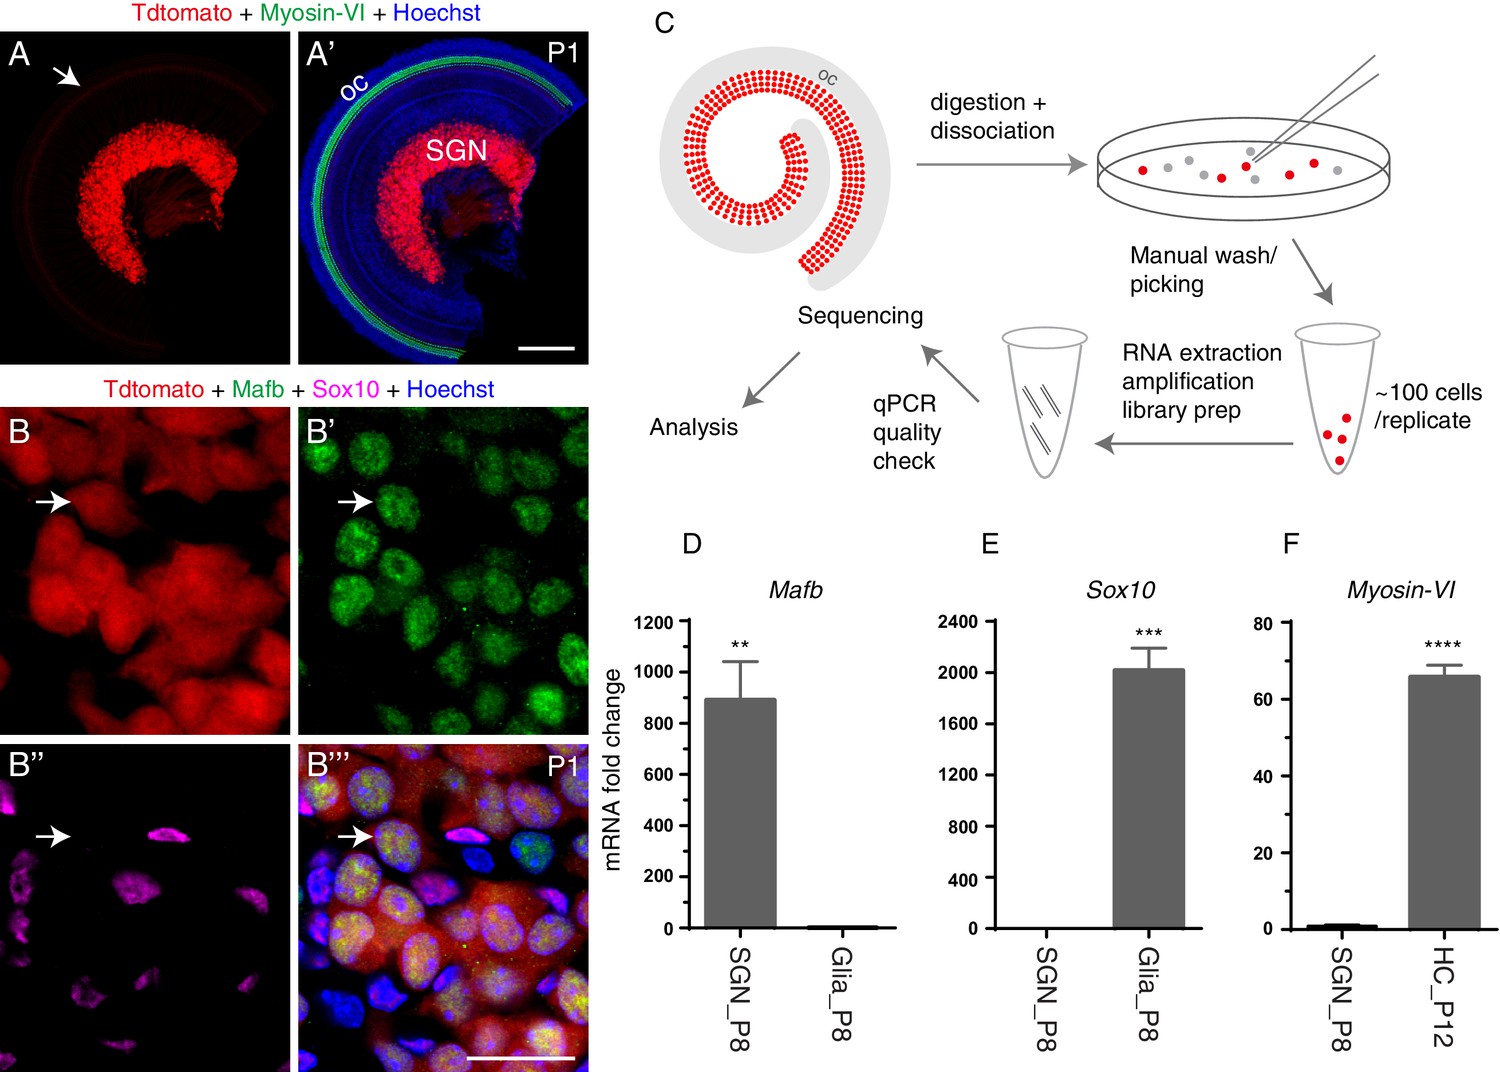
Genetic model, bulk RNA-Seq methodology, and qPCR quality check.
(A–A’) SGNs were endogenously labeled with tdTomato at P1 (or other ages after E15.5) in the mouse line ShhCre/+; Rosa26-CAG-loxp-stop-loxp-tdTomato/+. Arrow (in A) indicates SGN fibers with weak tdTomato expression innervating Myosin-VI+ HCs (green in A’) in the organ of Corti (oc). (B–B’’’) Cochlear tissues triple-labeled with Mafb and Sox10 antibodies and endogenous tdTomato fluorescence. Arrows: one tdTomato+ SGN expressing the neuronal marker Mafb but not the glial marker Sox10. (C) Illustration of our experimental procedures. Red SGNs were manually picked under a fluorescence microscope, washed three times, and placed in lysis buffer. (D–F) qPCR analysis of three genes, Mafb (D), Sox10 (E), and Myosin-VI (F). SGNs passed our quality check if they showed significant enrichment of Mafb but depletion of Sox10 and Myosin-VI; otherwise, the SGNs were discarded. **p<0.01, ***p<0.001, ****p<0.0001. Scale bars: 200 μm (A’) and 20 μm (B’’’).
-
Figure 1—source data 1
Neuronal gene was enriched, HC and glial genes were depleted in SGNs at P8.
- https://cdn.elifesciences.org/articles/50491/elife-50491-fig1-data1-v2.xlsx
Figure 1—figure supplement 1
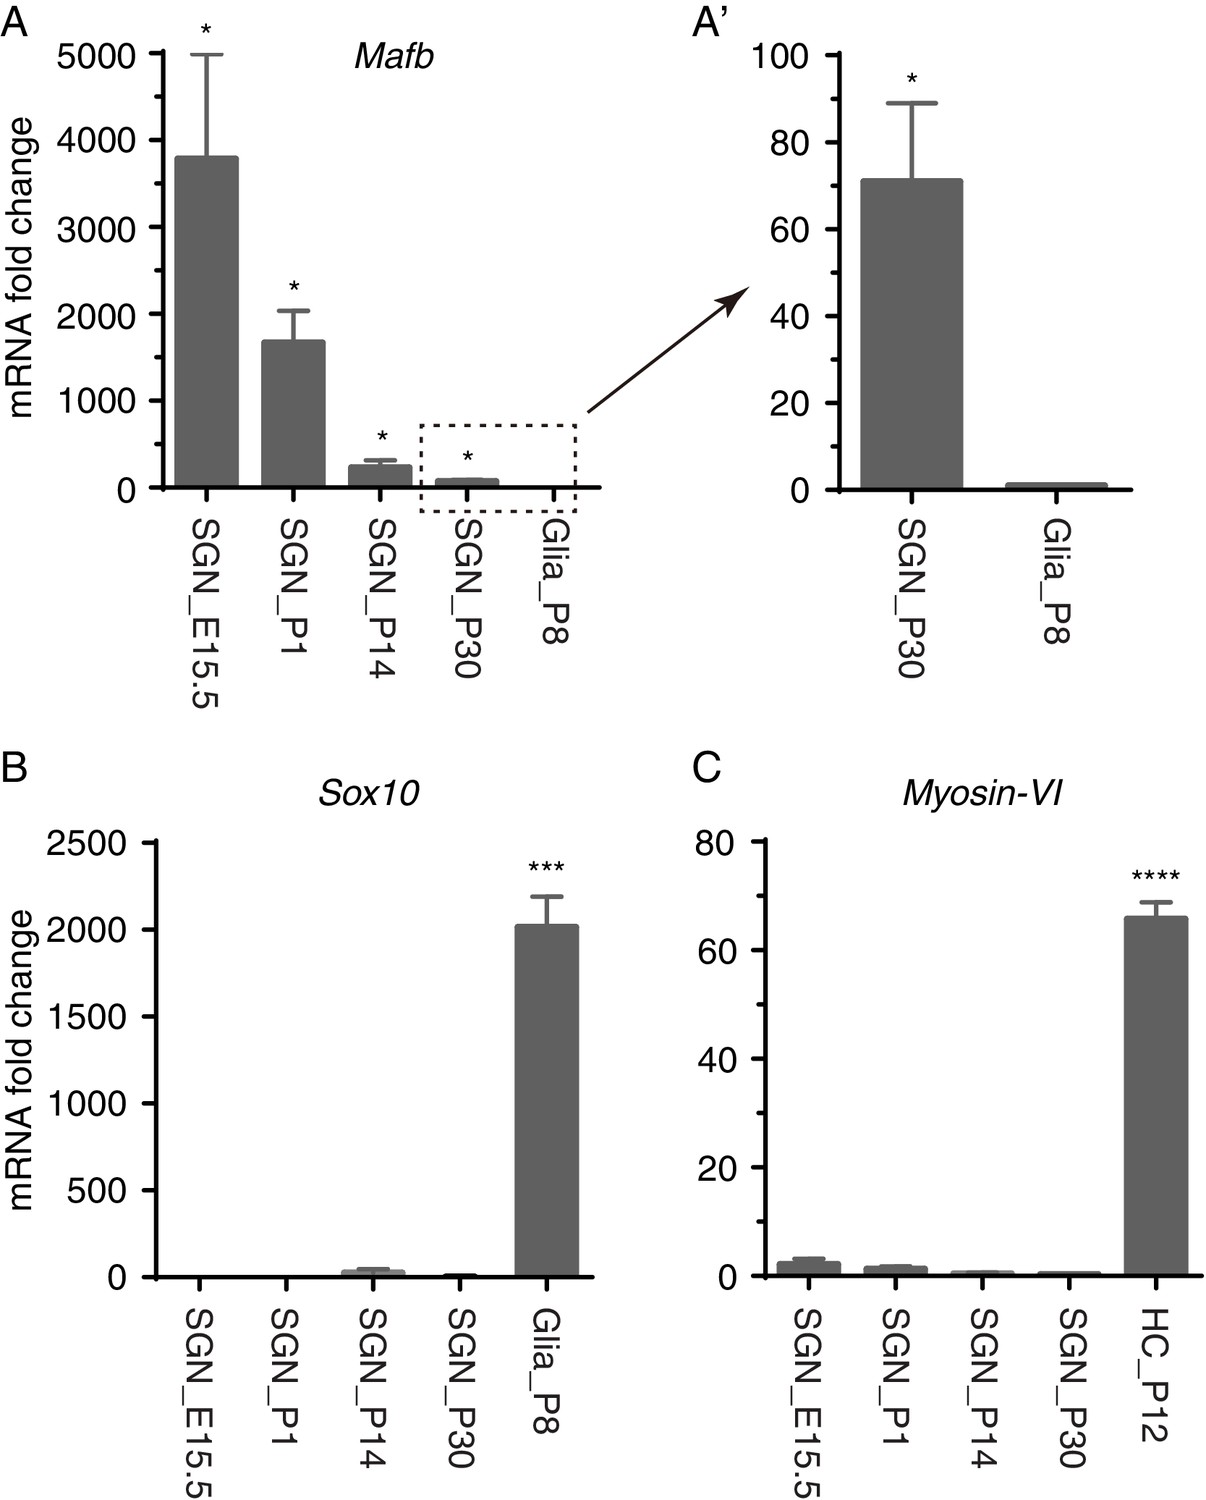
qPCR analysis of Mafb, Sox10, and Myosin-VI in SGNs at E15.5, P1, P14, and P30.
(A–A’) Mafb was significantly enriched in SGNs at all four ages, similar to SGNs at P8 (described in Figure 1D). In agreement with the finding that Mafb expression decreased during aging, younger SGNs showed greater enrichment of Mafb than older SGNs did. (B) Glial gene Sox10 was significantly depleted in SGNs relative to P8 glia (as in Figure 1E), and (C) HC gene Myosin-VI was drastically depleted in SGNs relative to HCs at P12 (as in Figure 1F).
-
Figure 1—figure supplement 1—source data 1
Neuronal gene was enriched, HC and glial genes were depleted in SGNs at E15.5, P1, P14 and P30.
- https://cdn.elifesciences.org/articles/50491/elife-50491-fig1-figsupp1-data1-v2.xlsx
Figure 2 with 3 supplements
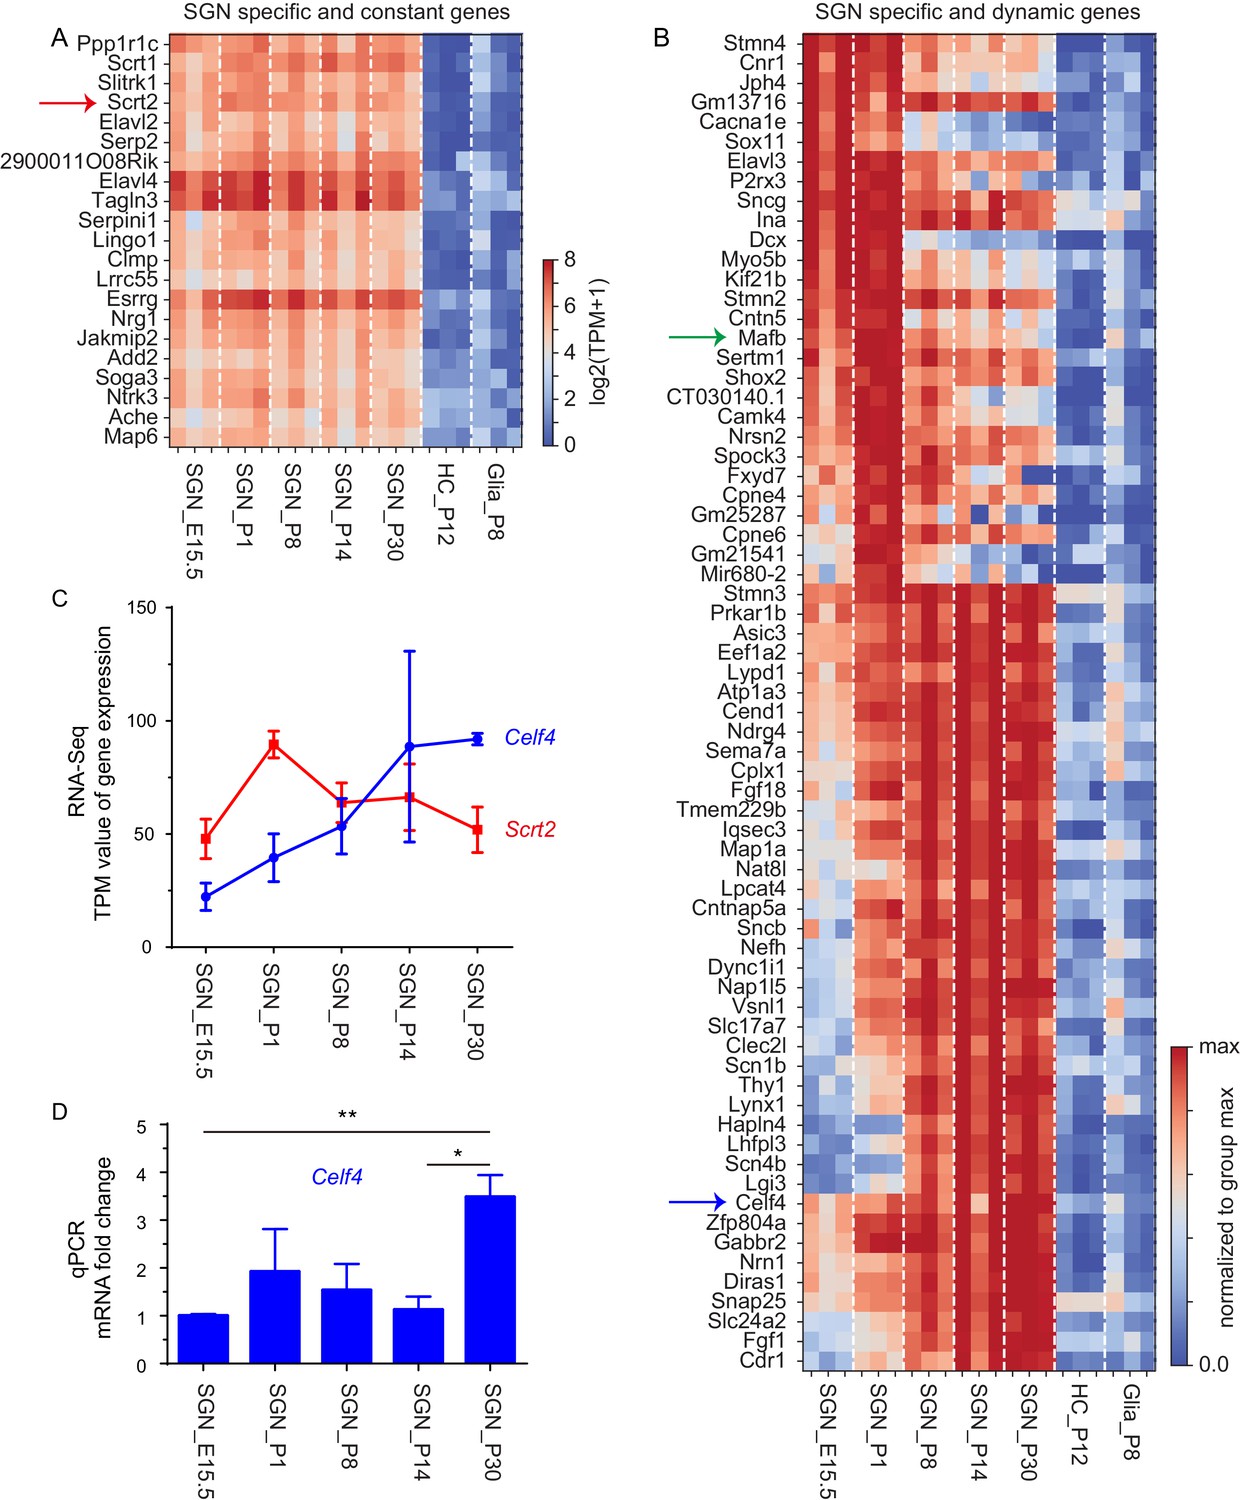
SGN-specific genes showing constant and dynamic expression.
(A) Our selection criteria for constant expression were met by 21 SGN-specific genes, which were expressed in SGNs at all ages but not expressed in HCs or glia. (B) Dynamic expression was exhibited by 68 SGN-specific genes; the expression levels of these genes in SGNs changed significantly across ages, being either lower at younger ages but higher at older ages, or vice versa. For these genes to be considered bona fide SGN-specific genes, they had to be depleted in HCs and glial cells. (C) Scrt2 and Celf4 are used here as examples to illustrate expression levels across different ages. Y-axis: expression in transcripts per million (TPM); data are shown as means ± SEM. Scrt2 (red): SGN-specific gene showing constant expression; Celf4 (blue): SGN-specific gene showing dynamic expression. (D) qPCR analysis of Celf4 in SGNs at all five ages. Celf4 mRNA levels were significantly different between E15.5 and P30 (**p<0.01) and between P14 and P30 (*p<0.05).
-
Figure 2—source data 1
Scrt2 and Celf4 expression level by RNA-Seq and q-PCR analyisis.
- https://cdn.elifesciences.org/articles/50491/elife-50491-fig2-data1-v2.xlsx
Figure 2—figure supplement 1
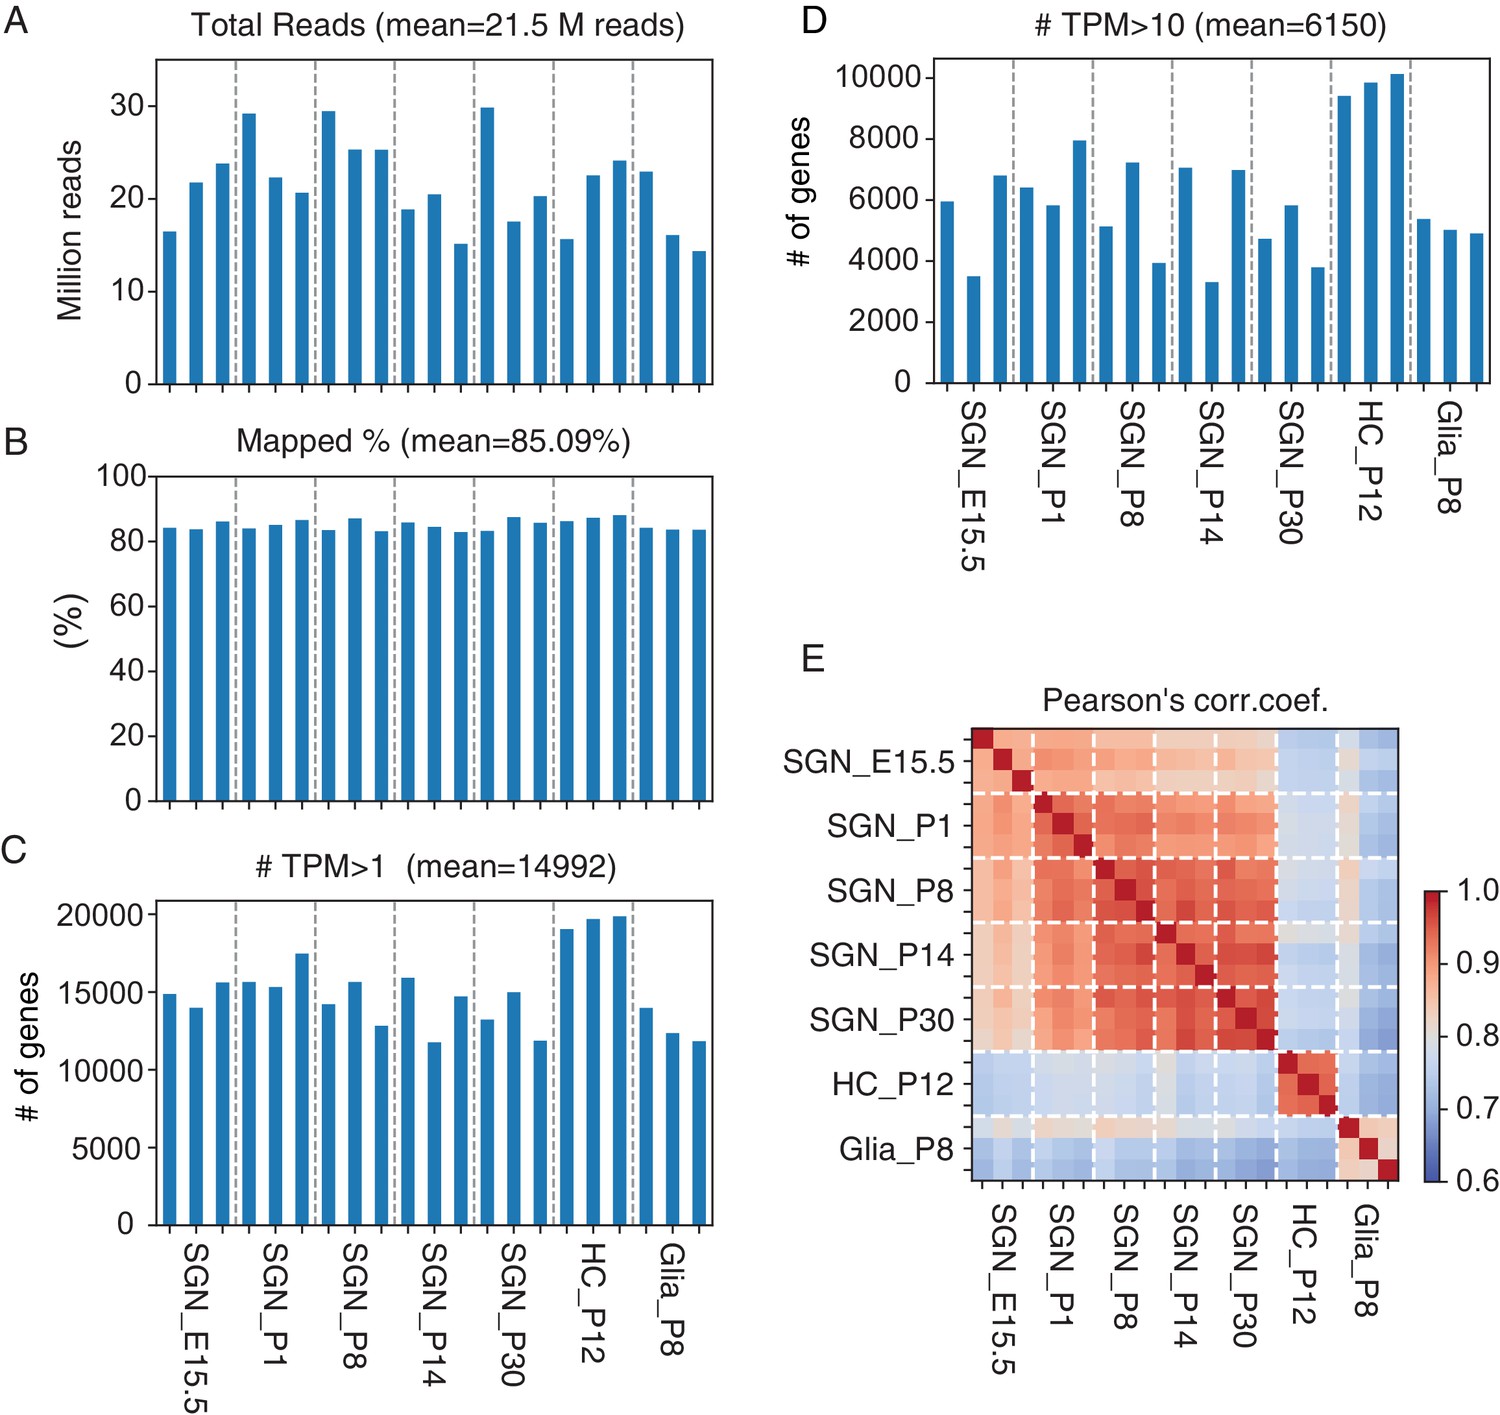
Summary of our bulk RNA-Seq data.
(A) Total number of reads per sample. (B) Percentage of reads mapped to the mm10 genome. (C) Number of genes with TPM (transcripts per million) values of >1. Same sample names are used for panels A, B, and C. (D) Number of genes with TPM >10. (E) Pearson’s correlation coefficient between samples.
Figure 2—figure supplement 2
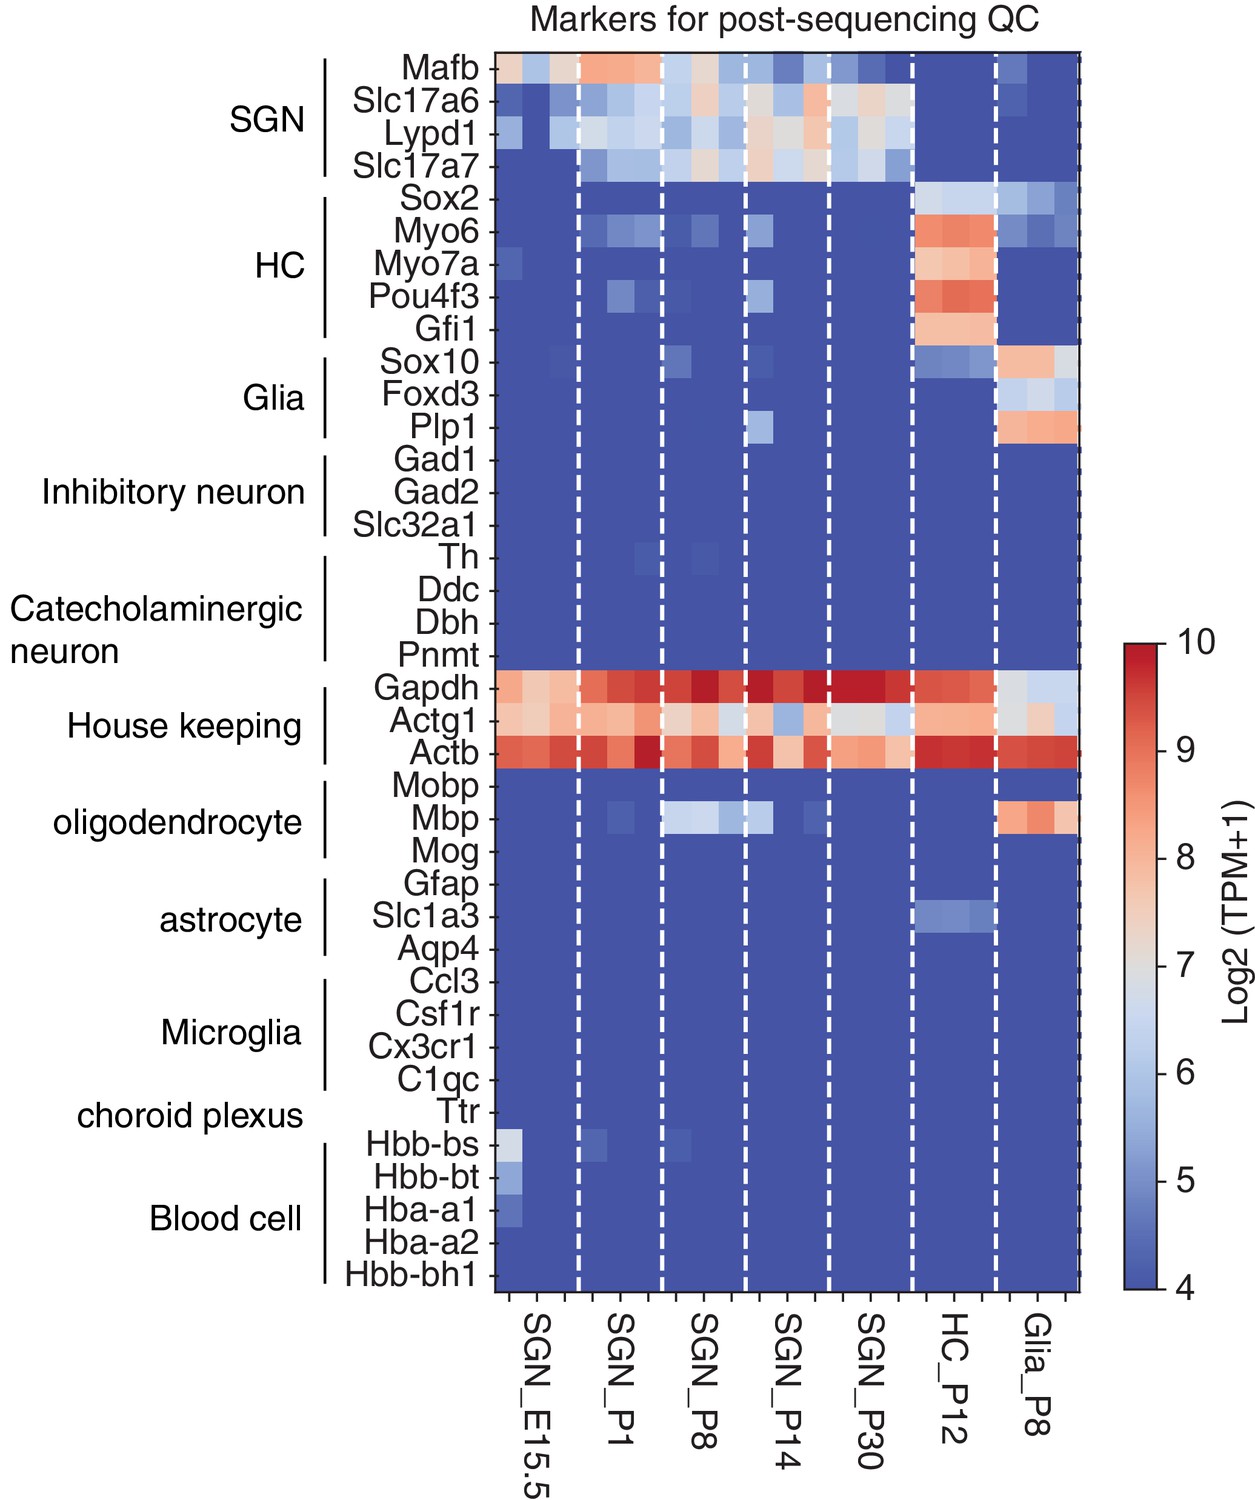
Post-sequencing quality check by using markers for multiple cell types.
We used markers for 10 cell types including SGNs, HCs, and glial cells. Moreover, to verify RNA quality and integrity, we checked to ensure the expression in all samples of the housekeeping genes Gapdh, Actg1, and Actb.
Figure 2—figure supplement 3
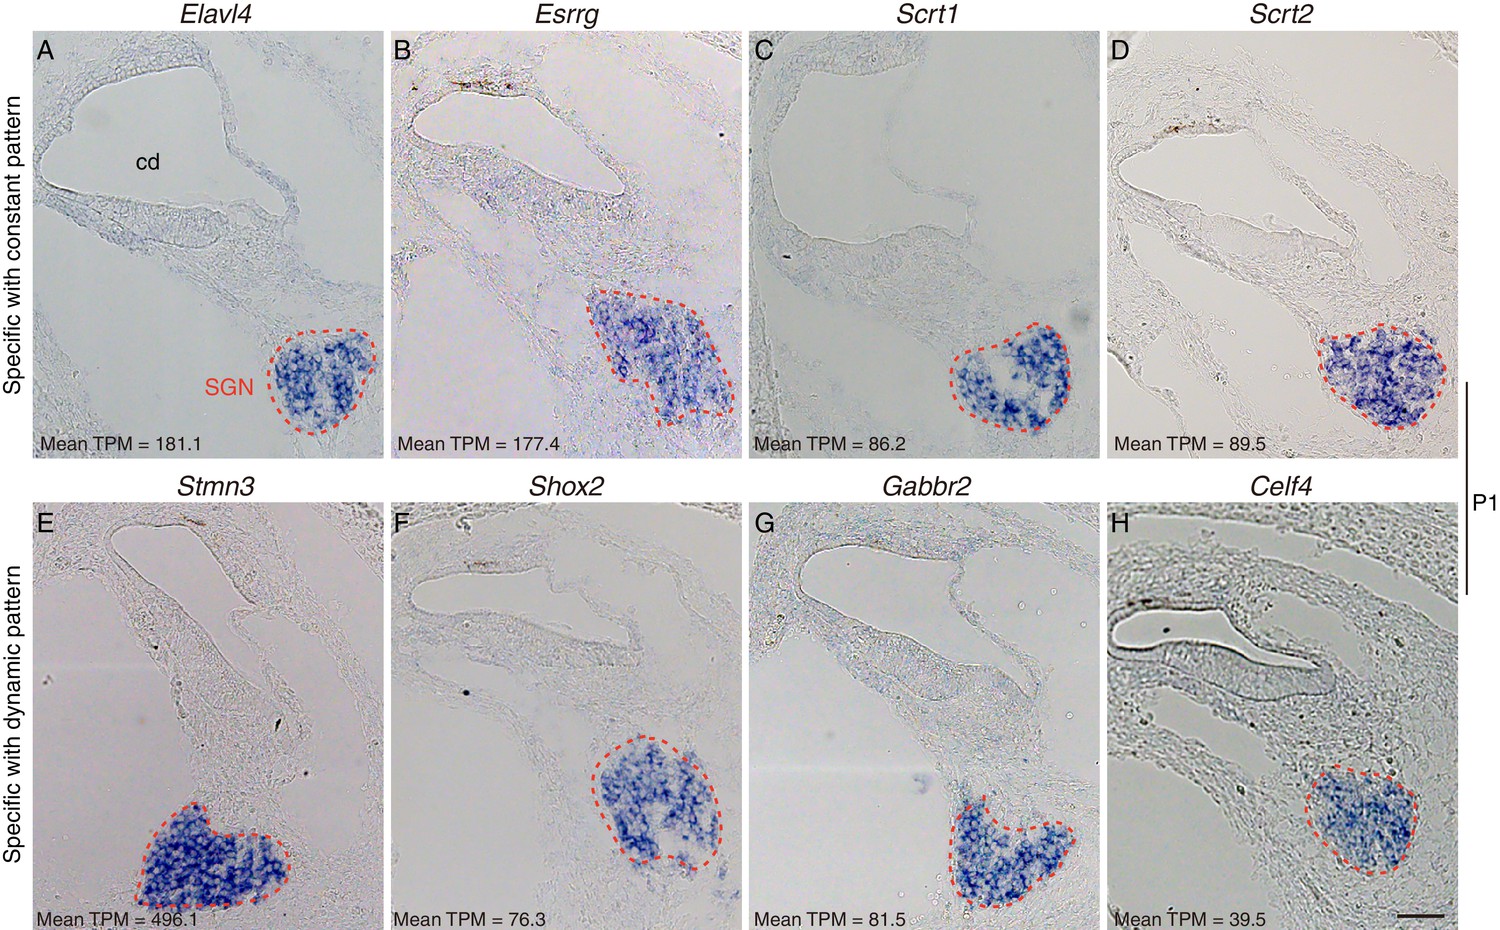
RNA in situ hybridization of SGN-specific genes.
RNA in situ hybridization at P1 was used for validation of SGN-specific genes (four each) showing (A–D) constant expression (Elavl4, Esrrg, Scrt1, and Scrt2) and (E–H) dynamic expression (Stmn3, Shox2, Gabbr2, and Celf4). All genes were specifically detected in SGN regions. Celf4 signal intensity was lower than that of other genes at P1. The expression level (mean TPM) of each gene at P1 is shown in the left corner in each panel. Scale bar: 50 μm.
Figure 3
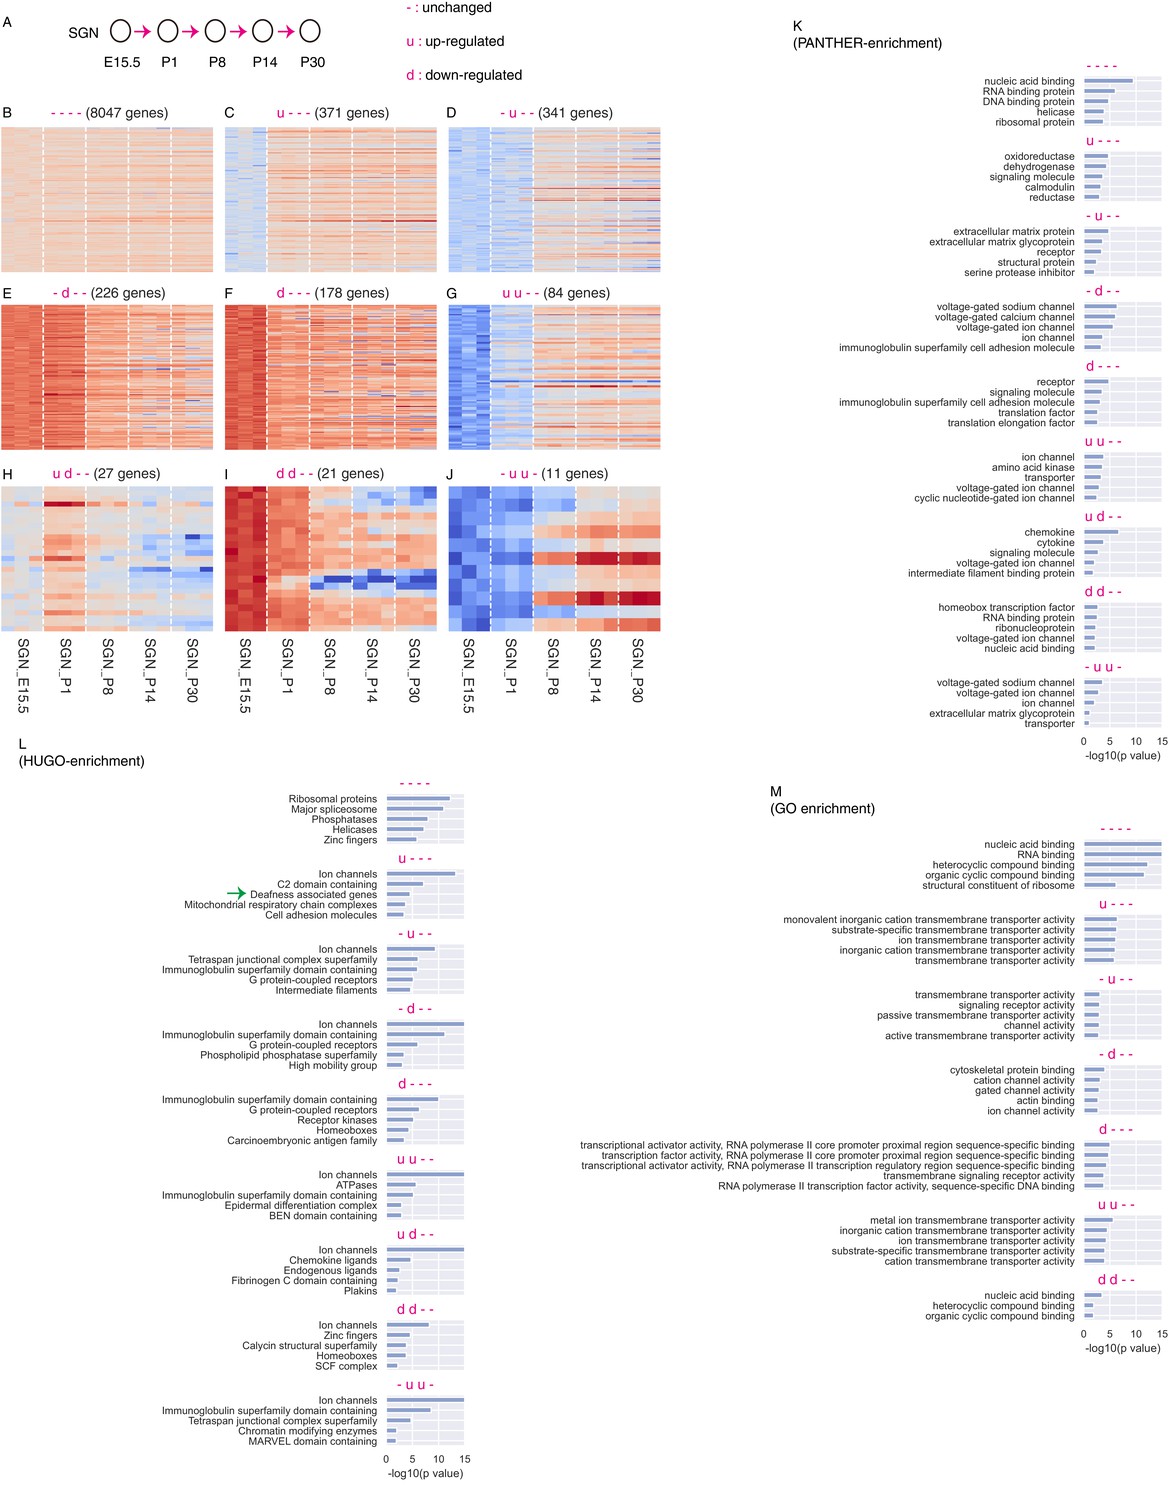
Computational analysis SGN genes without considering whether they are SGN-specific or not.
(A) Cartoon depicting definition of up-regulation (u), down-regulation (d), and unchanged expression (-) during gene transitions between two neighboring ages (arrows). (B) The unchanged category included 8047 genes. (C–J) Dynamic genes were divided into eight categories. (K–M) Gene-group enrichment analysis was performed using three different gene annotations: HUGO, PANTHER, and Gene Ontology.
Figure 4 with 3 supplements
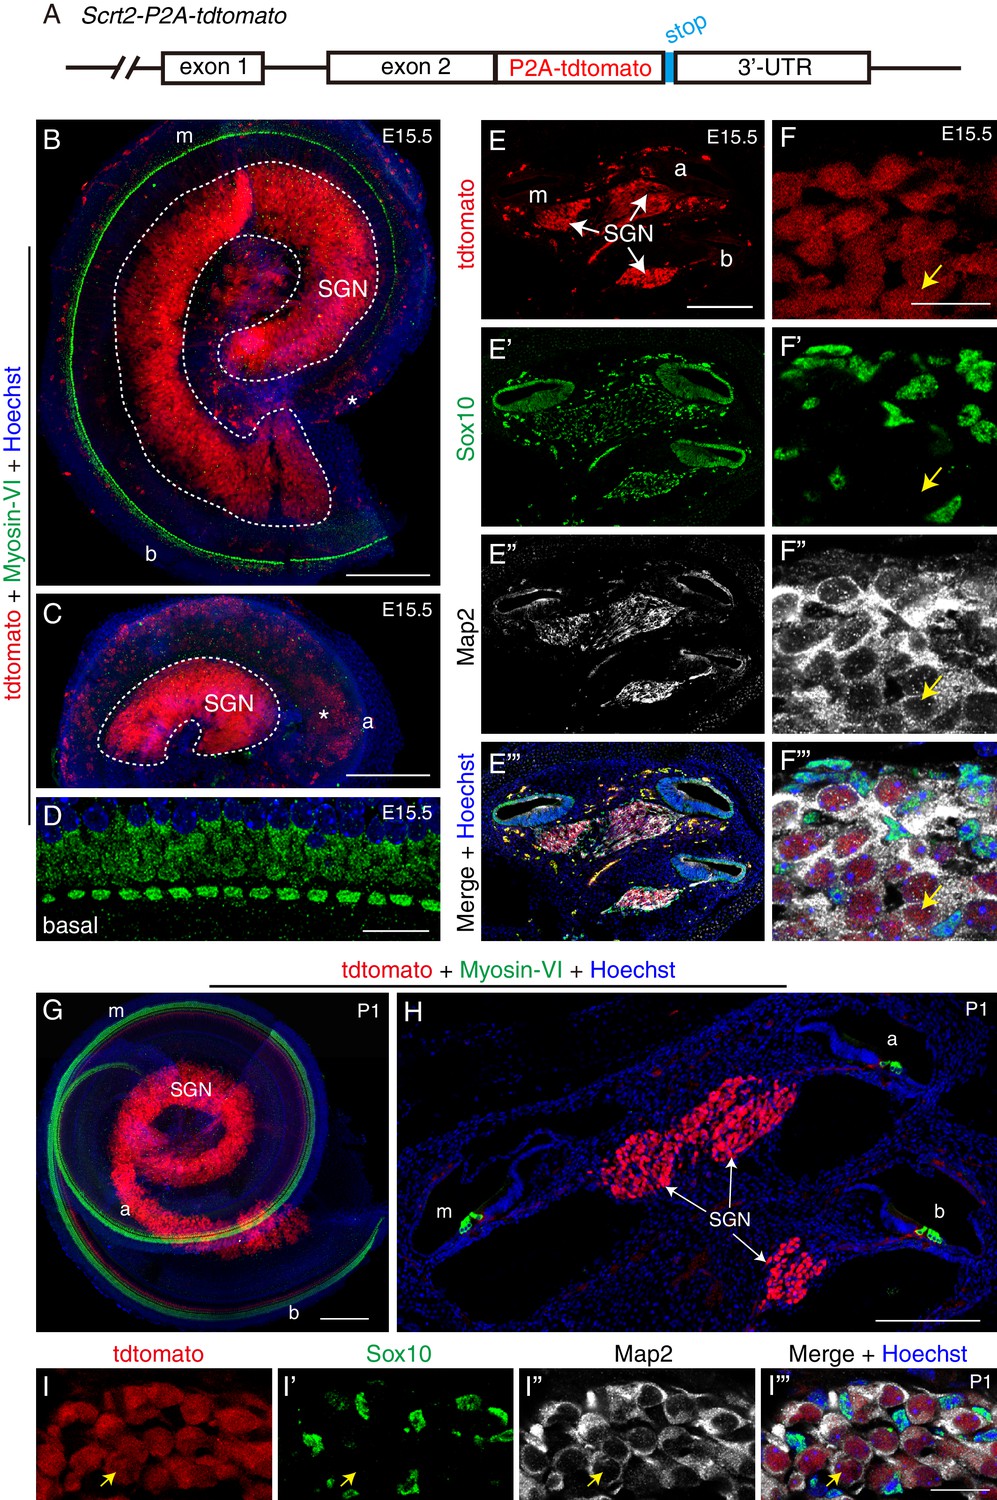
Scrt2 is expressed in SGNs but not HCs or glia at E15.5 and P1.
(A) Illustration of the genetically modified Scrt2 locus. Detailed information please refer to Figure 4—figure supplement 1. (B–C) Double-labeling for HC-marker Myosin-VI and tdTomato in cochlear basal/middle portion (B) and middle/apical portion (C) dissected from Scrt2-tdTomato/+ mice at E15.5. Several tdTomato+ cells were observed in the SGN area (white dotted circle). At this stage, the apical part did not yet harbor Myosin-VI+ HCs, and the middle turn contained only a single row of IHCs. Asterisk (B and C): blood cells showing high red autofluorescence. (D) High-resolution image of basal cochlea double-labeled for Myosin-VI and tdTomato. HCs did not express tdTomato. (E–F’’’) Low- and high-magnification (E–E’’’, F–F’’’) confocal images of cochlear tissues labeled for tdTomato, Sox10, and Map2 at E15.5. Arrows in (F–F’’’): one tdTomato+ SGN that expressed Map2 but not Sox10. (G–H) Double-labeling for HC marker Myosin-VI and tdTomato in whole-mount (G) and cryosection (H) analyses at P1. Myosin-VI+ HCs did not express tdTomato (Scrt2). (I–I’’’) Triple-labeling for Map2, Sox10, and tdTomato. Arrows: one tdTomato+ SGN that expressed Map2 but not Sox10. This confirms that Scrt2 was expressed in SGNs but not glial cells at P1. Scale bars: 200 μm (B, C, E, G, and H) and 20 μm (D, F, and I’’’).
Figure 4—figure supplement 1
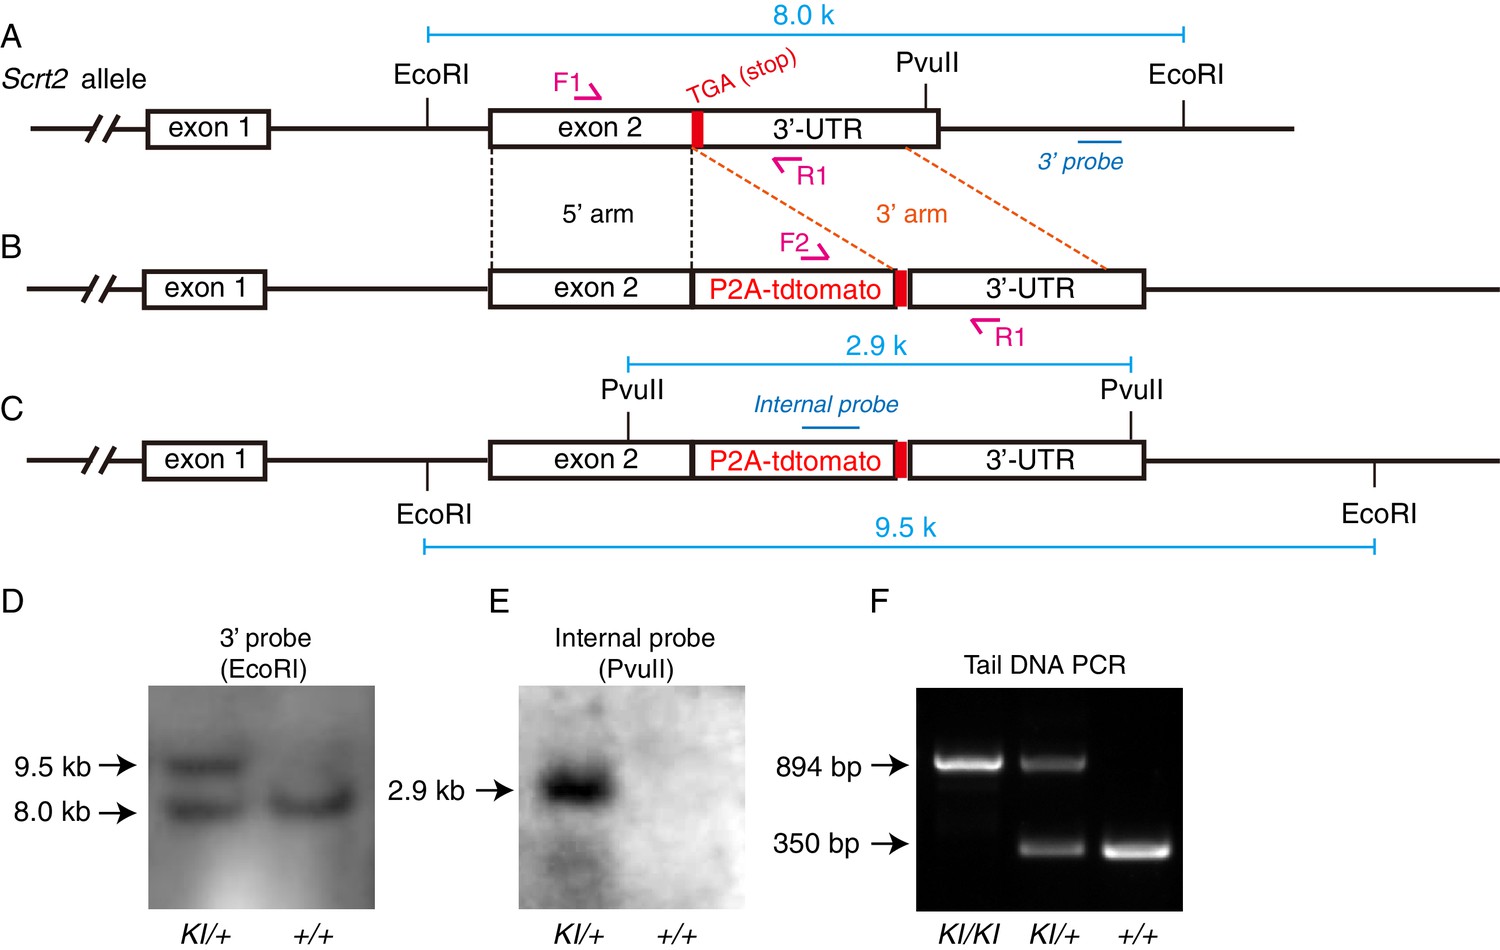
Generation of Scrt2-P2A-tdTomato (Scrt2-tdTomato) knockin mouse strain.
(A–C) Illustration of wild-type Scrt2 allele (A), gene-targeting vector (B), and final Scrt2 allele after correct gene targeting (C). (D–E) Southern blotting with external 3ʹ probe and genomic DNA cut with EcoRI (D) and internal probe cut with PvuII (E). With the 3ʹ probe, a single 8.0-kbp band was detected in wild-type (+/+) mice, whereas the 8.0-kbp band and a 9.5-kbp band were detected in heterozygous (KI/+) mice. With the internal probe, a single 2.9-kbp band was detected in KI/+ but not wild-type (+/+) mice. These data confirm the lack of random genomic insertion of donor DNA. (F) PCR-genotyping performed using mouse tail DNA and three primers (F1, F2, and R1) together allowed identification of homozygous (KI/KI), KI/+, and +/+ mice. PCR amplicons of KI and wild-type alleles were 894 and 350 bp long, respectively.
Figure 4—figure supplement 2
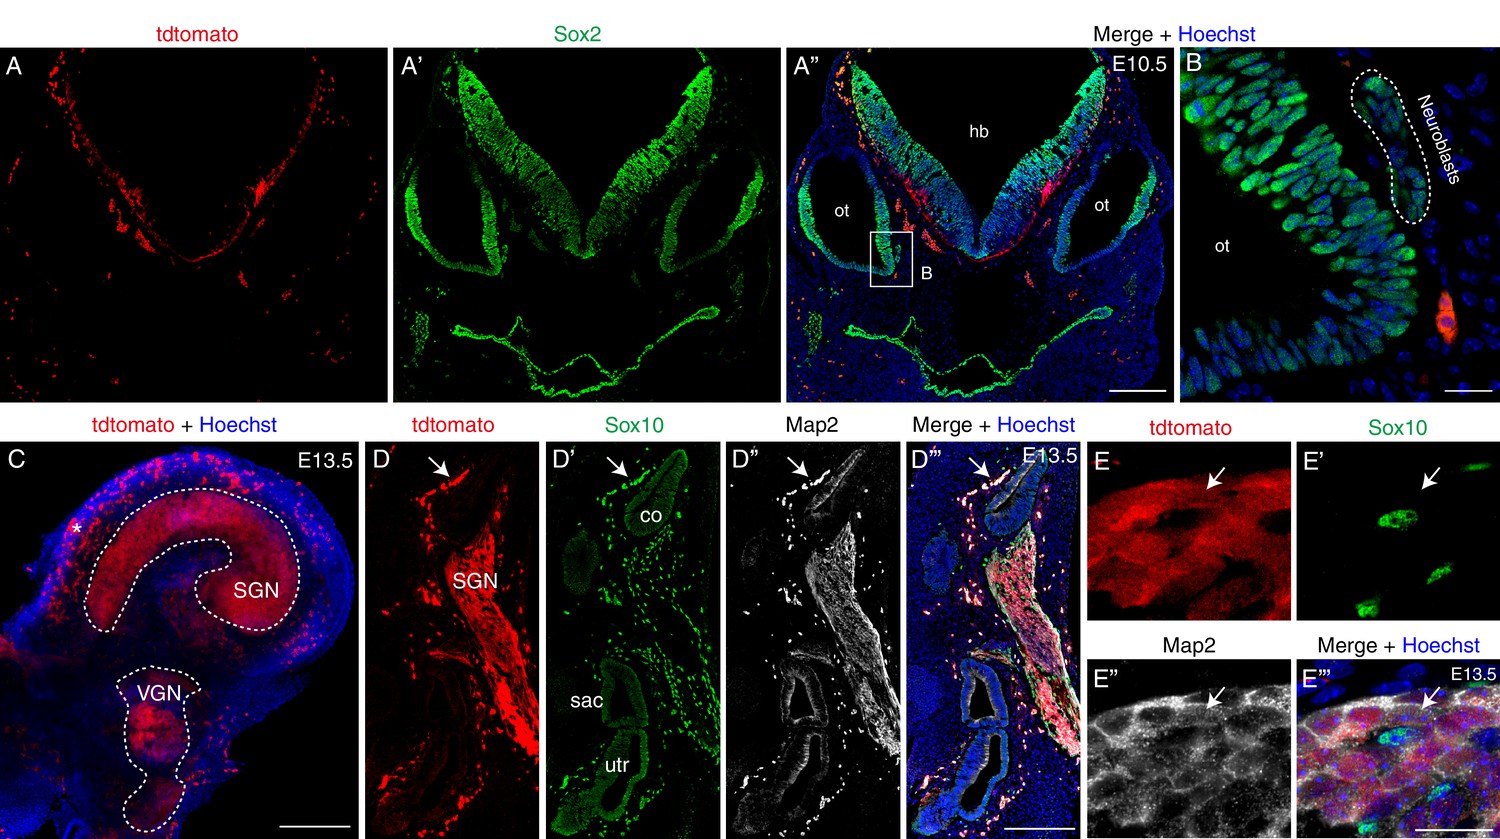
Scrt2 is not expressed in neuroblasts at E10.5 but is expressed in SGNs at E13.5.
(A–A’’) Double-labeling of for Sox2 and tdTomato in cryosection tissues from Scrt2-tdTomato/+ mice at E10.5; tdTomato+ cells were detected in the hindbrain, but not in the otocyst (ot), an early developmental stage of the inner ear. (B) High-resolution image of boxed region in (A’’). Neuroblasts (dotted circle) expressed Sox2 but not tdTomato. (C) Whole-mount view of endogenous tdTomato signal in cochlear tissues dissected from Scrt2-tdTomato/+ mice at E13.5. Robust tdTomato signal was detected in the SGN and VGN regions. Several blood cells showing high red autofluorescence (asterisk) were detected at this age. (D–E’’’) Triple-labeling for Map2, Sox10, and tdTomato in cryosection samples. Arrows in (D–D’’’): blood cells showing high red autofluorescence (D); these were also visible in the green (D’) and far-red (D’’) confocal channels. Arrows in (E–E’’’): one tdTomato+ SGN that expressed Map2 but not Sox10. sac: sacculus; utr: utricle. Scale bars: 200 μm (A’’, C, and D’’’) and 20 μm (B and E’’’).
Figure 4—figure supplement 3
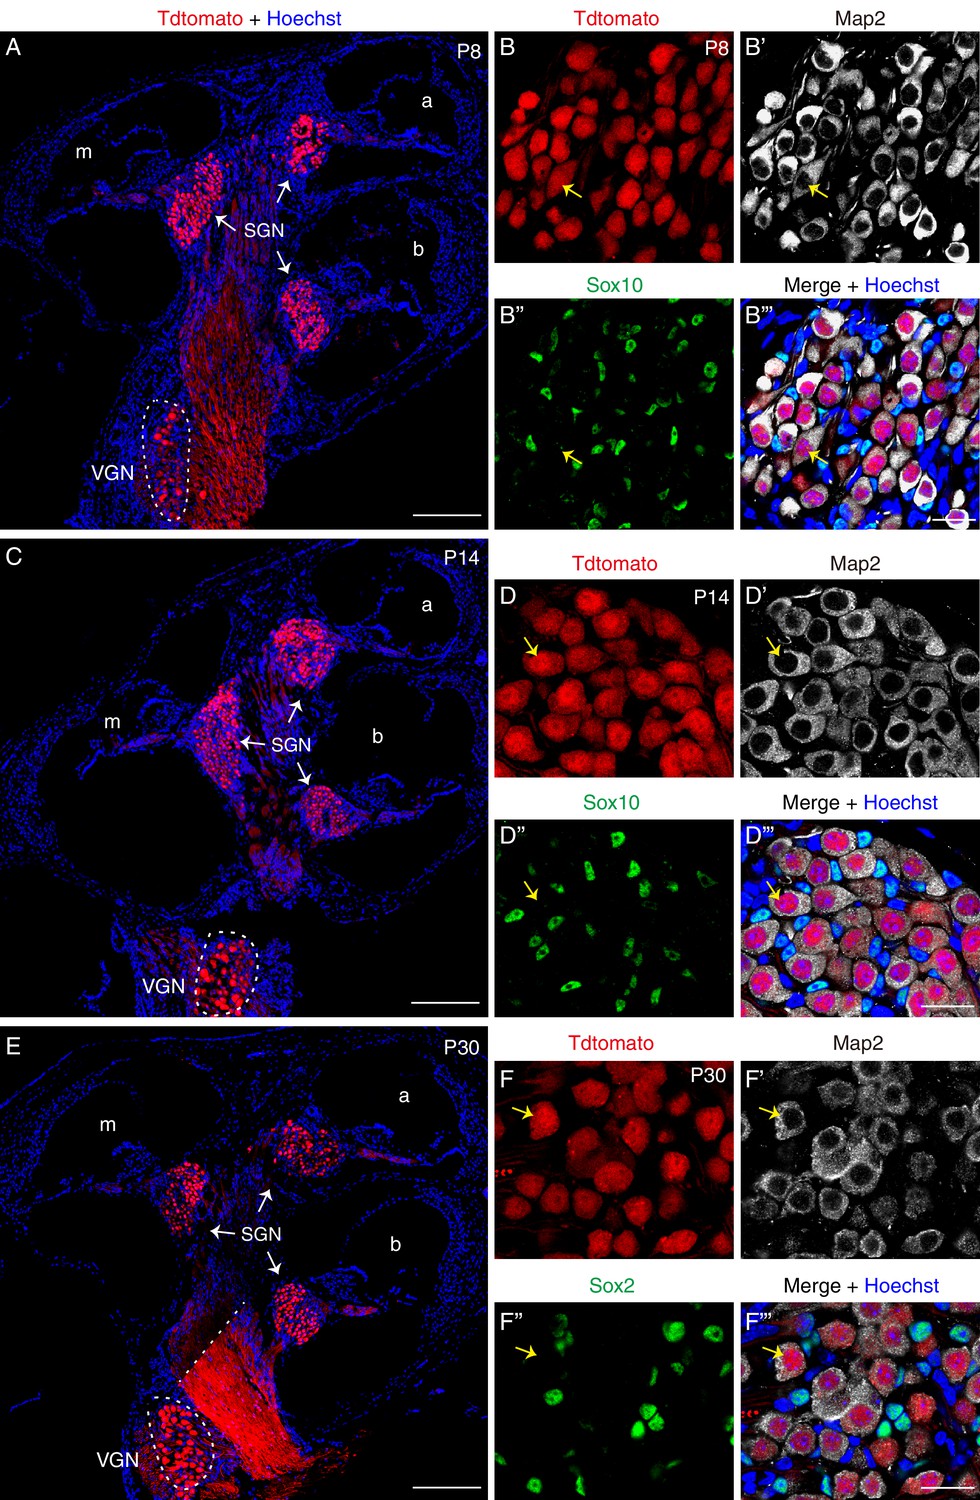
Scrt2 expression is maintained in SGNs at P8, P14, and P30.
(A–B’’’) Confocal cryosection images of inner ear tissues from Scrt2-tdTomato/+ mice at P8, visualized at (A) low resolution, based on tdTomato fluorescence; and (B–B’’’) high resolution, based on triple-labeling for tdTomato, Map2, and Sox10. Arrows in (B–B’’’): one tdTomato+ SGN that expressed the neuronal marker Map2 but not the glial marker Sox10. (C–D’’’) Confocal cryosection images of inner ear tissues dissected from Scrt2-tdTomato/+ mice at P14. Again, tdTomato+ cells expressed Map2 but not Sox10, confirming that they were SGNs and not glial cells (arrows in D-D’’’). (E–F’’’) Confocal cryosection images of inner ear tissues dissected from Scrt2-tdTomato/+ mice at P30. As before, tdTomato+ cells (arrows in F-F’’’) expressed Map2 but not Sox2 in the adult inner ear. Dotted white line in (E): boundary of confocal tile scan (2 × 2). At all ages, VGNs were also tdTomato+ (white dotted circles in A, C, and E). Scale bars: 200 μm (A, C, and E) and 20 μm (B’’’, D’’’, and F’’’).
Figure 5 with 1 supplement
Celf4 is detected in SGNs at E15.5 and further increased at P1 and P30.
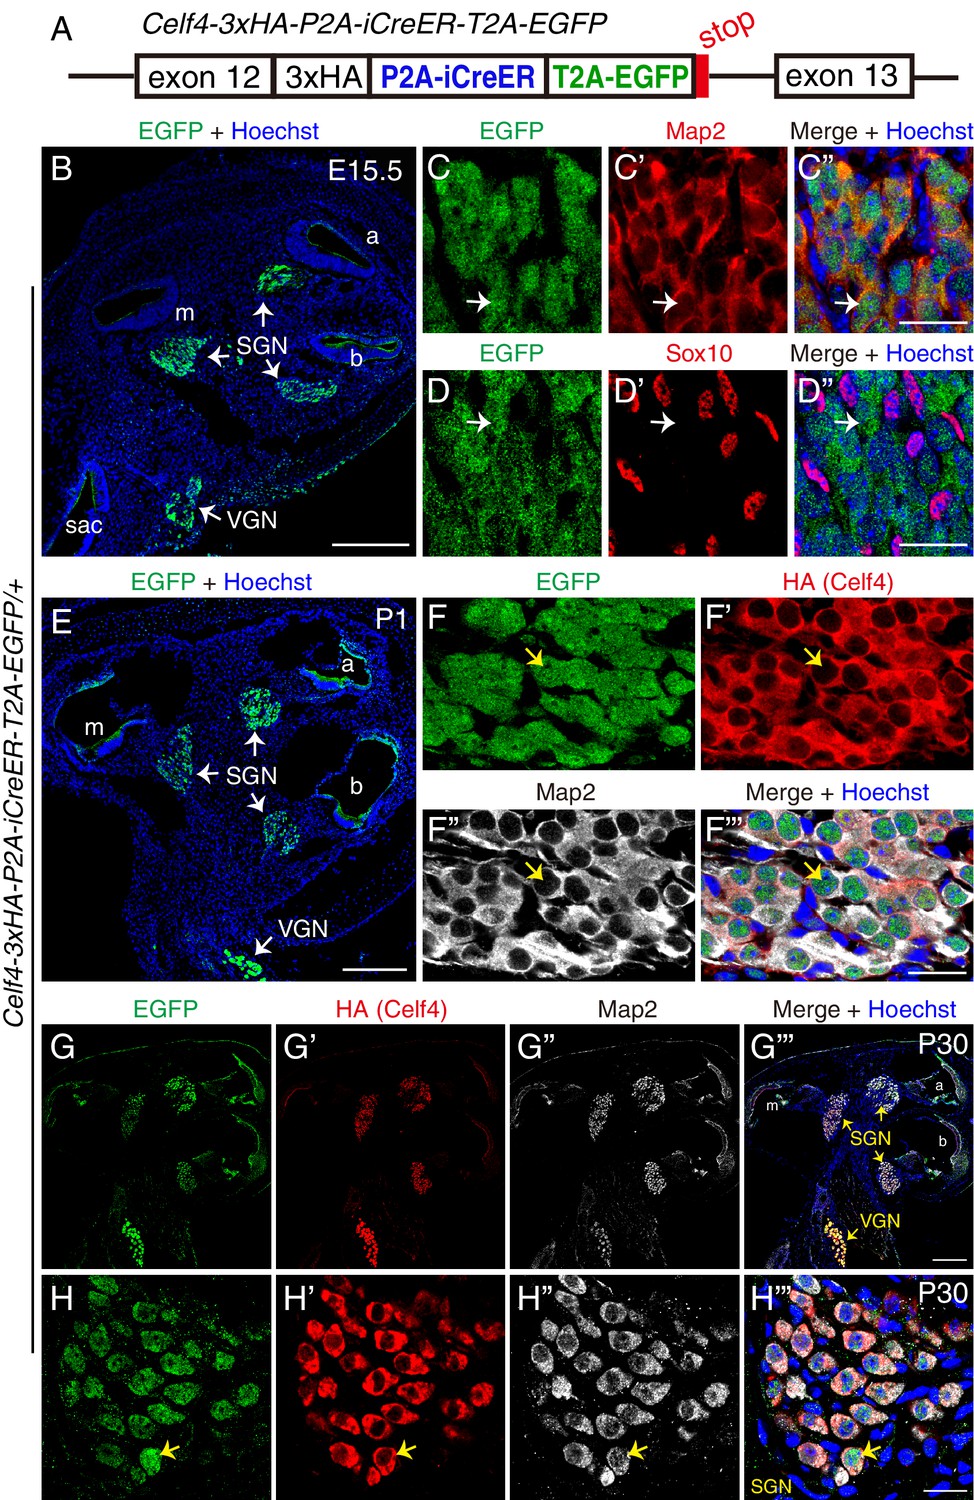
(A) Illustration of the genetically modified Celf4 locus. Detailed information please refer to Figure 5—figure supplement 1. (B) Cochlear cryosectioned tissues from Celf4-3xHA-P2A-iCreER-T2A-EGFP/+ (Celf4-iCreER/+) mice at E15.5 were stained with EGFP antibody. EGFP signal was observed in SGN areas in all three cochlear turns and in vestibular neuron (VGN) regions. (C–C’’) Double-labeling for EGFP and neuronal marker Map2. Arrows: one EGFP+ cell that expressed Map2, confirming that it was an SGN. (D–D’’) Double-labeling for EGFP and glial marker Sox10. Arrows: one EGFP+ cell that did not express Sox10, confirming that it was not a glial cell. (E) Cochlear cryosectioned tissues from Celf4-iCreER/+ mice at P1 were stained with EGFP antibody. (F–F’’’) Triple-labeling with EGFP, HA, and Map2 antibodies. Arrows: one SGN that expressed EGFP, HA-tagged Celf4, and Map2. (G–H’’’) Triple-labeling for EGFP, HA, and Map2 in cochlear cryosection tissues, shown at low (G–G’’’) and high resolution (H–H’’’), from Celf4-3xHA-P2A-iCreER-T2A-EGFP/+ (Celf4-iCreER/+) mice at P30. Arrows in (H–H’’’): one SGN that expressed EGFP, HA (Celf4), and Map2. VGNs (G’’’) also expressed Celf4. Because the EGFP and HA signals were stronger in VGNs than in SGNs, Celf4 expression level is expected to be higher in VGNs. Sac: sacculus. Scale bars: 200 μm (B, E and G’’’) and 20 μm (C’’, D’’, F’’’ and H’’’).
Figure 5—figure supplement 1
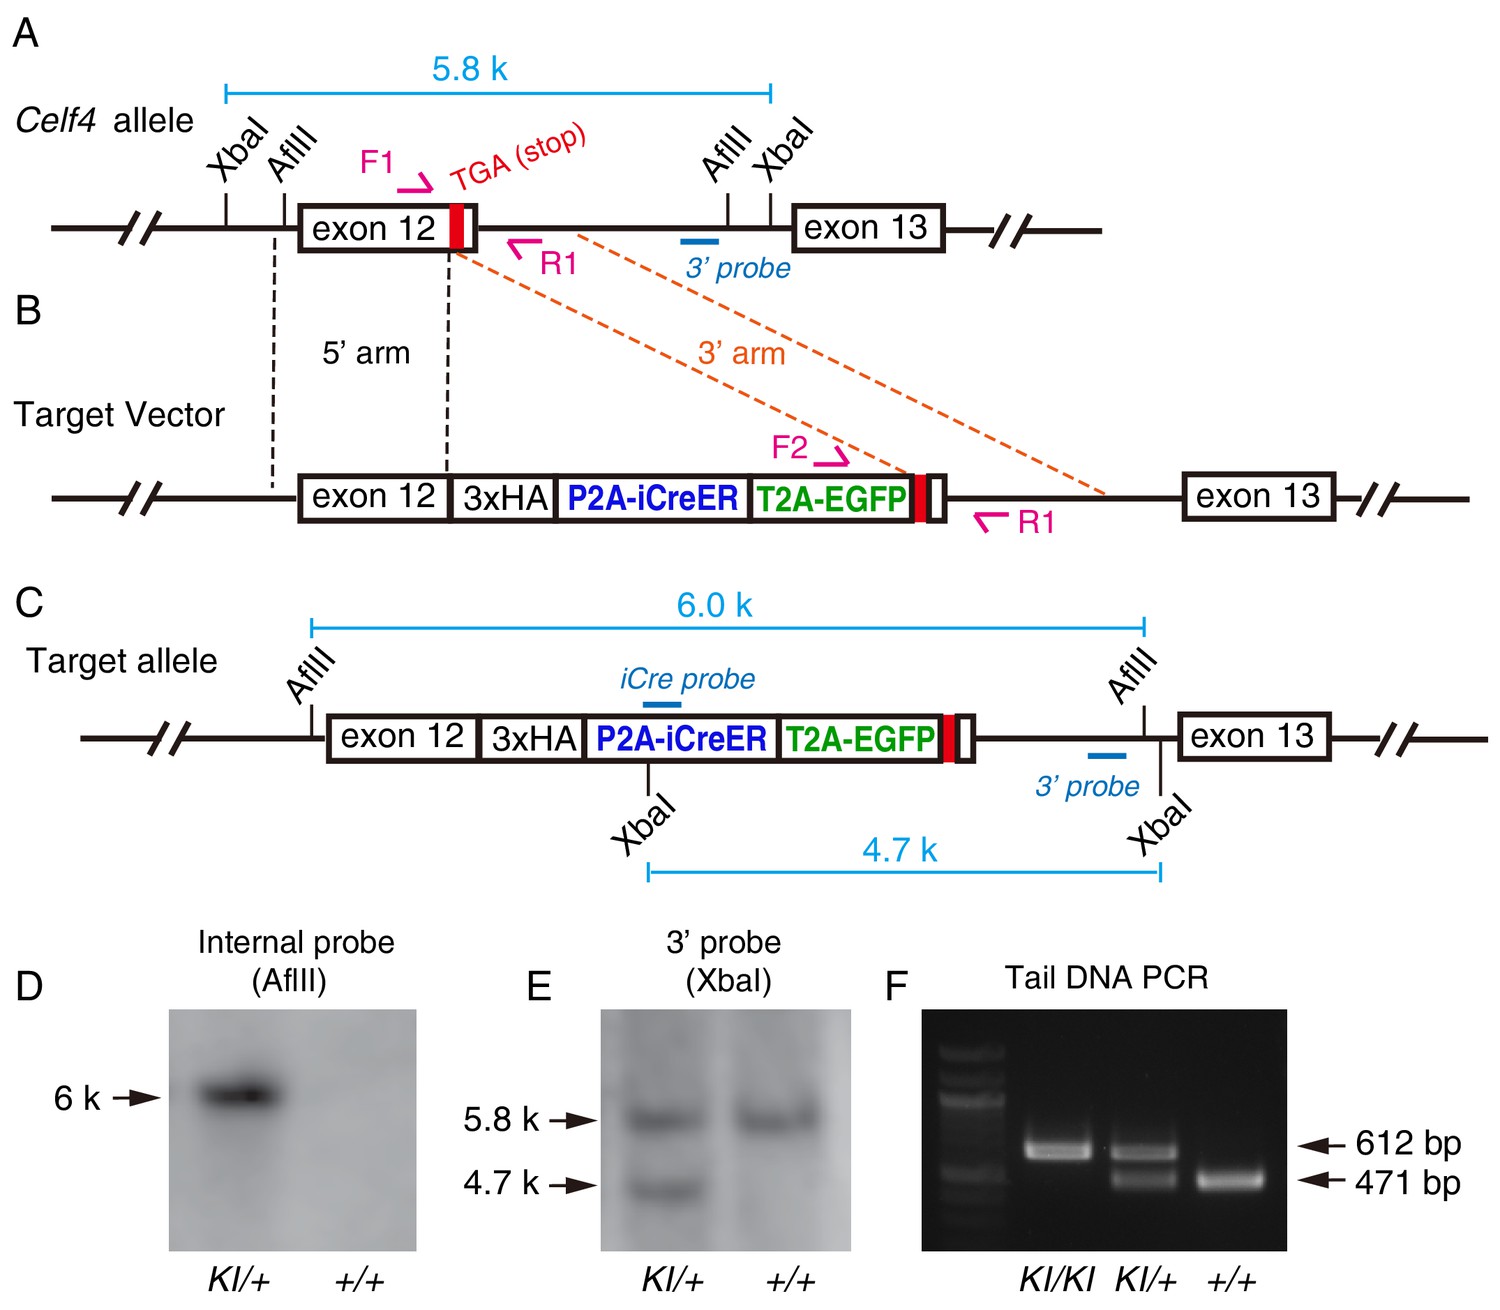
Generation of Celf4-3xHA-P2A-iCreER-T2A-EGFP (Celf4-iCreER) knockin mouse strain.
(A–C) Illustration of wild-type Celf4 locus (A), gene-targeting vector (B), and final Celf4 allele after correct gene targeting (C). (D–E) Southern blotting performed using internal probe (D) and external 3ʹ probe (E). Only the genomic DNA of the knockin allele (KI) cut with AfIII showed a 6-kbp band with the internal probe. When the genomic DNA was cut with XbaI and blotted with the 3ʹ probe, a single 5.8-kbp band was detected in the case of wild-type (+/+) mice, whereas 5.8- and 4.7-kbp bands were detected in heterozygous (KI/+) mice. The Southern blotting confirmed the lack of random genomic insertion of donor DNA. (F) In PCR-genotyping performed using three primers (F1, F2, and R1) together, the PCR amplicons of KI and wild-type alleles were 612 and 471 bp long, respectively.
Figure 6 with 2 supplements

Fate-mapping analysis of Celf4-iCreER/+; Rosa26-CAG-loxp-stop-loxp-tdTomato/+ mice across multiple ages.
(A) Illustration of fate-mapping analysis method. (B–D’’) Tamoxifen was injected at P1 and P2, and analysis was performed at P11. We detected tdTomato+ cells in SGN and VGN areas based on tdTomato endogenous fluorescence (B). Double-labeling was performed for tdTomato and Tuj1 (C–C’’) or Sox10 (D–D’’). White arrows in (C–C’’): one Tuj1+/tdTomato+ SGN. Asterisk: one SGN that was not tdTomato+ due to the mosaicism of tamoxifen-mediated Cre-recombination. Yellow arrows in (D–D’’): one tdTomato+ SGN that did not express Sox10. (E–G’’) Tamoxifen was injected at P8 and P9, and analysis was performed at P18. As before, tdTomato+ cells were observed in SGN and VGN areas (E). Double-labeling was performed for tdTomato and Map2 (F–F’’) or Sox2 (G–G’’). Arrows in (F–F’’): one Map2+/tdTomato+ SGN. Yellow arrows in (G–G’’): one tdTomato+ SGN that did not express Sox2. (H–J’’) Tamoxifen was injected at P30 and P31, and analysis was performed at P40. Again, most of the tdTomato+ cells were detected in SGN and VGN areas (H). Double-labeling was performed for tdTomato and Map2 (I–I’’) or Sox2 (J–J’’). Arrows in (I–I’’): one Map2+/tdTomato+ SGN. As expected, the SGN indicated by yellow arrows in (J–J’’) expressed tdTomato but not Sox2, confirming that glial cells did not express Celf4. (K–M) Quantification of tdTomato+ SGNs in each turn after tamoxifen injection at P1 and P2 (K), P8 and P9 (L), or P30 and P31 (M); no significant differences (n.s.) were found between different turns at each age. TMX: tamoxifen. Scale bars: 200 μm (B, E, and H) and 20 μm (C’’, D’’, F’’, G’’, I’’, and J’’).
-
Figure 6—source data 1
Percentage of tdtomato+ SGNs when tamoxifen was given at postnatal ages.
- https://cdn.elifesciences.org/articles/50491/elife-50491-fig6-data1-v2.xlsx
Figure 6—figure supplement 1
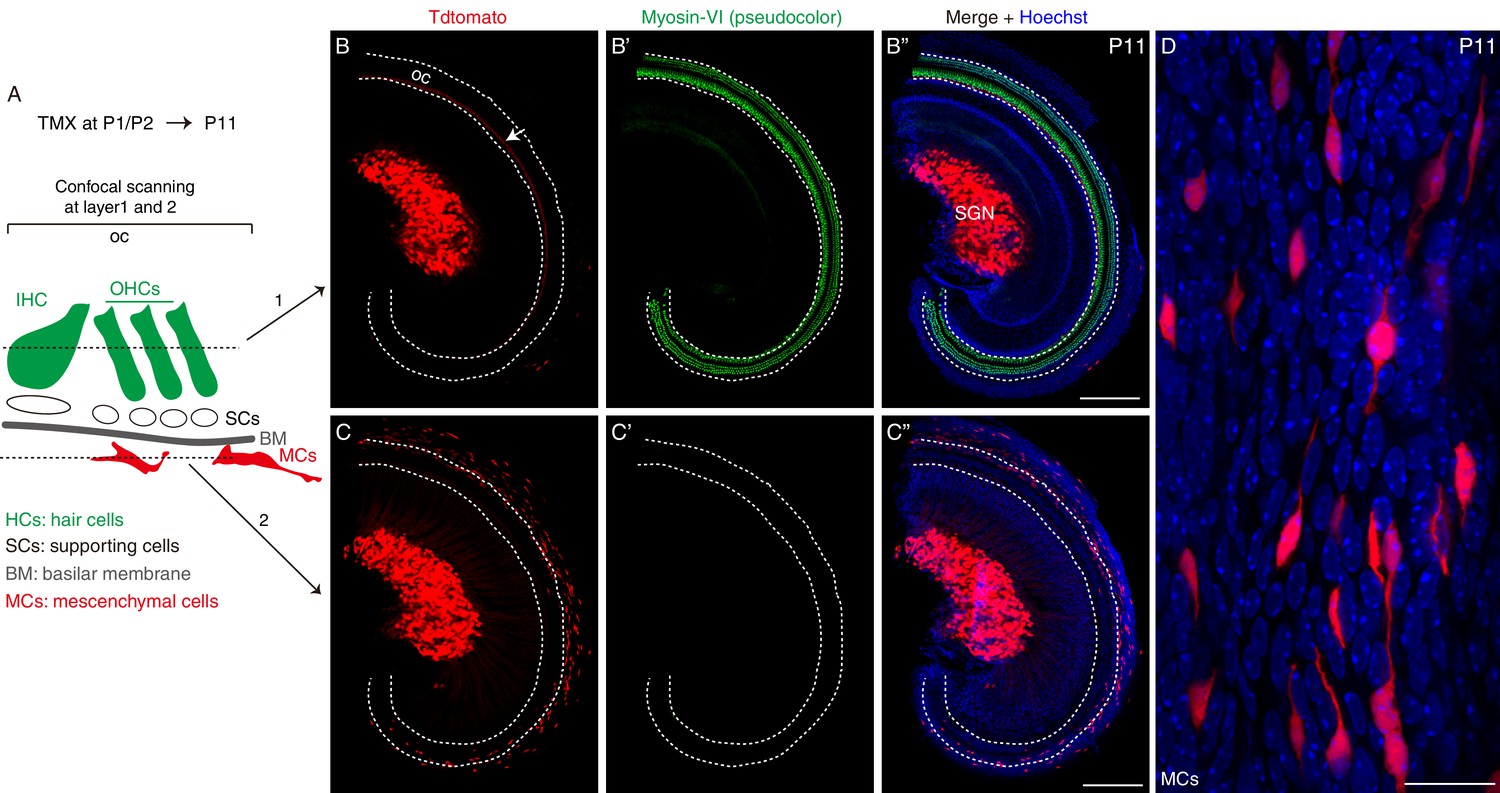
Besides SGNs, mesenchymal cells in the cochlea express Celf4.
(A) Celf4-iCreER/+; Rosa26-CAG-loxp-stop-loxp-tdTomato/+ mice were administered tamoxifen at P1 and P2 and analyzed at P11 by using the whole-mount approach, with scanning at different layers performed using a confocal microscope. The cartoon illustrates images scanned at layer 1 (B–B’’) and layer 2 (C–C’’). (B–B’’) Cochlear samples were stained for the HC marker Myosin-VI and tdTomato and imaged using a confocal microscope, with focus on the HC layer (layer 1) as illustrated in (A). White dotted lines: area containing the organ of Corti (oc). Arrow in (B): neuronal fibers close to IHCs. (C–C’’) Same cochlear sample as in (B–B’’), but with focus beneath the basilar membrane (layer two in A), where tdTomato+ mesenchymal cells were present. (D) High-resolution image of mesenchymal cells. IHC: inner hair cell; OHCs: outer hair cells. Scale bars: 200 μm (B’’ and C’’) and 20 μm (D).
Figure 6—figure supplement 2
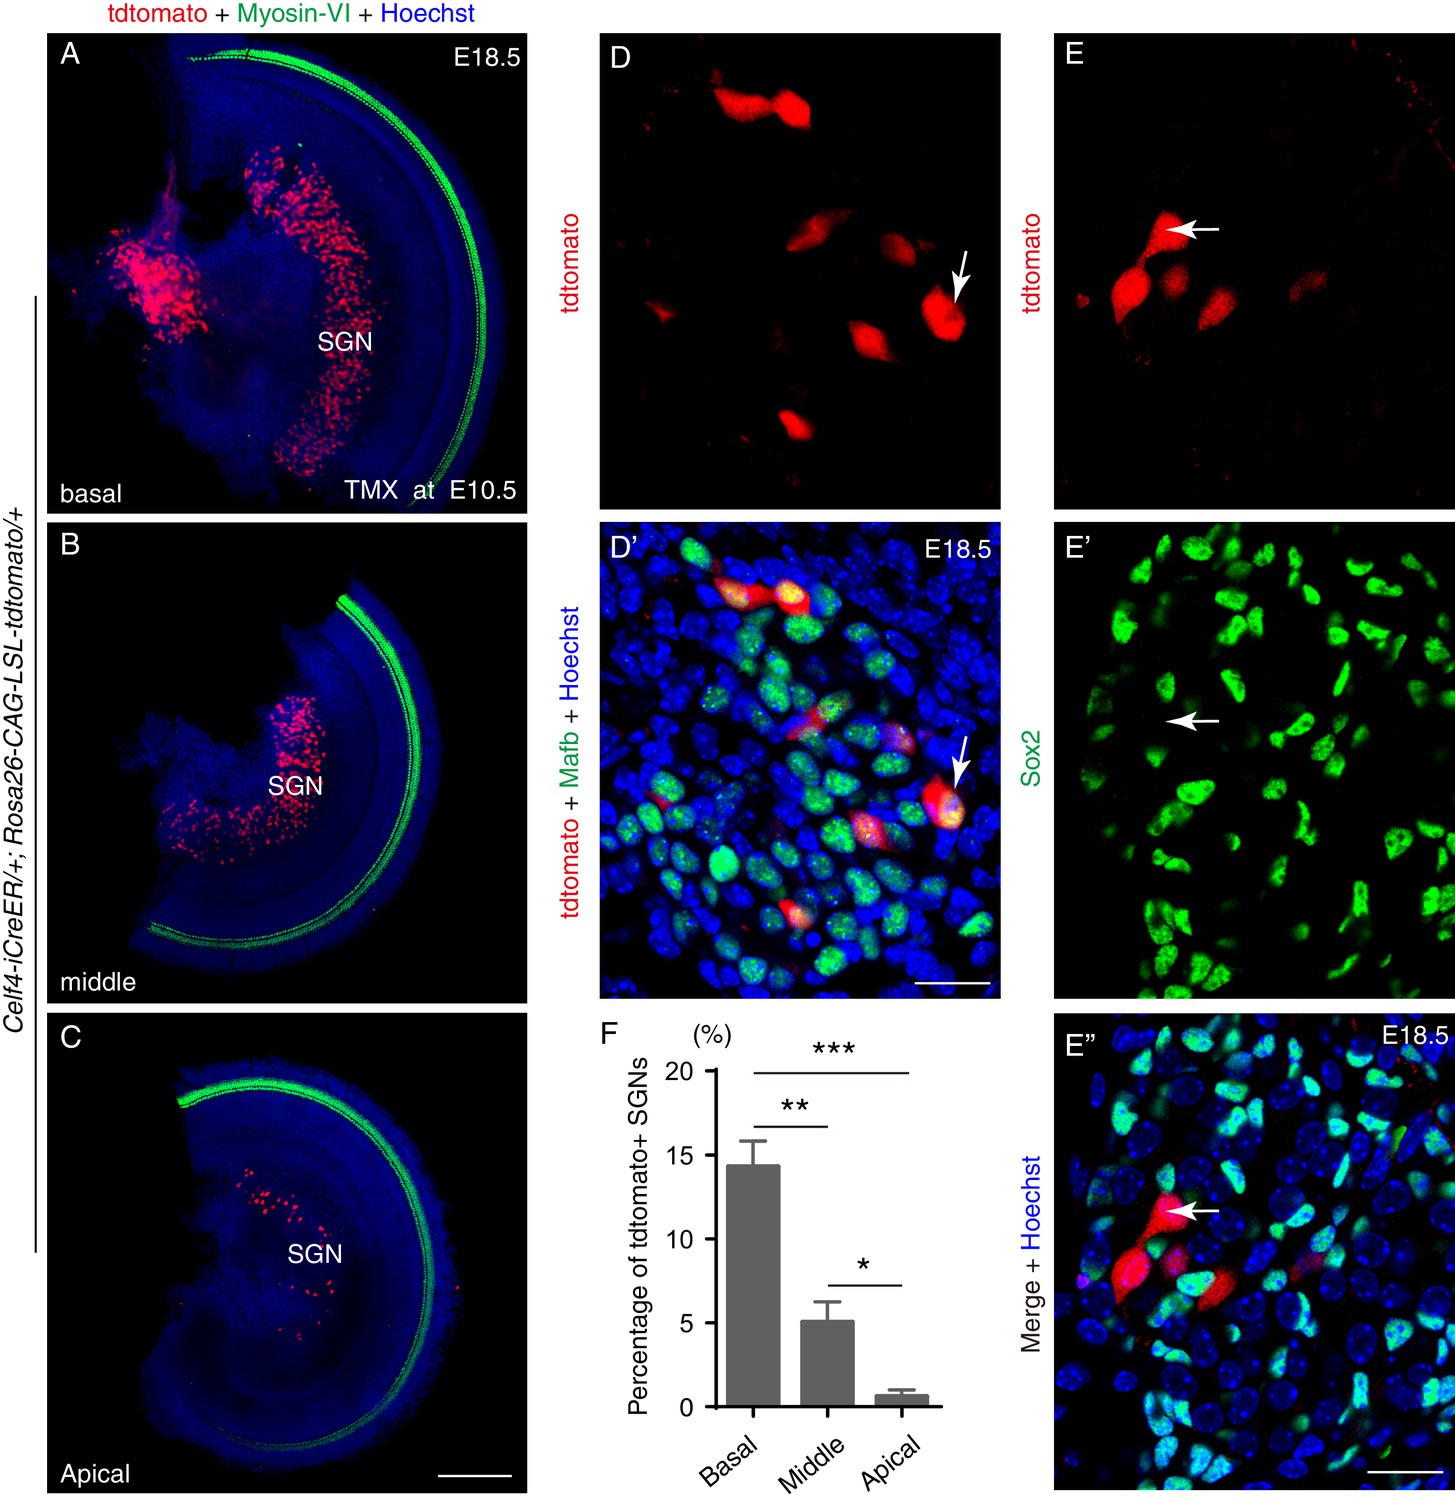
Fate-mapping analysis of Celf4-iCreER/+; Rosa26-CAG-loxp-stop-loxp-tdTomato/+ mice at E10.5.
(A–C) Co-labeling for tdTomato and Myosin-VI in whole-mount cochlear samples from Celf4-iCreER/+; Rosa26-CAG-loxp-stop-loxp-tdTomato/+ mice that were administered tamoxifen at E10.5 and analyzed at E18.5. The SGN region contained tdTomato+ cells in the basal (A), middle (B), and apical turns (C). (D–D’) Co-labeling for tdTomato and Mafb. Arrows: one Mafb+/tdTomato+ SGN. (E–E’’) Co-labeling for tdTomato and Sox2. Arrows: one tdTomato+ SGN that did not express Sox2. (F) Percentage of tdTomato+ SGNs at different turns; the percentages differed significantly between the turns. *p<0.05, **p<0.01, ***p<0.001. Scale bars: 200 μm (C) and 20 μm (D’ and E’’).
-
Figure 6—figure supplement 2—source data 1
Percentage of tdtomato+ SGNs when tamoxifen was given at E10.5.
- https://cdn.elifesciences.org/articles/50491/elife-50491-fig6-figsupp2-data1-v2.xlsx
Figure 7 with 1 supplement
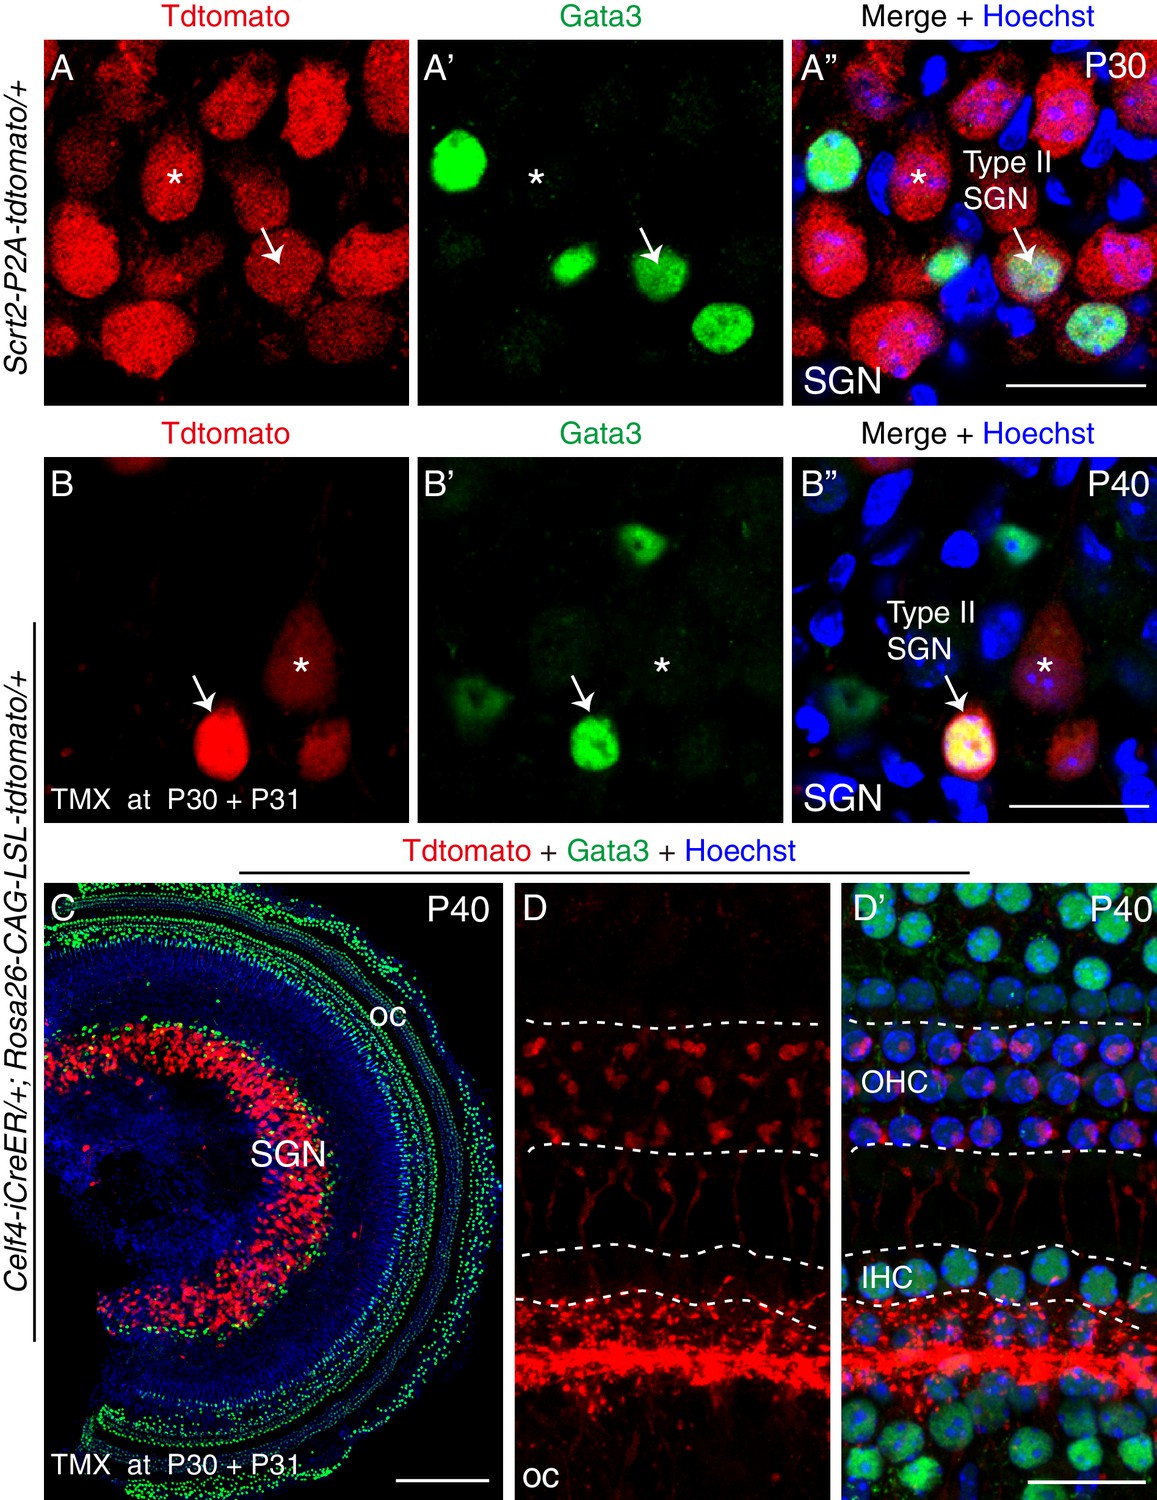
Scrt2 and Celf4 are expressed in both Type I and Type II SGNs in adult mouse cochlea.
(A–B’’) Co-labeling of tdTomato and Gata3 in cryosection cochlear samples from Scrt2-P2A-tdTomato/+ mice at P30 (A–A’’) and Celf4-iCreER/+; Rosa26-CAG-loxp-stop-loxp-tdTomato/+ mice that were administered tamoxifen at P30 and P31 and analyzed at P40 (B–B’’). Arrows: Type II SGNs, expressing both Type II marker Gata3 and tdTomato; asterisk: Type I SGNs, expressing only tdTomato; tdTomato represents expression of Scrt2 (A–A’’) and Celf4 (B–B’’). (C) Whole mount cochlear samples from Celf4-iCreER/+; Rosa26-CAG-loxp-stop-loxp-tdTomato/+ mice were co-stained with tdTomato and Gata3. Gata3 was widely expressed in cochlea including cells in organ of Corti (oc) and SGN areas. (D–D’) High-resolution confocal z-stack projection images of oc region at P40. Tdtomato+ fiber terminals were distributed in both IHCs and OHCs. Scale bars: 200 μm (C), 20 μm (A’’, B’’ and D’).
Figure 7—figure supplement 1
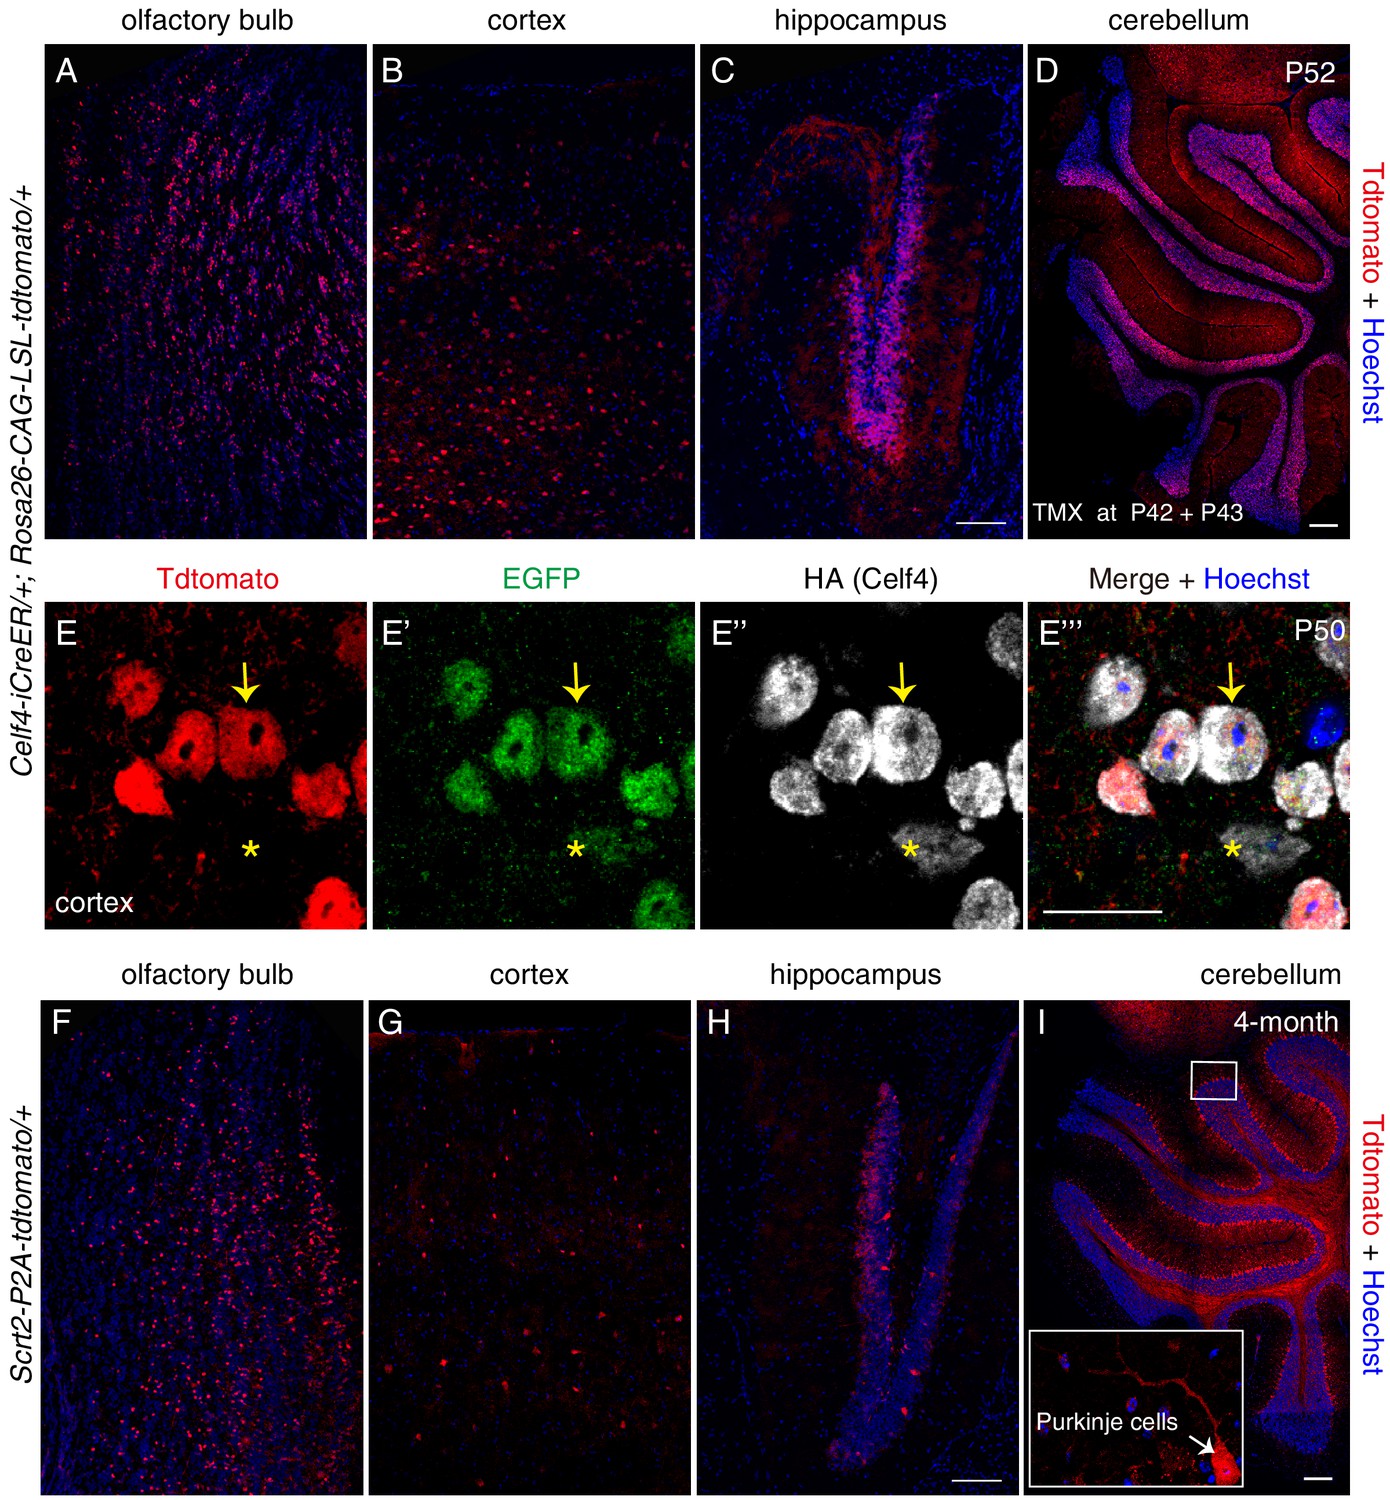
Scrt2 and Celf4 are also expressed in adult brain.
(A–E’’’) We detected tdTomato+ cells in the olfactory bulb (A), cortex (B), hippocampus (C), and cerebellum (D) of Celf4-iCreER/+; Rosa26-CAG-loxp-stop-loxp-tdTomato/+ mice that were administered tamoxifen at P42 and P43 and analyzed at P52. (E–E’’’) High-resolution image of cortex tissues labeled for EGFP, HA (Celf4), and endogenous tdTomato. Arrows: one neuron that was tdTomato+/EGFP+/HA+. Asterisks: another neuron, showing weaker EGFP and HA signals; in this neuron, Cre-mediated recombination did not occur and tdTomato was not expressed. (F–I) We also detected tdTomato+ cells in the olfactory bulb (F), cortex (G), hippocampus (H), and cerebellum (I) of 4-month-old Scrt2-tdTomato/+ mice. Inset in (I): high-resolution image of boxed region in (I). Arrow: Purkinje cell with long branched dendrites. Scale bars: 200 μm (D and I), 100 μm (C and H), and 20 μm (E’’’).
Tables
Key resources table
| Reagent type (species) or resource | Designation | Source or reference | Identifiers | Additional information |
|---|---|---|---|---|
| Strain, strain background (Mus musculus) | ShhCre/+ | Liu et al., 2010 | Jackson Lab | stock #: 005622 |
| Strain, strain background (Mus musculus) | Atoh1-CreER+ | Chow et al., 2006 | MMRRC | stock #: 029581-UNC |
| Strain, strain background (Mus musculus) | vGlut3-iCreER/+ | Li et al., 2018 | Available upon request from Liu Lab | Please contact (zhiyongliu@ion.ac.cn) |
| Strain, strain background (Mus musculus) | Scrt2-P2A-tdTomato/+ | It is a knockin mouse line where tdTomato can reflect Scrt2 mRNA expression pattern | Jackson Lab | stock #: 034390 (will be deposited soon) |
| Strain, strain background (Mus musculus) | Celf4-3xHA-P2A-iCreER-T2A-EGFP/+ | It is a knockin mouse line where HA is tagged at Celf4 protein c terminus. In addition, iCreER and EGFP are controlled by Celf4 promoter/enhancer | Jackson Lab | stock #: 034391 (will be deposited soon) |
| RNA extraction kit | PicoPure RNA Isolation Kit | Thermo Scientific | Cat#: KIT0204 | Extracting RNA from isolated cells |
| cDNA generation kit | Ovation RNA-Seq V2 | Tecan Genomics | Cat#:7102–32 | Converting RNA to cDNA |
| Library construction kit | Ovation Rapid DR Multiplex System | Tecan Genomics | Cat#: 0319–32 | Generating sequencing library with eight samples multiplexing |
| Digestion enzyme | Protease | Sigma | Cat#: P5147 | Digesting inner ear tissues |
Additional files
-
Supplementary file 1
SGN genes with different dynamic patterns.
- https://cdn.elifesciences.org/articles/50491/elife-50491-supp1-v2.xlsx
-
Supplementary file 2
Genotyping and q-PCR primers.
- https://cdn.elifesciences.org/articles/50491/elife-50491-supp2-v2.xlsx
-
Supplementary file 3
Sequences of 8 RNA probes.
- https://cdn.elifesciences.org/articles/50491/elife-50491-supp3-v2.docx
-
Transparent reporting form
- https://cdn.elifesciences.org/articles/50491/elife-50491-transrepform-v2.docx
Download links
A two-part list of links to download the article, or parts of the article, in various formats.
Downloads (link to download the article as PDF)
Open citations (links to open the citations from this article in various online reference manager services)
Cite this article (links to download the citations from this article in formats compatible with various reference manager tools)
Comprehensive transcriptome analysis of cochlear spiral ganglion neurons at multiple ages
eLife 9:e50491.
https://doi.org/10.7554/eLife.50491


