Myofibril diameter is set by a finely tuned mechanism of protein oligomerization in Drosophila
- McGill University, Canada
Figures
Figure 1 with 2 supplements
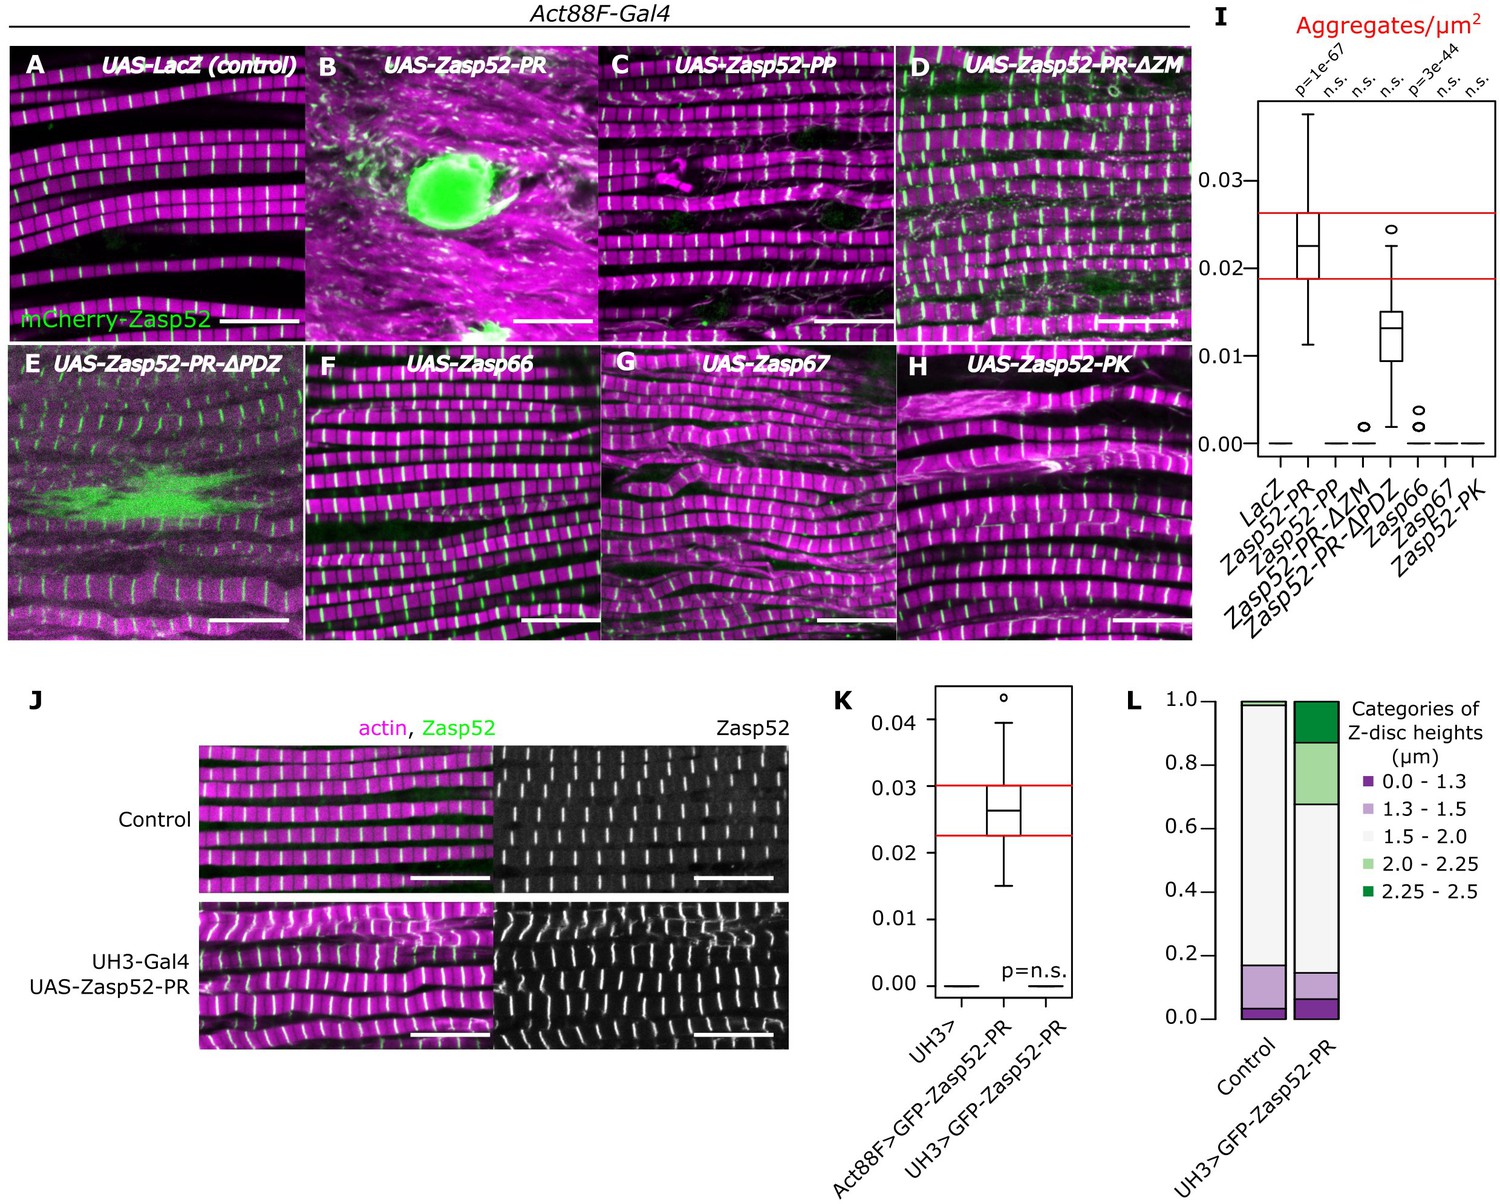
Aggregate formation upon Zasp overexpression.
(A–H) Confocal images of IFM in control or Zasp overexpression conditions using Act88F-Gal4; actin filaments are marked in magenta and Z-discs in green. (A) In control flies, sarcomeres are regular with Z-discs located in the center of the actin signal. (B) Upon GFP-Zasp52-PR overexpression sarcomere structure is severely affected and big Zasp aggregates appear. (C) The overexpression of Flag-Zasp52-PP, an isoform lacking all LIM domains, has a modest sarcomere phenotype and aggregation is not observed. (D) Overexpression of a mutated form of Zasp52-PR with a deletion in the ZM domain does not form aggregates. (E) Overexpression of a mutated form of Zasp52-PR carrying a deletion in the PDZ domain causes small aggregates and sarcomere phenotypes. (F and G) The overexpression of the other Zasp paralogs, Zasp66 or Zasp67, does not cause aggregates. (H) Overexpression of GFP-Zasp52-PK, a smaller isoform of Zasp52 lacking LIM2, 3, and 4 domains affects sarcomere structure, but aggregation is infrequent. (I) Estimation of Z-disc aggregates in all overexpression conditions, n = 10 muscle fibers. (J) Confocal images of IFM in control or in mild overexpression of GFP-Zasp52-PR using UH3-Gal4. (K) Estimation of Z-disc aggregates in mild overexpression of GFP-Zasp52-PR. (L) Frequency plot of Z-disc sizes. Z-discs are bigger when GFP-Zasp52-PR is overexpressed using UH3-Gal4. Scale bars, 10 µm. p-Values in panel I and K were calculated using Welch’s two-sample t-test.
-
Figure 1—source data 1
Aggregate frequency estimates in Zasp overexpressions.
- https://cdn.elifesciences.org/articles/50496/elife-50496-fig1-data1-v3.xlsx
Figure 1—figure supplement 1
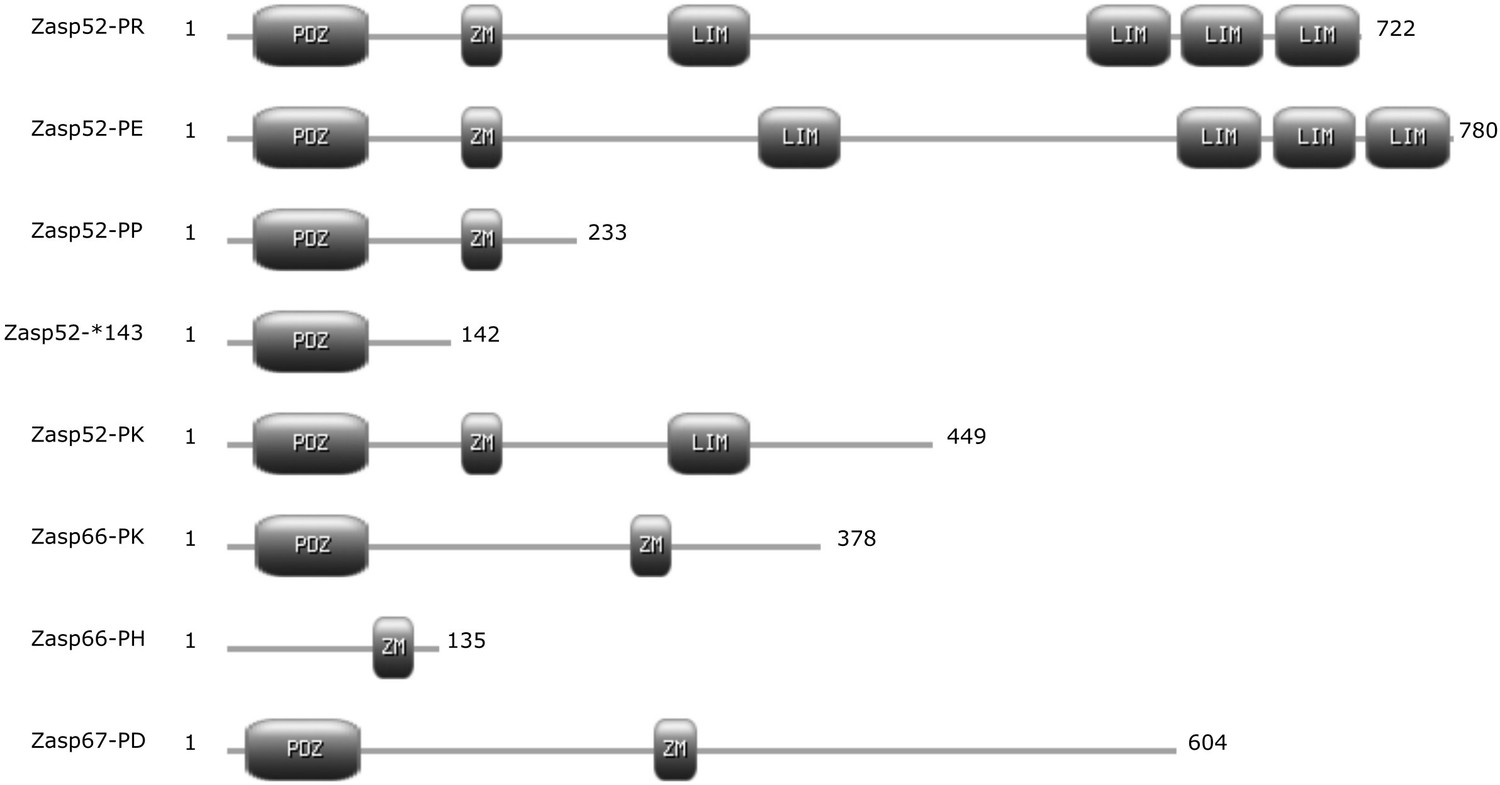
Differences in Zasp isoforms.
Cartoon of selected Zasp protein isoforms with annotated protein domains. Isoforms are named according to FlyBase. Numbers at each end represent the length in amino acids. ZM, Zasp-like motif.
Figure 1—figure supplement 2
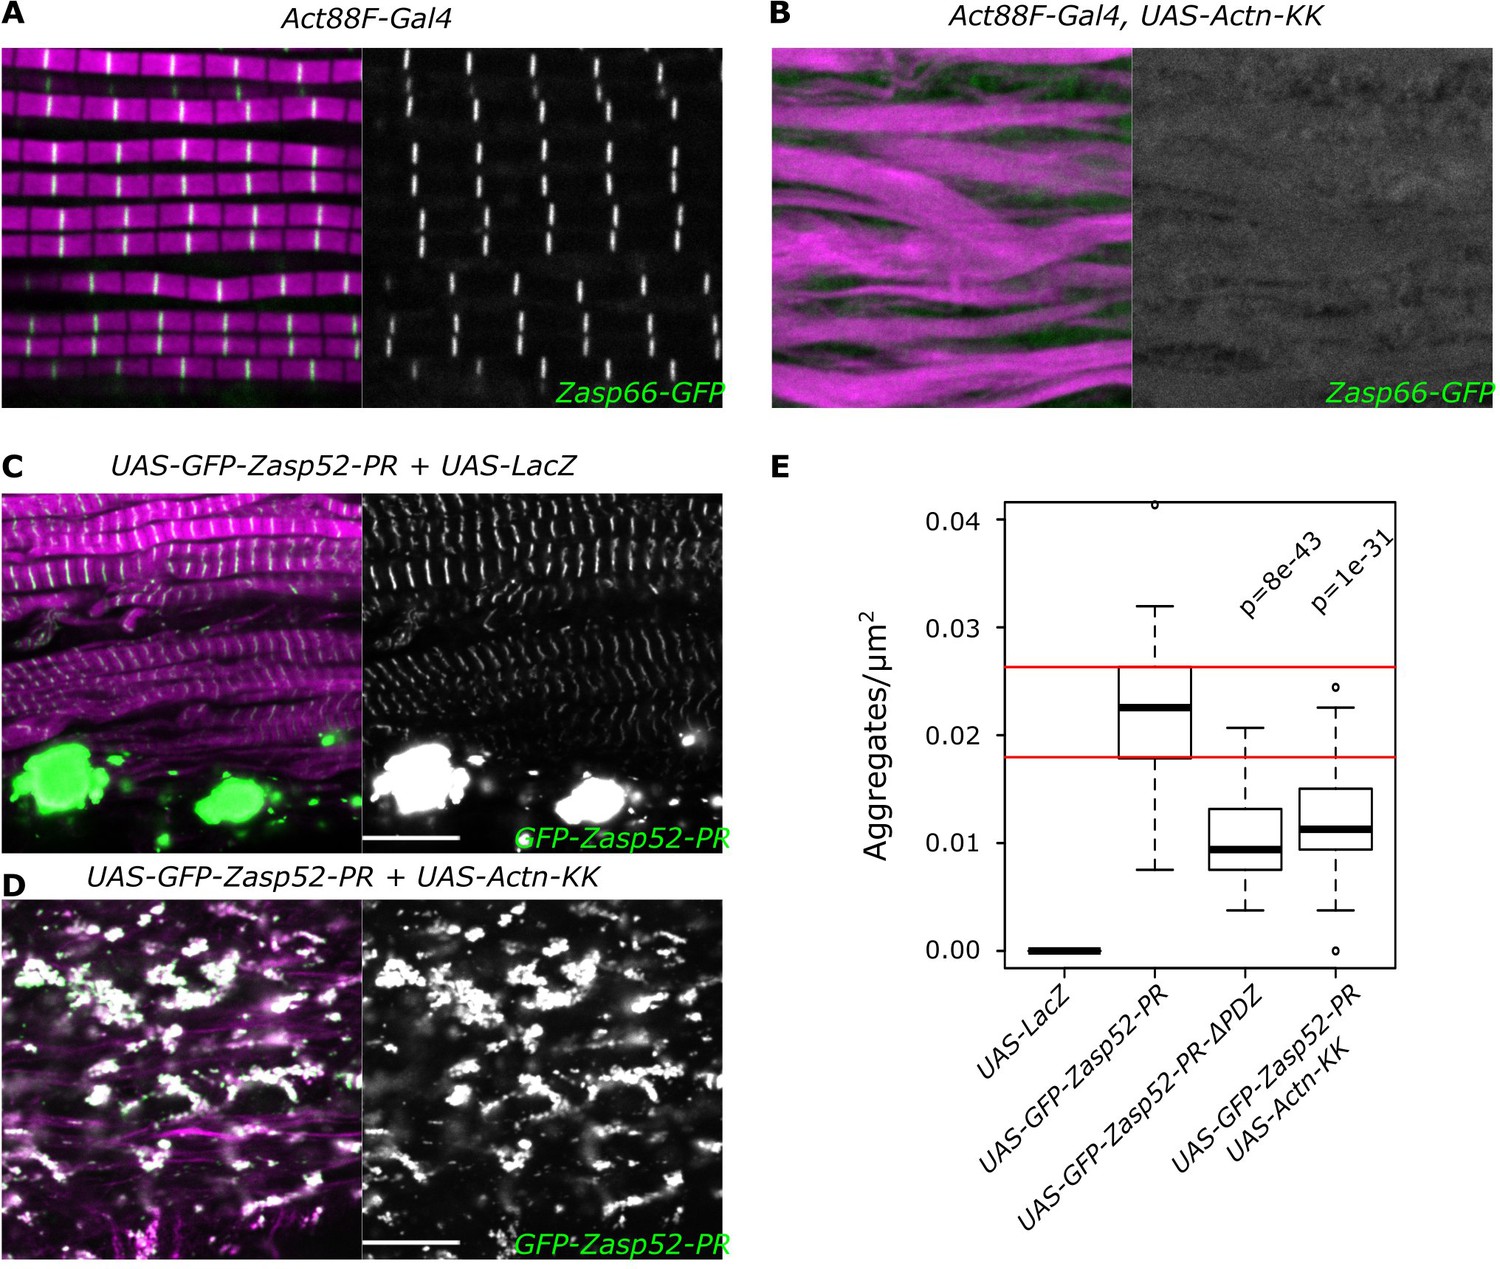
Zasp-mediated aggregation depends only partially on α-actinin.
(A, B) Confocal images of IFM in control or α-actinin depleted conditions; actin filaments are marked in magenta and Z-discs marked by Zasp66-GFP are shown in green. (A) Control sarcomeres are regular with Z-discs located in the center of the actin signal. (B) In α-actinin-depleted muscles sarcomere structure is severely perturbed, and Z-discs are rarely visible. (C, D) Confocal images of IFM with aggregates caused by the overexpression of Zasp52-PR. (C) Overexpression of Zasp52-PR produces aggregates. (D) Overexpression of Zasp52-PR in α-actinin-depleted muscles produces smaller aggregates. (E) Estimation of Z-disc aggregates in all overexpression conditions, n = 10 muscle fibers. Act88F-Gal4 was used in all panels. Scale bars, 10 µm. p-Values in panel E were calculated using Welch’s two-sample t-test.
Figure 2 with 1 supplement

Y2H assays reveal domains involved in homo/heterodimerization.
(A) Yeast two-hybrid assays between the three Zasp paralogs. Images of double-transformed yeast grown in selective -Ade/-His/-Leu/-Trp plates. Serial dilutions are shown from left to right (OD: 0.1, OD: 0.01, and OD: 0.001). Zasp52-PK dimerizes with itself and with the longer isoform Zasp52-PE. Zasp66 interacts with Zasp52-PK and Zasp52-PE. Zasp67 interacts with Zasp52-PK and Zasp52-PE. Negative controls using the DNA-binding domain (bait, pGAD-T7) or the Activating domain of Gal4 (prey, pGBK-T7) are shown. (B) Y2H assays testing the interaction between all protein domains encoded by the Zasp52 gene and Zasp52-PK, Zasp66-PK, or Zasp67-PD proteins. Zasp52-PK interacts with isolated ZM and LIM domains, Zasp66-PK and Zasp67-PD interact only with some LIM domains. LIM1A, LIM1B, LIM2A, and LIM2B are different splice isoforms of LIM1 and LIM2 domains. (C) Proposed model of Zasp homo/heterodimerization. The LIM domains bind the ZM domain. Zasp52-PK dimerization occurs through two ZM/LIM pairs. The heterodimerization between Zasp52-PK and Zasp66-PK or Zasp67-PD occurs through only one ZM/LIM-binding site. Zasp66-PH is a small isoform that only contains a ZM domain. (D) Y2H assays mapping the interaction between different Zasp52 LIM domains to Zasp66-PK using truncation mutants. (E) Y2H assays testing the interaction between the ZM only isoform Zasp66-PH, and the individual protein domains encoded by Zasp52.
Figure 2—figure supplement 1
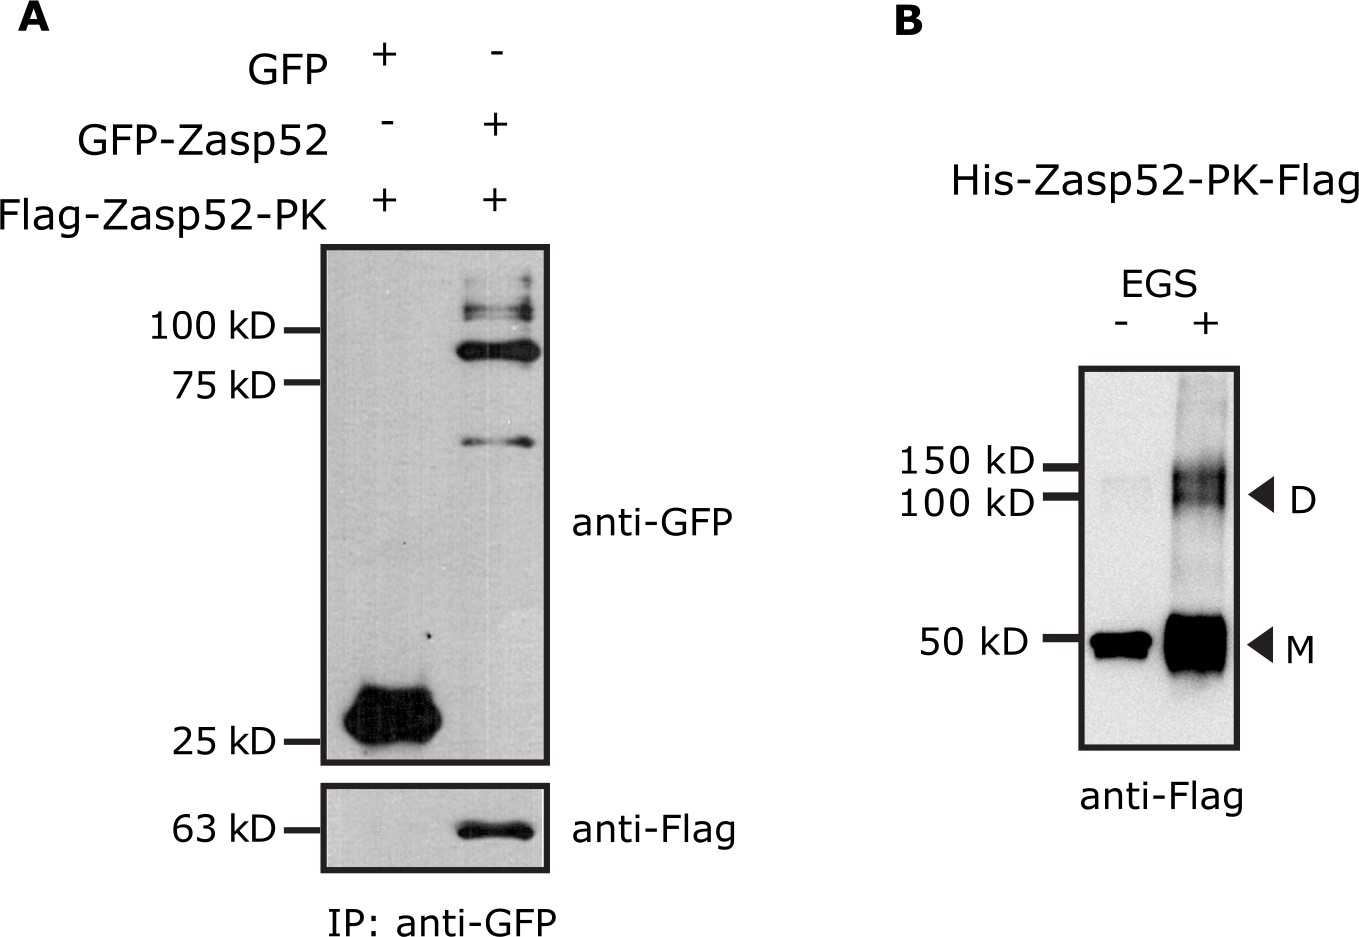
Zasp self-interaction by co-IP and chemical crosslinking.
(A) Endogenous Zasp52 tagged with GFP was purified from thorax extracts via GFP beads. GFP-Zasp52 co-immunoprecipitates Flag-Zasp52-PK. GFP alone was used as negative control. (B) Purified His-Zasp52-PK-Flag from bacteria was treated with the chemical crosslinker ethylene glycol bis-sulfosuccinimidyl succinate (EGS) and then analyzed by SDS-Page. In addition to monomers (M, 50 kD), dimers (D) are observed upon EGS treatment.
Figure 3 with 1 supplement
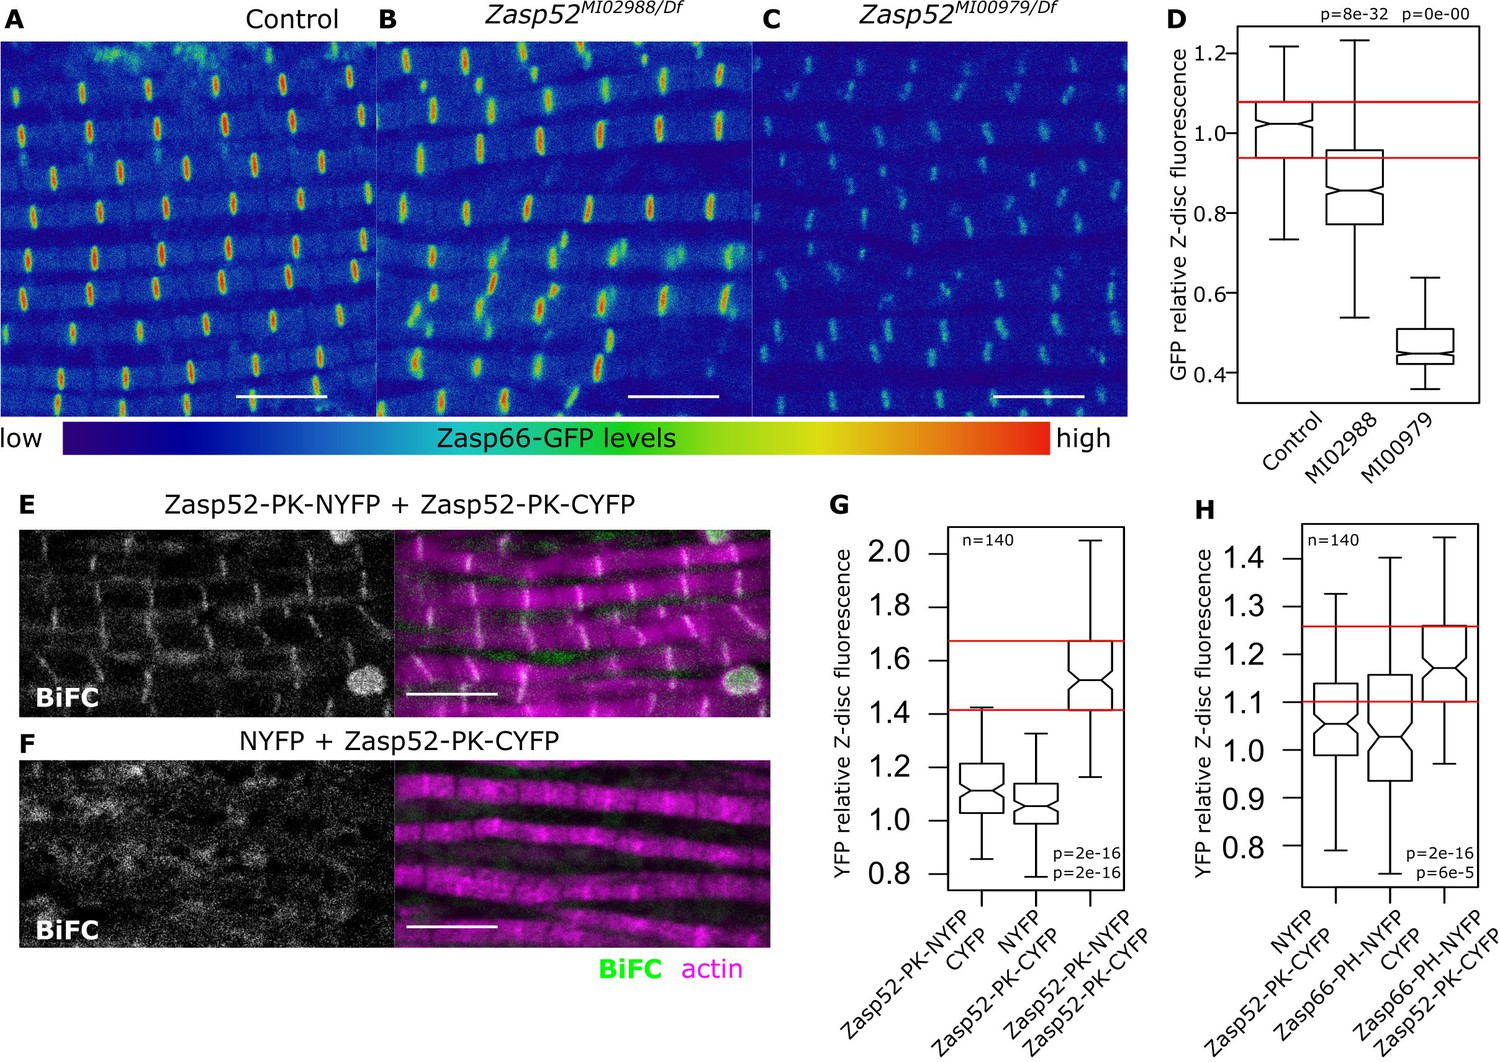
Zasp interaction in vivo at the Z-disc.
(A–C) Confocal images of Zasp66-GFP IFM in control and Zasp52 mutant backgrounds. Zasp66-GFP levels are lower in Zasp52MI00979 mutant than in the control or in Zasp52MI02988 mutants. (D) Boxplot of Zasp66-GFP intensities in control and Zasp52 mutant backgrounds. (E, F) Examples of a negative BiFC control (F) and a positive BiFC signal (E) suggesting Zasp52-PK dimerizes at the Z-disc. (G, H) Plots of the BiFC fluorescence intensity values relative to background noise. Positive BiFC fluorescence is detected between Zasp52-PK and Zasp52-PK (G) and between Zasp52-PK and Zasp66-PH (H). Act88F-Gal4 was used to drive expression of NYFP- or CYFP-tagged proteins. Scale bar, 5 µm. p-Values in panels D, G, and H were calculated using Welch’s two-sample t-test.
-
Figure 3—source data 1
Zasp66 levels and BiFC values.
- https://cdn.elifesciences.org/articles/50496/elife-50496-fig3-data1-v3.xlsx
Figure 3—figure supplement 1

Zasp52 gene map and BiFC.
(A) Cartoon representing the Zasp52 genomic locus with selected transcripts, two alternative transcription start sites, protein domains, and three MiMIC lines introducing an artificial exon which consists of a splice acceptor followed by stop codons for all three reading frames. (B) Confocal images of Actn-GFP IFM in control and Zasp52 mutant backgrounds. Actn-GFP levels are comparable between the control and Zasp52 mutants. (C) Boxplot of Actn-GFP intensities in control and Zasp52 mutant backgrounds. p-Values were calculated using one-sided Welch’s two-sample t-test. (D) Representation of the BiFC principle. (E) The ZM-only Zasp66-PH isoform tagged with a Venus fluorescent protein localizes to the Z-disc, marked by Zasp52-mCherry.
Figure 4
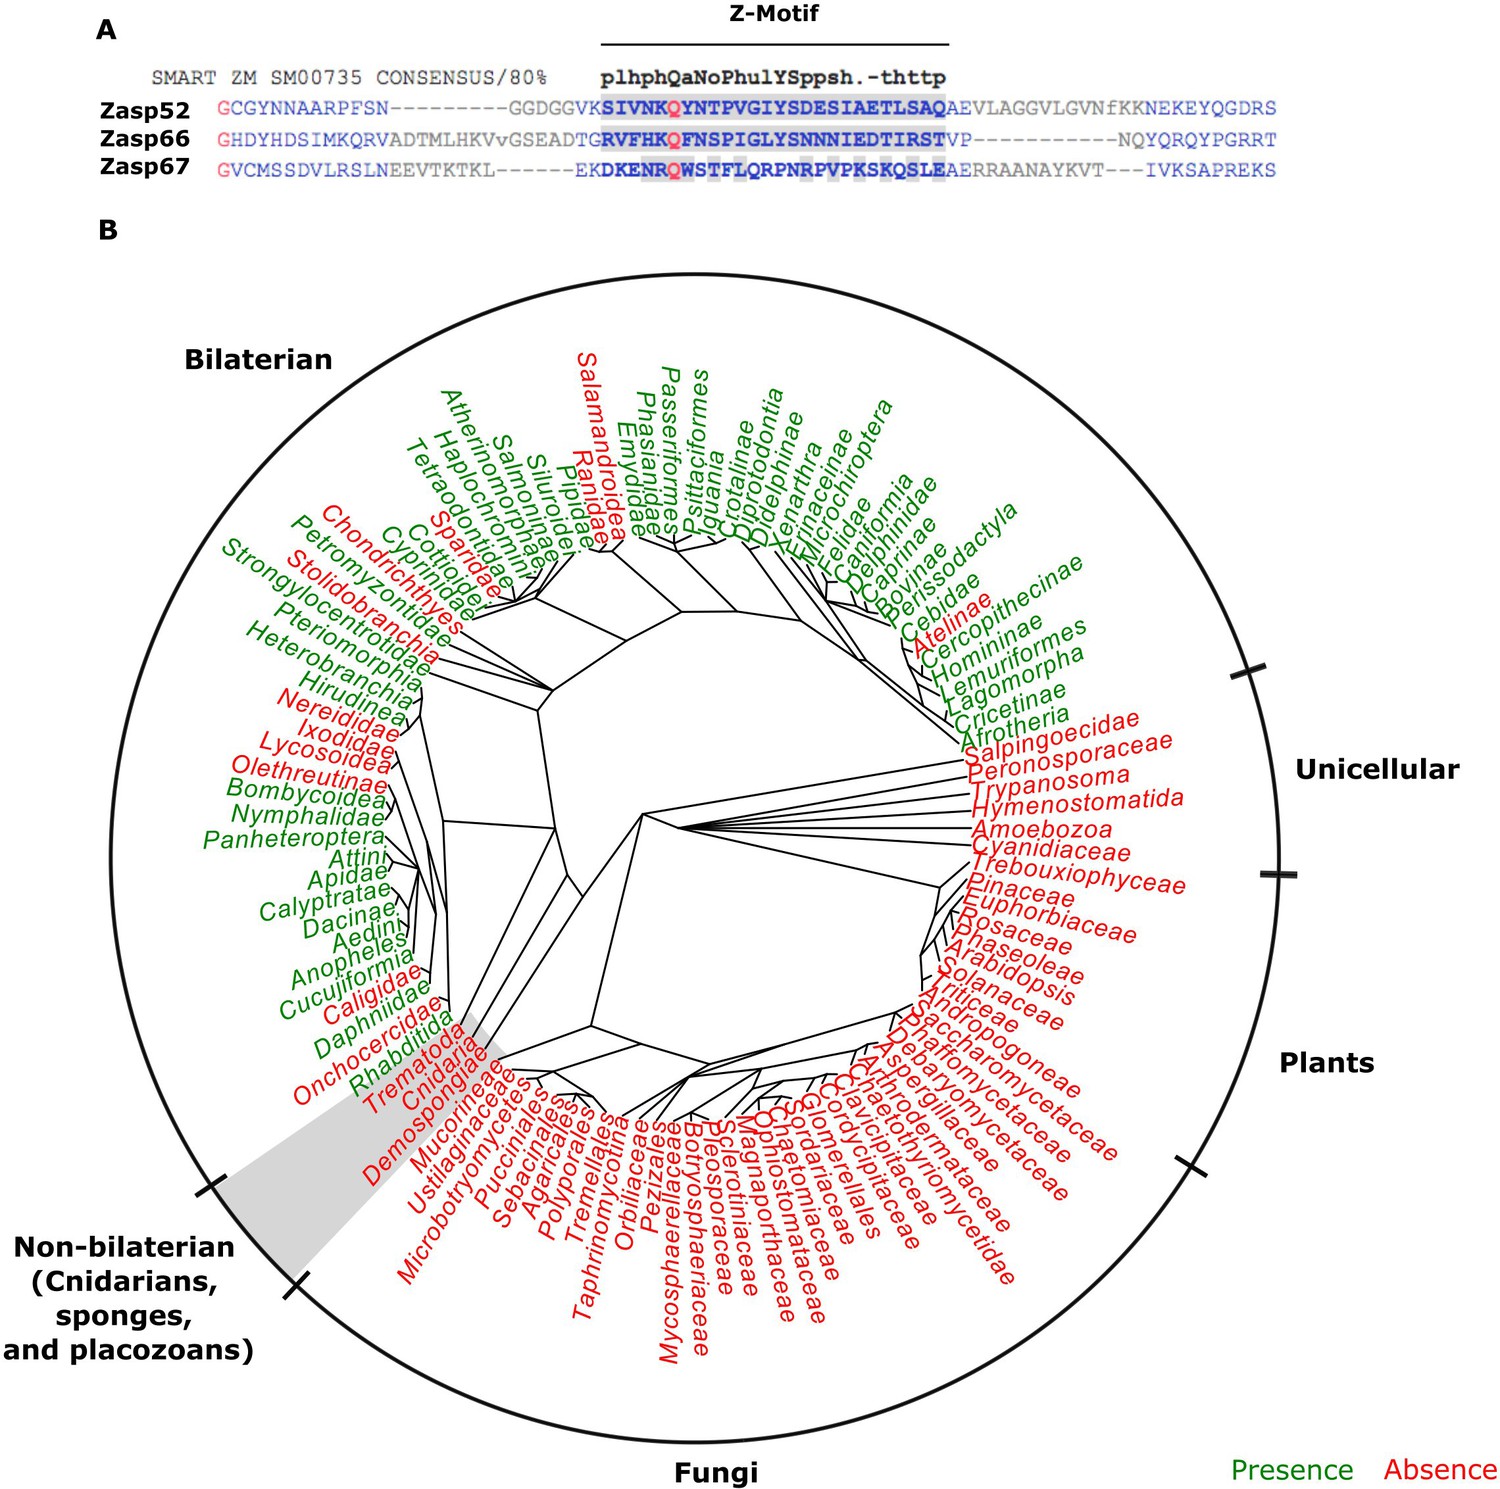
The evolution of the ZM domain.
(A) Protein sequence alignment between the three Zasp paralogs in flies and the ZM consensus sequence SMART:SM00735. Similar amino acids to the consensus are highlighted in gray. (B) Radial phylogenetic tree of selected eukaryotic lineages with annotated presence of the ZM domain from the PFAM domain database (PFAM: PF15936). The ZM domain is restricted to bilateral animals.
Figure 5 with 1 supplement

Balance of ZM to LIM domains sets the diameter of the Z-disc.
(A) Proposed model of Z-disc growth and aggregate formation. In nascent Z-bodies, Zasp binds α-actinin and forms a homodimer between its ZM and LIM domains. During the early growth phase, Zasp growing isoforms use their free LIM domains to recruit more Zasp molecules through the ZM domain, thus growing the Z-disc. At later stages, growth is downregulated by the incorporation of blocking isoforms of Zasp, which are recruited to the Z-disc but cannot recruit further proteins because they lack LIM domains. (B) RNAseq data plots showing the expression of selected Zasp isoforms at different developmental timepoints. The y-axis corresponds to the log of the number of transcripts per million (TPM) and the x-axis to hours after pupa formation. Isoforms were classified as blocking isoforms (0 or 1 LIM domain) or growing isoforms (two or more LIM domains). (C) Confocal microscopy image of IFM cross sections expressing Zasp52-GFP (green) and stained for actin (magenta). (D) Differential distribution of Zasp growing and blocking isoforms throughout the Z-disc. Images of false-colored denoised Z-discs. Zasp52-growing isoforms are more concentrated at the center of the disc, Zasp66 and Zasp67 are mostly concentrated in the periphery. Color scale is shown at the right. (E) Profile plots of relative intensity values at the Z-disc diameters from at least 10 individual Z-discs. Growing isoforms peak at the center of the Z-discs, blocking isoforms have two peaks. Scale bars in D, 1 µm.
-
Figure 5—source data 1
Line intensity profile plots.
- https://cdn.elifesciences.org/articles/50496/elife-50496-fig5-data1-v3.xlsx
Figure 5—figure supplement 1
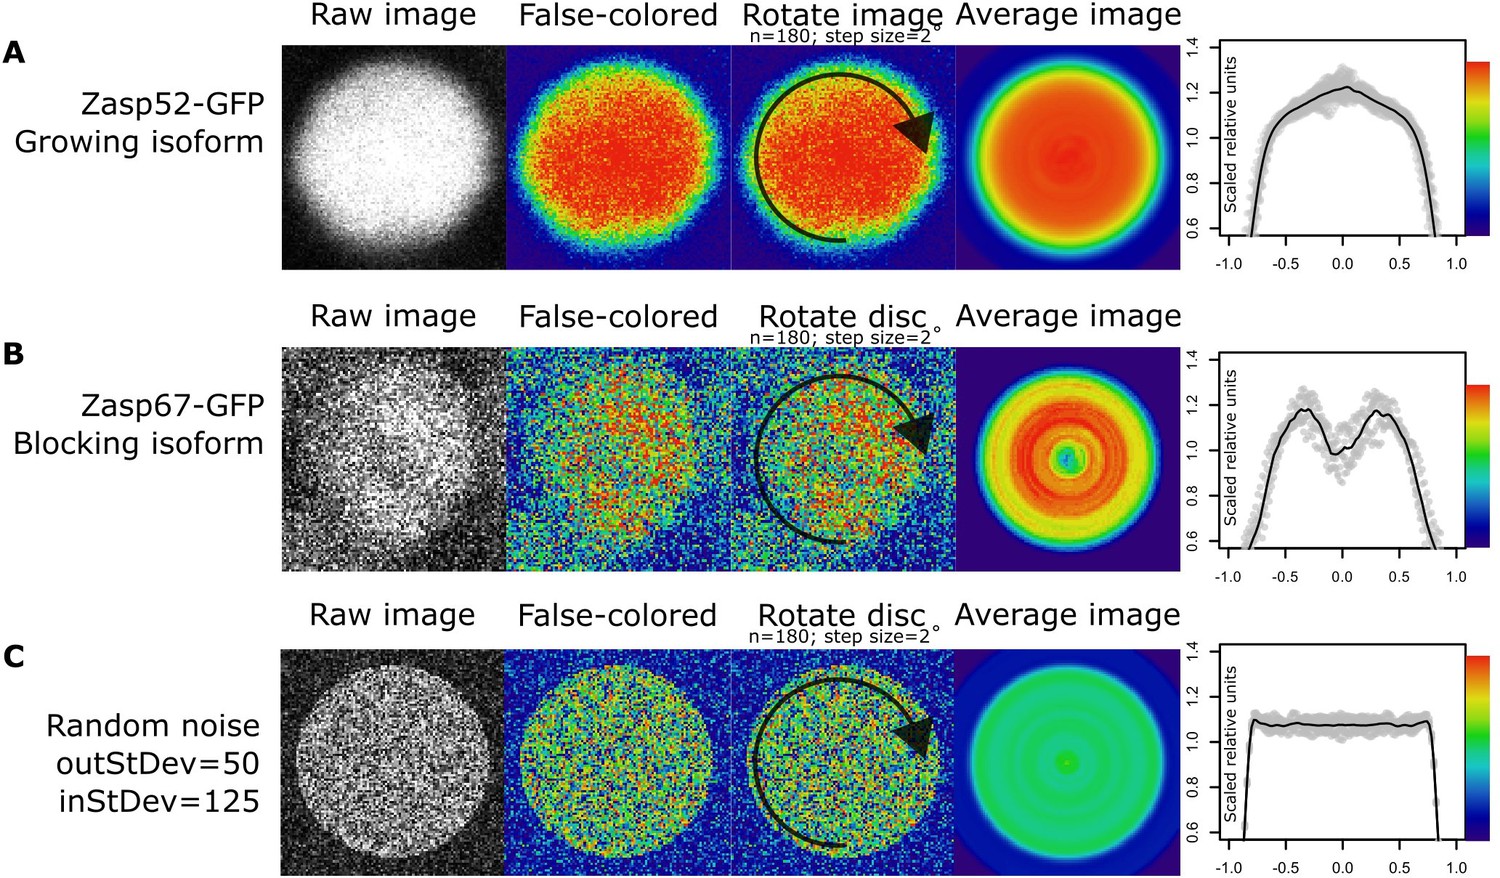
Rotation smoothing of cross section Z-disc images.
(A–C) Steps for obtaining relative Zasp concentrations throughout single Z-discs. First, a single properly oriented Z-disc is selected from a confocal image (raw image). Then, we changed the display from gray look-up table mode to physics look-up table mode. Higher concentration of Zasp52-GFP at the center of the disc is observed at this stage (A; false colored). Higher concentration of Zasp67-GFP at the periphery of the disc is observed at this stage (B; false colored). Then, we rotated the Z-disc image by 2 degrees 180 times, and we calculated the average from all the resulting images (average image). Finally, we calculated the relative fluorescence intensities. (C) An artificially generated disc image from random noise treated in the same way as panels A and B does not show any obvious pattern.
Figure 6 with 1 supplement

Balance of isoforms dictates Z-disc size.
(A and B) Confocal microscopy images of control and Zasp52MI00979 mutant. Actin filaments are marked in magenta and Z-discs in green. The Zasp52MI00979 mutant has smaller and frayed Z-discs. (C) Frequency plot of Z-disc sizes in control, Zasp52MI02988, and Zasp52MI00979 mutants. Small Z-discs are only observed in the Zasp52MI00979 mutant. (D) Overexpression of the Zasp52-PP blocking isoform also results in smaller Z-discs. The small Z-disc phenotype is not observed in Zasp52-Stop143, lacking the ZM domain. (E) Small Z-disc phenotypes are observed upon overexpression of Zasp66 and Zasp67. (F and G) Boxplots of the Zasp52 fluorescence intensities upon overexpression of different blocking isoforms. (F) Zasp52-mCherry levels decrease upon overexpression of Zasp52-PP but are restored if the ZM domain of Zasp52-PP is deleted (Zasp52-*143). (G) Zasp52-mCherry levels also decrease upon overexpression of Zasp66 and Zasp67. Act88F-Gal4 was used for overexpression experiments in panels D-G. Scale bars, 5 µm. p-Values in panels C-E were calculated using Fisher's exact test for count data. p-Values in panels F and G were calculated using Welch’s two-sample t-test.
-
Figure 6—source data 1
Z-disc diameter estimates and Zasp52 levels.
- https://cdn.elifesciences.org/articles/50496/elife-50496-fig6-data1-v3.xlsx
Figure 6—figure supplement 1

Actinin levels in different Zasp overexpression backgrounds.
(A) Confocal images of Zasp52-mCherry in control and different Zasp overexpression backgrounds. Quantification shown in Figure 6F,G. (B) Confocal images of Actn-GFP in control and different Zasp overexpression backgrounds. Relative fluorescence levels are similar in all conditions. (C) Boxplot of the Actn-GFP fluorescence intensities upon overexpression of different blocking isoforms. Act88F-Gal4 was used for overexpression experiments. Scale bars, 5 µm. p-Values were calculated using Welch’s two-sample t-test with Bonferroni correction for multiple comparisons.
Figure 7
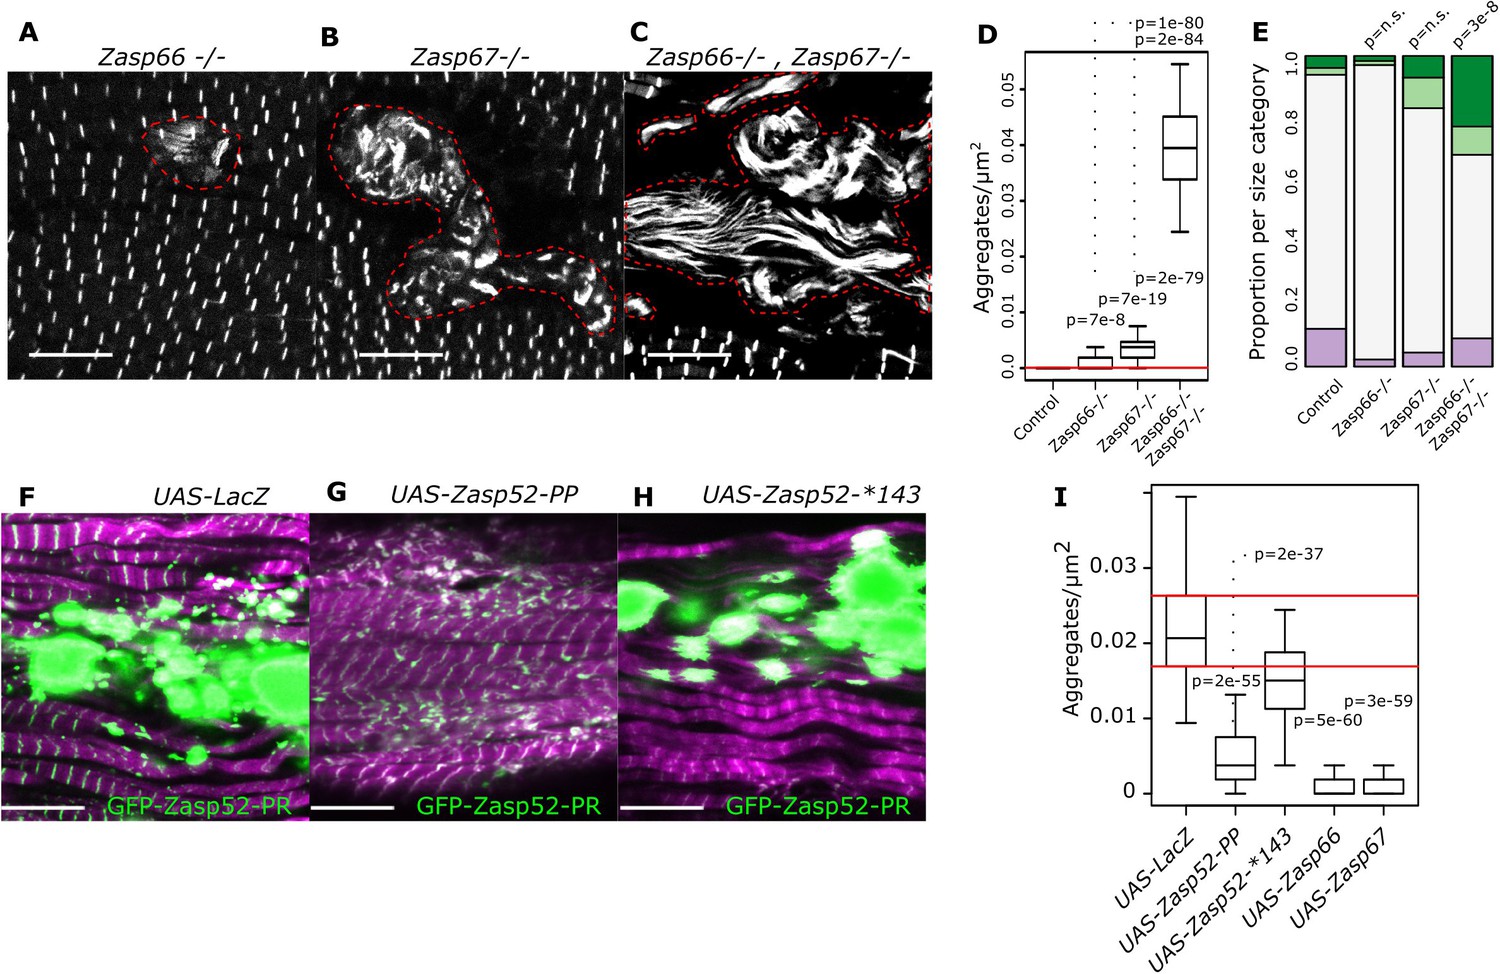
Isoform imbalance leads to Z-disc aggregation.
(A–C) Confocal microscopy images of Zasp66 and Zasp67 single null mutants and the Zasp66 Zasp67 double mutant. Aggregates are outlined by a stippled red line. (D) Plot of aggregate frequencies of single and double mutants. (E) Frequency plot of Z-disc size categories in single and double mutants (for categories see Figure 6). (F–H) Confocal microscopy images of muscles overexpressing the growing GFP-Zasp52-PR isoform and selected Zasp blocking isoforms or a LacZ control. (F) In the control, GFP-Zasp52-PR overexpression produces aggregates. (G) The aggregation phenotype is suppressed by co-overexpression of the blocking isoform Zasp52-PP. (H) The aggregation phenotype is not rescued upon co-overexpression of Zasp52-Stop143, which lacks the ZM domain. (I) Aggregation frequency in different co-overexpression backgrounds. Act88F-Gal4 was used for overexpression experiments in panels F-I. Scale bars in A-C and F-J, 10 µm. p-Values in panel E were calculated using Fisher's exact test for count data. p-Values in panels D and I were calculated using Welch’s two-sample t-test.
-
Figure 7—source data 1
Z-disc diameter estimates and aggregate estimates.
- https://cdn.elifesciences.org/articles/50496/elife-50496-fig7-data1-v3.xlsx
Author response image 1
Tables
Key resources table
| Reagent type (species) or resource | Designation | Source or reference | Identifiers | Additional information |
|---|---|---|---|---|
| Gene (Drosophila melanogaster) | Zasp52 | FBgn0265991 | ||
| Gene (Drosophila melanogaster) | Zasp66 | FBgn0035917 | ||
| Gene (Drosophila melanogaster) | Zasp67 | FBgn0036044 | ||
| Gene (Drosophila melanogaster) | Actn | FBgn0000667 | ||
| Genetic reagent (Drosophila melanogaster) | Act88F-Gal4 | RM Cripps PMID: 22008792 | FBal0268407 | |
| Genetic reagent (Drosophila melanogaster) | UH3-Gal4 (P[GawB]HkUH3) | Anja Katzemich PMID: 23505387 | FBti0148868 | |
| Genetic reagent (Drosophila melanogaster) | UAS-LacZ | BDSC | RRID:BDSC_3356 | |
| Genetic reagent (Drosophila melanogaster) | UAS-GFP-Zasp52-PR | Current study | N/A | Expresses full length Zasp52-PR isoform with a N terminal GFP tag under UAS. The landing site is ZH-attP-86Fb. |
| Genetic reagent (Drosophila melanogaster) | UAS-GFP-Zasp52-PK | Current study | N/A | Expresses Zasp52-PK isoform with a N terminal GFP tag under UAS. The landing site is ZH-attP-86Fb. |
| Genetic reagent (Drosophila melanogaster) | UAS-Flag-Zasp52-PR | Kuo An Liao PMID: 27783625 | FBal0323349 | Expresses full length Zasp52-PR isoform with a N terminal Flag tag under UAS. The landing site is ZH-attP-86Fb. |
| Genetic reagent (Drosophila melanogaster) | UAS-Flag-Zasp52-PR-ΔPDZ | Kuo An Liao PMID: 27783625 | FBal0323350 | Expresses Full length Zasp52 without the PDZ domain and a N terminal Flag tag under UAS. The landing site is ZH-attP-86Fb. |
| Genetic reagent (Drosophila melanogaster) | UAS-Flag-Zasp52-PR-ΔZM | Kuo An Liao PMID: 27783625 | FBal0323351 | Expresses full length Zasp52-PR isoform without the ZM domain and a N terminal Flag tag under UAS. The landing site is ZH-attP-86Fb. |
| Genetic reagent (Drosophila melanogaster) | UAS-Flag-Zasp52-PP | Current study | N/A | Expresses smallest Zasp52 isoform with a N terminal Flag tag under UAS. The landing site is ZH-attP-86Fb. |
| Genetic reagent (Drosophila melanogaster) | UAS-Flag-Zasp52-Stop143 | Current study | N/A | Expresses Zasp52-PK isoform with a N terminal Flag tag and a stop codon at position 143 under UAS. The landing site is ZH-attP-86Fb. |
| Genetic reagent (Drosophila melanogaster) | UAS-Zasp66-PK-Flag-HA | Current study | N/A | Transgenic made from the UFO11045 plasmid from DGRC. The landing site is ZH-attP-58A. |
| Genetic reagent (Drosophila melanogaster) | UAS-Zasp67-PE-Flag-HA | Current study | N/A | Transgenic from Zasp67 sequence synthesized by Genscript and cloned into a pUASattb vector. The landing site is ZH-attP-58A. |
| Genetic reagent (Drosophila melanogaster) | Zasp52-MI02988-mCherry | Nicanor Gonzalez-Morales PMID: 29423427 | PMID: 29423427 | Replacement of the MIMIC02988 cassette in Zasp52 with an in-frame mCherry tag. |
| Genetic reagent (Drosophila melanogaster) | Zasp52-GFP Zasp52[ZCL423] | BDSC | RRID:BDSC_58790 | |
| Genetic reagent (Drosophila melanogaster) | Zasp66-GFP Zasp66[ZCL0663] | BDSC | RRID:BDSC_6824 | |
| Genetic reagent (Drosophila melanogaster) | Zasp67-GFP fTRG | VDRC | v318355 | |
| Genetic reagent (Drosophila melanogaster) | UAS-Actn-KK (RNAi) | VDRC | v110719; FBst0482284 | |
| Genetic reagent (Drosophila melanogaster) | Zasp52[MI02988] | BDSC | RRID:BDSC_41034 | |
| Genetic reagent (Drosophila melanogaster) | Zasp52[MI07547] | BDSC | RRID:BDSC_43724 | |
| Genetic reagent (Drosophila melanogaster) | Zasp52[MI00979] | BDSC | RRID:BDSC_33099 | |
| Genetic reagent (Drosophila melanogaster) | Zasp66[KO] | PMID: 31123042 | PMID: 31123042 | CRISPR null mutant of Zasp66 |
| Genetic reagent (Drosophila melanogaster) | Zasp67[KO] | PMID: 31123042 | PMID: 31123042 | CRISPR null mutant of Zasp67 |
| Genetic reagent (Drosophila melanogaster) | UAS-Zasp66-PH-Venus | Current study | N/A | The Zasp66-PH isoform that contains only a ZM domain cloned into pBID-UAS-GV vector. The landing site is ZH-attP-58A. |
| Genetic reagent (Drosophila melanogaster) | UAS-Zasp66-PH-NYFP (CYFP) | Current study | N/A | The Zasp66-PH isoform fused to either NYFP or CYFP. |
| Genetic reagent (Drosophila melanogaster) | UAS-Zasp52-PK-NYFP (CYFP) | Current study | N/A | The Zasp52-PK isoform fused to either NYFP or CYFP. |
| Recombinant DNA reagent | Plasmid: pGADT7 | Clontech | 630442 | |
| Recombinant DNA reagent | Plasmid: pBD-Gal4-Zasp67 | DGRC | CT33772-BD | |
| Recombinant DNA reagent | Plasmid: pOAD-Zasp67 | DGRC | CT33772-AD | |
| Recombinant DNA reagent | Plasmid: pENTRY-Zasp52-PK | DGRC | DGRC: GEO02280 | |
| Recombinant DNA reagent | Plasmid: pENTRY-Zasp52-PE GEO12859 | DGRC | DGRC: GEO12859 | |
| Recombinant DNA reagent | Plasmid: pENTRY-Zasp66-PH GEO14752 | DGRC | DGRC: GEO14752 | |
| Recombinant DNA reagent | Plasmid: pGBKT7-GW | Addgene | 61703 | |
| Recombinant DNA reagent | Plasmid: pGADT7-GW | Addgene | 61702 | |
| Recombinant DNA reagent | Plasmid: pGADT7-Zasp66-PK | Current study | N/A | Zasp66-PK isoform cloned into pGADT7. |
| Recombinant DNA reagent | Plasmid: pGADT7-Zasp66-PK with stop codons | Current study | N/A | Stop codons were introduced in the Zasp66-PK-pGADT7 plasmid by site-directed mutagenesis (Genscript). |
| Recombinant DNA reagent | Plasmid: pGBKT7- Zasp52 individual domains: PDZ, ZM, LIM1a, LIM1b, LIM2a, LIM2b, LIM3 and LIM4 | Current study | N/A | All individual domains of Zasp52 cloned into pGBKT7. |
| Recombinant DNA reagent | Plasmid: pGBKT7GW-Zasp52-PK | Current study | N/A | Zasp52-PK isoform cloned into pGBKT7GW using Gateway cloning. |
| Recombinant DNA reagent | Plasmid: pGADT7GW-Zasp52-PK | Current study | N/A | Zasp52-PK isoform cloned into pGADT7GW using Gateway cloning. |
| Recombinant DNA reagent | Plasmid: pGBKT7GW-Zasp52-PE | Current study | N/A | Zasp52-PE isoform cloned into pGBKT7GW using Gateway cloning |
| Recombinant DNA reagent | Plasmid: pGADT7GW-Zasp52-PE | Current study | N/A | Zasp52-PE isoform cloned into pGADT7GW using Gateway cloning. |
| Recombinant DNA reagent | Plasmid: pGBKT7GW-Zasp66-PH | Current study | N/A | Zasp66-PH isoform cloned into pGBKT7GW using Gateway cloning |
| Recombinant DNA reagent | Plasmid: pGADT7GW-Zasp66-PH | Current study | N/A | Zasp66-PH isoform cloned into pGADT7GW using Gateway cloning. |
| Recombinant DNA reagent | Plasmid: pDEST- pUAS-RfB-HA-CYFP-attB | Sven Bogdan PMID: 20937809 | FBrf0212496 | |
| Recombinant DNA reagent | Plasmid: pDEST- pUAS-RfB-myc-NYFP-attB | Sven Bogdan PMID: 20937809 | FBrf0212496 | |
| Strain, strain background (Saccharomyces cerevisiae) | Matchmaker Y2HGold | Clontech | 630498 | |
| Strain, strain background (E. coli) | BL21 | NEB | C2530H | |
| Antibody | Anti-Flag | SIGMA | F3165 | 1:200 |
| Software, algorithm | R Project for Statistical Computing: base and ape packages | https://cran.r-project.org/ | RRID:SCR_001905 | |
| Software, algorithm | Salmon | https://combine-lab.github.io/salmon/ | RRID:SCR_017036 | |
| Software, algorithm | ImageJ/Fiji distribution | https://fiji.sc/ | RRID: SCR_002285 | |
| Software, algorithm | Galaxy | https://usegalaxy.org/ | RRID:SCR_006281 | |
| Chemical compound, drug | ethylene glycol bis-sulfosuccinimidyl succinate (EGS) | Fisher Scientific | 21565 | |
| Chemical compound, drug | YPDA medium | Clontech | 630464 | |
| Chemical compound, drug | Minimal SD Base | Clontech | 630411 | |
| Chemical compound, drug | -Leu /- Trp DO Supplement | Clontech | 630417 | |
| Chemical compound, drug | -Ade /- His /- Leu/-Trp DO Supplement | Clontech | 630428 | |
| Chemical compound, drug | Acti-stain 488 phalloidin | CYTOSKELETON, INC | PHDG1-A | |
| Chemical compound, drug | Alexa633-Phalloidin | Fisher Scientific | A22284 | |
| Chemical compound, drug | Rhodamine-phalloidin | Fisher Scientific | 10063052 |
Additional files
-
Supplementary file 1
Detailed genotypes for all figures.
- https://cdn.elifesciences.org/articles/50496/elife-50496-supp1-v3.docx
-
Transparent reporting form
- https://cdn.elifesciences.org/articles/50496/elife-50496-transrepform-v3.docx
Download links
A two-part list of links to download the article, or parts of the article, in various formats.
Downloads (link to download the article as PDF)
Open citations (links to open the citations from this article in various online reference manager services)
Cite this article (links to download the citations from this article in formats compatible with various reference manager tools)
Myofibril diameter is set by a finely tuned mechanism of protein oligomerization in Drosophila
eLife 8:e50496.
https://doi.org/10.7554/eLife.50496


