Adaptation to mutational inactivation of an essential gene converges to an accessible suboptimal fitness peak
- Harvard University, United States
Figures
Figure 1
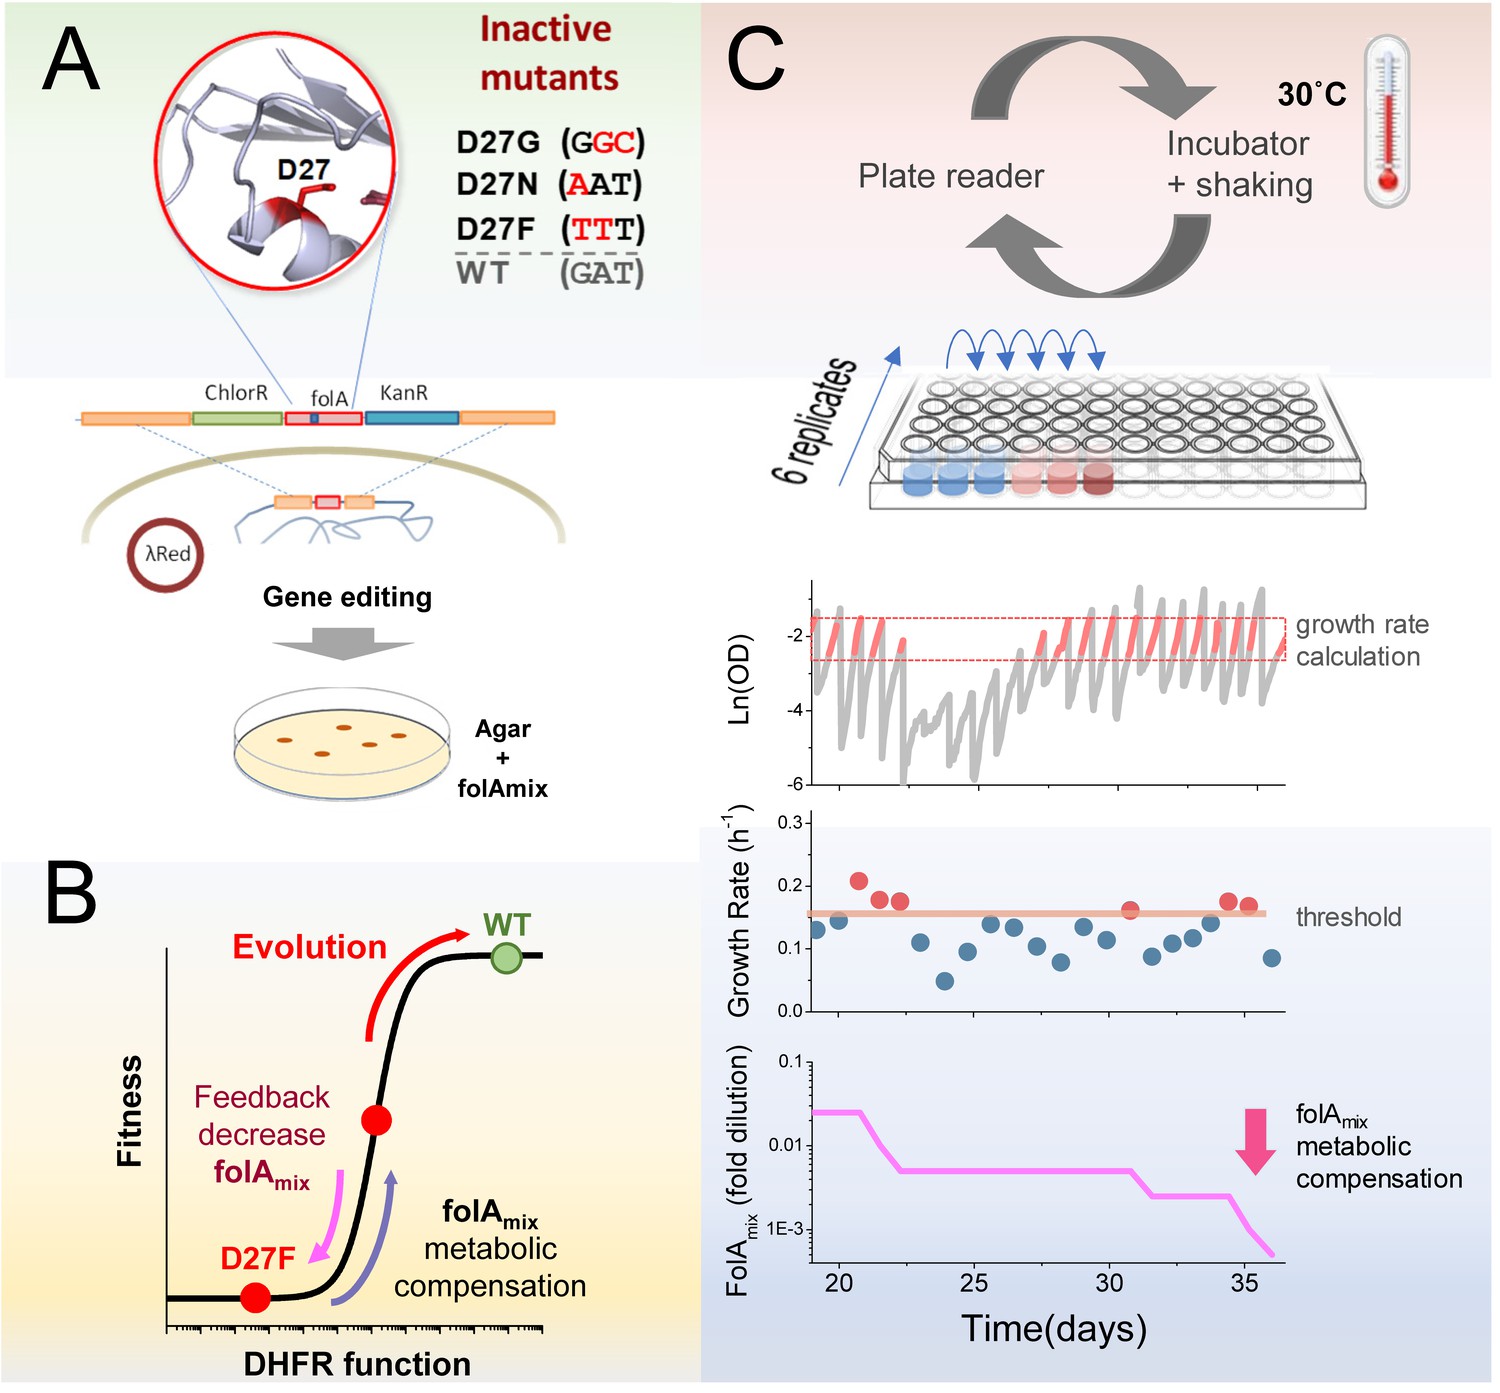
Automated experimental evolution of inactive DHFR mutants.
(A) Mutations in key D27 catalytic residue of DHFR were introduced in E. coli chromosome, together with flanking antibiotic resistant markers, by lambda red recombination and strains devoid of DHFR function were selected with antibiotics in folAmix-containing agar plates. (B) D27 mutants are lethal but fitness can be partially rescued by metabolic compensation with folAmix. Adaptative changes that increase fitness can be counterbalanced by decreasing the concentration of folAmix in the growth medium, forcing the cells to evolve without DHFR function. (C) Experimental evolution using automated liquid handling. Six replicates of cell cultures are placed in the first column of a 96-well plate and incubated at 30 °C with shaking and the optical density is measured every 30 min. The cultures are grown until the average OD reaches a threshold (0.3), that was defined to avoid nutrient limitation and consequent shift into the stationary phase. At this point cultures are diluted simultaneously into the wells of the adjacent column, to a common starting OD (0.01), and the cycle is repeated. The growth rate is calculated for every culture and, whenever it exceeds a defined threshold, the amount of folAmix is independently decreased for each culture in the subsequent dilution.
Figure 2 with 4 supplements
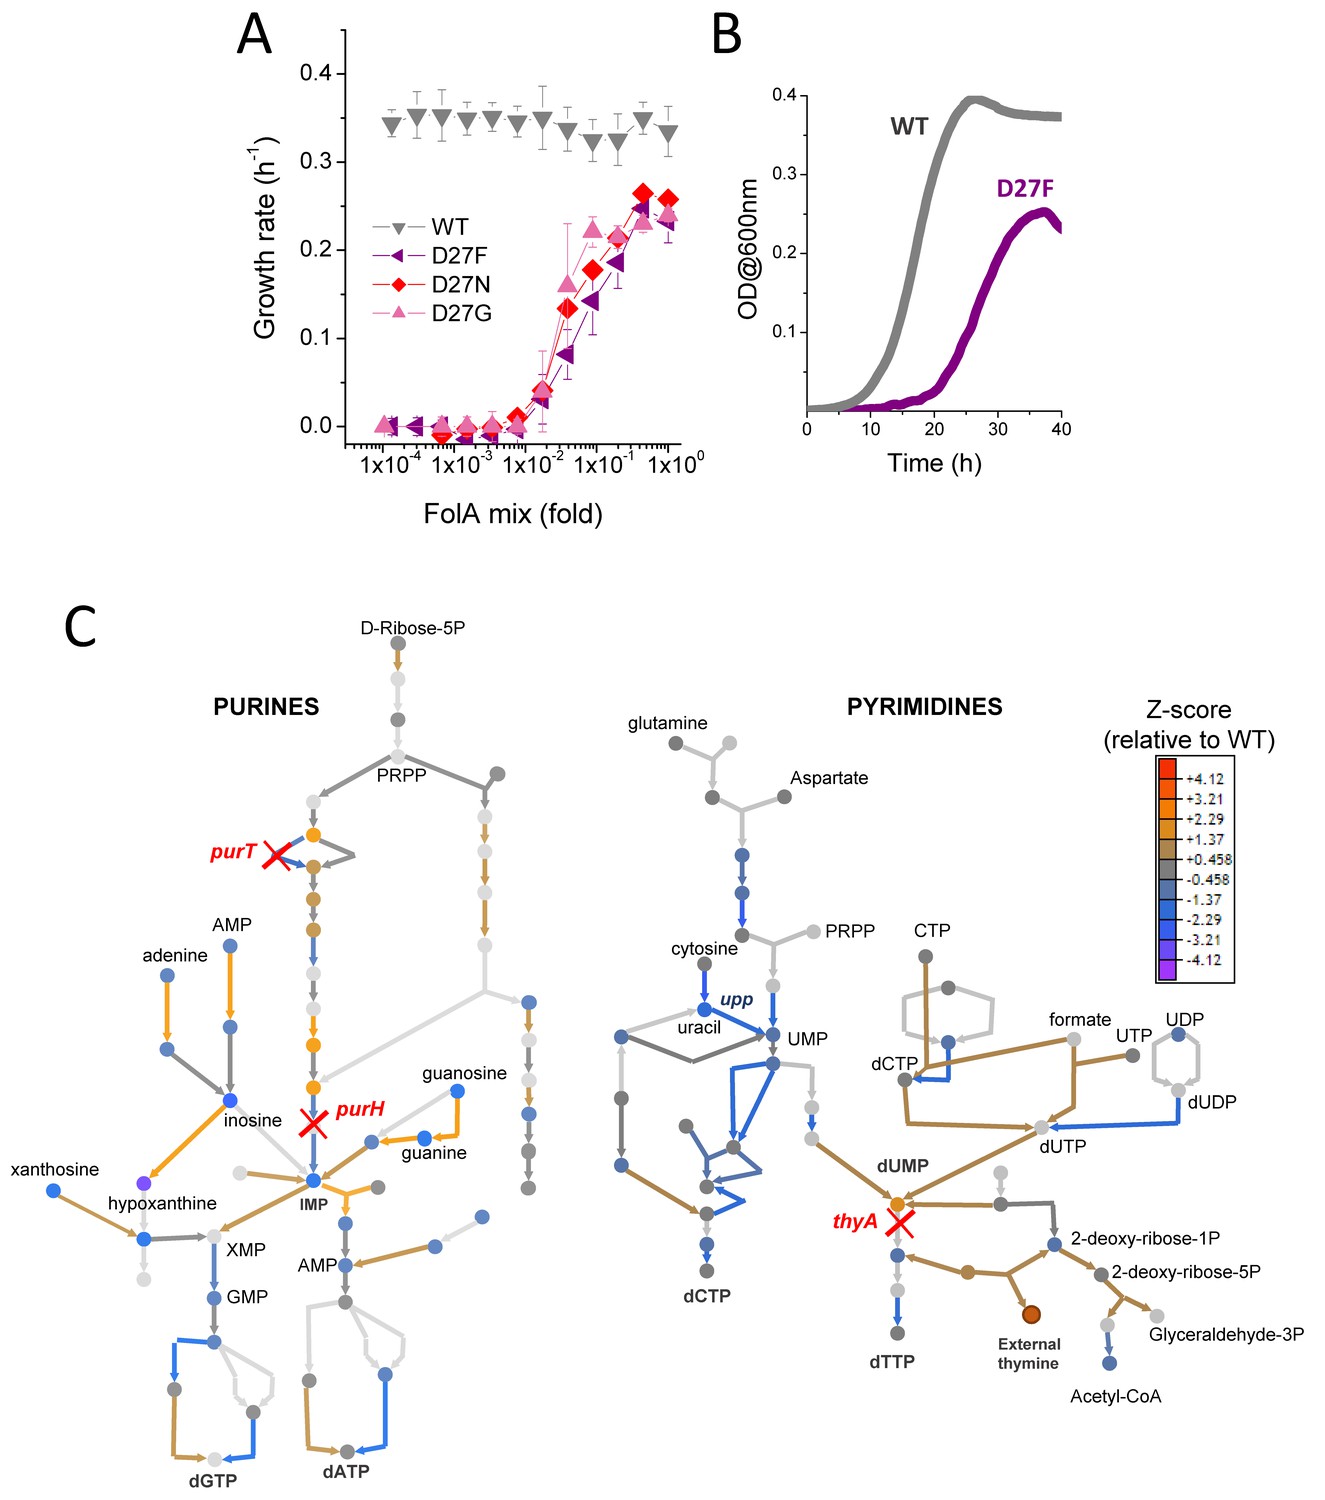
D27 mutants require folAmix to grow.
(A) The growth rates of each D27 mutant and wild type were measured at various dilutions of folAmix, with respect to initial composition (adenine 20 µg/mL, inosine 80 µg/mL, thymine 200 µg/mL, methionine 20 µg/mL and glycine 20 µg/mL), (see also Figure 2—figure supplement 1 and Figure 2—figure supplement 2). Cultures were grown in M9-minimal medium at 30 °C, and absorbance was monitored at 600 nm. Data are represented as mean ± SD (N = 4) (B) Comparison of representative growth curves of wild type and D27F mutant obtained in the presence of 1x folAmix. (C) Schematic representation of purine and pyrimidine biosynthetic pathways depicting changes in the levels of metabolites and proteins for the D27F mutant (Z-scores, relative to wild type). Metabolites are represented by circles and arrows represent enzymatic reactions color-coded by the levels of associated proteins (see also Figure 2—figure supplement 3 and Figure 2—figure supplement 4). Light gray shading indicates that no data is available. Metabolites that are downstream of the enzymatic reactions requiring reduced folates (ThyA, PurH and PurT) are strongly depleted in D27F mutant, whereas those metabolites immediately upstream to those reactions are increased in respect to wild type.
-
Figure 2—source data 1
D27 mutants require folAmix to grow.
- https://doi.org/10.7554/eLife.50509.009
Figure 2—figure supplement 1
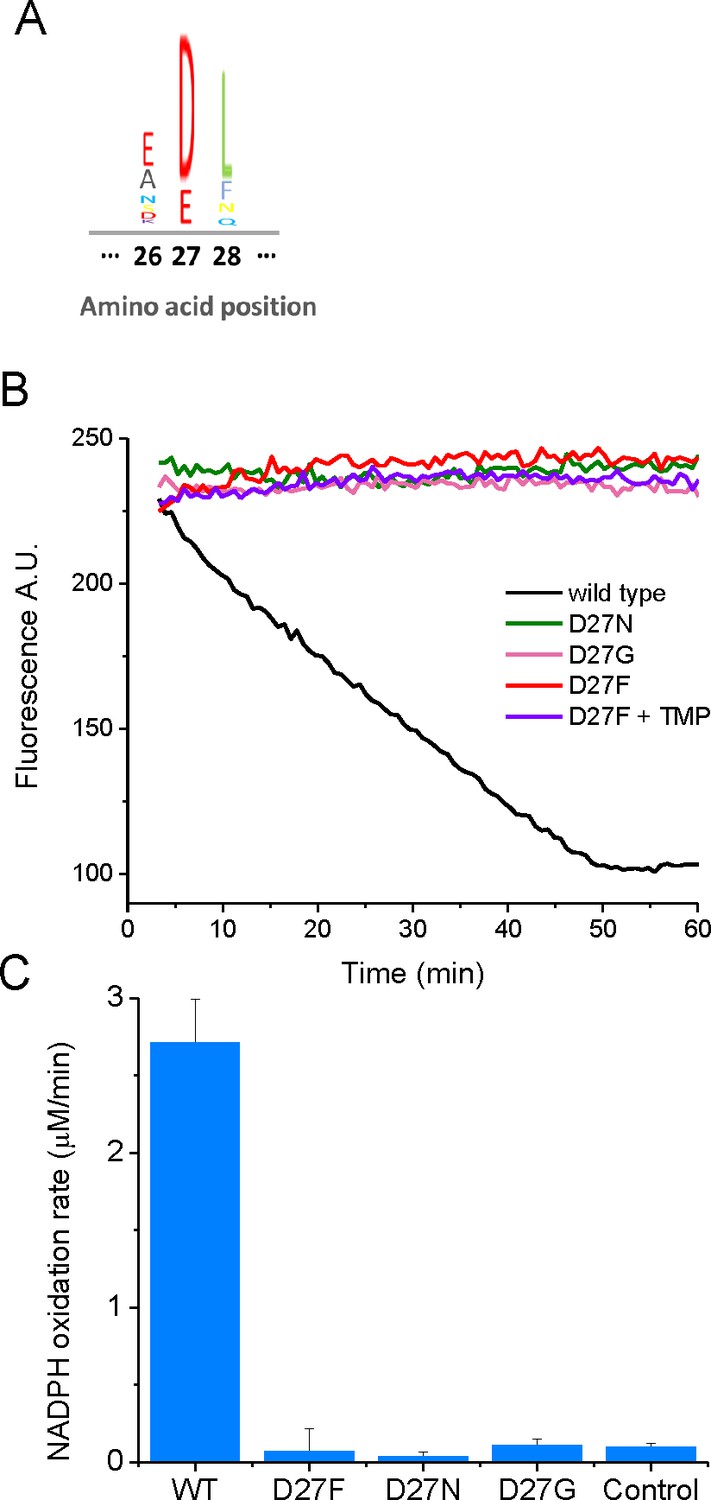
Mutations in key catalytic residue D27 impair DHFR function.
(A) Partial sequence alignment and sequence entropy for 290 bacterial DHFRs at the D27 locus showing strict conservation of carboxylate side chain residue. Sequence Logo for the alignment, generated using the MATLAB Bioinformatics Toolbox. (B) D27 mutant strains lack measurable DHFR catalytic activity. Raw kinetic traces for the determination of DHFR catalytic activity in cell lysates from wild type and different D27 mutant strains and C) raw of NADPH oxidation rates measured from cell lysates from each strain. Cleared cell lysates were incubated with 100 µM NADPH in 100 mM MES (2-(N-morpholino)ethanesulfonic acid) pH 7.0 in the presence of 1 mM DTT at 25 °C and the reaction was initiated by the addition of 100 µM dihydrofolate. The decay in fluorescence intensity at 440 nm (excitation 300 nm) was measured over 1 hr, and the initial slopes were determined. Controls from non-DHFR-specific reaction were measured by the addition of trimethoprim (1 mM) to cell lysates.
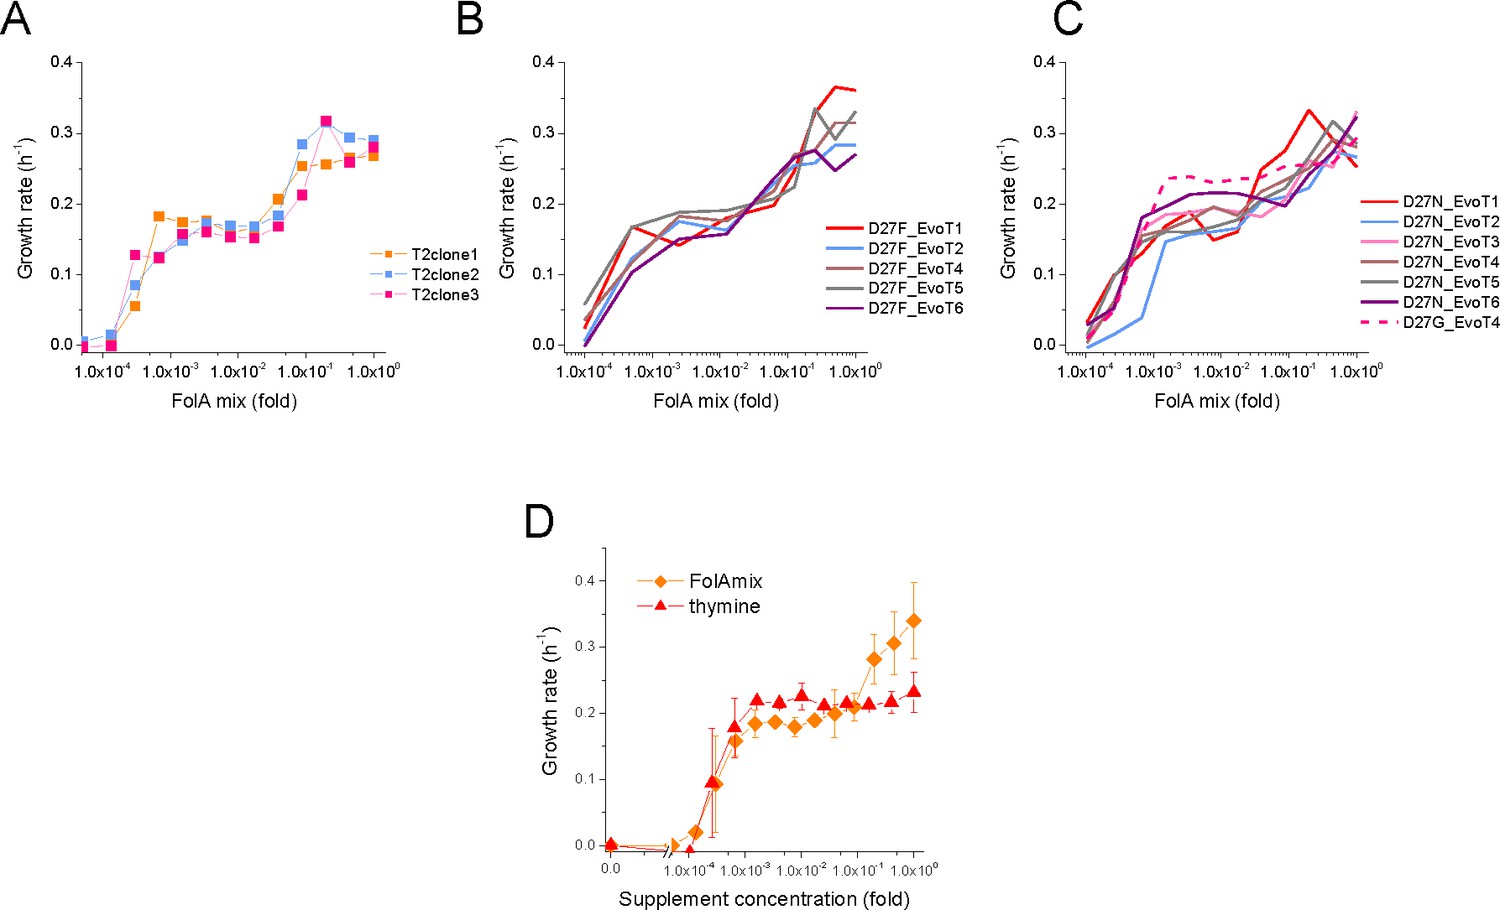
Figure 2—figure supplement 2
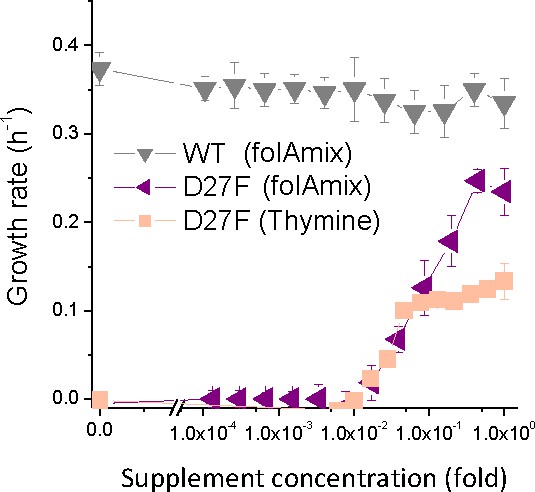
Naïve D27F strain requires thymine for growth.
Growth rate of naïve D27F in the presence of various concentrations of thymine, represented as fold dilutions with respect to initial concentration (200 µg/mL). For comparison, the growth profile in the presence of folAmix (at equivalent thymine concentrations) is represented for wild type and D27F mutant strains. Cultures were grown in M9-minimal medium at 30 °C, and absorbance was monitored at 600 nm. (B) Evolved D27F strain (trajectory 1, cloneF51T1#1) was grown at different concentrations of either thymine or folAmix. (C) Individual clones from the same evolutionary trajectory show similar fitness profile. Three randomly picked colonies from evolved strain D27F, trajectory 2, were grown at various concentrations of folAmix. (D). Individual clones randomly picked form evolved cultures of different trajectories in D27F evolution show similar folAmix-dependent growth profile. (E) Individual clones of evolved cultures from different trajectories in D27N and trajectory four in D27G evolution show similar folAmix-dependent growth profile as evolved D27F strains (panel D).
Figure 2—figure supplement 3
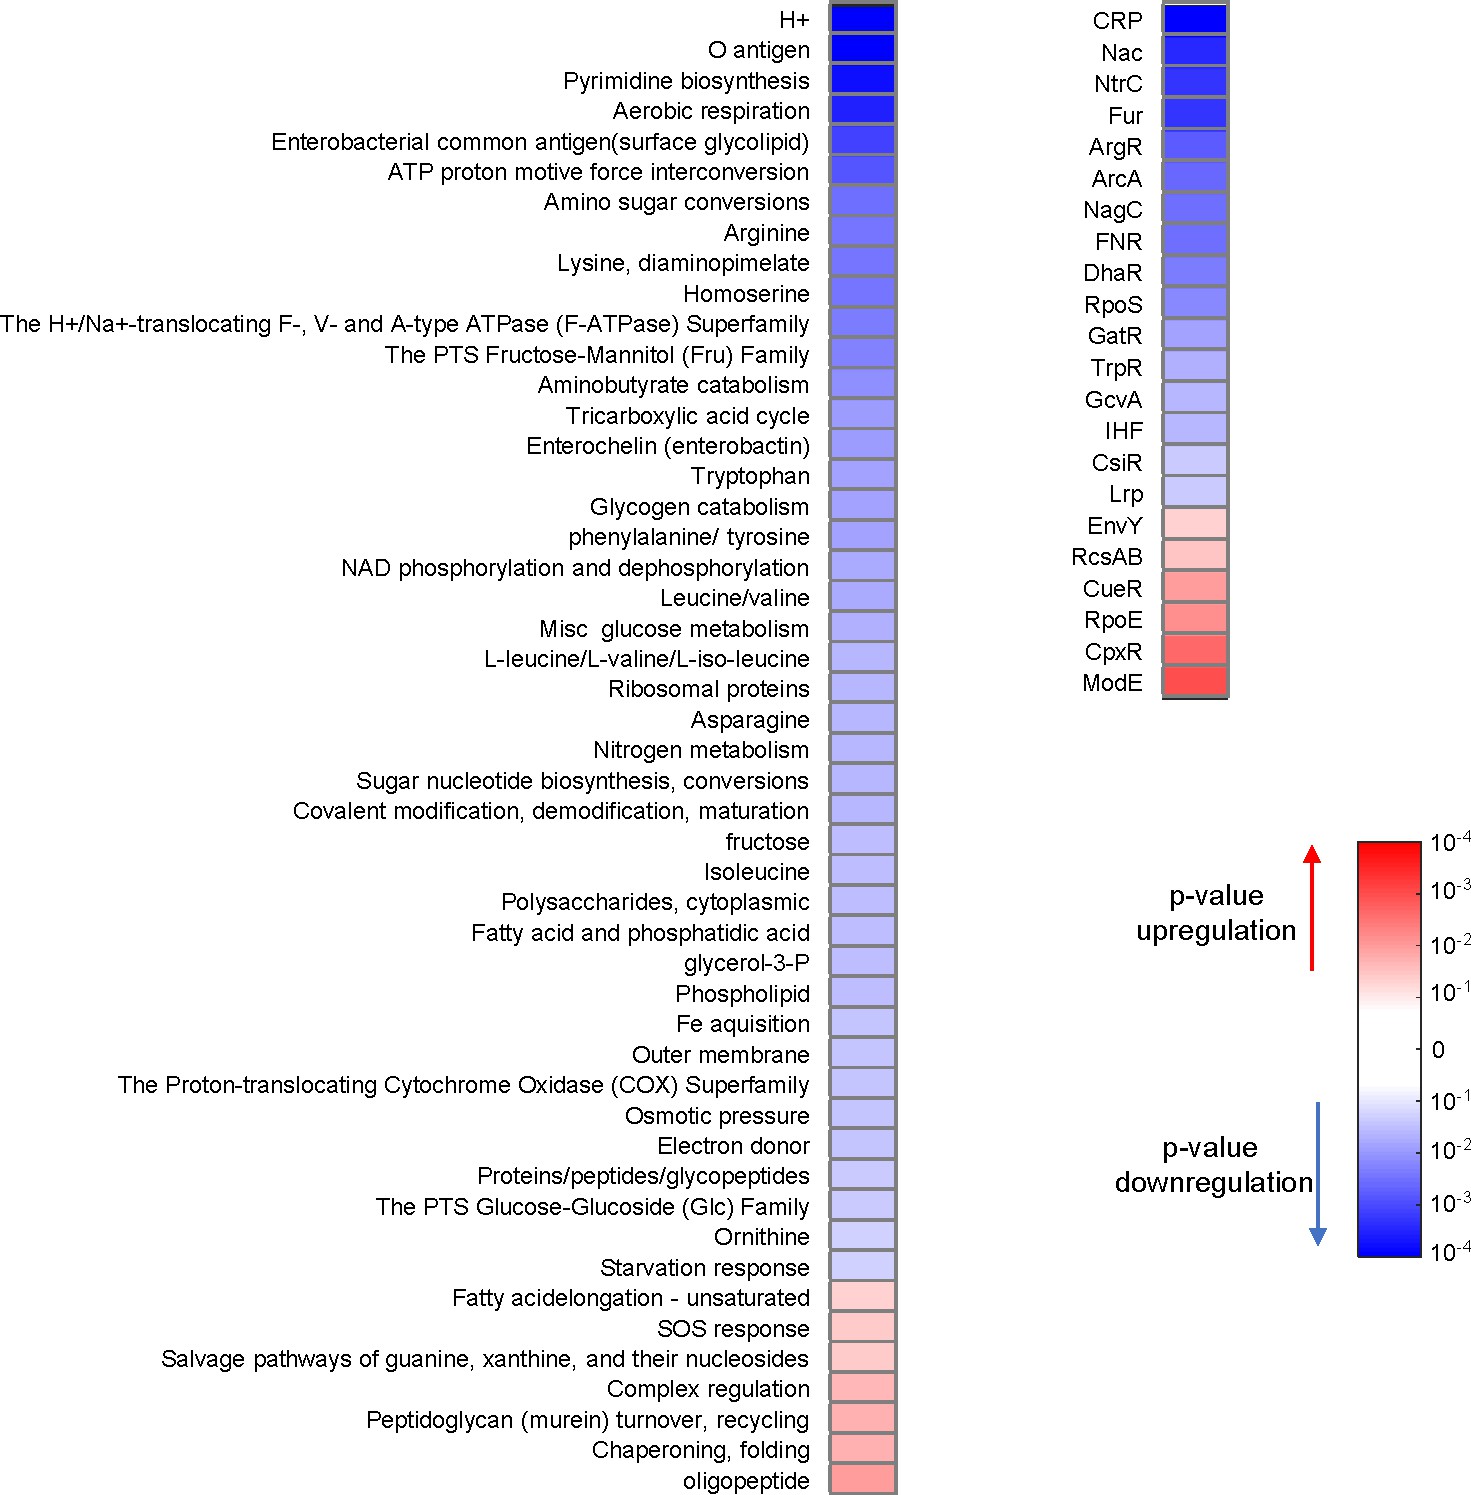
D27F mutation causes major proteomic changes.
Variation in the abundance of proteins in naïve D27F strain, with respect to wild type, classified by functional and regulatory groups. For every group class (Sangurdekar et al., 2011), p-values of one-sample t-test were computed from the Z-scores of genes belonging to that category. A given group of proteins is considered to be upregulated if the average of the Z-scores is positive or downregulated otherwise. Only groups with significant changes (p<0.05) are represented.
Figure 2—figure supplement 4
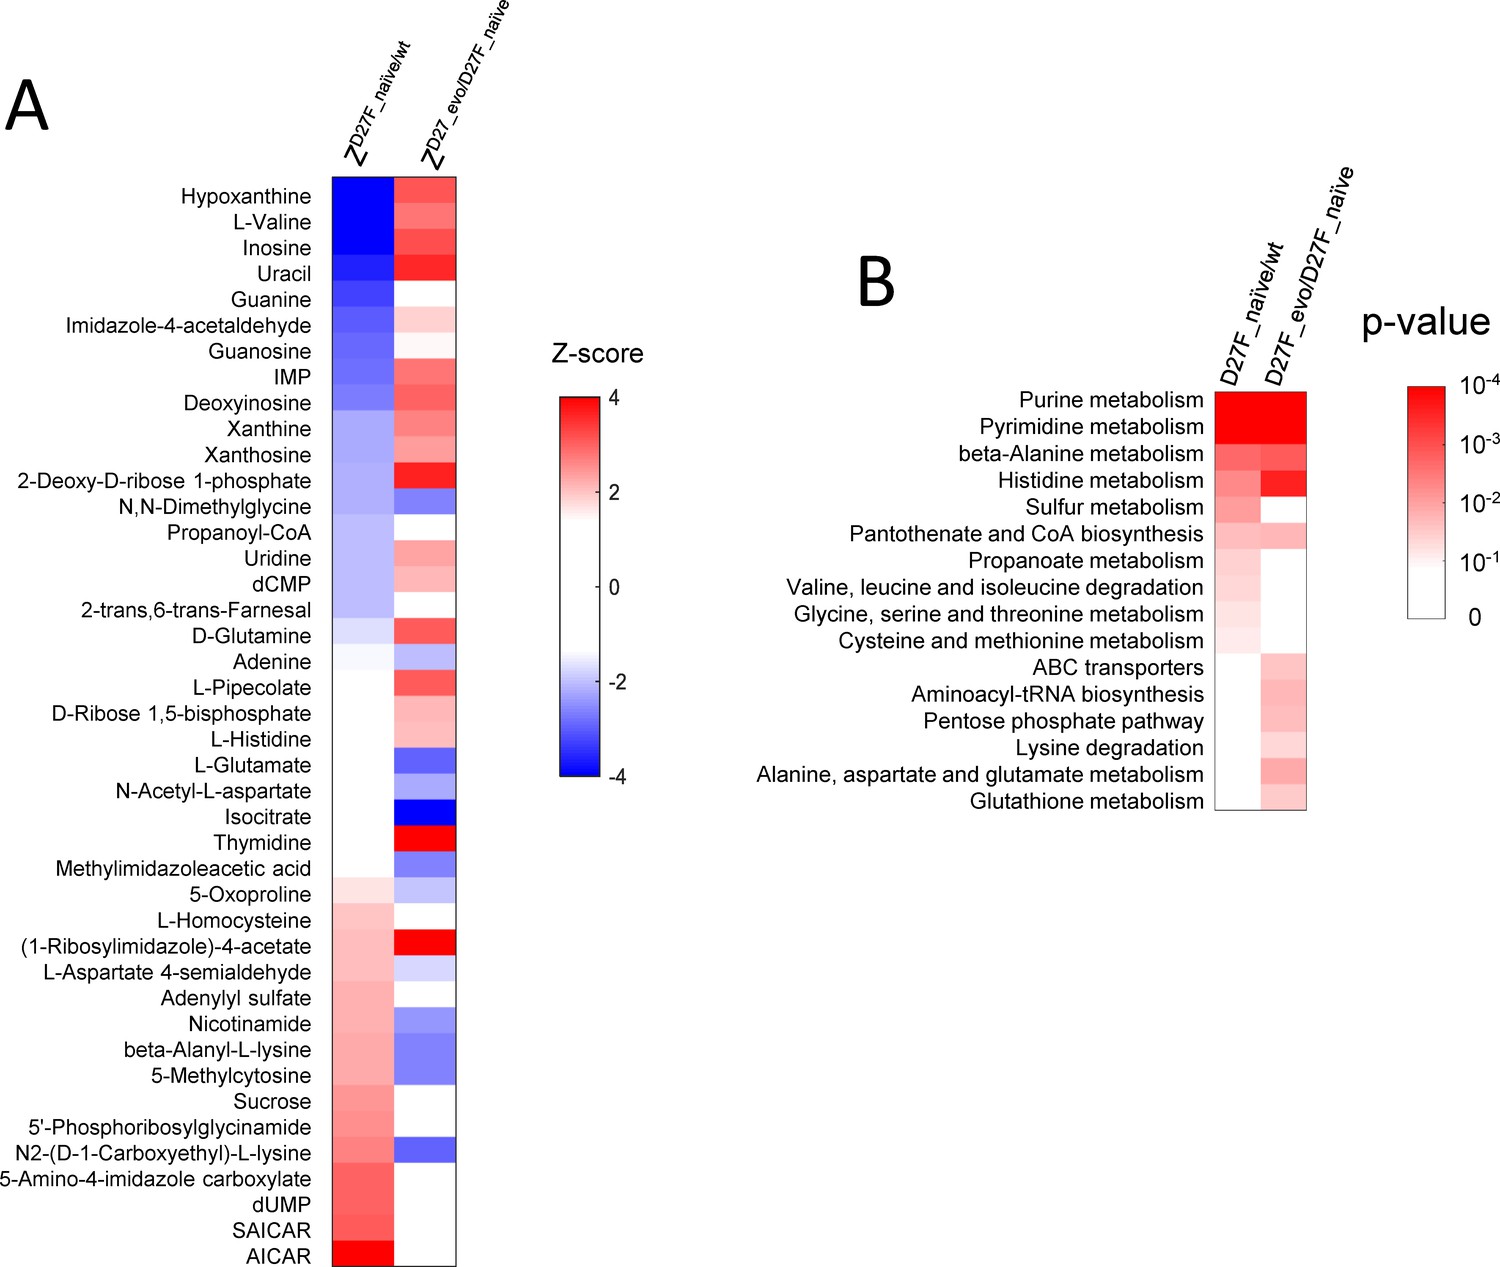
The abundance of various metabolites is strongly affected in naïve and evolved D27F strains.
(A) List of metabolites with highest absolute Z-scores in naïve and evolved D27F with respect to wild type and naïve D27F, respectively. (B) Metabolic pathways associated with the most significant changes in naïve and evolved D27F, with respect to naïve D27F and wild type, respectively. P-values associated with each metabolic pathway were determined using a functional enrichment analysis (MBrole 2.0 online tool; López-Ibáñez et al., 2016) which compares, for every given class, the number of experimental hits and total background metabolites in that set. The metabolites with the highest absolute Z-scores (>1.96) were selected for the analysis.
Figure 3
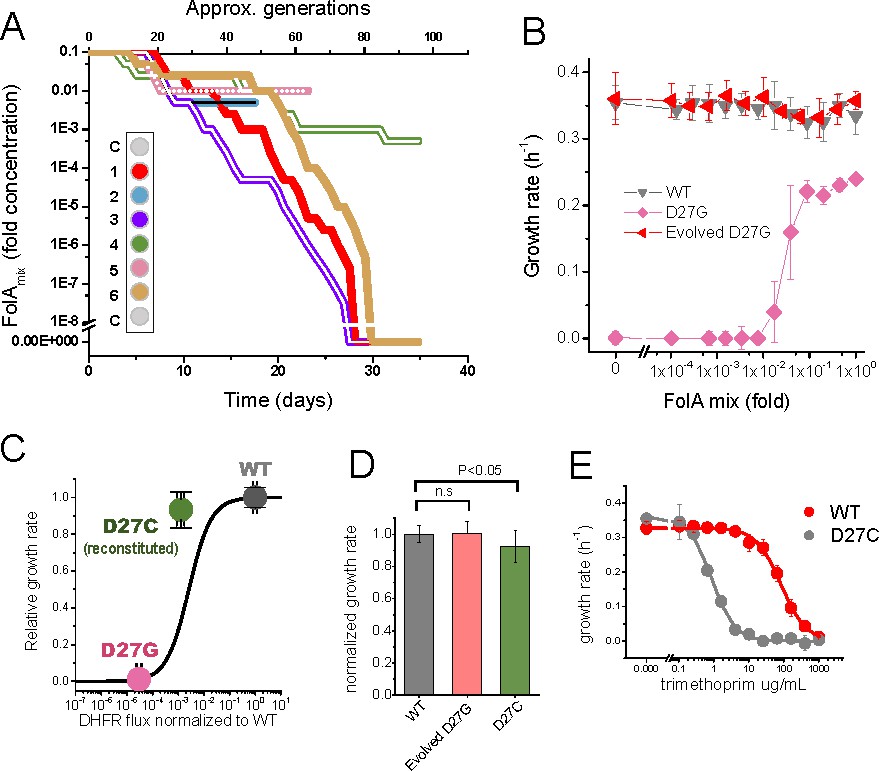
Phenotype-reverting G27C mutation emerges upon evolution of D27G strain.
(A) Evolutionary profiles of the six trajectories in D27G adaptation showing the time dependent changes in folAmix concentration necessary to sustain growth. Each trajectory is colored according to its position in the column of the 96-well plate, as represented in the scheme (C = wells with growth medium only). (B) Evolved D27G strain does not require folAmix to grow. The growth rates determined at different concentrations of folAmix are compared for wild type, naïve and evolved D27G strain from trajectory 6 (clone G33T6#1). Data are represented as mean ± SD (N = 4). (C) Fitness model (Rodrigues et al., 2016) based on the biophysical properties of DHFR mutants (represented by the black line) allows to predict the growth rate of mutant strains from in vitro properties of the purified D27G and D27C DHFR mutant proteins. The dots represent the growth rate determined experimentally for each mutant strain at the flux value predicted from the biophysical properties. The model predicts a growth rate for D27C that is approximately 30% of the wild type value. This is in fair agreement with the experimental value measured for a BW25113 strain in which D27C mutation was introduced in the wild type folA gene (D27C reconstituted) which was 92% of the wild type. (D) Comparison of growth rates of wild type, evolved D27G and reconstituted D27C strain (mean ± SD, N = 4). (E) Dose-dependent growth inhibition by trimethoprim determined for wild type and reconstituted D27C mutant (mean ± SD, N = 3). The data was fitted with a logistic equation (solid lines) from which IC50 was determined to be 0.8 ± 0.1 µg/mL for wild type and 79 ± 17 µg/mL for D27C mutant.
-
Figure 3—source data 1
Phenotype-reverting G27C mutation emerges upon evolution of D27G strain.
- https://doi.org/10.7554/eLife.50509.012
Figure 4 with 2 supplements

D27F and D27N mutant evolved to grow at low folAmix concentrations.
Evolutionary profiles of each trajectory in (A) D27F and (B) D27N adaptation to loss of DHFR function. (C) Comparison of growth dependence on folAmix concentration determined for wild type, both naïve and evolved D27F (trajectory 1, clone F51T1#1) strains and naïve and evolved D27N (trajectory 6, cloneN51T6#1), see also Figure 4—figure supplement 1, Figure 4—figure supplement 2. Data are represented as mean ± SD (N = 4).
-
Figure 4—source data 1
D27F and D27N mutant evolved to grow at low folAmix concentrations.
- https://doi.org/10.7554/eLife.50509.016
Figure 4—figure supplement 1
Evolved D27F and D27N strains require folAmix for growth.
(A) Individual clones from the same evolutionary trajectory show similar growth profile at different concentrations of folAmix. Three randomly picked colonies from evolved strain D27F, trajectory 2, were grown at various concentrations of folAmix. (B) Individual clones randomly picked form evolved cultures of different trajectories in D27F evolution show similar folAmix-dependent growth profile. (C) Individual clones of evolved cultures from different trajectories in D27N and trajectory four in D27G evolution show similar folAmix-dependent growth profile as evolved D27F strains (panel B). (D) Growth rate of evolved D27F strain (trajectory 1, cloneF51T1#1) in the presence of various concentrations of thymine, represented as fold dilutions with respect to initial concentration (200 µg/mL). For comparison, the growth profile in the presence of folAmix (at equivalent thymine concentrations) is represented. Cultures were grown in M9-minimal medium at 30 °C, and absorbance was monitored at 600 nm.
Figure 4—figure supplement 2
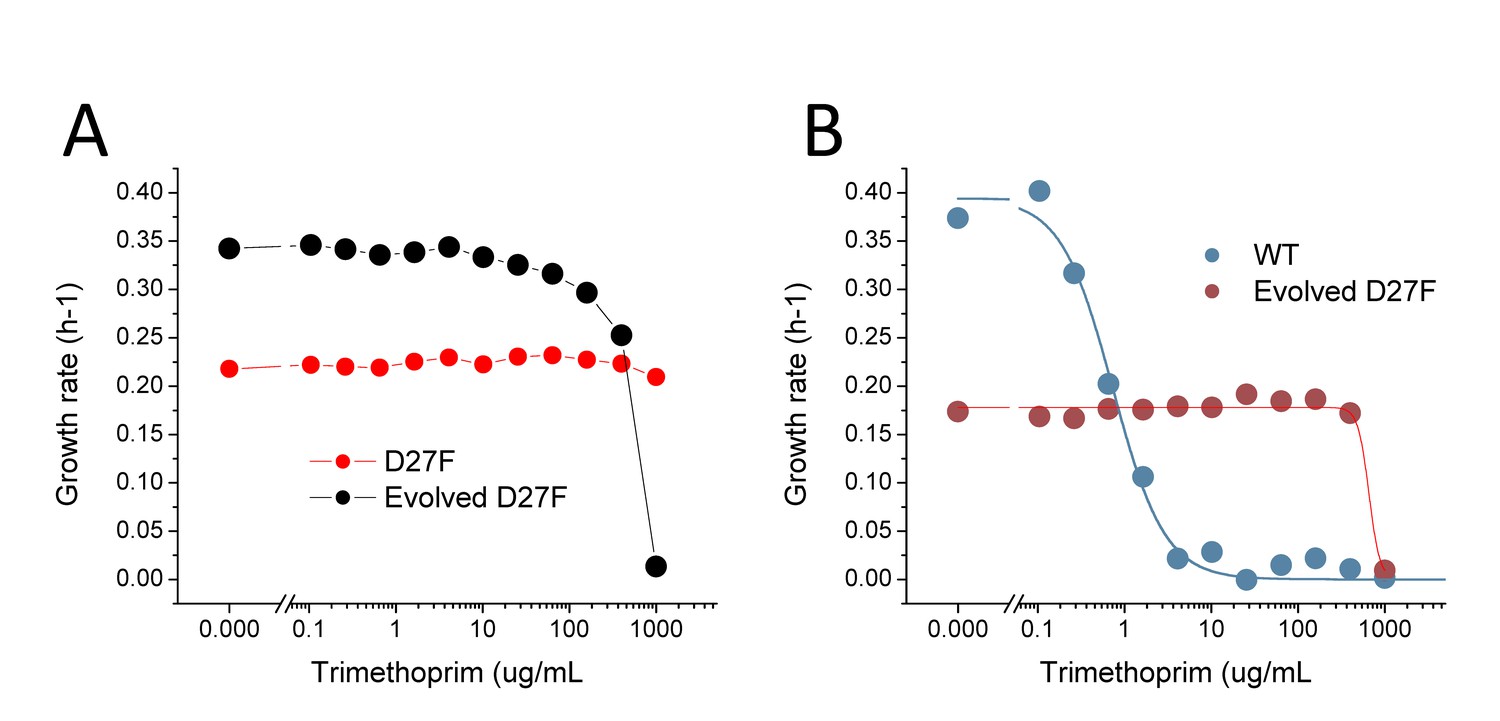
D27 mutant strains are extremely resistant to trimethoprim inhibition.
(A) Comparison of trimethoprim inhibition profiles of pre-evolved and evolved D27F in the presence of 1x folAmix. (B) Comparison of trimethoprim inhibition profiles of wild type and evolved D27F strain at low concentrations of folAmix (5 × 10⁻⁴ fold). Solid lines represent the best fits of the data using logistic equations from which an IC50 of 0.8 ± 0.2 µg/mL was obtained for wild type and 675 ± 77 µg/mL was obtained for evolved D27F.
Figure 5 with 1 supplement

Loss of function mutations in two genes, thyA and deoB, lead to adaptation to low folAmix concentrations.
(A) Mutations identified in naïve and evolved D27 mutant strains. Vertical lines identified with NGS represent mutations identified by whole genome sequencing whereas the remaining cases were identified by Sanger sequencing. Details are presented for trajectory 2 of D27F evolution and include the mutations identified at various passages and the folAmix profile obtained for that trajectory. Points denoted P0 correspond to naïve strains. Mutations between brackets represent polymorphisms with estimated frequencies of 0.5. See also Figure 5—figure supplement 1 for the effect of upp and ymfD mutation in naïve D27G strain. Figure (B) Mutations identified in the most relevant genes. C) Mapping thyA, deoB and folA mutations found among evolved strains from all trajectories of each D27 mutant. Colored dots represent the presence of mutations, whereas gray dots represent genes that were not mutated in evolved strains. Trajectories that ceased growth prior to the end of the experiment were not sequenced (gray squares). D–E) Expression of wild type DeoB and ThyA in evolved D27F strain reverts phenotype to high folAmix requirement. Evolved D27F strain (trajectory 1, clone F51T1#1), with background mutations deoB p.D10G and thyA 403-410del, was transformed with pTRC-tetR plasmid coding (D) wild type or mutant deoB and (E) wild type or mutant thyA, under the control of tetR repressor. Evolved D27F strain without plasmid is also represented as control. Cells were grown in M9 minimal medium and growth rates were measured from periodic OD measurements.. *p<0.01, **p<0.001.
-
Figure 5—source data 1
Expression of wild typeDeoB and ThyA in evolved D27F strain reverts phenotype to high folAmix requirement.
- https://doi.org/10.7554/eLife.50509.019
Figure 5—figure supplement 1
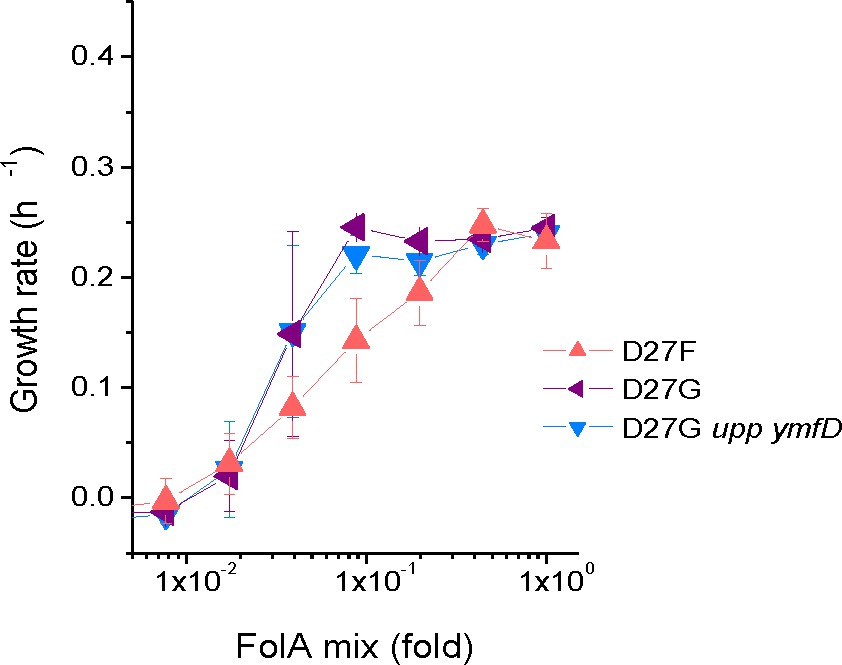
Mutations in upp and ymfD do not impact fitness of D27G.
Strains where mutation D27G was introduced in folA gene were constructed and colonies were screened to select clones with intact upp, ymfD and thyA genes. The growth rates were measured for four of theses strains at different concentrations of folAmix in M9-minimal medium at 30 °C and compared with naïve D27G strain (upp p.17*STOP and ymfD p.A101V) used in the evolution study.
Figure 6

Inactivation in deoB gene prevents 2-deoxy-D-ribose-1-phosphate from being diverted into energy production via glycolysis and tricarboxylic acid cycle.
A) Changes in the levels of metabolites (depicted as circles) and proteins (depicted as arrows) in the evolved D27F strain (Z-scores, relative to naïve D27F mutant) are represented. The proteins involved in 2-deoxy-D-ribose-1-phosphate degradation are marginally increased in evolved D27F, with respect to naïve strain (average Z-score = 0.445, p=0.0817, see Figure 7—figure supplement 1). However, deoB inactivation saves 2-deoxy-D-ribose-1-phospahte that is required in dTMP production, instead of being utilized for energy production in glycolysis, which is significantly upregulated in evolved D27F, with respect to naïve D27F (average Z-score = 0.593, p=0.015). B) Evolved D27F transformed with a plasmid expressing wild type DeoB are able to growth at low external concentrations of thymidine and dTMP, but not at low concentrations of thymine. C) Evolved D27F strains transformed a plasmid expressing inactive DeoB mutant grow at the same extent with either thymine, thymidine or dTMP. At the lowest concentration of dTMP, however, these cells are not able to grow, likely because of inefficient transport of this metabolite into the cell. D) DeoB- strains cannot grow on thymidine as the sole carbon source unless complemented with a plasmid expressing wild type DeoB. Data are represented as mean ± SD (N = 3).
-
Figure 6—source data 1
Inactivation in deoB gene prevents 2-deoxy-D-ribose-1-phosphate from being diverted into energy production.
- https://doi.org/10.7554/eLife.50509.021
Figure 7 with 1 supplement
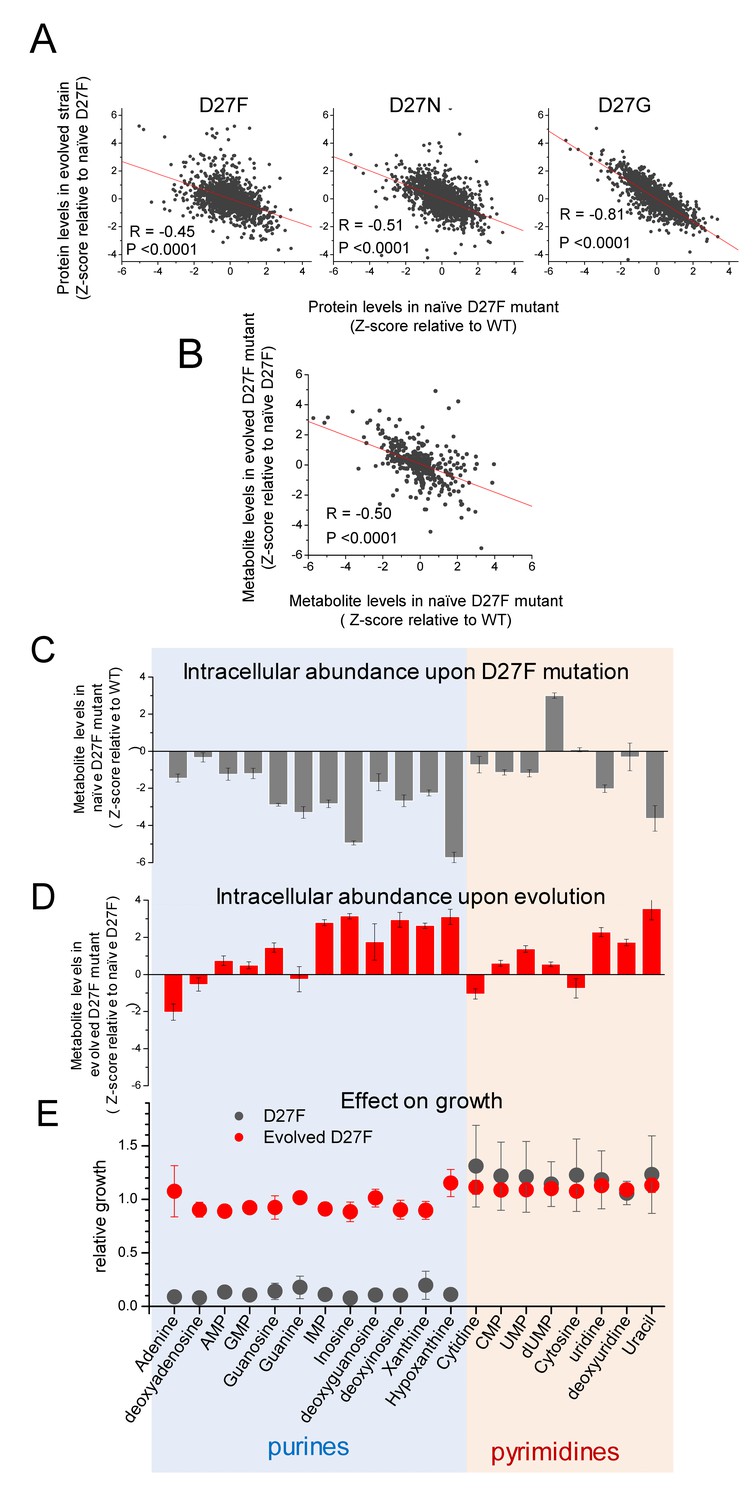
D27 mutation causes major metabolic and proteomic changes.
A) Proteomics changes upon evolution partially revert the effect of DHFR inactivation (see also Figure 2—figure supplement 4). Comparison of the changes in protein levels obtained for evolved D27F (trajectory 1, cloneF51T1#1), D27N (trajectory 6, clone N51T6#1) and D27G (trajectory 6, clone G33T6#1) (Z-scores, relative to naïve D27F) with those measured for naïve D27F (Z-scores, relative to wild type). See also Figure 7—figure supplement 1. B) Comparison of the changes in metabolite levels measured for evolved D27F (trajectory 1, cloneF51T1#1) (Z-scores, relative to naïve D27F) with those measured for naïve D27F (Z-scores, relative with wild type). C–E) Inhibitory effect of purine metabolites supplementation on the growth of the naïve D27F strain is attenuated in the evolved D27F strain. C) Changes in intracellular levels of various purine and pyrimidine species determined by targeted metabolomics for naïve D27F strain, represented as Z-scores relative to wild type. D) Metabolite levels changes obtained for evolved D27F strain, represented as Z-scores relative to naïve D27F strain. E) Effect of individual metabolites on growth of naïve and evolved D27F mutant strains. The effect of supplementation with individual metabolites on growth was determined by growth measurements of naïve and evolved D27F mutant strains in M9 minimal medium supplemented by 1.6 mM thymine in combination with one of each tested metabolites (1 mM final concentration). Relative growth represents the maximum OD obtained for each metabolite normalized to the value measured in the presence of thymine alone. Although most purine metabolites are strongly depleted in naïve D27F mutant, supplementation of the culture medium with these compounds has a strong inhibitory effect on growth. Contrastingly, pyrimidines do not affect growth. In evolved D27F strain, the supplementation with purines has only a marginal effect on growth. Data are represented as mean ± SD (N = 3).
-
Figure 7—source data 1
D27 mutation causes major metabolic and proteomic changes.
- https://doi.org/10.7554/eLife.50509.024
Figure 7—figure supplement 1
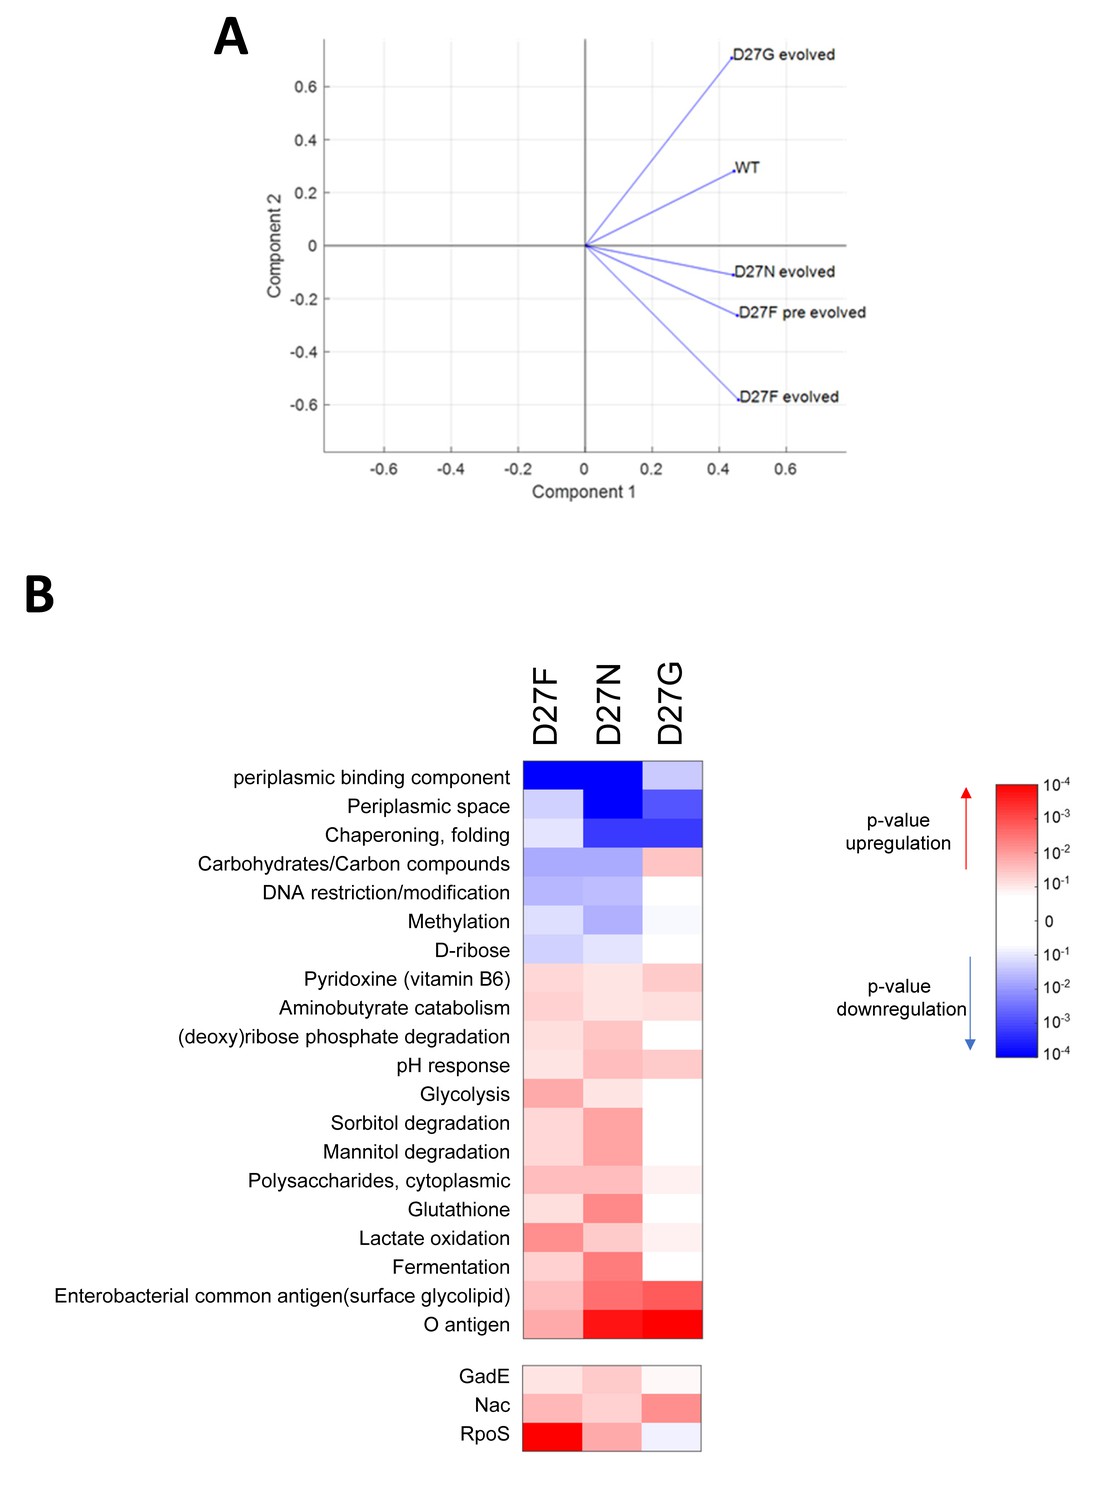
Proteomics profile of D27 mutants is associated with growth dependence on folAmix.
A) PCA analysis of proteomics data shows that evolved D27G clusters close to wild type, in the space of two principal components, whereas folAmix-dependent strains D27 strain are found in a different quadrant. B) Variation in the abundance of proteins in evolved D27 strains, with respect to naïve D27F strain, grouped by protein functional and regulatory classification.
Tables
Table 1
In vitro properties of DHFR mutant proteins a
https://doi.org/10.7554/eLife.50509.010| Wild type | D27F | D27N | D27G | D27C | |
|---|---|---|---|---|---|
| kcat (s−1) | 13 ± 2 | (5 ± 1)×10−4 | (2.6 ± 0.9) × 10−2 | (1.8 ± 0.4)×10−2 | 3 ± 0.8 |
| KM (μM) | 0.8 ± 0.2 | (1.2 ± 0.6)×102 | (4 ± 1)×101 | 23 ± 7 | (7 ± 2)×101 |
| kcat/KM (s−1 μM−1) | 16 ± 1 | (4 ± 1)×10−6 | (7 ± 0.8)×10−4 | (8 ± 2)×10−4 | (4.2 ± 0.8)×10−2 |
| kcat/KM relative to wild type | - | 2 × 10⁻⁷ | 4 × 10⁻⁵ | 3 × 10⁻⁵ | 2 × 10⁻³ |
| Ki (nM) | 1.0 ± 0.3 | ND | ND | ND | (1.7 ± 0.7)×104 |
| ΔTm (0C) | - | +7.6 ± 0.1 b | +1.1 ± 0.3 | +1.2 ± 0.2 | +0.6 ± 0.6 |
| bis-ANS | 1 | 1.1 ± 0.1 | 2.9 ± 0.3 | 1.7 ± 0.3 | 2.2 ± 0.5 |
-
a Kinetic properties for dihydrofolate reductase catalytic activity (kcat = enzymatic turnover number, KM = Michaelis Menten constant, kcat/KM = catalytic efficiency, Ki = inhibition constant for trimethoprim) and protein stability properties (ΔTm = difference in melting temperature of folding with respect to wild type, bis-ANS = relative fluorescence from binding of bis-ANS to molten-globule intermediates with respect to wild type protein).
Additional files
-
Source code 1
Evolution script.
- https://doi.org/10.7554/eLife.50509.025
-
Supplementary file 1
TMT proteomics of naïve and evolved D27 strains.
All abundances are measured relative to WT strain which is taken as reference. Z-scores of abundance variation are calculated as outlined in text (see also Bershtein et al., 2015a)
- https://doi.org/10.7554/eLife.50509.026
-
Supplementary file 2
Variation of abundances of proteins grouped into functional groups according to Sangurdekar et al. (2011).
All protein abundances are relative to WT obtained from TMT proteomics (see Supplementary file 1 for raw data). Average abundance variation z-score of proteins in the group and associated p-values are calculated as described in detail in Bershtein et al. (2015a). Groups marked in red represent functions that exhibit statistically significant increase or decrease of abundances in evolved but not naïve D27 strains.
- https://doi.org/10.7554/eLife.50509.027
-
Supplementary file 3
Variation of abundances of metabolites in naïve and evolved D27 strains.
- https://doi.org/10.7554/eLife.50509.028
-
Supplementary file 4
WGS and Sanger sequencing data for various evolutionary trajectories in naïve and evolved D27 strains.
- https://doi.org/10.7554/eLife.50509.029
-
Supplementary file 5
Single point mutations in thyA and deoB are predicted to impair catalytic activity and/or destabilize the protein.
- https://doi.org/10.7554/eLife.50509.030
-
Supplementary file 6
Key Resource table.
- https://doi.org/10.7554/eLife.50509.031
-
Transparent reporting form
- https://doi.org/10.7554/eLife.50509.032
Download links
A two-part list of links to download the article, or parts of the article, in various formats.
Downloads (link to download the article as PDF)
Open citations (links to open the citations from this article in various online reference manager services)
Cite this article (links to download the citations from this article in formats compatible with various reference manager tools)
Adaptation to mutational inactivation of an essential gene converges to an accessible suboptimal fitness peak
eLife 8:e50509.
https://doi.org/10.7554/eLife.50509


