Gradient-independent Wnt signaling instructs asymmetric neurite pruning in C. elegans
- University of British Columbia, Canada
- Life Sciences Institute, University of British Columbia, Canada
Figures
Figure 1 with 1 supplement
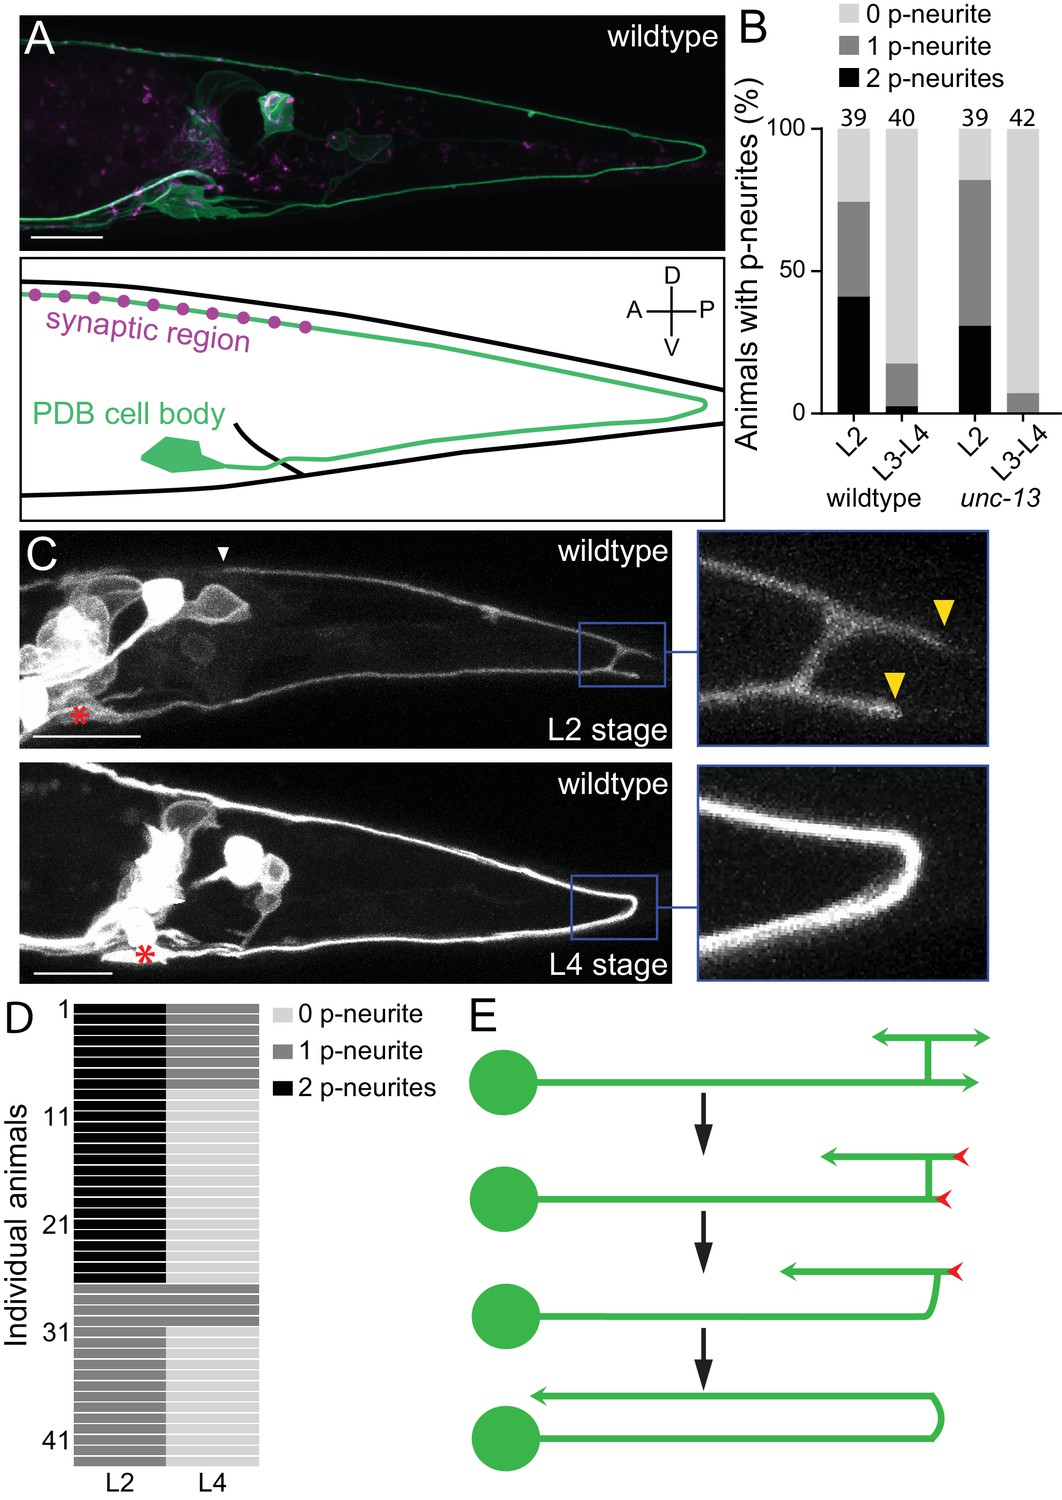
PDB neurites undergo stereotyped asymmetric pruning during development.
(A) Structure of PDB labeled by the mizIs9 transgene. The PDB process and presynaptic sites are labeled with GFPnovo2::CAAX (green) and mCherry::RAB-3 presynaptic vesicle marker (magenta), respectively. A schematic is shown in the bottom panel. (B) Quantification of the number of posterior neurites (p-neurites) in semi-synchronized populations of wildtype and unc-13 mutants at L2 and L4 stages respectively. Sample number is indicated above each bar (C) Representative images of the posterior neurite pruning event in a wildtype animal at L2 and L4 stages. The regions of posterior neurites are magnified in the right panels. Asterisks represent the PDB cell body. White and yellow arrowheads denote the end of anterior and posterior neurites, respectively. (D) Quantification of the posterior neurite number of 43 wildtype animals at L2 and L4 stages. (E) A schematic of asymmetric neurite pruning during PDB development. Green and red arrowheads represent growing and pruning neurites. Scale bars: 10 μm.
-
Figure 1—source data 1
Quantification of the number of posterior neurites.
- https://cdn.elifesciences.org/articles/50583/elife-50583-fig1-data1-v1.xlsx
Figure 1—figure supplement 1

Time-lapse imaging of PDB neurite pruning.
PDB neurite is labeled with ZF1-GFPnovo2::CAAX of the mizIs9 transgene. Images were taken every 5 min. Green arrowheads denote the end of anterior neurite in the first and last frame, and yellow arrowheadss denote the end of posterior neurites during two pruning events. White arrowheads indicate transient neurites from the anterior neurites. We did not conduct detailed analyses on the pruning of these neurites since their position and the timing are less stereotyped than the posterior neurites. Scale bars: 10 μm.
Figure 2 with 1 supplement
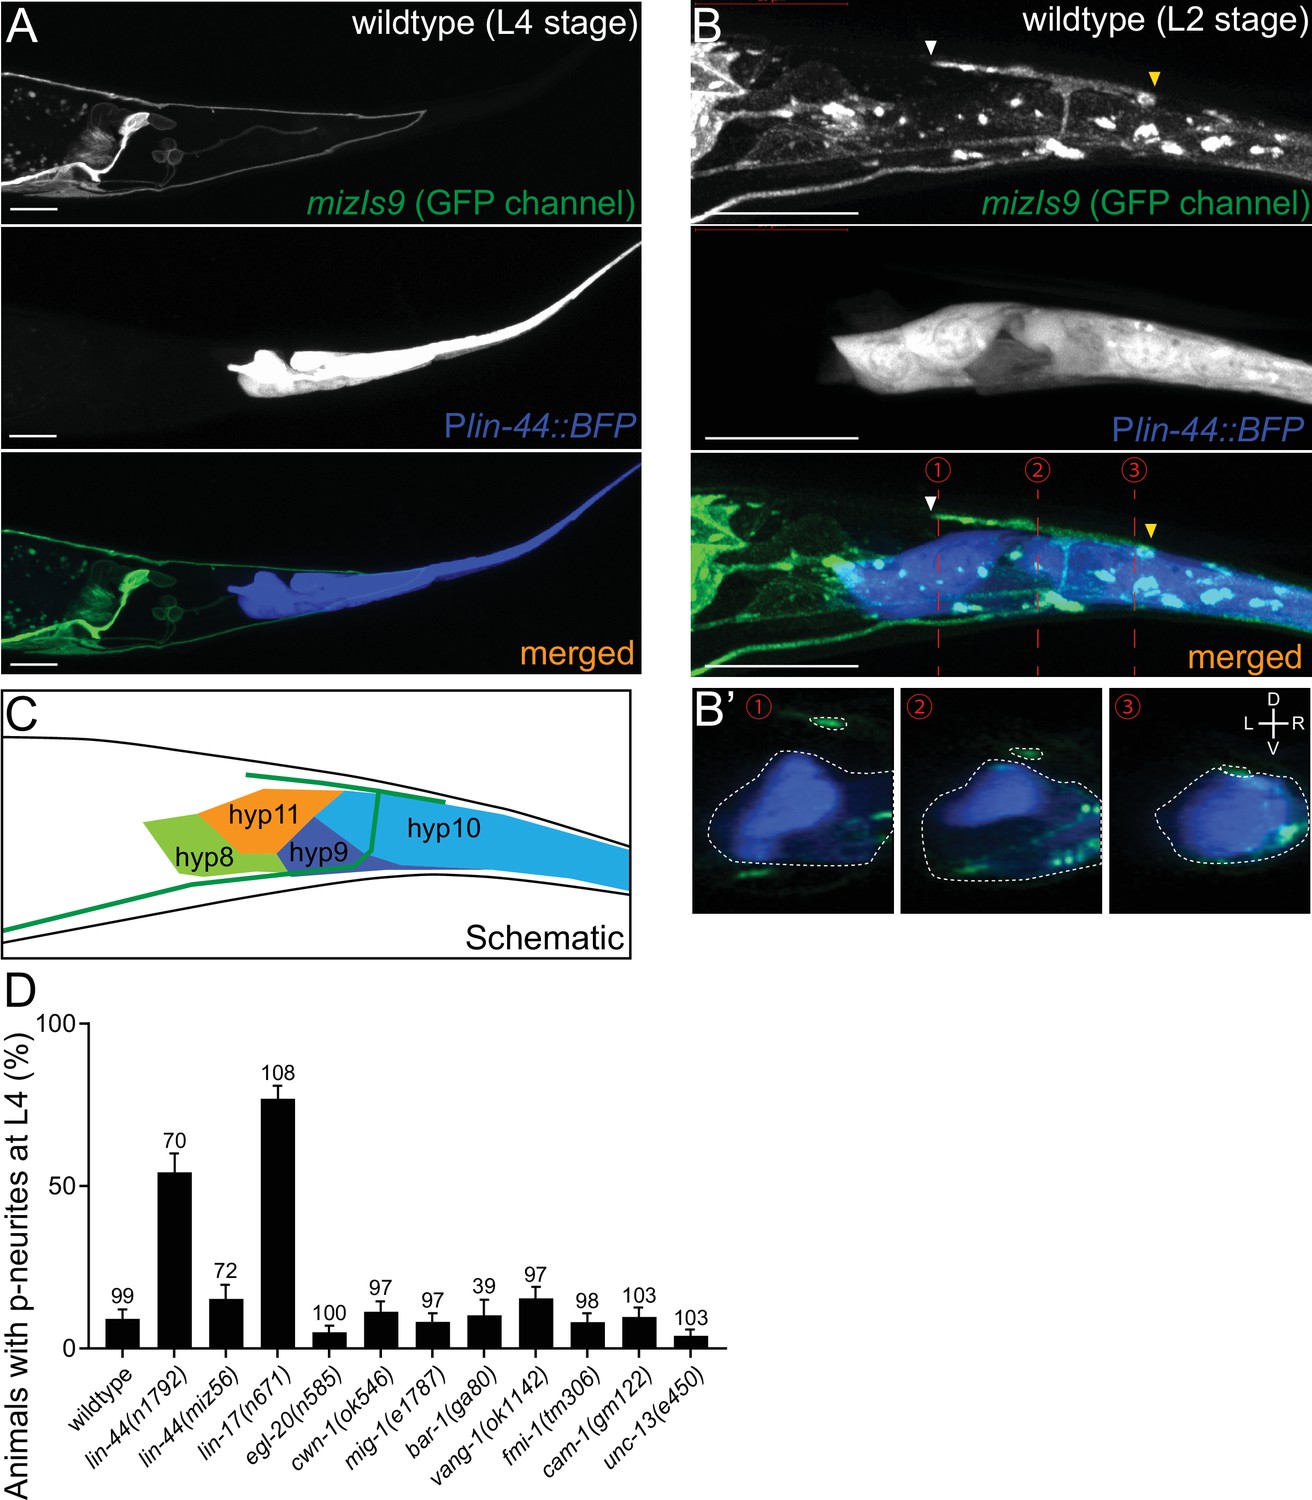
lin-44/wnt expressed adjacent to PDB posterior neurites is required for PDB development.
(A and B) Representative images of PDB neurite labeled with mizIs9 (top panels), lin-44-expressing cells labeled with Plin-44::BFP (middle panels) and merged images (bottom panels) at the L4 stage (A) and during posterior neurite pruning at the L2 stage (B). White and yellow arrowheads denote anterior and posterior neurites respectively. (B’) The transverse section of three positions of PDB neurites (indicated by red dotted lines in B) are reconstituted from the z-stack images shown in B). Dotted circles highlight PDB neurites and lin-44-expressing cells. (C) A schematic of (B). Green line represents PDB neurites. (D) Quantification of the animals with posterior PDB neurites at L4 stage. Animals with defects in PDB cell fate specification and neurite guidance were excluded from this quantification (see Figure 2—figure supplement 1). Error bars represent standard error of proportion (SEP). Sample numbers are shown above each bar. Scale bars: 10 μm.
-
Figure 2—source data 1
Quantification of the animals with posterior PDB neurites.
- https://cdn.elifesciences.org/articles/50583/elife-50583-fig2-data1-v1.xlsx
Figure 2—figure supplement 1
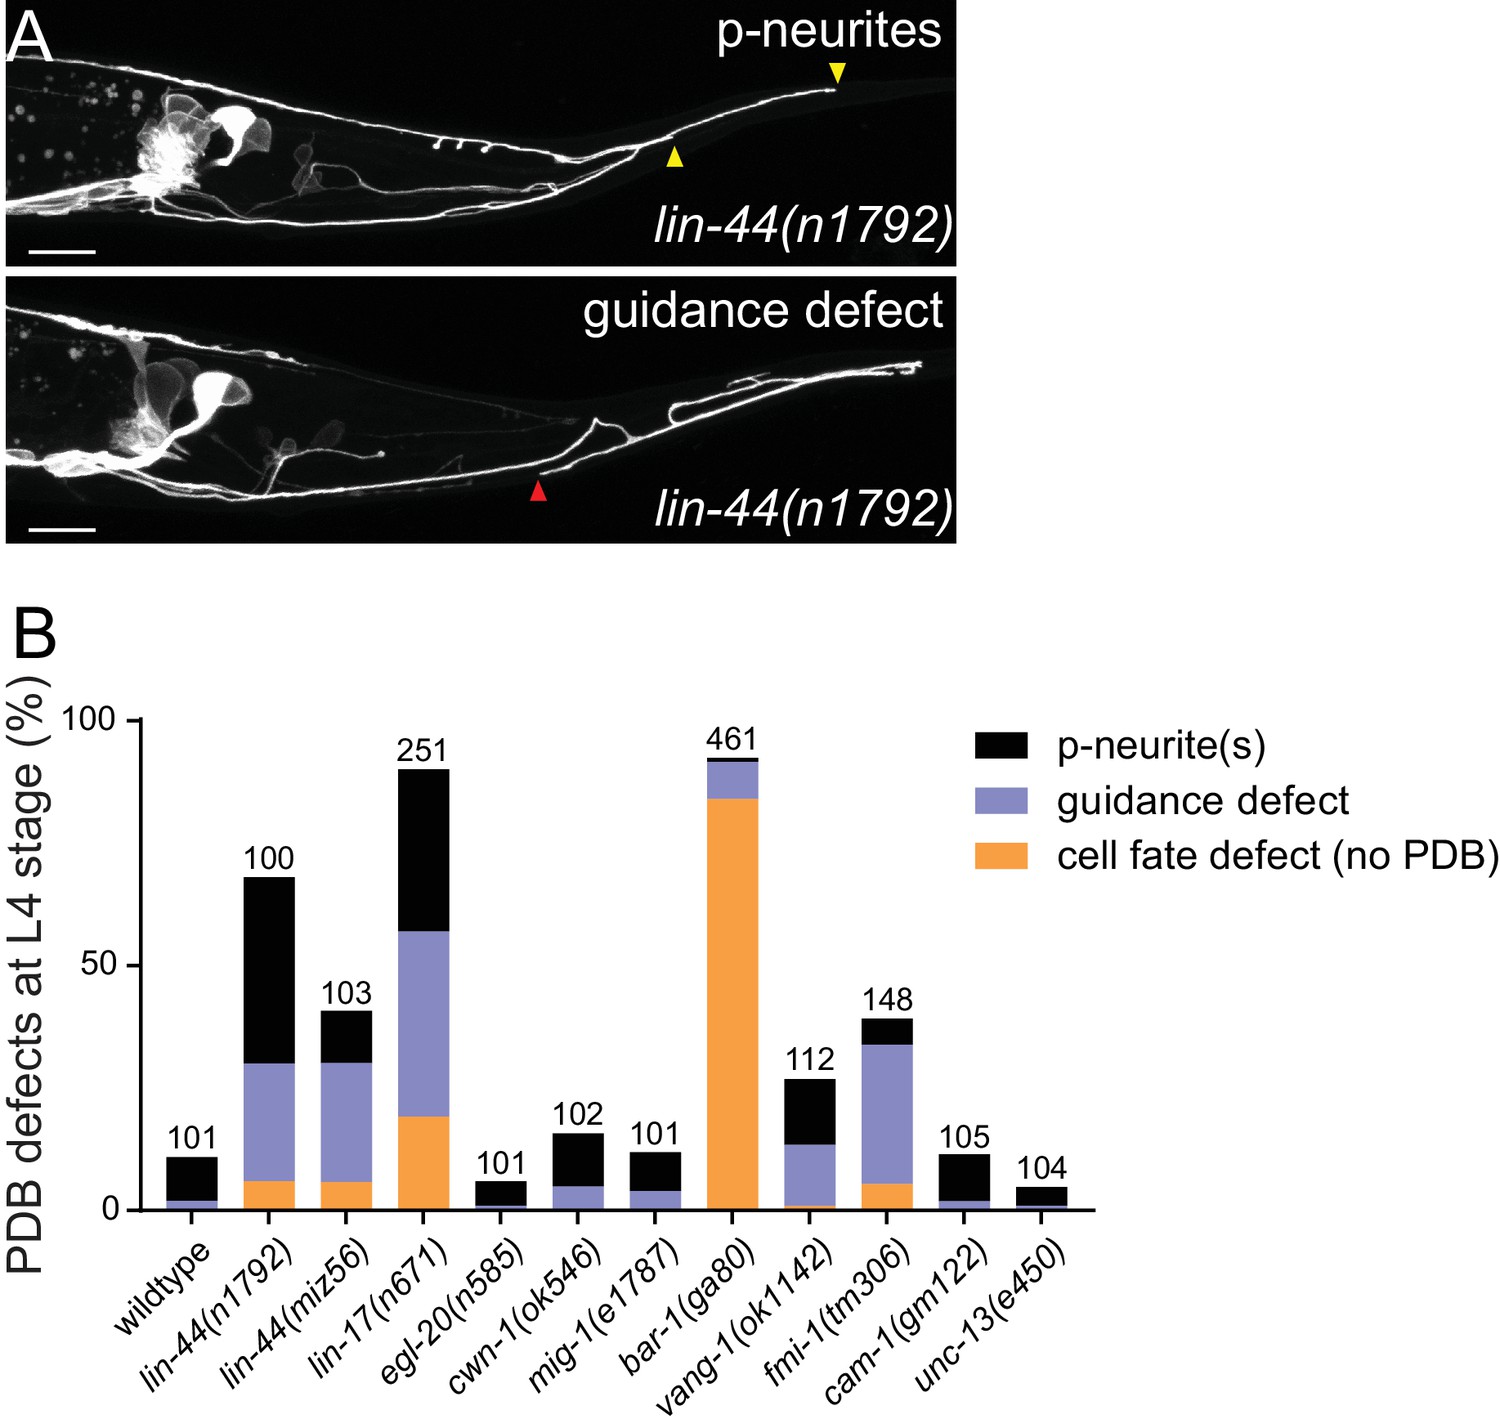
Cell fate and guidance defects of PDB in the mutants of Wnt signaling components.
(A) Representative images of PDB with posterior neurites (top panel) and other defects (guidance defects: bottom panel) in lin-44 mutants. Yellow arrowheads denote posterior neurites, and red arrowhead denotes anterior neurite failed to reach the dorsal nerve cord. (B) Quantification of the animals with defects in PDB cell fate specification and neurite guidance at L4 stage. Sample numbers are shown above each bar. Scale bars: 10 μm.
-
Figure 2—figure supplement 1—source data 1
Quantification of the animals with defects in PDB cell fate specification and neurite guidance.
- https://cdn.elifesciences.org/articles/50583/elife-50583-fig2-figsupp1-data1-v1.xlsx
Figure 3 with 1 supplement
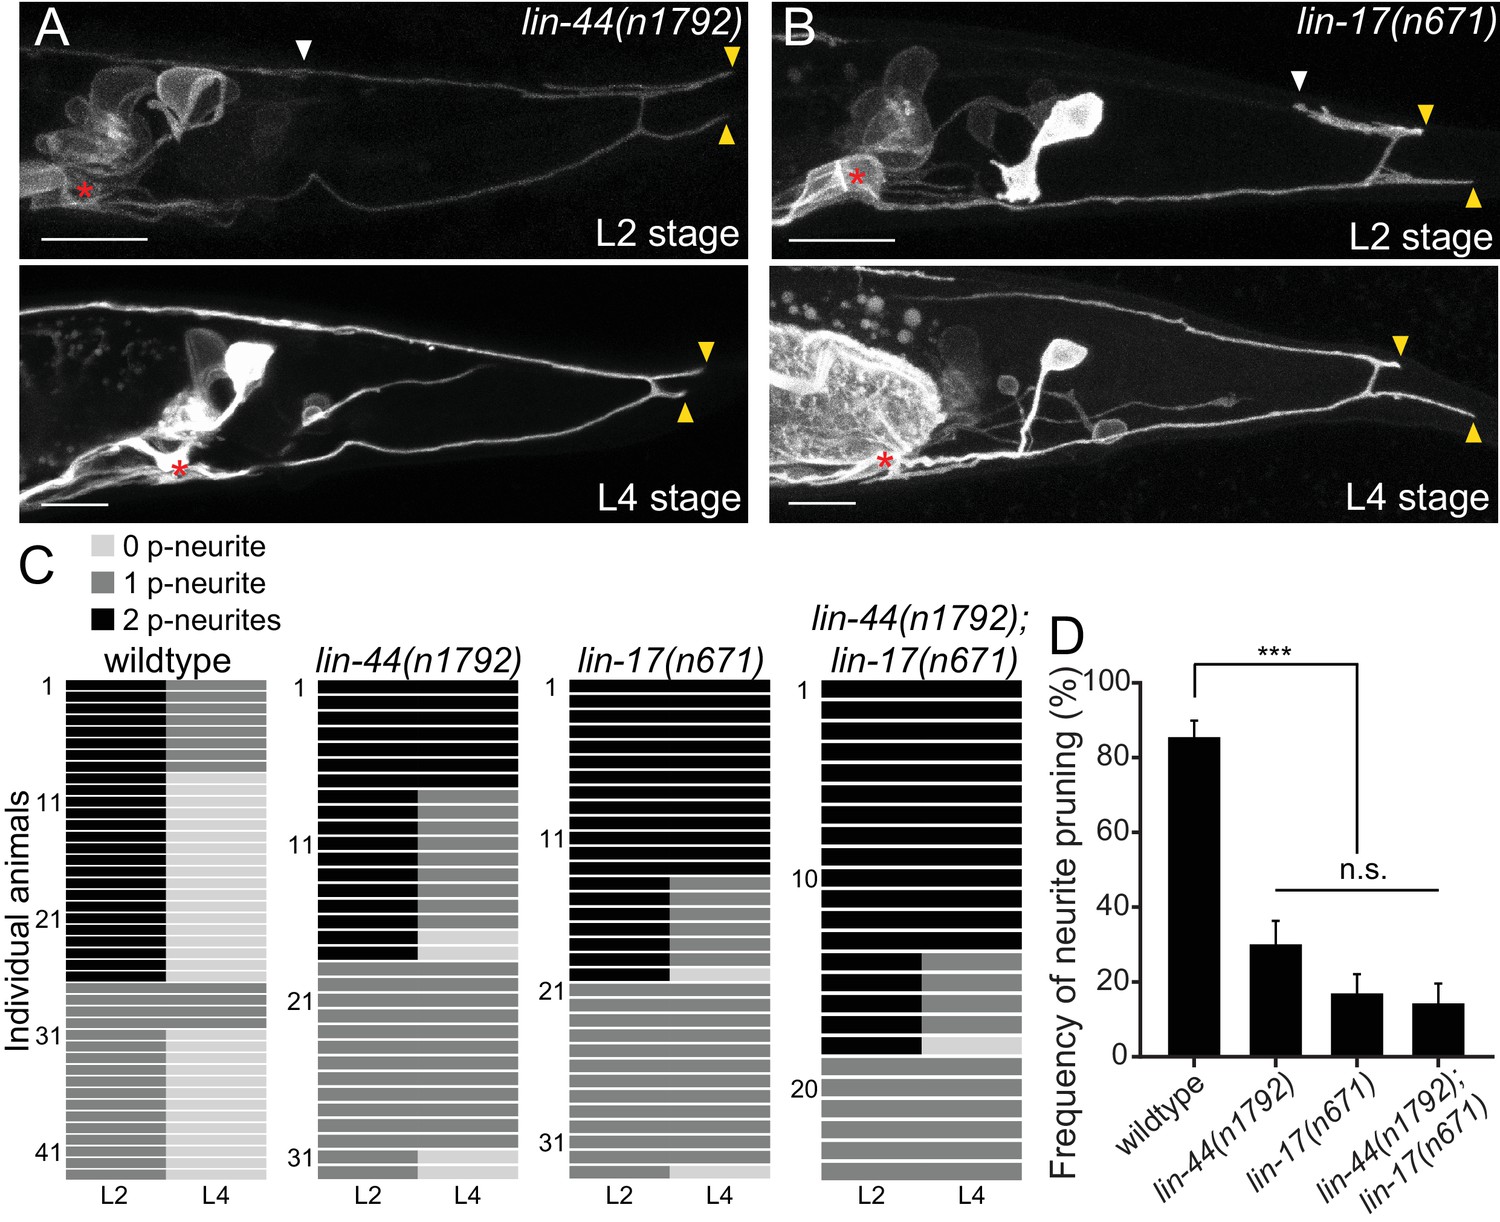
lin-44/wnt and lin-17/fz are required for the posterior neurite pruning.
(A and B) Representative images of single animals of lin-44(n1792) (A) and lin-17(n671) (B) mutants at L2 (top panels) and L4 (bottom panels) stages. Asterisks represent PDB cell body. White and yellow arrowheads denote anterior and posterior neurites respectively. (C) Quantification of the posterior neurite number of individual animals at L2 and L4 stages in each genetic background. Note that quantification of wildtype is from Figure 1. (D) Quantification of the posterior neurite pruning frequency. ***p<0.001; n.s., not significant (Chi-square with Yates' correction). Error bars represent standard error of proportion (SEP). Scale bars: 10 μm.
-
Figure 3—source data 1
Quantification of the posterior neurite pruning frequency.
- https://cdn.elifesciences.org/articles/50583/elife-50583-fig3-data1-v1.xlsx
Figure 3—figure supplement 1

lin-17/fz acts cell-autonomously in PDB.
(A) Quantification of the posterior neurite numbers of individual animals at L2 and L4 stages in lin-17 mutants and lin-17 mutants with rescuing transgenes. Note that quantification of lin-17 mutants is from Figure 3. Two independent transgenic lines are quantified (line #1 and line #2) for each rescuing construct. (B) Quantification of posterior neurite pruning frequency. ***p<0.001; **p<0.002 (Chi-square test with Yates' correction). Error bars represent standard error of proportion (SEP).
-
Figure 3—figure supplement 1—source data 1
Quantification of posterior neurite pruning frequency.
- https://cdn.elifesciences.org/articles/50583/elife-50583-fig3-figsupp1-data1-v1.xlsx
Figure 4
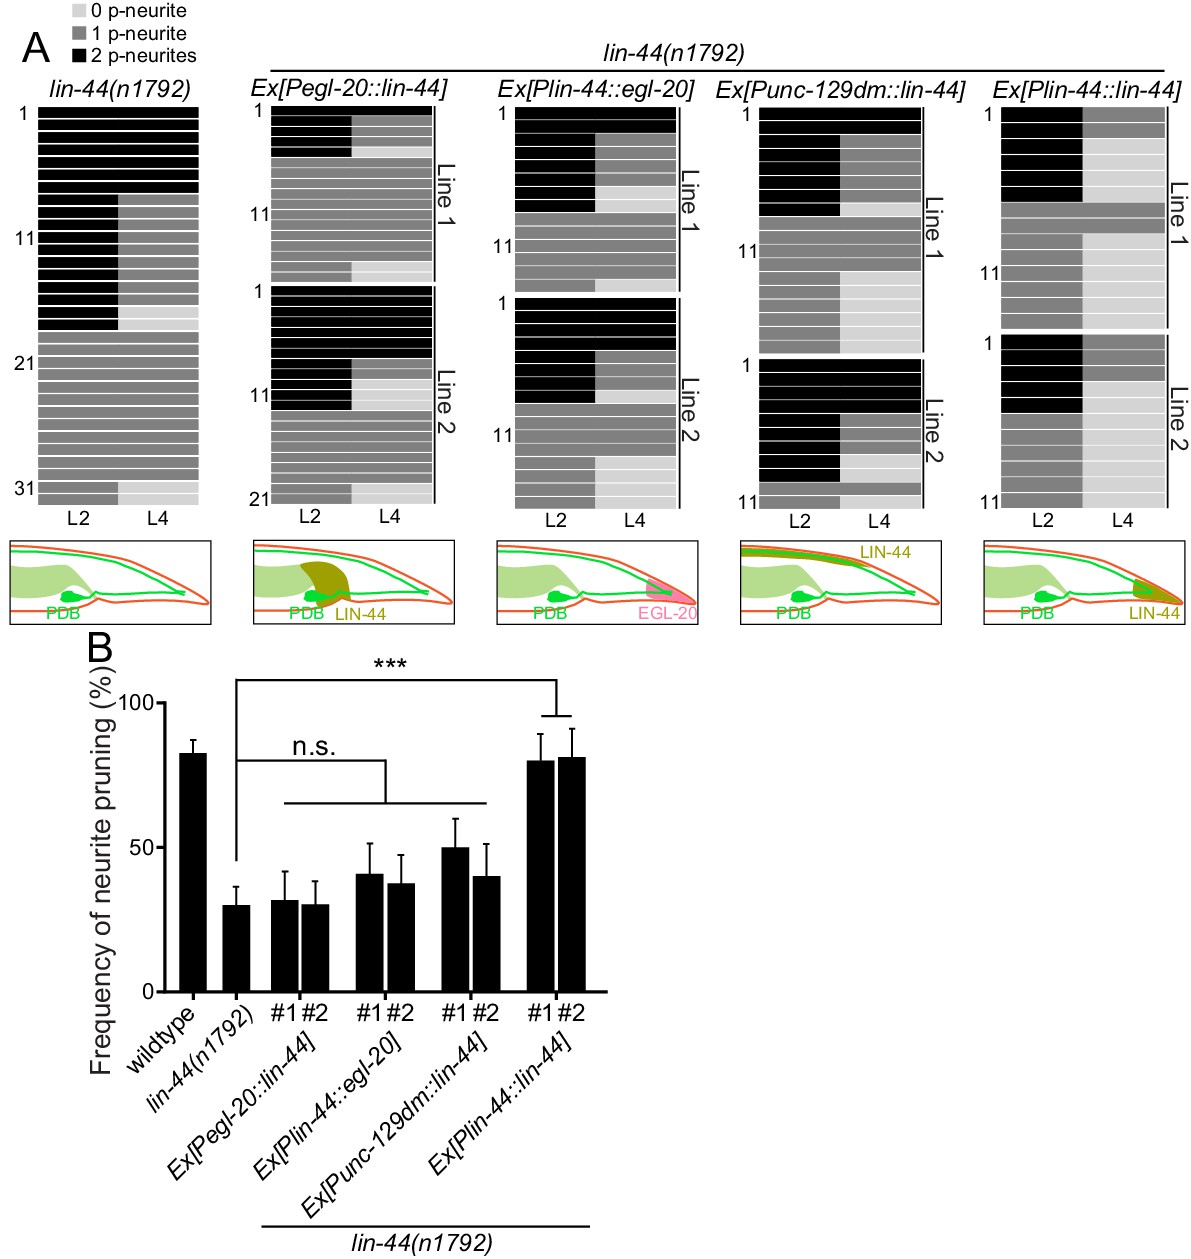
lin-44 but not egl-20 instructs neurite pruning in PDB.
(A) Quantification of the posterior neurite numbers of individual animals at L2 and L4 stages in lin-44 mutants and lin-44 mutants with rescuing transgenes. Note that the quantification of lin-44 mutants is from Figure 3. Bottom panels are schematics showing the expression domain of lin-44 (green) and egl-20 (magenta) in each genotype. Two independent transgenic lines are quantified (line #1 and line #2) for each rescuing construct. (B) Quantification of posterior neurite pruning frequency. ***p<0.001; n.s., not significant (Chi-square with Yates' correction). Error bars represent standard error of proportion (SEP).
-
Figure 4—source data 1
Quantification of posterior neurite pruning frequency.
- https://cdn.elifesciences.org/articles/50583/elife-50583-fig4-data1-v1.xlsx
Figure 5
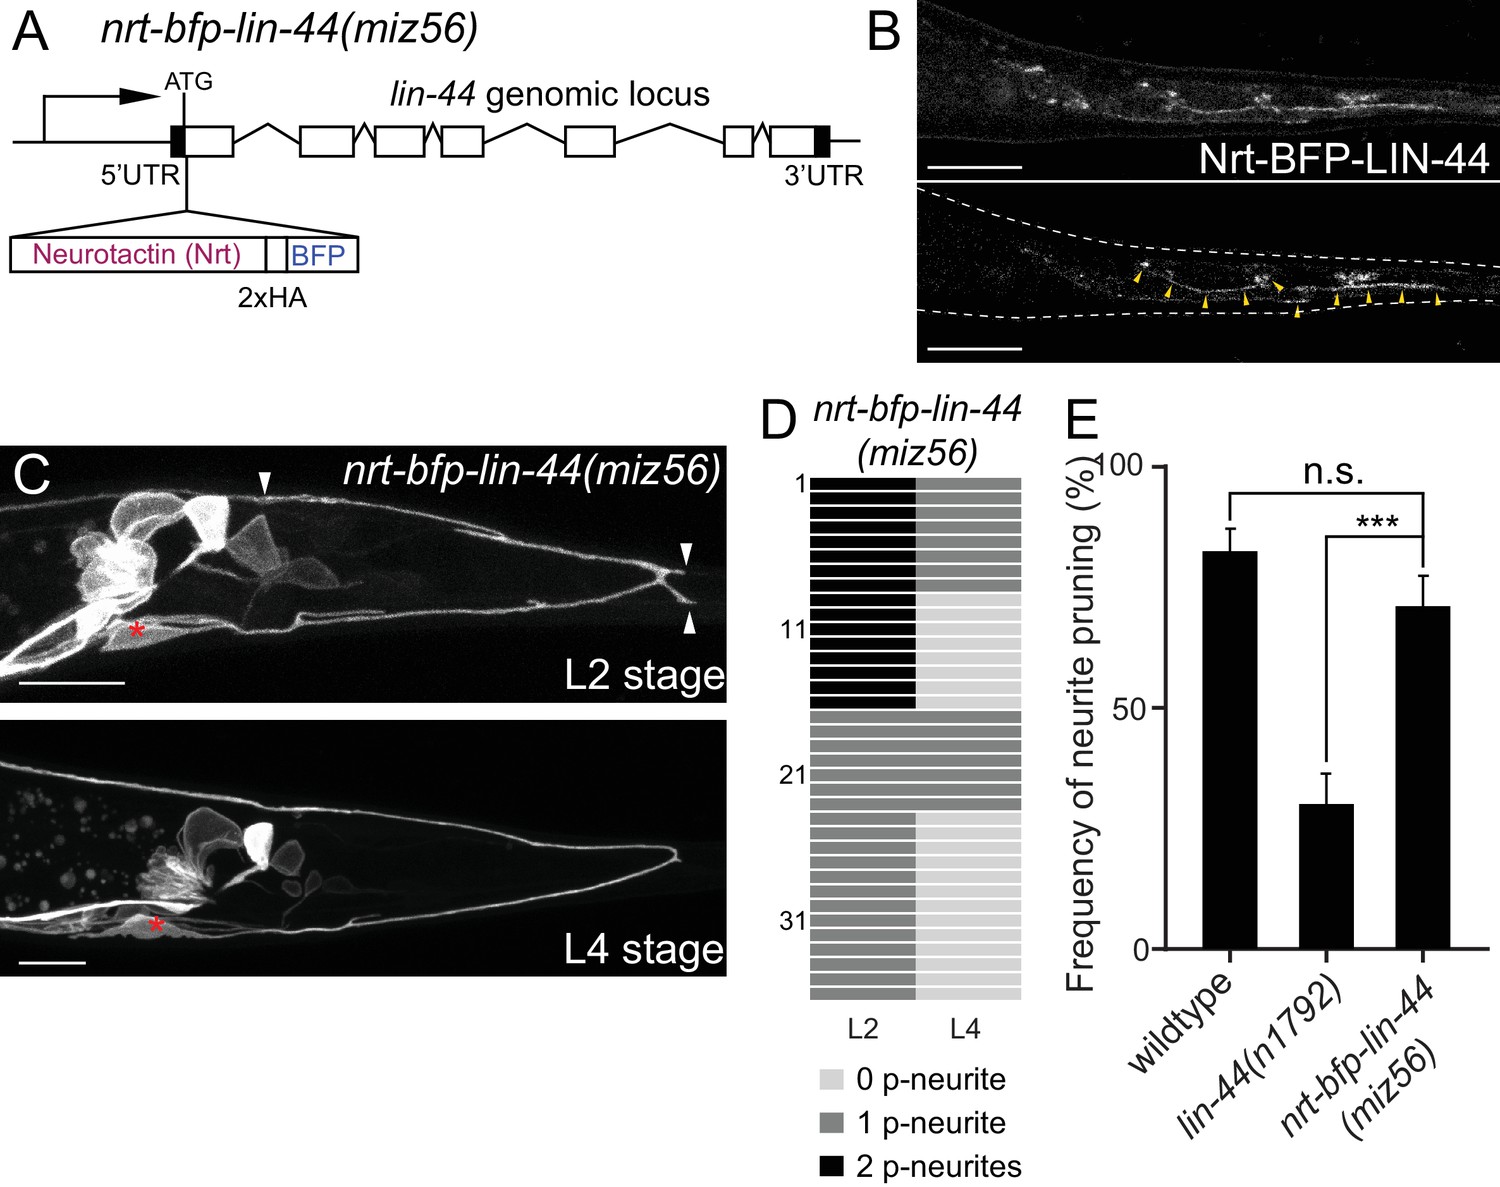
Membrane-tethered LIN-44 is sufficient to induce posterior neurite pruning in PDB.
(A) A genomic structure of lin-44 locus in nrt-bfp-lin-44(miz56) mutants. (B) Subcellular localization of Nrt-BFP-LIN-44 in the adult animal. Maximum projection (top panel) and single plane (bottom panel) from z-stack images. Arrowheads denote Nrt-BFP-LIN-44 signal on the membrane. (C) Representative images of PDB structure labeled with mizIs9 showing the pruning of posterior neurites in nrt-bfp-lin-44(miz56). (D) Quantification of the posterior neurite numbers of 36 individual animals at L2 and L4 stages in nrt-bfp-lin-44(miz56) mutants. (E) Quantification of posterior neurite pruning frequency. ***p<0.001; n.s., not significant (Chi-square with Yates' correction). Error bars represent standard error of proportion (SEP). Scale bars: 10 μm.
Figure 6 with 1 supplement
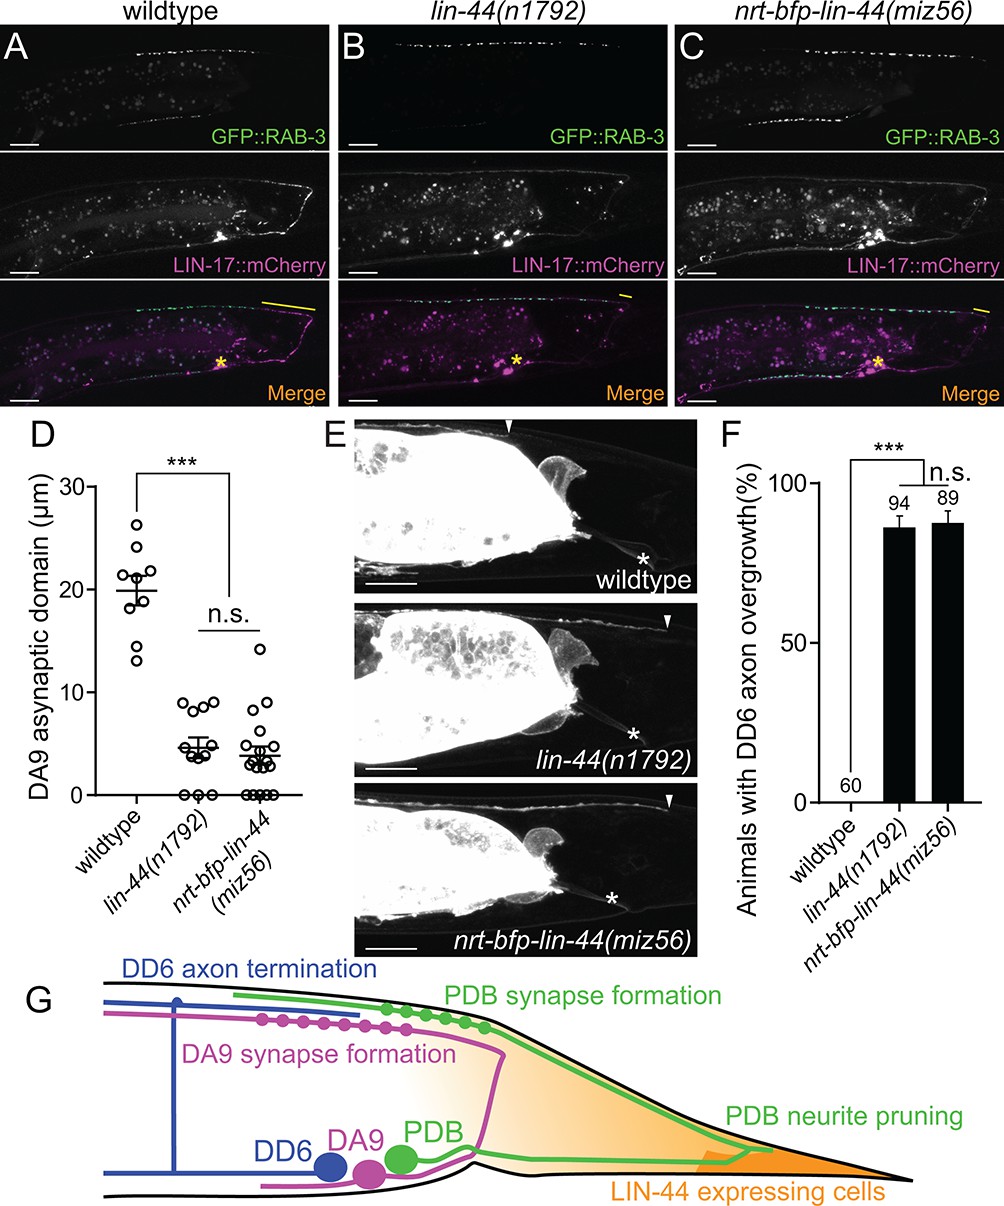
Membrane-tethered LIN-44 does not function as a gradient signal.
(A–C) Representative images of DA9 presynaptic specializations labeled with GFP::RAB-3 (top panels), LIN-17::mCherry localization (middle panels) and merged images (bottom panels) in N2 (A), lin-44(n1792) (B) and nrt-bfp-lin-44(miz56) (C) animals. Asterisks denote DA9 cell body, and yellow lines represent the posterior asynaptic domain of the DA9 dorsal axon. GFP::RAB-3 puncta in the ventral side of the worm is due to the expression of Pmig-13::gfp::rab-3 in the VA12 motor neuron. (D) Quantification of the DA9 asynaptic domain length. The DA9 asynaptic domain is defined by the distance between the most posterior mCherry::RAB-3 puncta and the DA9 commissure. Each dot represents an individual animal. Error bars indicate mean ± SEM. ***p<0.001; n.s., not significant (one-way ANOVA). (E) Representative image of DD6 posterior axon in wildtype (top panel), lin-44(n1792) (middle panel) and nrt-bfp-lin-44(miz56) (bottom panel). Asterisks denote the position of the rectum; arrowheads denote the end of DD6 axon. (F) Quantification of DD6 axon overgrowth defect. Animals were considered as defective if DD6 axon terminal was located posteriorly to the rectum. ***p<0.001; n.s., not significant (Chi-square test). Error bars represent standard error of proportion (SEP). (G) Schematic of the relative positions of DD6, DA9, PDB neurons and lin-44 expressing cells. Light graded orange represents hypothetical LIN-44 gradient. Scale bars: 10 μm.
-
Figure 6—source data 1
Quantification of DA9 and DD6 defects.
- https://cdn.elifesciences.org/articles/50583/elife-50583-fig6-data1-v1.xlsx
Figure 6—figure supplement 1
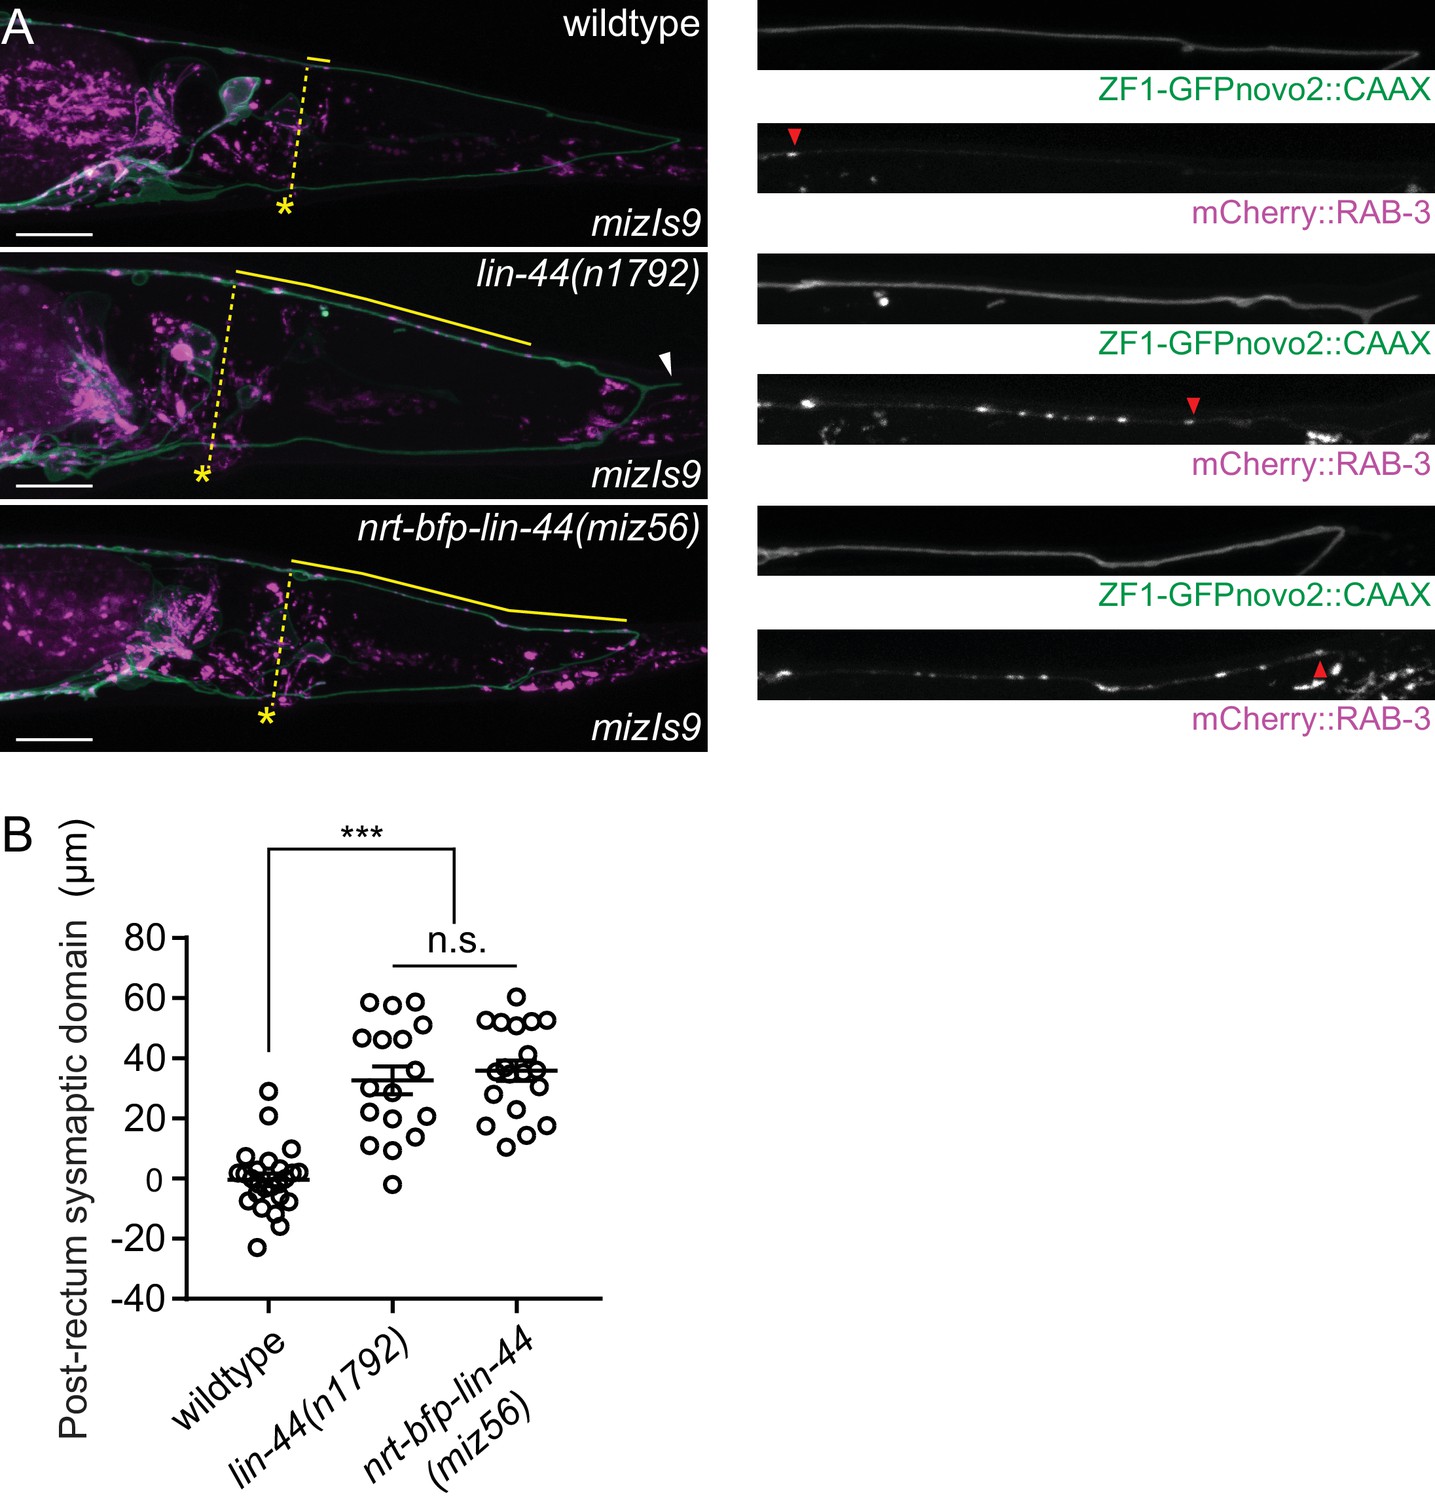
LIN-44 gradient-dependent localization of RAB-3 in PDB.
(A) Representative image of the PDB structure and presynaptic marker localization labeled with mizIs9 PDB marker in wildtype (top), lin-44 null (middle) and nrt-bfp-lin-44 (bottom) animals. The dotted lines indicate the minimum distance from the anus to the dorsal neurite of PDB, which was used as a reference point to quantify the relative position of RAB-3 puncta in the dorsal neurite of PDB. Solid yellow lines represent the distance between the reference point and the most posterior RAB-3 puncta in each genotype. Magnified images of the dorsal neurite of PDB in green (ZF1-GFPnovo2::CAAX) and red (mCherry::RAB-3) channels are shown in the right panels. (B) Quantification of the RAB-3 puncta localization. The value represents the distance from the reference point in the dorsal neurite of PDB to the most posterior RAB-3 punctum. Positive and negative values indicate that the most posterior RAB-3 punctum is located posteriorly or anteriorly to the reference point, respectively. Error bars indicate mean ± SEM. ***p<0.001; n.s., not significant (one-way ANOVA).
-
Figure 6—figure supplement 1—source data 1
Quantification of the RAB-3 puncta localization.
- https://cdn.elifesciences.org/articles/50583/elife-50583-fig6-figsupp1-data1-v1.xlsx
Figure 7 with 1 supplement
LIN-44/Wnt-dependent localization of LIN-17/Fz at the PDB posterior neurites.
(A–C) Representative images of LIN-17::GFP localization (top panels), PDB neurite structure labeled with cytoplasmic BFP (middle panels) and merged images (bottom panels) in wildtype (A), lin-44(n1792) (B), and nrt-bfp-lin-44(miz56) (C) animals, respectively. Magnified images of the tip of anterior and posterior neurites are shown in the right panels. (D) Quantification of the normalized GFP/BFP signal ratio at the anterior and posterior growth cones. Error bars indicate mean ± SEM. ***p<0.001; n.s., not significant (Ratio paired t-test).
-
Figure 7—source data 1
Quantification of the normalized GFP/BFP signal ratio at the anterior and posterior growth cones.
- https://cdn.elifesciences.org/articles/50583/elife-50583-fig7-data1-v1.xlsx
Figure 7—figure supplement 1

Wnt-dependent localization of DSH-1/Dsh at the PDB posterior neurites.
(A–D) Representative images of DSH-1::GFP localization (top panels), PDB neurite structure labeled with cytoplasmic BFP (middle panels) and merged images (bottom panels) in wildtype (A), lin-44(n1792) (B), lin-17(n671) (C) and nrt-bfp-lin-44(miz56) (D) animals, respectively. Magnified images of the tip of anterior and posterior neurites are shown in the right panels. (E) Quantification of the normalized GFP/BFP signal ratio at the anterior and posterior growth cones. Error bars indicate mean ± SEM. ***p<0.001; n.s., not significant (Ratio paired t-test).
-
Figure 7—figure supplement 1—source data 1
Quantification of the normalized GFP/BFP signal ratio at the anterior and posterior growth cones.
- https://cdn.elifesciences.org/articles/50583/elife-50583-fig7-figsupp1-data1-v1.xlsx
Figure 8
A model of neurite pruning in PDB.
Local and high concentration of LIN-44/Wnt from the tail hypodermal cell (hyp10) induces PDB neurite pruning via recruiting LIN-17/Fz and DSH-1/Dsh in wildtype (left panel) and defective pruning in lin-44 mutants (right panel).
Tables
Key resources table
| Reagent type (species) or resource | Designation | Source or reference | Identifiers | Additional information |
|---|---|---|---|---|
| Gene (C. elegans) | lin-44 | NA | E01A2.3 | |
| Gene (C. elegans) | lin-17 | NA | Y71F9B.5 | |
| Strain, strain background (C. elegans) | lin-44(n1792) | C. elegans stock center (CGC) | MT5383 | |
| Strain, strain background (C. elegans) | lin-17(n671) | C. elegans stock center (CGC) | MT1306 | |
| Strain, strain background (C. elegans) | lin-44(miz56) | This study | UJ1124 | nrt-bfp-lin-44 |
| Strain, strain background (C. elegans) | mizIs9 | This study | UJ261 | PDB neurite/synaptic marker |
Additional files
Download links
A two-part list of links to download the article, or parts of the article, in various formats.
Downloads (link to download the article as PDF)
Open citations (links to open the citations from this article in various online reference manager services)
Cite this article (links to download the citations from this article in formats compatible with various reference manager tools)
Gradient-independent Wnt signaling instructs asymmetric neurite pruning in C. elegans
eLife 8:e50583.
https://doi.org/10.7554/eLife.50583


