Differential requirements for cyclase-associated protein (CAP) in actin-dependent processes of Toxoplasma gondii
- Signalling in Apicomplexan Parasites Laboratory, The Francis Crick Institute, United Kingdom
- Electron Microscopy Science Technology Platform, The Francis Crick Institute, United Kingdom
- University of Vermont Larner College of Medicine, United States
- University of Connecticut, United States
Figures
Figure 1 with 1 supplement
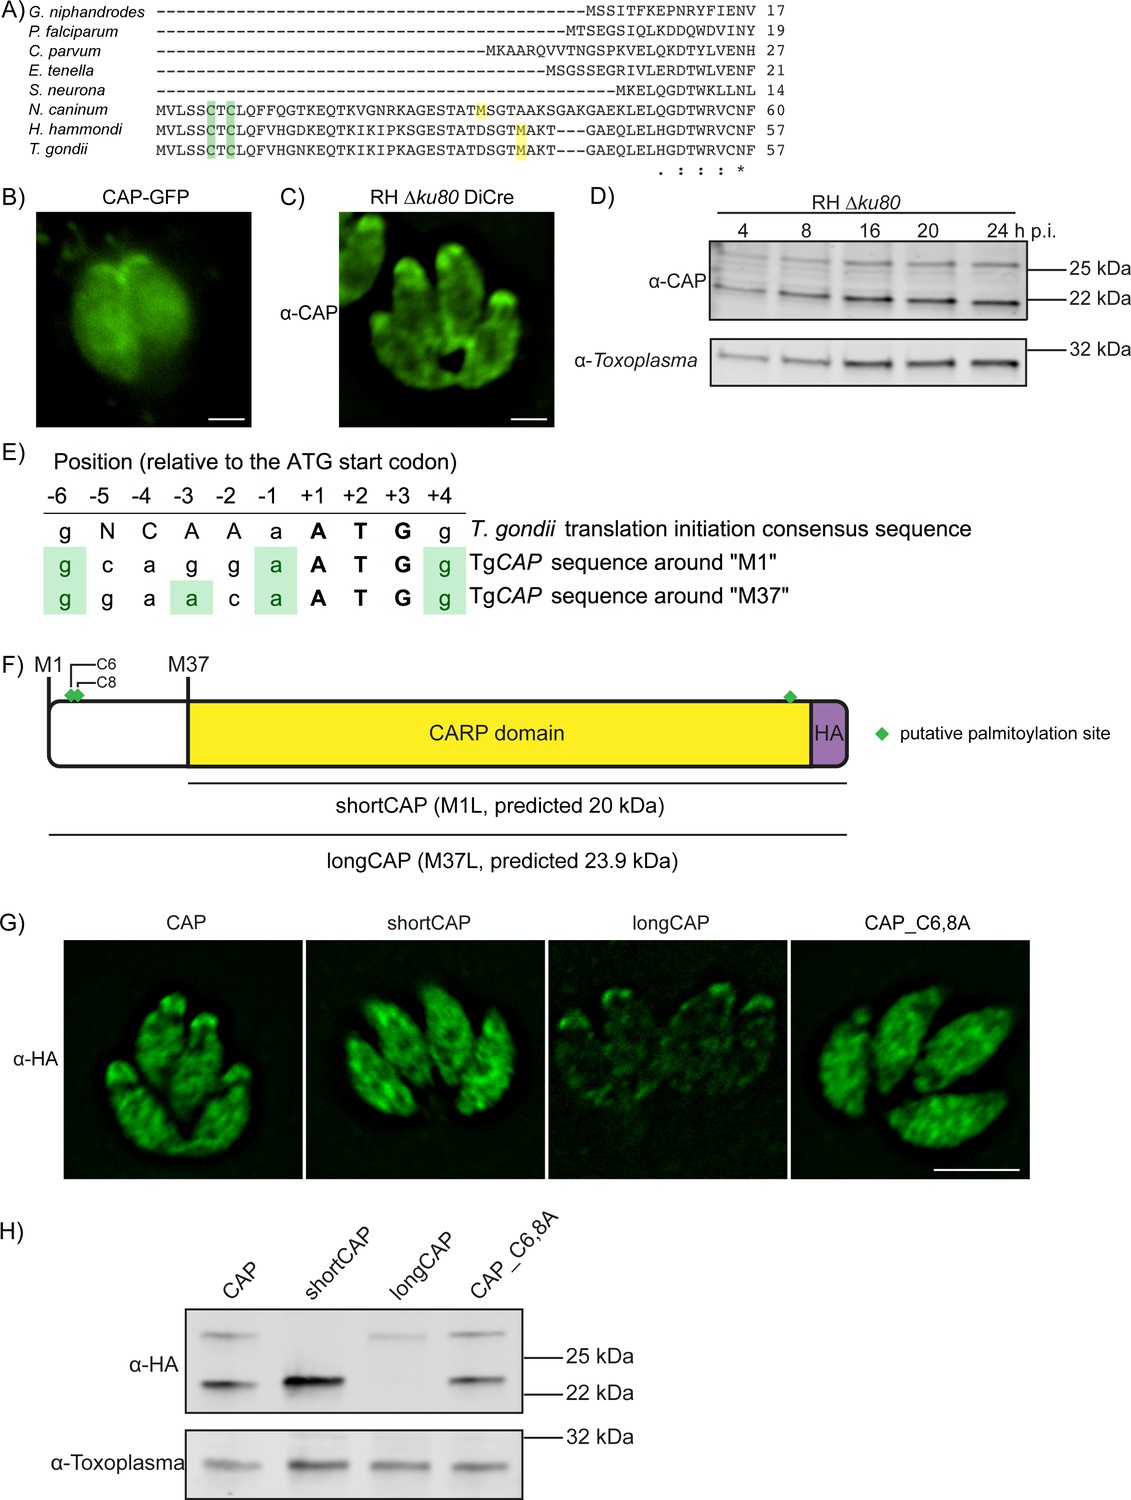
Alternative translational start sites lead to the generation of two different CAP isoforms.
(A) Sequence alignment of the first 57 amino acid residues of T. gondii CAP with that of other Apicomplexa. Green shading indicates cysteines which are putative palmitoylation sites, yellow shading indicates methionines which are putative alternative translational start sites. (B) Subcellular localisation of a CAP-GFP fusion. Scale bar, 2 µm. (C) Subcellular localisation of CAP by immunofluorescence assay (IFA) using rabbit anti-T. gondii CAP antibodies. Scale bar, 2 µm. (D) Western blot of CAP expression levels over the first 24 hr following host cell invasion using anti-T. gondii CAP antibodies. Anti-Toxoplasma antibodies were used as a loading control. (E) Alignment of the Toxoplasma consensus translation initiation (Kozak) sequence (Seeber, 1997) with the translation initiation sequences of CAP’s first (M1) and second (M37) putative translational start sites. Green shading indicates bases that correspond to the Kozak sequence. (F) Schematic of T. gondii CAP with annotations for the two putative CAP isoforms and the mutation experiments performed to test their expression: Mutation of M1 to leucine (L) to produce shortCAP, and mutation of M37 to L producing longCAP. Green diamonds indicate putative palmitoylation sites. (G) IFA and (H) western blot of ectopic HA-tagged CAP isoforms and cysteine mutants (C6 and C8). Inclusion of a HA-tag makes the protein run more slowly than the untagged protein. Anti-Toxoplasma antibodies were used as a loading control in (H). Scale bar in (G), 5 µm.
Figure 1—figure supplement 1
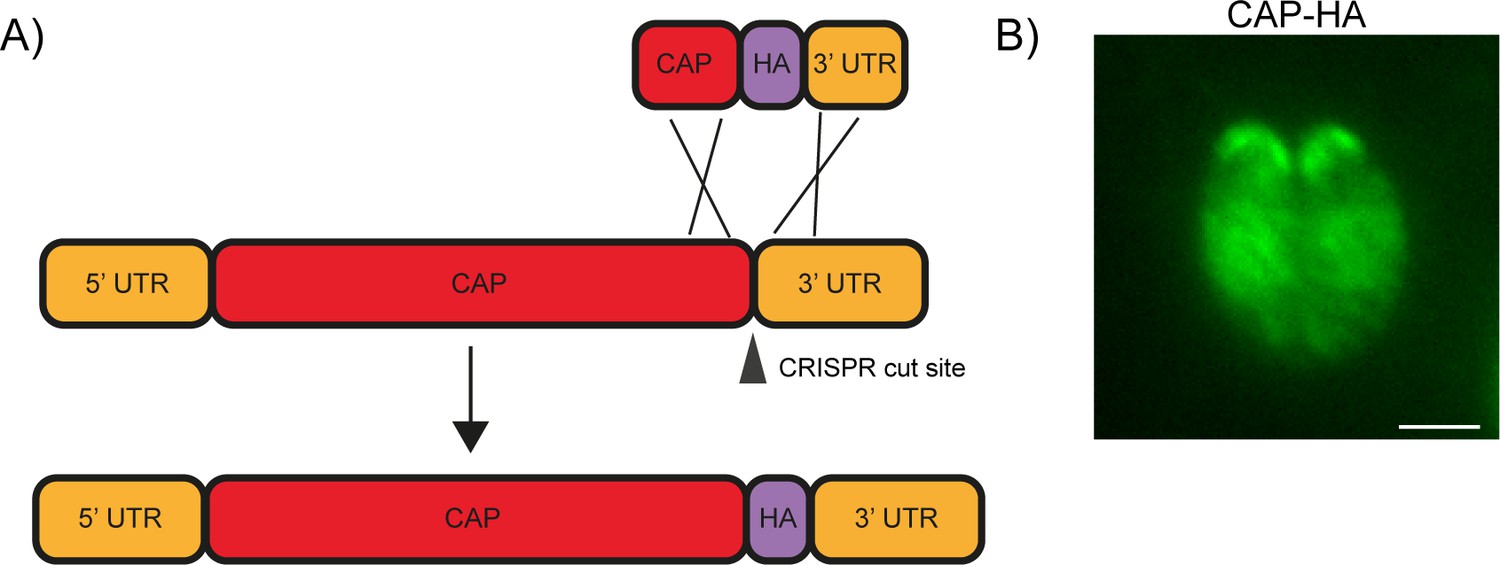
Endogenous tagging of CAP.
(A) Schematic of CAP endogenous tagging strategy. Arrowhead indicates CRISPR/CAS9 cut site. (B) IFA of the resulting HA-tagged line. Scale bar, 2 µm.
Figure 2 with 1 supplement
A second generation RH ∆ku80 DiCre_T2A parasite strain stably expresses DiCre.
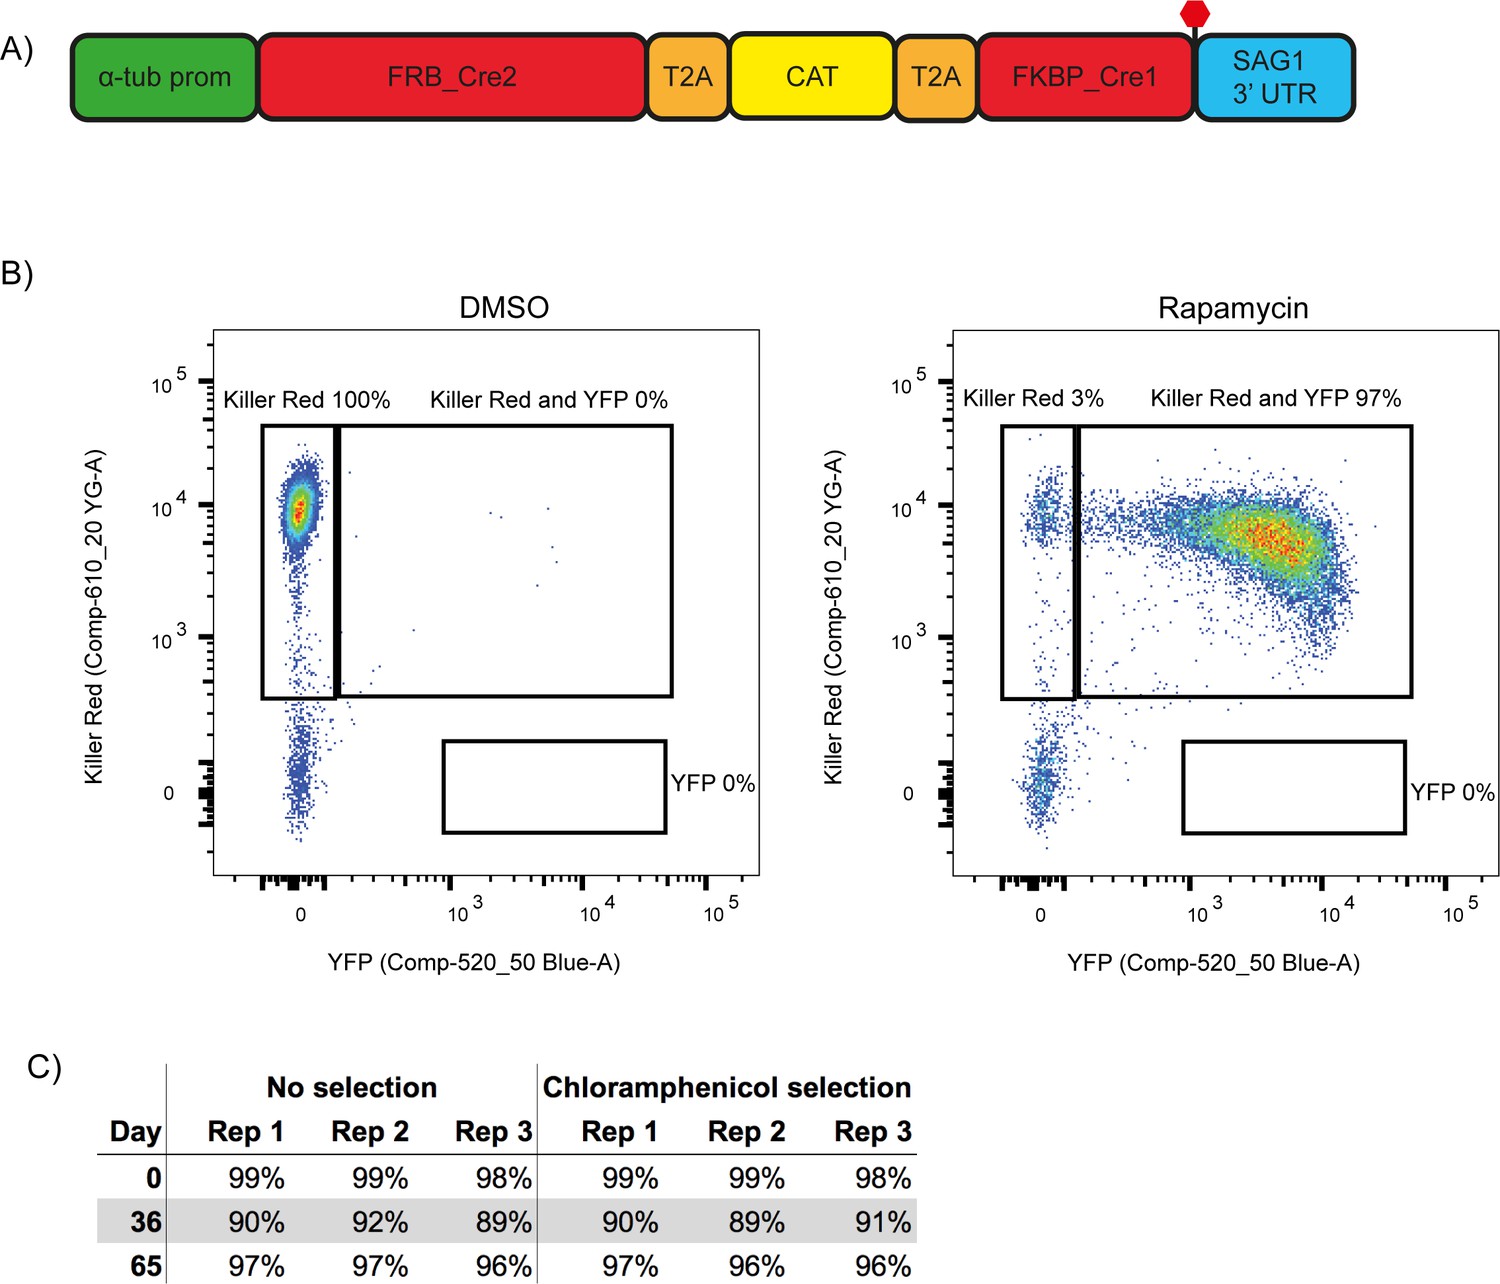
(A) Schematic of the DiCre_T2A expression construct. The chloramphenicol resistance cassette (CAT) is flanked by T2A skip peptides. The two Cre subunits (FRB_Cre2 and FKBP_Cre1) are located on either side of the T2A::CAT::T2A cassette. The fusion protein is driven by the alpha-tubulin promotor with a SAG1 3’ UTR. The red hexagon indicates the position of the stop-codon. (B) Flow cytometry analysis to determine excision efficiency of the RH DiCre_T2A ∆ku80 line following 65 days of frequent extracellular stress. Excision is determined by a shift from Killer Red(+) to Killer Red(+) and YFP(+) expression. Parasites were analysed 22 hr after induction with 50 nM rapamycin (RAP) for 4 hr. Due to analysing 22 hr after induction of excision, parasites still have residual KillerRed signal. (C) Table summarising the excision efficiency of RAP treated RH DiCre_T2A ∆ku80 parasites over time in the presence or absence of chloramphenicol selection. ‘Day’ refers to the number of days in cell culture while ‘rep’ corresponds to biological replicates.
Figure 2—figure supplement 1
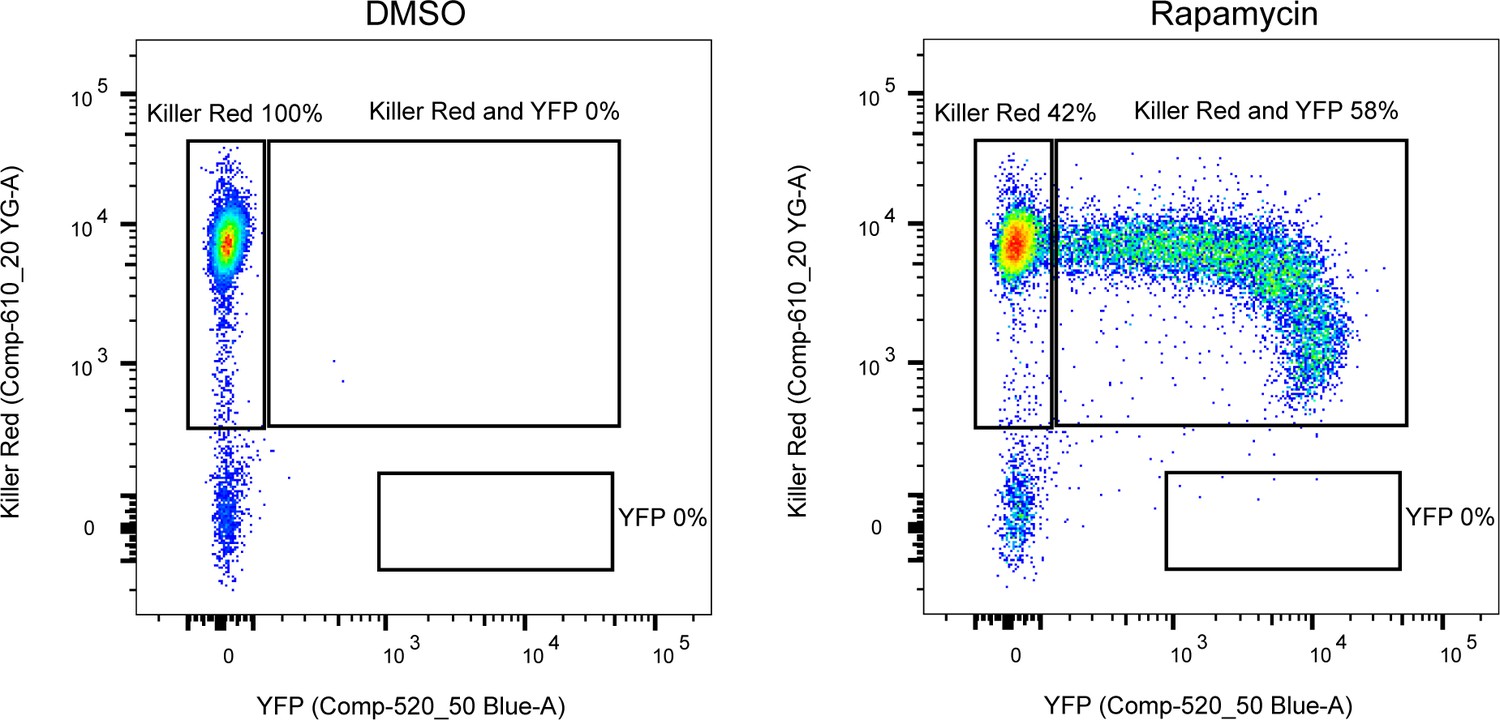
Excision efficiency testing of RH DiCre ∆ku80∆hxgprt.
Flow cytometry analysis to determine excision efficiency of the original RH DiCre ∆ku80∆hxgprt line following 65 days of standard, non-stressing, culture conditions. Excision is determined by a shift from Killer Red(+) to Killer Red(+) and YFP(+) expression. Parasites were analysed 22 hr after induction with 50 nM rapamycin (RAP) for 4 hr. Due to analysing 22 hr after induction of excision, parasites still have residual KillerRed signal.
Figure 3 with 2 supplements
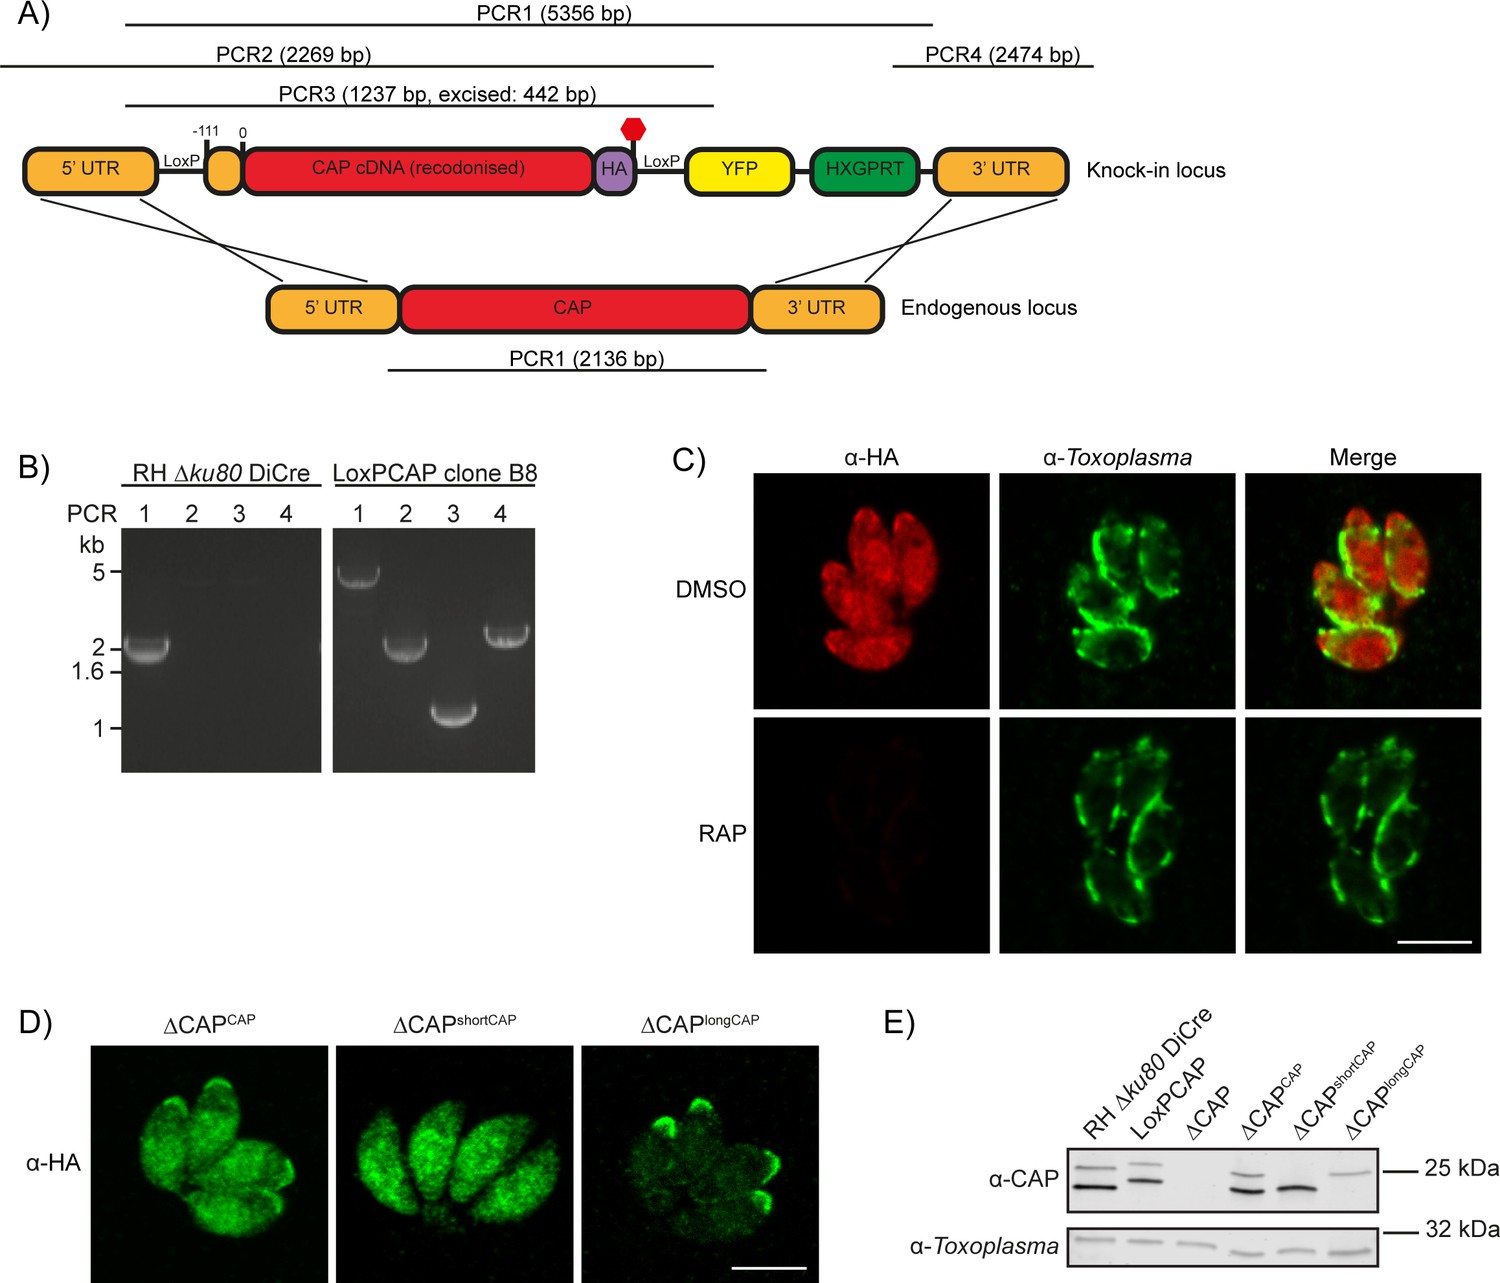
Generation of CAP conditional knockout and complementation strains.
(A) Schematic of the CAP conditional knock out strategy using double homologous integration. The position of the 5’ loxP site in the CAP promotor is indicated as well as the predicted sizes of the PCR amplicons. (B) Agarose gel showing the expected PCR products for correct integration at the endogenous locus. (C) IFA 46 hr after treatment with DMSO or 50 nM rapamycin for 4 hr. Scale bar, 5 µm. (D) Subcellular localisation of ectopic HA-tagged CAP isoforms, in the ∆CAP background. Images have been individually contrast adjusted to aid in visualising protein localisation. Scale bar, 5 µm. (E) Western blot showing absence of CAP and ectopic HA-tagged CAP isoform expression in the cloned ∆CAP background using anti-T. gondii CAP antibodies. Anti-Toxoplasma antibodies were used as a loading control.
Figure 3—figure supplement 1
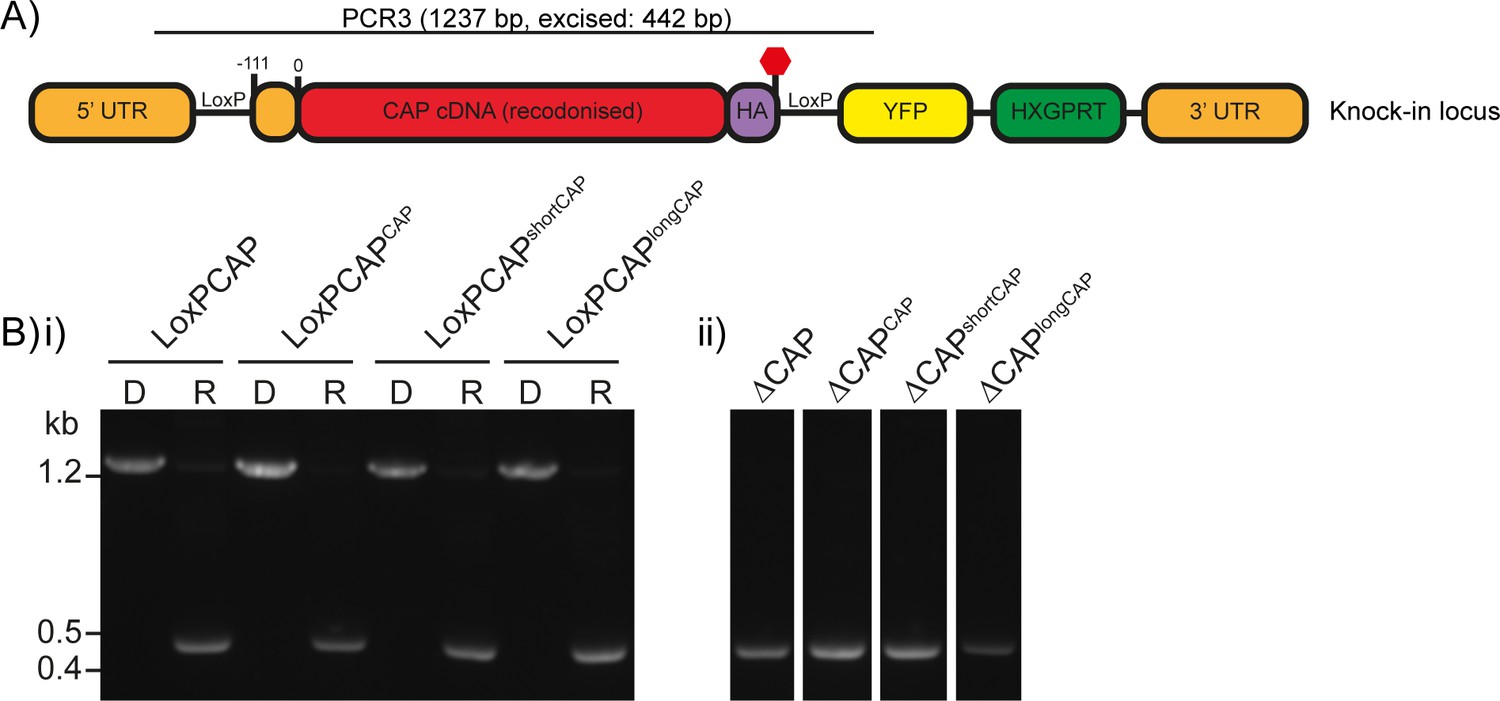
Excision testing of the CAP conditional knockout lines.
(A) Schematic of the CAP locus in the LoxPCAP conditional knockout lines. Rapamycin induced excision of CAP is detected by PCR3. (B) Diagnostic PCR of the CAP locus in the (i) LoxPCAP lines 5 d after treatment with either DMSO (D) or rapamycin (R). (ii) Excised clones were subsequently obtained from these rapamycin treated populations.
Figure 3—figure supplement 2
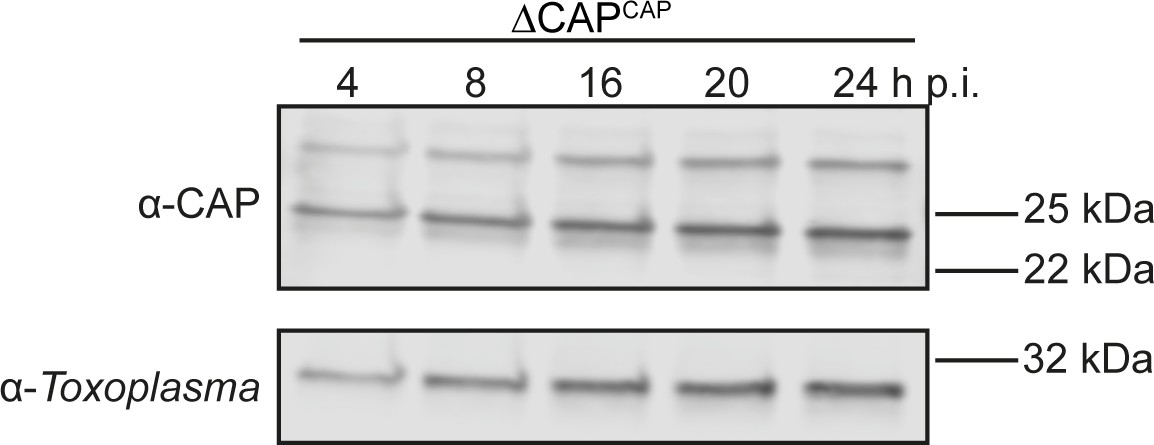
CAP-HA expression in the ∆CAPCAP line.
Western blot on CAP expression levels in the ∆CAPCAP strain over the first 24 hr following host cell invasion using anti-T. gondii CAP antibodies. Anti-Toxoplasma antibodies were used as a loading control.
Figure 4 with 2 supplements
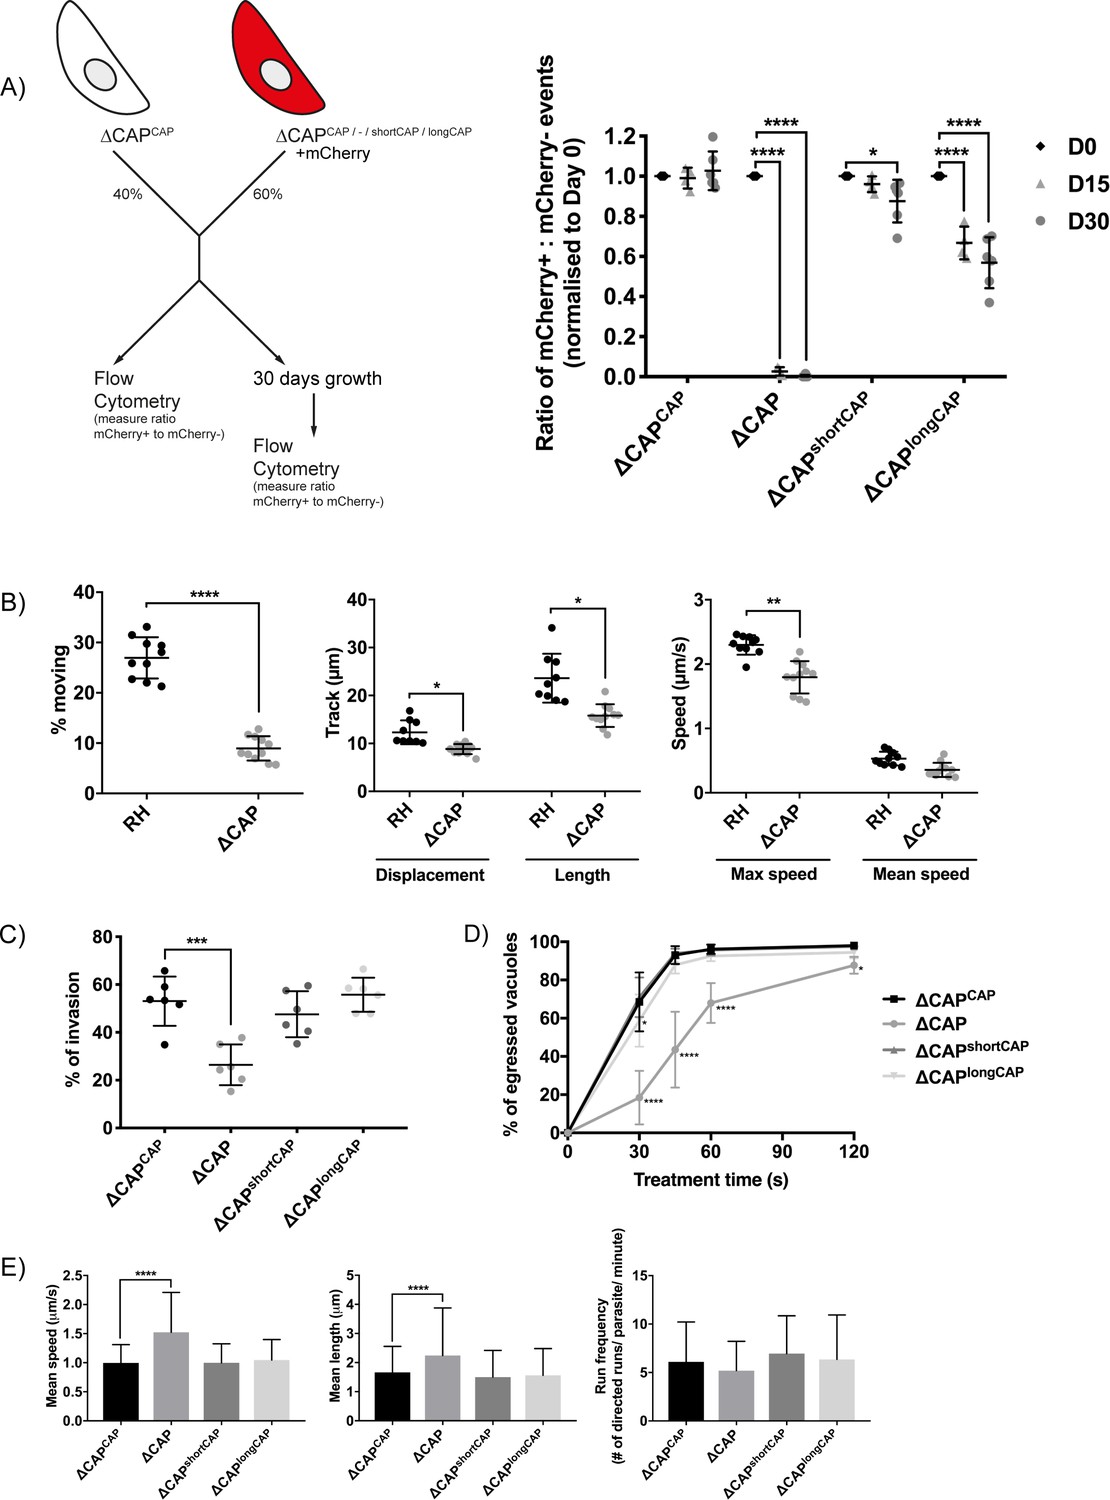
CAP plays an important but not essential role during the lytic cycle in cell culture.
(A) Overview of the flow cytometry competition assay (left). Competition assays of mCherry-expressing ∆CAP and CAP complementation lines with non-fluorescent WT-complemented parasites (right). The ratio of mCherry(+) to mCherry(-) parasites was analysed by flow cytometry at day 0, 15 and 30. Data are represented as mean ± s.d. (D0 and D30, n = 6. D15, n = 4). Two-way ANOVA followed by a multiple comparison Sidak’s test was used to compare means between time points. (B) 3D Matrigel-based motility assays performed in the absence of inducers of motility. Results are expressed as mean ± s.d. (n = 4). Each data point corresponds to a single technical replicate from one of four independent biological replicates, on which significance was assessed using an unpaired t-test. (C) Invasion assay comparing ΔCAP to the complemented lines. Data are represented as mean ± s.d. (n = 3). One-way ANOVA followed by Dunnett’s test was used to compare means to the ΔCAPCAP mean (D) Egress assay. Graph shows number of egressed vacuoles in response to BIPPO over time. Data are represented as mean ± s.d. (n = 3). Two-way ANOVA followed by Dunnett’s test was used to compare means to the ΔCAPCAP mean. Stated significance is in comparison to ∆CAPCAP. (E) Dense granule trafficking assay. ∆CAP and CAP complemented lines were transiently transfected with SAG1∆GPI-mCherry that allows visualisation of dense granules. The length and speed of directed runs were recorded using fluorescence microscopy and analysed using ImageJ. Data are represented as mean ± s.d. (n = 3). One-way ANOVA followed by Dunnett’s test was used to compare means to the ΔCAPCAP mean.
-
Figure 4—source data 1
Numerical data of the graphs presented in Figure 4A,B,C,D,E and Figure 4—figure supplements 1 and 2.
- https://doi.org/10.7554/eLife.50598.012
Figure 4—figure supplement 1
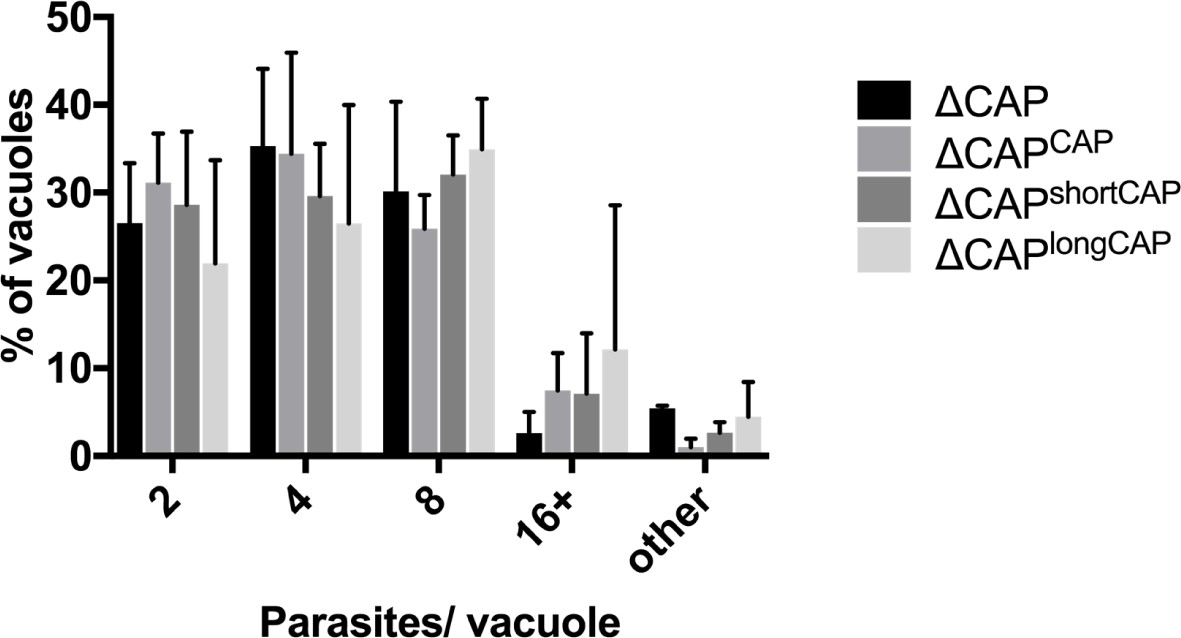
Replication analysis of ∆CAP and the complemented lines.
Data are represented as mean ± s.d. (n = 2). One-way ANOVA followed by Dunnett’s test was used to compare means to the ΔCAPCAP mean. ‘Other’ refers to vacuoles with a non-power of 2 number of parasites.
Figure 4—figure supplement 2
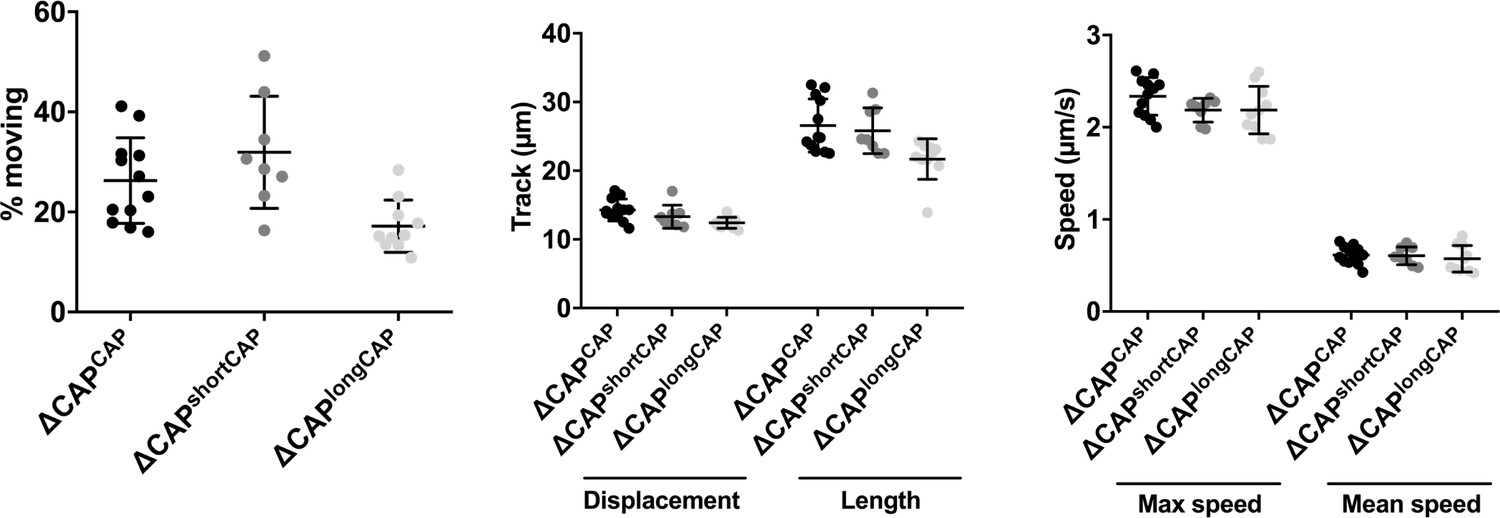
3D Matrigel-based motility assays performed in the absence of inducers of motility.
Results are expressed as mean ± s.d. (n = 4). Each data point corresponds to a single technical replicate from one of four independent biological replicates, on which significance was assessed using an unpaired t-test.
Figure 5 with 1 supplement
CAP is important for rosetting and rapid cell-cell communication.
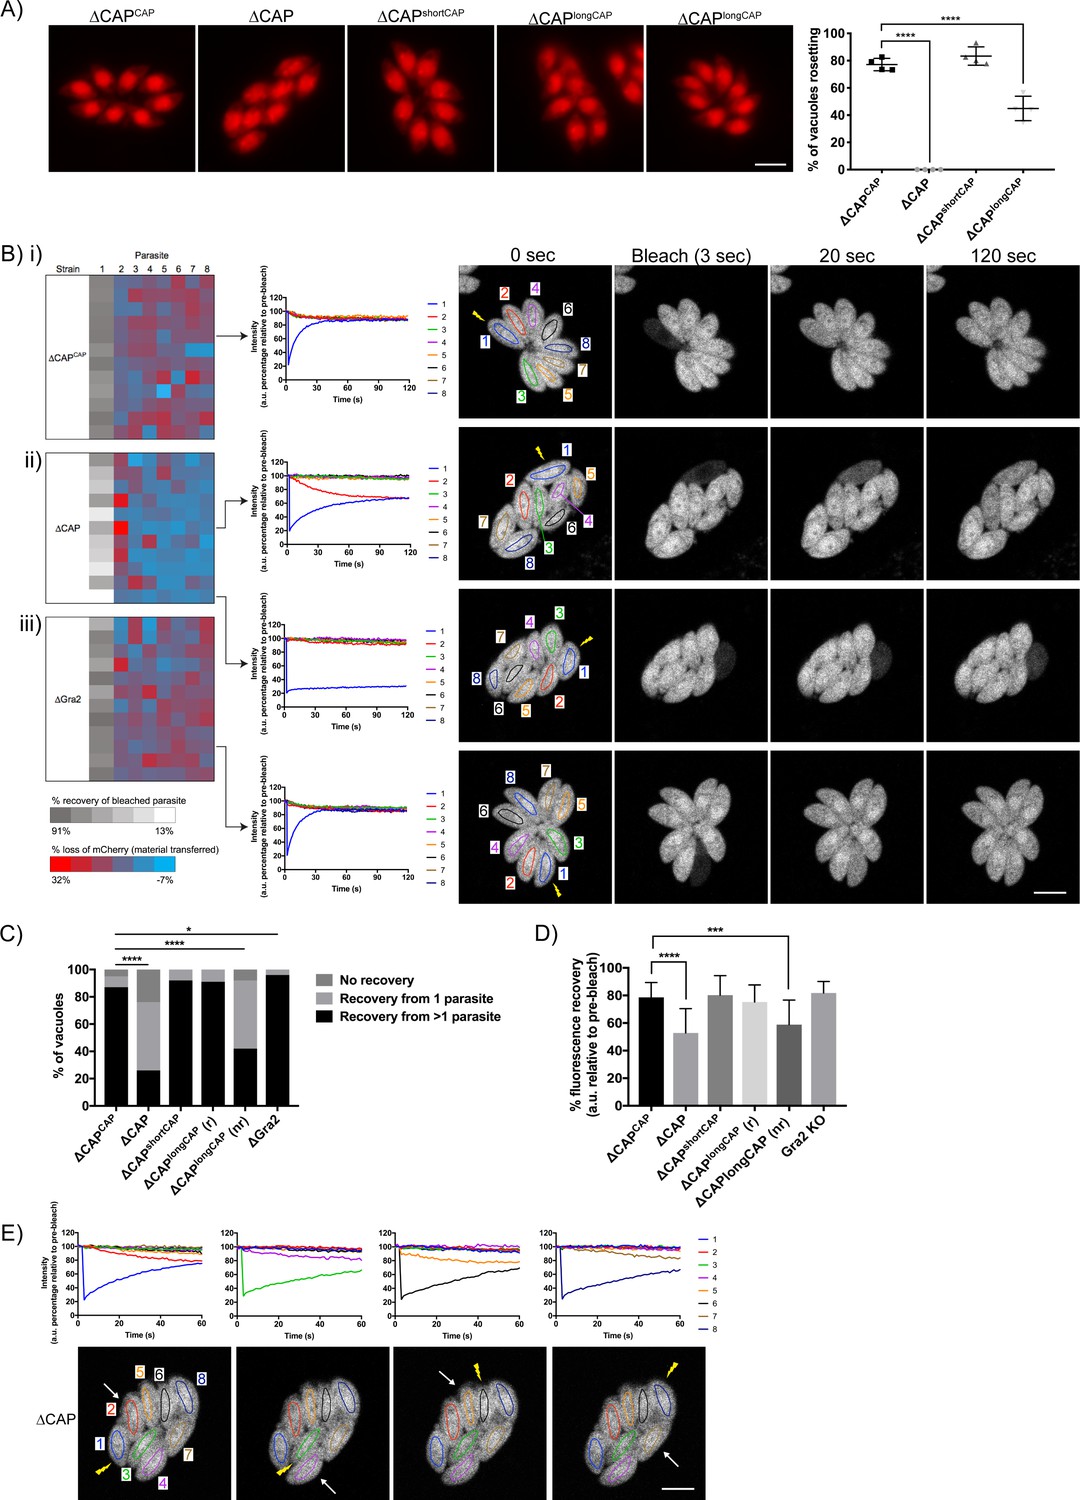
(A) Representative fluorescence images of mCherry expressing ∆CAP parasites and complemented isoforms (left). Quantification of rosetting vs. non-rosetting parasites (right). Data are represented as mean ± s.d. (n = 2). One-way ANOVA followed by Dunnett’s test was used to compare means to the ΔCAPCAP mean. (B–E) FRAP experiments to measure transfer of mCherry between individual parasites in a vacuole. (B) Heatmaps showing the percentage change in fluorescence of individual parasites in (i) CAP complemented, (ii) ∆CAP and (iii) ∆gra2 parasite lines. A recovery plot and image for representative vacuoles are included. Regions of interest are numbered; the bleached parasite is ‘1’. Numbers are allocated based on proximity to the bleached parasite. The yellow lightning bolt indicates which parasite was photobleached. Data are representative of two independent experiments. (C, D) Quantification of the type (C) and amount (D) of recovery for all parasite lines. (∆CAP and ΔCAPCAPn = 4, all other lines, n = 2). For (D) data are represented as mean ± s.d. Statistical significance was assessed by either Chi-square test (C) or one-way ANOVA followed by Dunnett’s test to compare means to the ΔCAPCAP mean (D). (E) FRAP analysis of ∆CAP parasites. The images and graphs represent sequential photobleaching and recovery measurements of individual parasites within the vacuole. The yellow lightning bolt indicates which parasite was photobleached. The white arrow identifies the parasite from which the majority of recovery was observed. All scale bars, 5 µm.
-
Figure 5—source data 1
Numerical data of the graphs presented in Figure 5A,C and D.
- https://doi.org/10.7554/eLife.50598.019
Figure 5—figure supplement 1
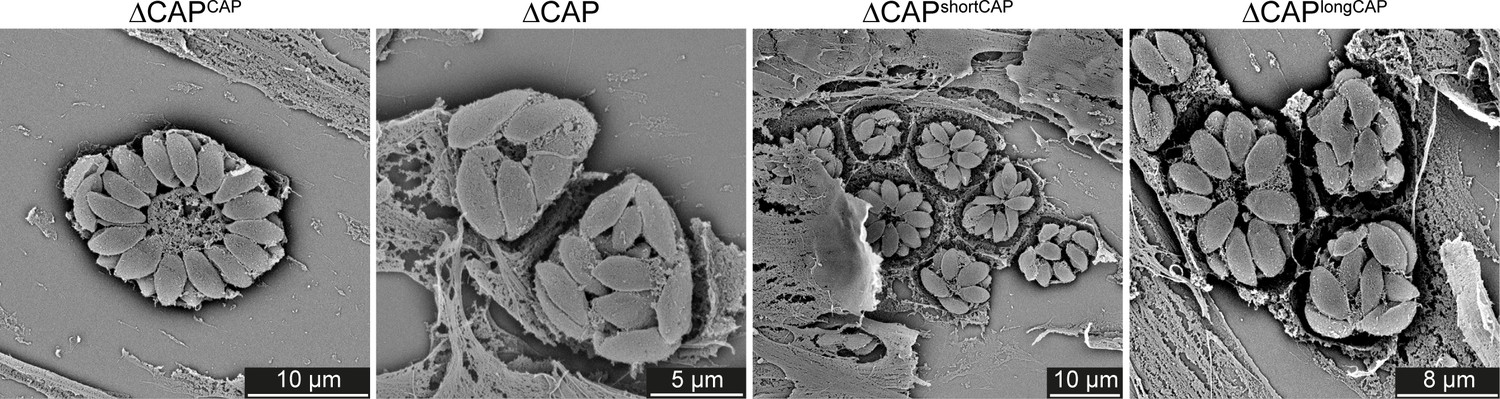
Scanning electron micrographs of intracellular ∆CAP and complemented lines.
Vacuole organisation is disrupted in ∆CAP and ∆CAPlongCAP parasite strains.
Figure 6 with 1 supplement

CAP is important for daughter cell orientation, but not synchronous division.
(A) Parasites stained with anti-IMC three antibodies to visualise daughter cell orientation and division. Scale bar, 5 µm. (B) Quantification of synchronicity of division in parasite vacuoles using daughter cell staining from (A). Data are represented as mean ± s.d. (n = 3). Significance was assessed using an unpaired two-tailed t-test. (C) Quantification of daughter cell orientation in parasite vacuoles reveals a defect in the daughter cell orientation of ∆CAP parasites. Data are represented as mean ± s.d. (n = 3). One-way ANOVA followed by Dunnett’s test was used to compare means to the ΔCAPCAP mean.
-
Figure 6—source data 1
Numerical data of the graphs presented in Figure 6B,C and Figure 6—figure supplement 1.
- https://doi.org/10.7554/eLife.50598.025
Figure 6—figure supplement 1
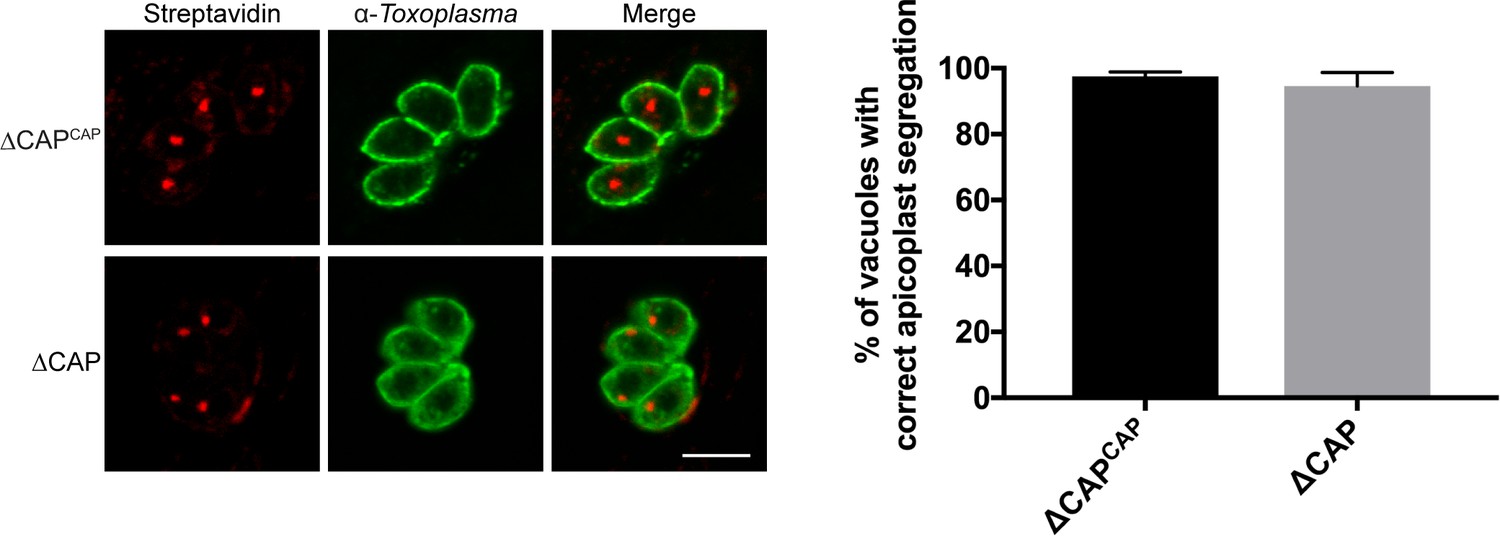
Apicoplast segregation analysis.
Apicoplast segregation was not affected in the ∆CAP line. Representative IFA images (left) and quantification of apicoplast segregation (right). Data are represented as mean ± s.d. (n = 3). Significance was assessed using an unpaired two-tailed t-test. Scale bar, 5 µm.
Figure 7 with 1 supplement
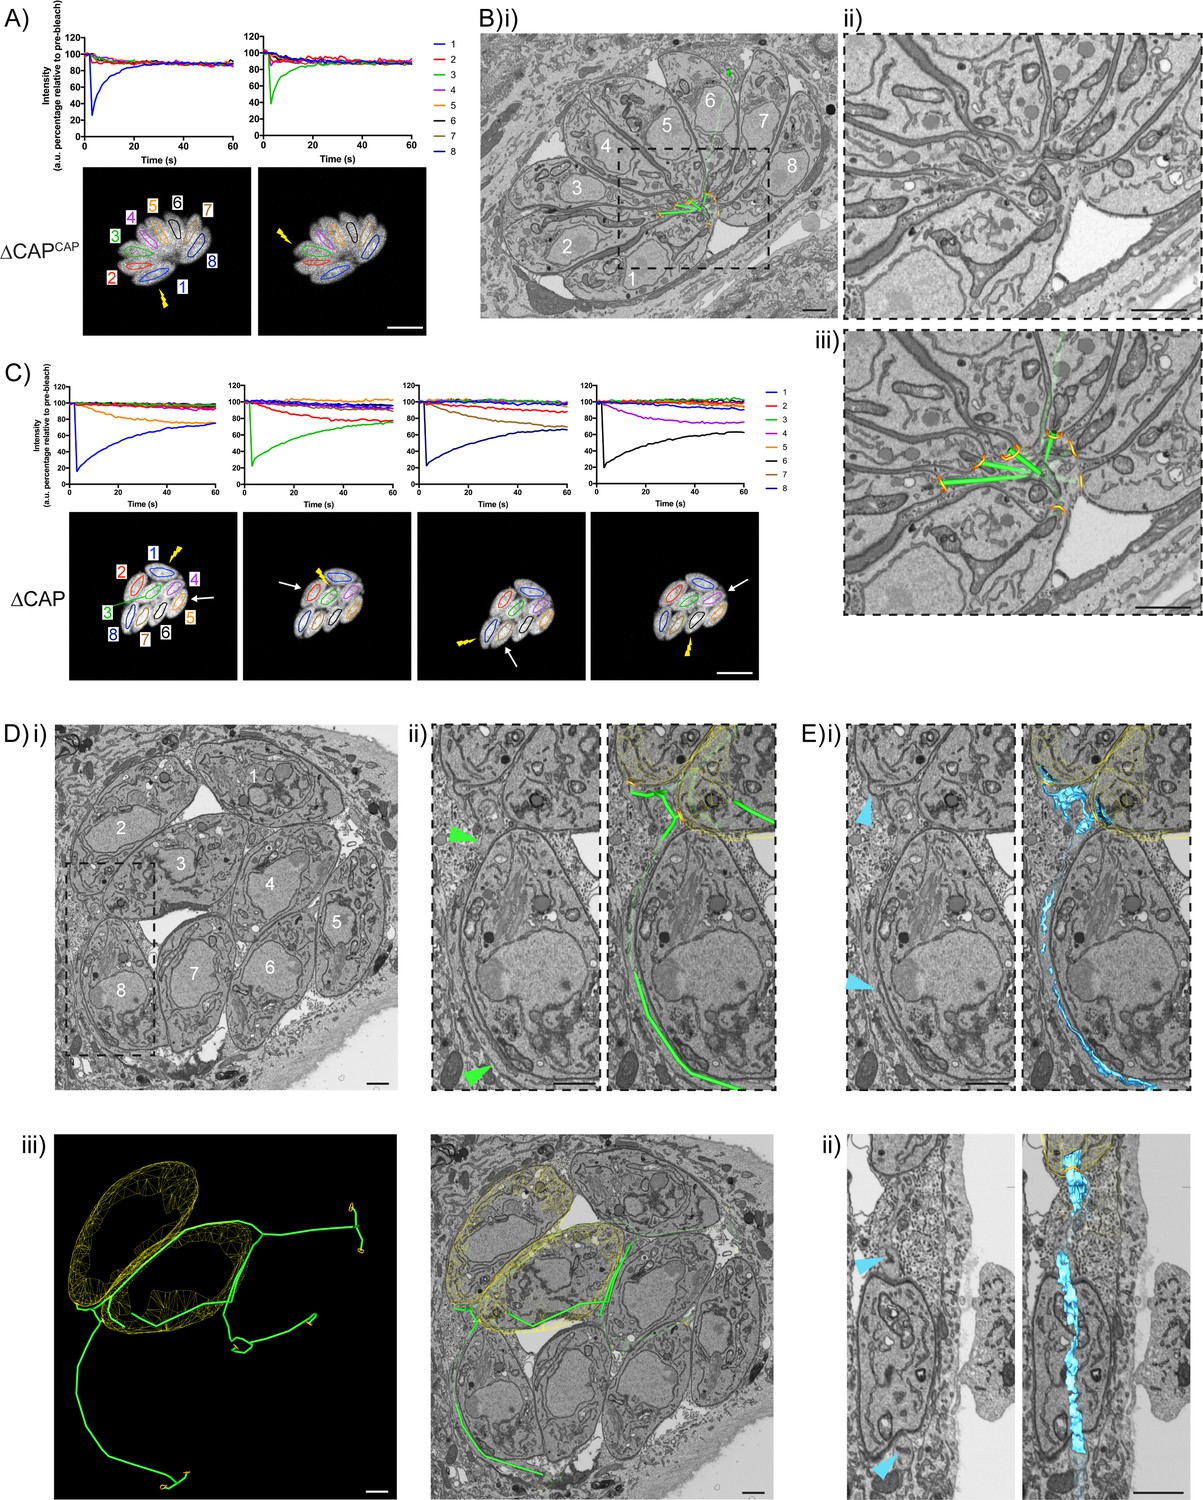
CAP KO parasites are still connected by a decentralised residual body.
(A) FRAP analysis of ∆CAPCAP parasites. The images and graphs represent sequential photobleaching and recovery measurements of individual parasites within the vacuole. (B) (i) FIB SEM of the vacuole from (A) with a 3D model highlighting the residual body (green skeleton representing how the approximate centre can be traced through to the basal poles) and parasite openings at the basal pole (orange ring). Note that the illustrated connections display the distance between the parasite’s posterior ends, and do not represent tubular connections between them. Numbering of parasites is consistent with (A). (ii) Zoomed image of the residual body from (i), (iii) zoomed image of the residual body from (i) overlaid with the 3D model. (C) FRAP analysis of ∆CAP parasites. The images and graphs represent sequential photobleaching and recovery measurements of individual parasites within the vacuole. (D) (i) FIB SEM of the vacuole from (C), numbering of parasites is consistent with (C). (ii) Zoomed image of the boxed region from (i). Green arrows indicate the residual body (left panel). A 3D model highlights the residual body (green skeleton drawn through the lumen of the connections between parasites), parasite openings at the basal pole (orange ring) (right panel). (iii) A 3D model of selected features in the vacuole from (C), highlighting the residual body (green), parasite openings at the basal pole (orange ring) and coarse segmentation of two of the parasites (yellow) (left panel). This model is shown with an orthoslice from the FIB SEM volume (right panel). (E) Zoomed images of the boxed region from (Di). Blue arrows indicate a putative ER structure (left). A 3D model highlights this putative ER (blue) and parasite openings at the basal pole (orange ring) (right). (i) View facing a Z orthoslice. (ii) View facing an X orthoslice. The yellow lightning bolt indicates which parasite was photobleached and the white arrow identifies the parasite from which recovery was observed (A,C). Scale bar, 5 µm (A, C) or 1 µm (B, D, E).
Figure 7—figure supplement 1
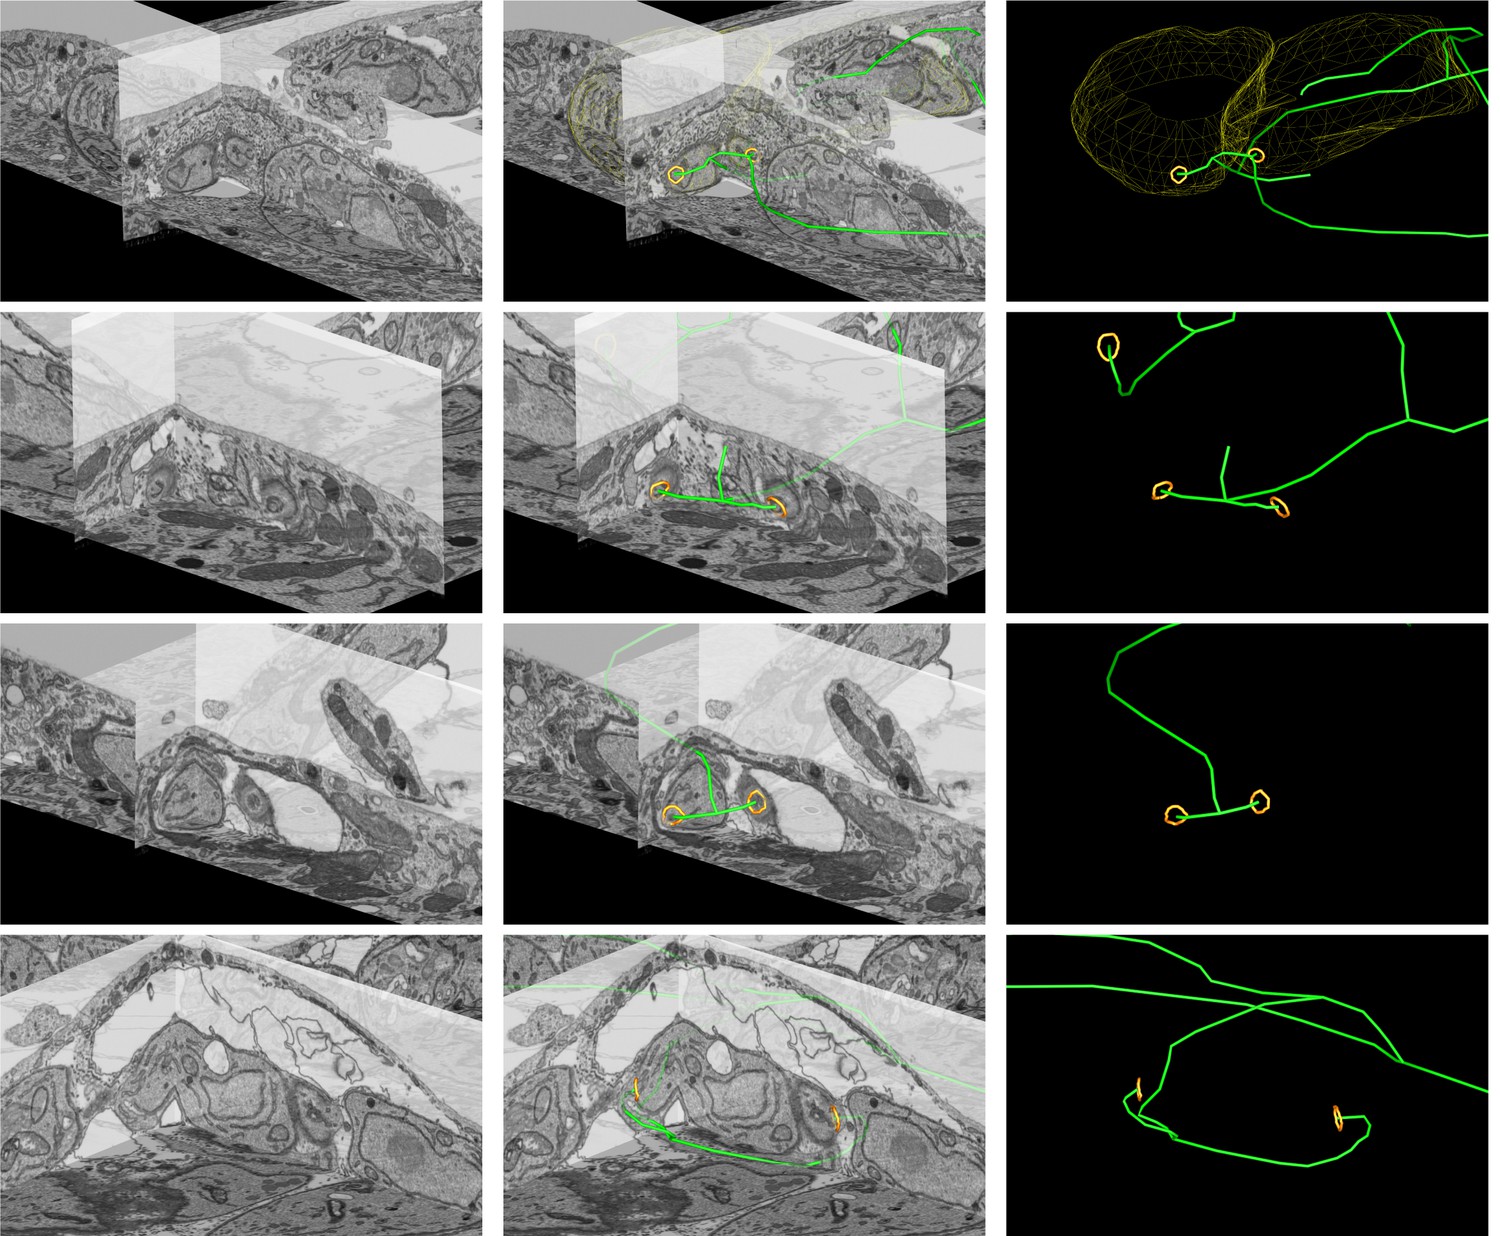
Close up FIB SEM images of parasite connections in the ∆CAP vacuole from Figure 7C–E.
The 3D model highlights the residual body (green skeleton representing how the approximate centre can be traced through to the basal poles), parasite openings at the basal pole (orange ring) and coarse segmentation of two of the parasites (yellow). Scale bars are not shown since these are oblique views – see Figure 7 and Methods for scale information.
Figure 8
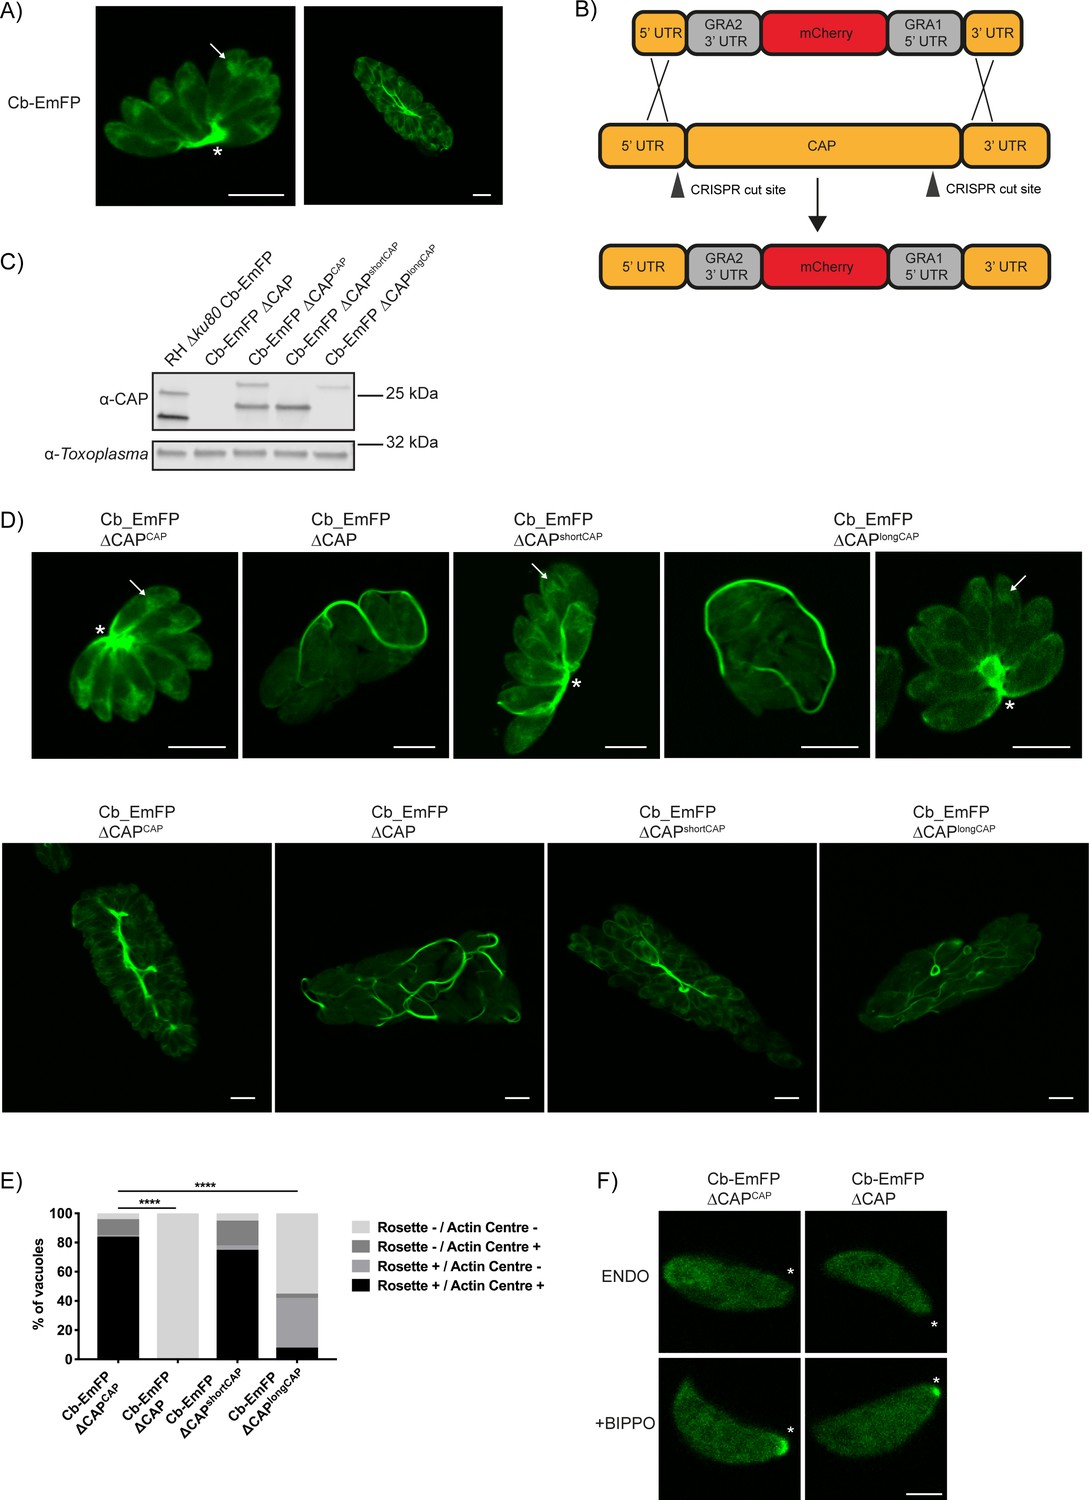
CAP deletion impacts some but not all F-actin structures in Toxoplasma.
(A) Live microscopy of the RH ∆ku80 Cb-Emerald parental parasite strain. Arrows indicate an actin polymerisation centre. Asterisks indicate strong Cb-Emerald signal at the residual body. Scale bar, 5 µm. (B) Schematic of the CAP knockout strategy in the Cb-Emerald expressing strain. Arrowheads indicate CRISPR/CAS9 cut sites. (C) Western blot of CAP expression levels using anti-T. gondii CAP antibodies. Inclusion of a HA-tag makes the protein run more slowly than the untagged protein. Anti-Toxoplasma antibodies were used as a loading control. (D) Live microscopy of Cb-Emerald parasites with CAP modifications. Upper panels show vacuoles containing eight parasites. For longCAP expressing parasites a rosetting and one non-rosetting vacuole is shown. Lower panels show vacuoles with >32 parasite. Arrows indicate an actin polymerisation centre. Asterisks indicate strong Cb-Emerald signal at the residual body. Arrowheads highlight the extensive actin structures in the vacuole. Scale bar, 5 µm. (E) Quantification of vacuole rosetting and apical juxtanuclear actin polymerisation centre frequency. Statistical significance was assessed by Chi-square test (n = 2). (F) Cb-Emerald accumulation at the basal end of BIPPO-stimulated parasites can still be observed in ∆CAP parasites. Asterisks indicate the basal end of the cell. Note: each panel is a different parasite. Scale bar, 2 µm.
-
Figure 8—source data 1
Numerical data of the graph presented in Figure 8E.
- https://doi.org/10.7554/eLife.50598.031
Figure 9
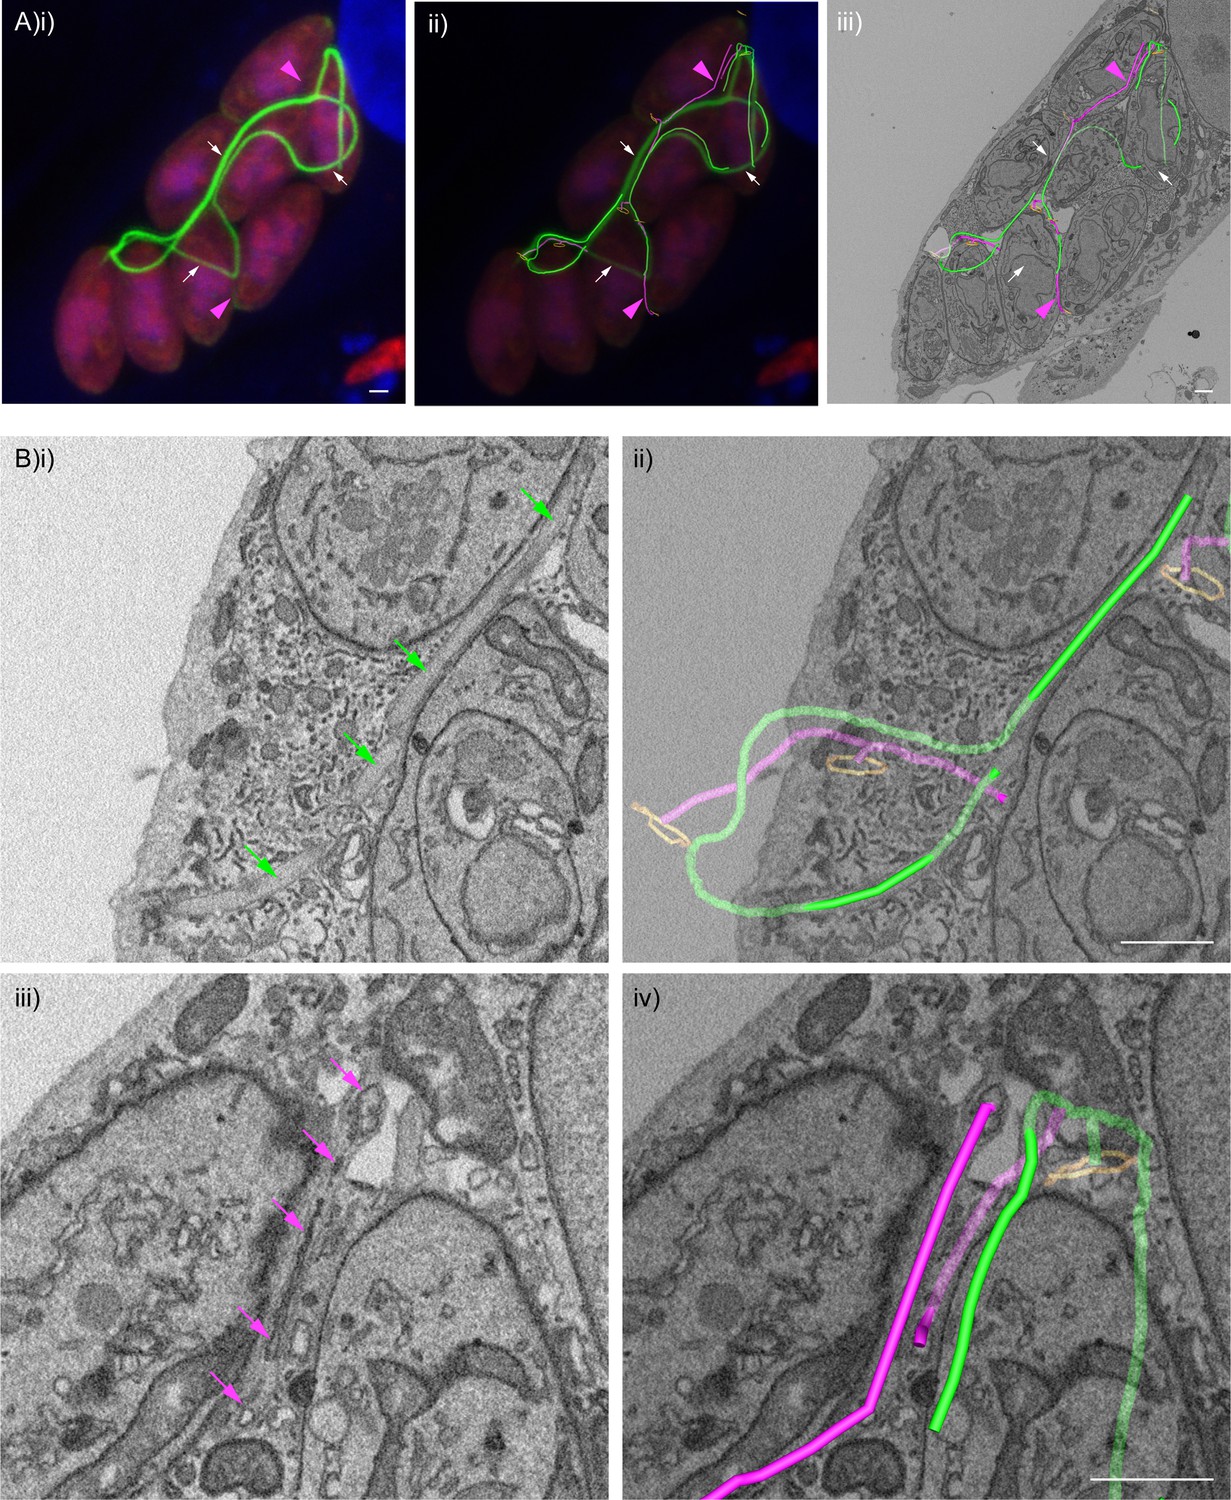
F-actin structures localise within the tubular connections of the decentralised residual body.
Correlative confocal fluorescence and SBF SEM analysis of Cb-Emerald ∆CAP parasites. (A) (i) ClearVolume orthogonal XY render of confocal fluorescence microscopy. (iii) SBF SEM XY orthoslice of the vacuole from (i), with segmented skeleton 3D models highlighting the residual body (tubes of green and magenta). The parasite basal pores are highlighted by orange rings. (ii) Coarse overlay of (i) and (iii). (A) White arrows; regions of the Cb-Emerald fluorescence not captured in the SBF SEM acquisition. Green 3D model tubes; regions of the residual body with strong Cb-Emerald fluorescence in the corresponding 3D regions of the LM dataset and no internal membranous structures. Magenta arrowheads; regions of the residual body model with corresponding low or undetectable Cb-Emerald fluorescence. Magenta 3D model tubes; regions of the residual body model with corresponding low or undetectable Cb-Emerald fluorescence and internal membranous structures. (B) Magnified regions of XY slices 68 (i and ii) and 58 (iii and iv) from the SBF SEM dataset in (Aiii). Morphological differences are indicated by arrows. Green arrows; lumen of strongly Cb-Emerald fluorescent tubular regions lacking membranous structures. Magenta arrows; membranous structures in the lumen of tubules with low or undetectable Cb-Emerald fluorescence. All scale bars, 1 µm.
Figure 10
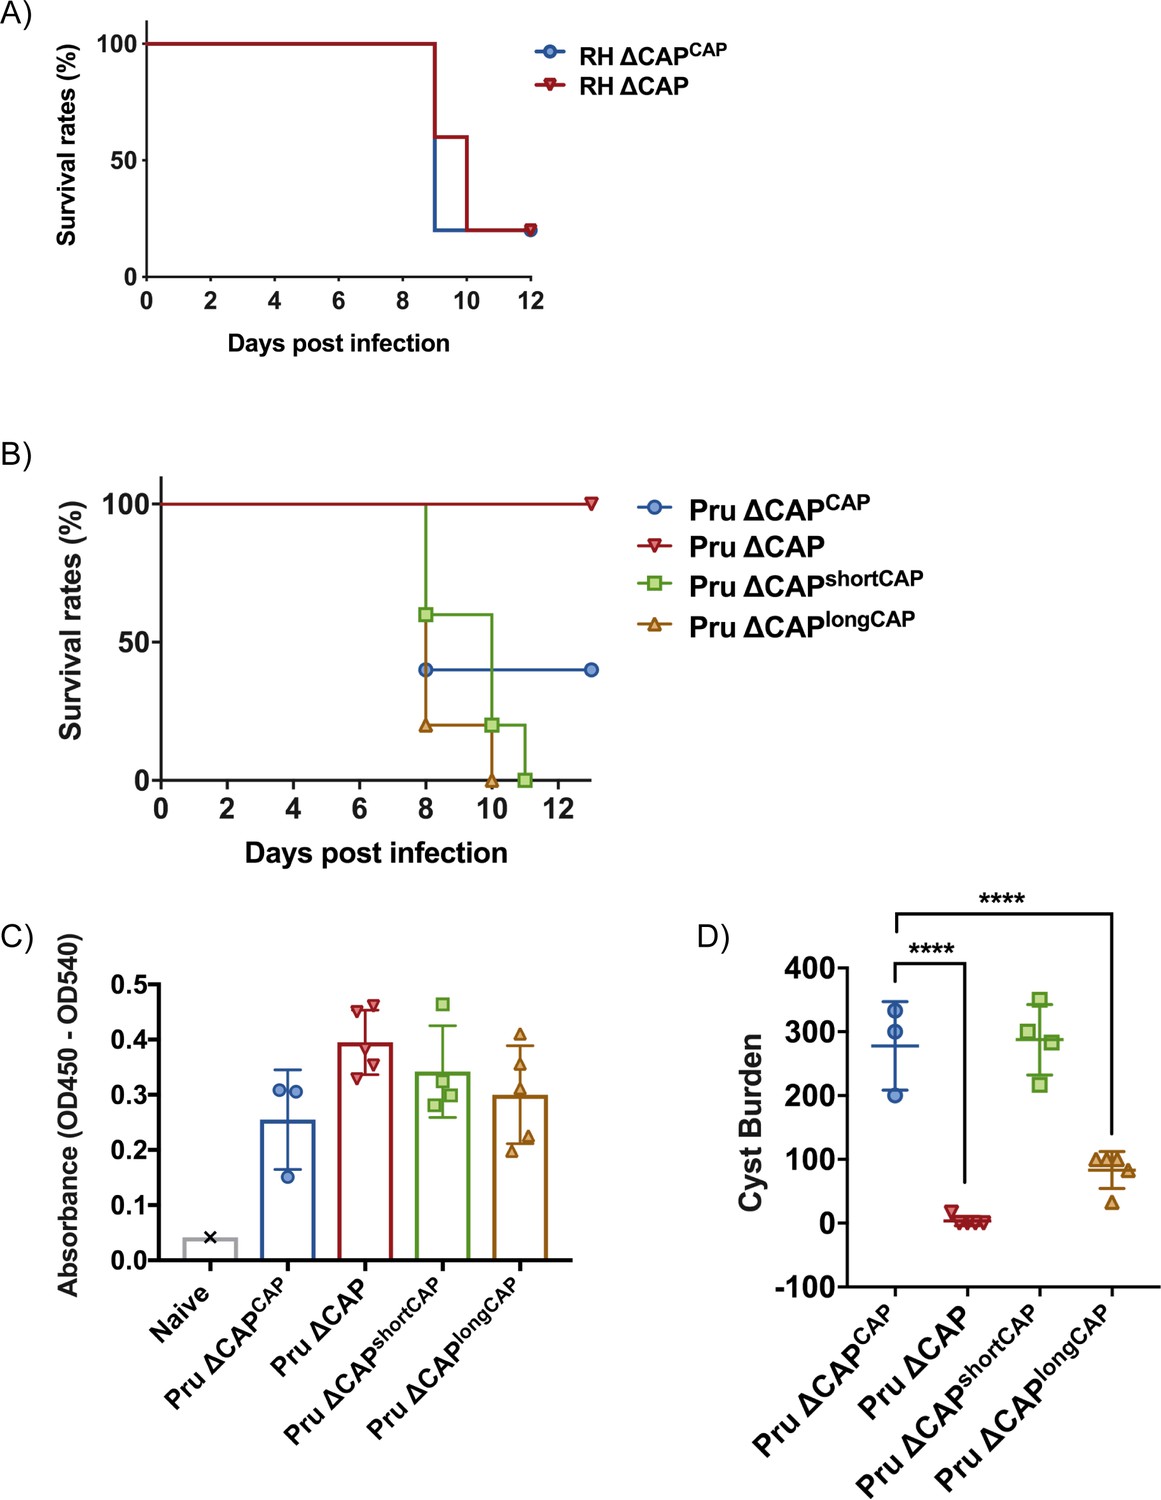
CAP is essential for virulence in type II but not type I parasites.
(A) Survival rates of C57BL/6 mice infected with ~25 RH ∆CAPCAP or RH ∆CAP parasites. (B) Survival rates of C57BL/6 mice infected with 50,000 Pru ∆CAP parasites or with complementing CAP variants. (C) ELISA testing sera reactivity of naïve or Toxoplasma infected mice using Toxoplasma antigen. (D) Cyst burden in the brain of C57BL/6 mice 32 days post-infection with 5,000 Pru ∆CAP parasites or with complementing CAP variants. For all experiments, five animals were infected for each strain.
-
Figure 10—source data 1
Numerical data of the graphs presented in Figure 10A,B,C and D.
- https://doi.org/10.7554/eLife.50598.035
Videos
Video 1
Live egress imaging of a ∆CAPCAP vacuole.
Egress was induced by addition of 50 µM BIPPO at 0 s. Image taken every 1.8 s. The video is played at 6.6 fps and the time is indicated in seconds. Scale bar, 10 µm.
Video 2
Live egress imaging of a ∆CAP vacuole.
Egress was induced by addition of 50 µM BIPPO at 0 s. Image taken every 1.8 s. The video is played at 6.6 fps and the time is indicated in seconds. Scale bar, 10 µm.
Video 3
Live egress imaging of a ∆CAPshortCAP vacuole.
Egress was induced by addition of 50 µM BIPPO at 0 s. Image taken every 1.8 s. The video is played at 6.6 fps and the time is indicated in seconds. Scale bar, 10 µm.
Video 4
Live egress imaging of a ∆CAPlongCAP vacuole.
Egress was induced by addition of 50 µM BIPPO at 0 s. Image taken every 1.8 s. The video is played at 6.6 fps and the time is indicated in seconds. Scale bar, 10 µm.
Video 5
FRAP on a ∆CAPCAP vacuole.
A single parasite was photobleached at 3 s. Images taken every 1 s. The video is played at two fps and the time is indicated in seconds. Scale bar, 5 µm.
Video 6
FRAP on a ∆CAP vacuole.
A single parasite was photobleached at 3 s. Images taken every 1 s. The video is played at two fps and the time is indicated in seconds. Scale bar, 5 µm.
Video 7
FRAP on a ∆Gra2 vacuole.
A single parasite was photobleached at 3 s. Images taken every 1 s. The video is played at two fps and the time is indicated in seconds. Scale bar, 5 µm.
Video 8
FIB SEM of the ∆CAPCAP vacuole from Figure 7A–B with 3D model overlay.
All FIB SEM slices of the ∆CAPCAP vacuole Figure 7A–B. The 3D model highlights the residual body (green skeleton representing how the approximate centre can be traced through to the basal poles, along with a structure that extends from that centre but has no connection) and parasite openings at the basal pole (orange ring). The volume of the FIB SEM dataset shown is indicated in the Materials and methods.
Video 9
FIB SEM of the ∆CAP vacuole from Figure 7C–E with 3D model overlays.
All FIB SEM slices of the ∆CAP vacuole Figure 7C–E. The 3D model highlights the residual body (green skeleton drawn through the approximate central axis of the lumen of the connections between parasites), parasite openings at the basal pole (orange ring), coarse segmentation of the central part of two of the parasites (yellow), and part of the putative ER (blue, note that only a selected region was segmented; from the inner face of two of the basal pores through part of the decentralised residual body). The volume of the FIB SEM dataset shown is indicated in the Materials and methods.
Video 10
SBF SEM of the Cb-EmFP ∆CAP vacuole from Figure 9 with 3D model overlays.
All SBF SEM slices of the Cb-EmFP ∆CAP vacuole from Figure 9. The 3D model highlights residual body tubules containing high chromobody signal and no internal membranous structures (green model) and residual body tubules with low or undetectable chromobody signal and internal membranous structures (magenta model). Parasite openings at the basal pole are also highlighted (orange ring). The volume of the SBF SEM dataset shown is indicated in the Materials and methods.
Additional files
-
Supplementary file 1
Primers listed in the Materials and methods.
- https://doi.org/10.7554/eLife.50598.036
-
Supplementary file 2
Synthetic DNA listed in the Materials and methods.
- https://doi.org/10.7554/eLife.50598.037
-
Supplementary file 3
BioWave program details for FIB SEM.
- https://doi.org/10.7554/eLife.50598.038
-
Supplementary file 4
Key resources table.
- https://doi.org/10.7554/eLife.50598.039
-
Transparent reporting form
- https://doi.org/10.7554/eLife.50598.040
Download links
A two-part list of links to download the article, or parts of the article, in various formats.
Downloads (link to download the article as PDF)
Open citations (links to open the citations from this article in various online reference manager services)
Cite this article (links to download the citations from this article in formats compatible with various reference manager tools)
Differential requirements for cyclase-associated protein (CAP) in actin-dependent processes of Toxoplasma gondii
eLife 8:e50598.
https://doi.org/10.7554/eLife.50598


