Evolutionary loss of foot muscle during development with characteristics of atrophy and no evidence of cell death
- University of California, San Diego, United States
Figures
Figure 1 with 1 supplement

Muscles are rapidly lost in the neonatal jerboa foot.
(A and B) Transverse sections of adult (A) mouse and (B) jerboa foot. (C and D) Mean and standard deviation of the number of myofibers in transverse sections of third digit interosseous muscle at two-day intervals from birth to postnatal day 8. (C) Mouse P0-P8, n = 3 animals each. P0-P4 (p=0.0062), P2-P4 (p=0.0262), P0-P6 (p=0.0002), P2-P6 (p=0.0007), P6-P8 (p=0.0009). (D) Jerboa P0, n = 4 animals; P2, P6, P8, n = 3 animals each; P4, n = 6 animals. P4-P6 (p=0.0376), P4-P8 (p=0.0002). (*p<0.05, **p<0.01, ***p<0.001) (E and F) Representative transverse sections of interosseous muscle of the third digit of (E) mouse and (F) jerboa at each stage. For all: top dorsal; bottom ventral.
Figure 1—figure supplement 1
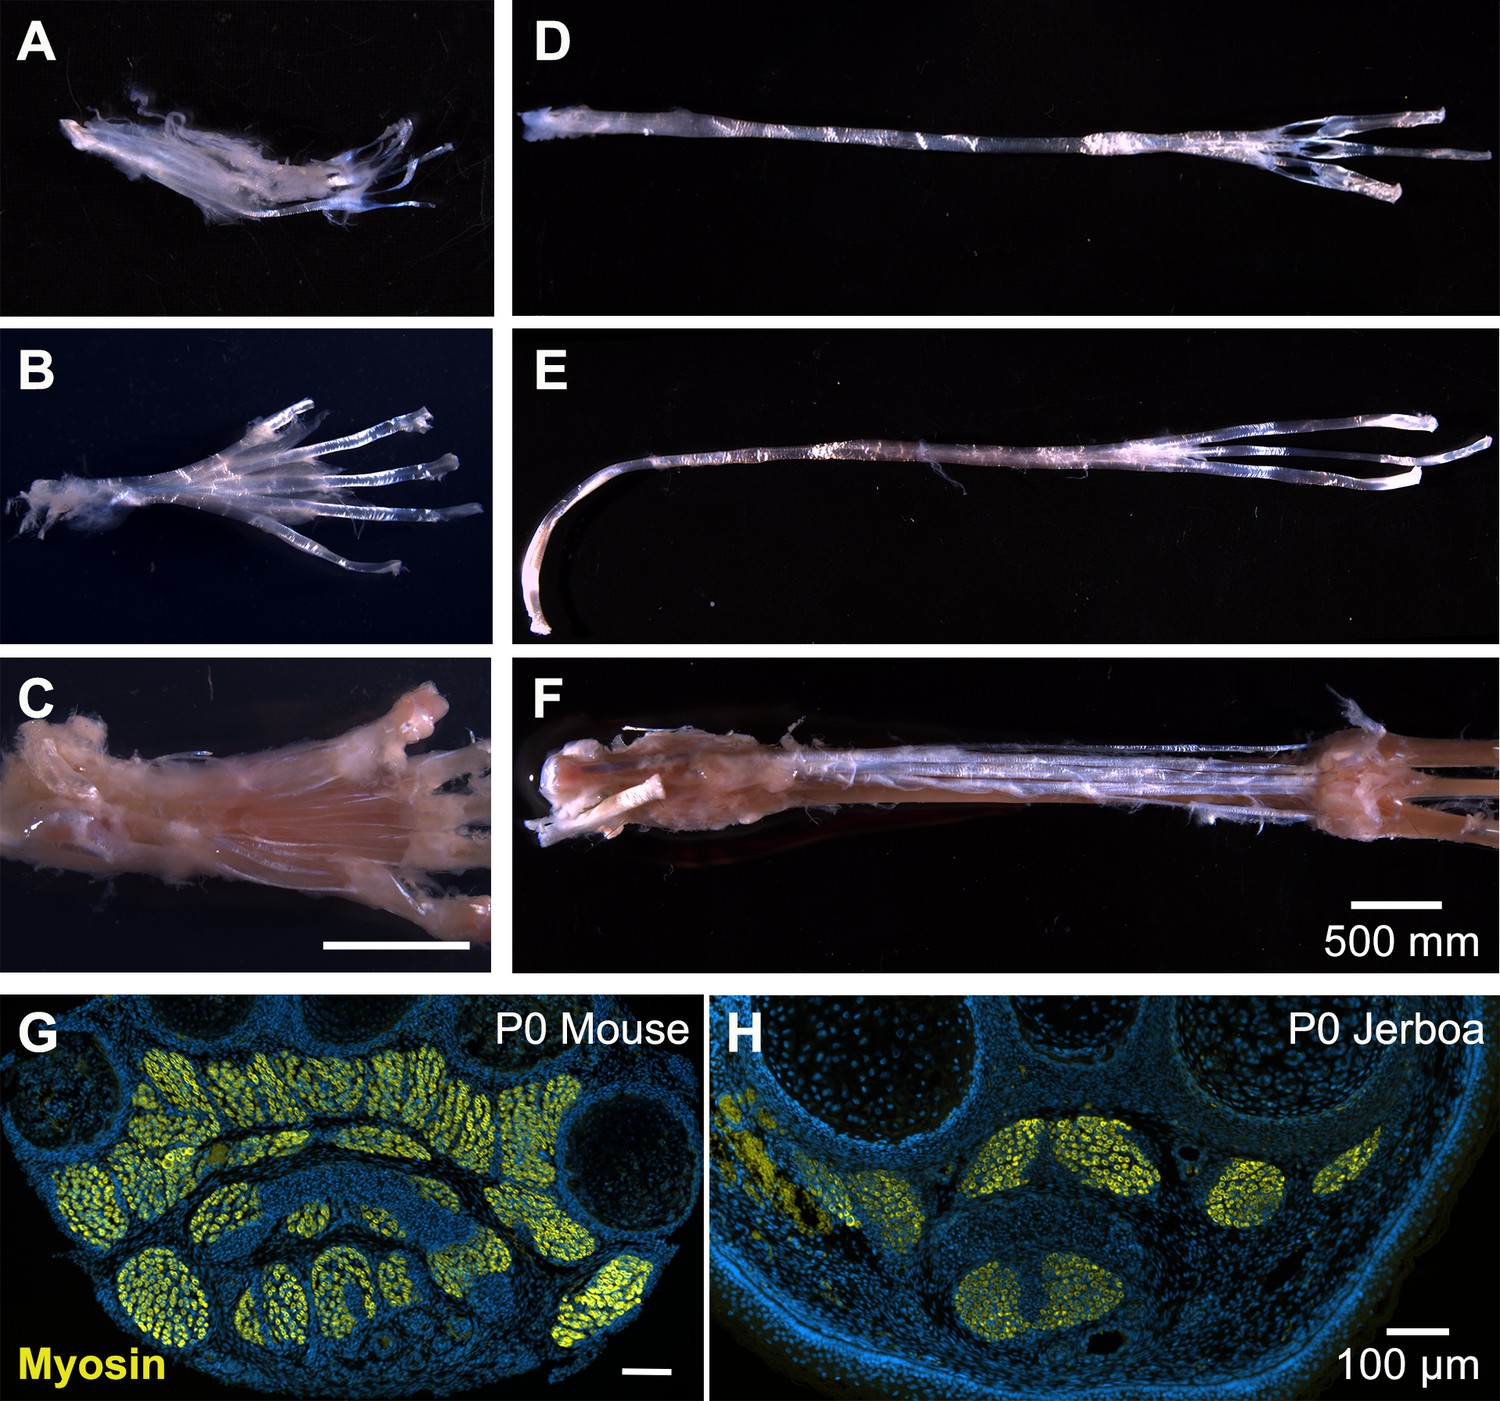
Anatomy of mouse and jerboa foot.
Related to Figures 1 and 2. (A) In the adult mouse, tendon of the flexor digitorum superficialis supports the m. flexor digitorum brevis with distal tendon branches that each divide in two before inserting into either side of the base of the middle phalanx of each digit. (B) Dorsal to this layer, the tendon of the flexor digitorum longus splits upon entering the foot and carries the m. lumbricales. Each flexor digitorum longus tendon emerges distally from between the branches of each flexor digitorum superficialis tendon and inserts into the base of each of the terminal phalanges. (C) The m. interossei have a common tendon that originates in the tarsus, branches into each of the interosseus muscles, and inserts distally into the base of each of the proximal phalanges. (D–F) The adult jerboa retained the tendons of (D) the flexor digitorum superficialis, (E) the flexor digitorum longus, and (F) the interossei, but all are devoid of muscle. (G, H) A representative transverse section illustrates the presence of foot muscle in the newborn (G) mouse and (H) jerboa.
Figure 2 with 2 supplements
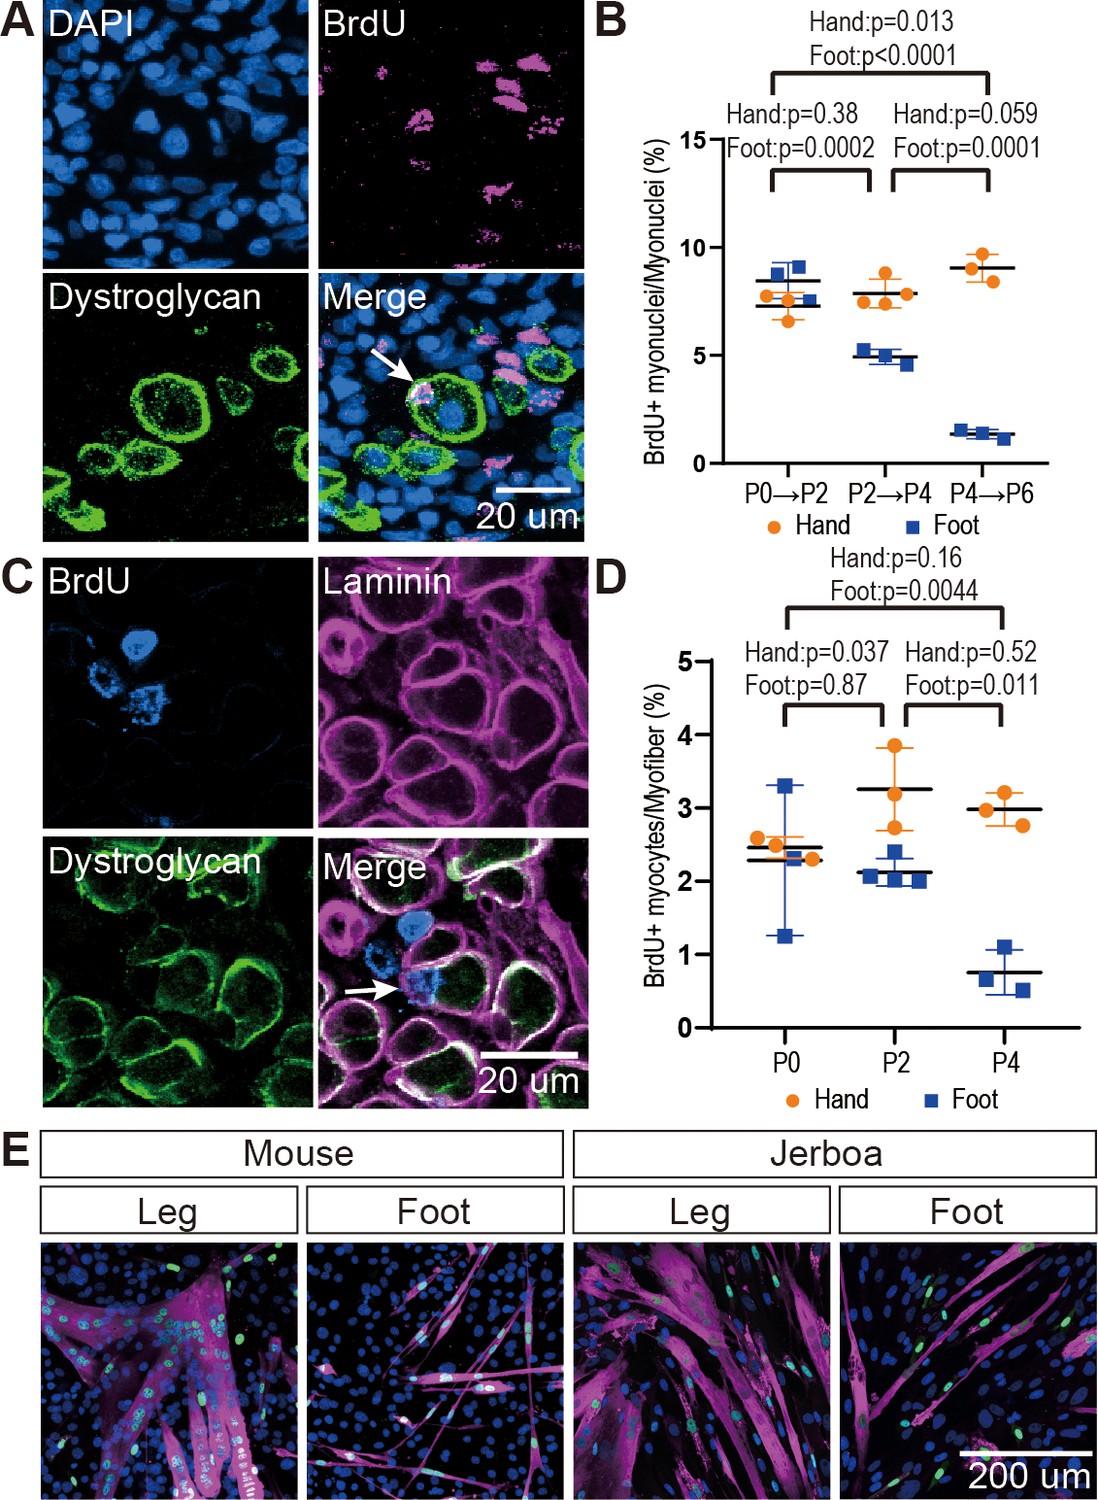
The rate of myocyte fusion is reduced prior to myofiber loss.
(A) Newly fused nuclei within Dystroglycan+ myofiber membranes (arrow) can be distinguished two days after labeling with BrdU. (B) The mean and standard deviation of BrdU+ myonuclei (putative fusion events) normalized to all myofiber nuclei in sections of jerboa hand and foot muscles at intervals from P0 to P6. Foot at P0-P2, P2-P4, P4-P6, Hand at P0-P2, P4-P6, n = 3 animals each. Hands at P2-P4, n = 4 animals. (C) Proliferative muscle progenitor cells that are BrdU+ are found outside Dystroglycan+ membrane and inside the Laminin+ basal lamina (Arrow). (D) The mean and standard deviation of BrdU+ muscle progenitor cells was normalized to the number of myofibers in sections of jerboa hand and foot muscles at P0, P2, and P4. n = 4 animals each. (E) Differentiated myofibers after 6 days of culturing primary muscle progenitor cells isolated from lower leg and foot muscles of mouse and jerboa. Green, Myogenin; Magenta, Myosin.
Figure 2—figure supplement 1

Jerboa foot muscles are postmitotic.
Representative image of (A) longitudinal section of P4 (n = 1 animal, 156 myofibers) and (B) transverse section of P5 jerboa foot interosseous muscle (n = 1 animal, 297 myofibers) illustrating jerboa foot myofibers are postmitotic. BrdU+ nuclei are peripheral to MF20+ myofibers.
Figure 2—figure supplement 2

Persistence of differentiated muscle cells in culture after loss in vivo.
Myoblasts and myocytes were isolated from leg and foot muscles of P1 mouse and jerboa and differentiated in culture for 6 days and 9 days. The number of nuclei within MHC-positive cells found in 10 microscopic fields of replica-plated cultures were averaged and represented in graphs and tables. p-Values were calculated using paired t-test for replicated wells. None of the experimental groups showed a statistically significant difference in the number of nuclei in Myosin-positive cells between Day 6 and Day 9 of culture.
Figure 3 with 3 supplements
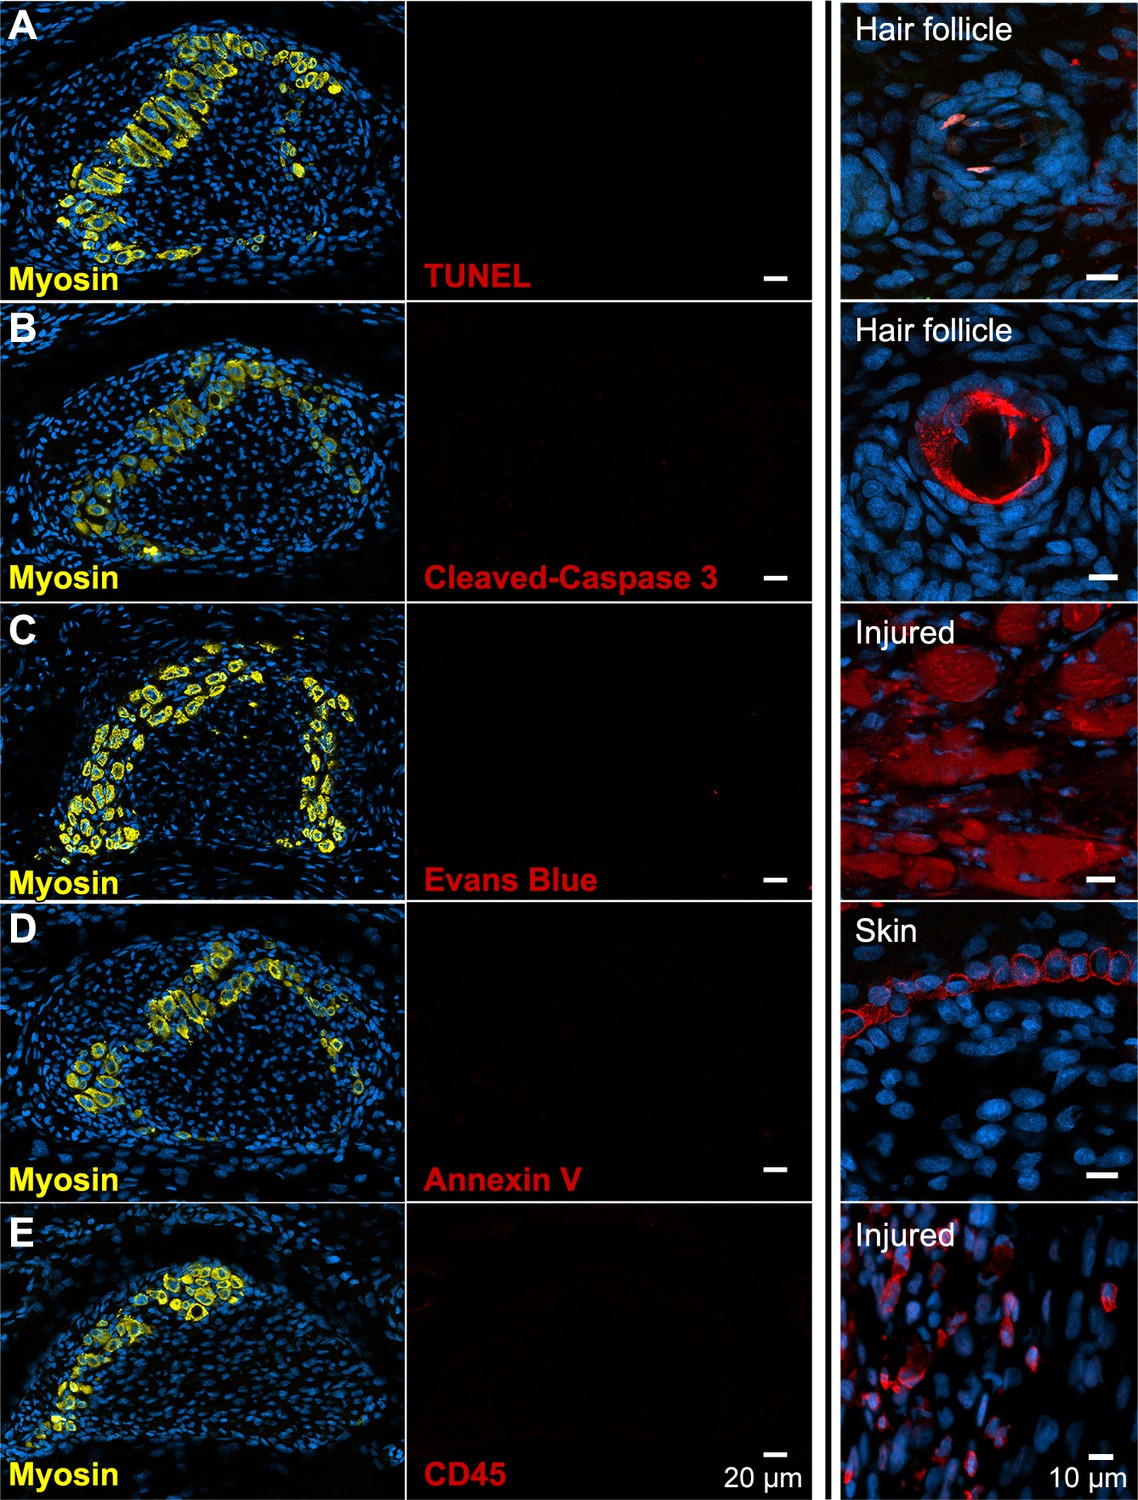
There is no evidence of apoptosis, necrosis, or macrophage infiltration.
(A and B) TUNEL and cleaved Caspase-3 staining for apoptotic nuclei in transverse sections of third digit interosseous muscle in the P6 jerboa foot and of positive control (TUNEL, n = 3 animals; cleaved Caspase-3, n = 2 animals). See also Figure 3—figure supplement 1 for more stages. (C) EBD detection in transverse section of third digit interosseous muscle in the P5 jerboa foot and of positive control (n = 5 animals). See also Figure 3—figure supplement 2 for more stages. (D) Annexin V immunofluorescence in longitudinal section of third digit interosseous muscle in the P6 jerboa foot and of positive control (n = 3 animals). See also Figure 3—figure supplement 2 for more stages. (E) CD45 immunofluorescence in transverse section of third digit interosseous muscle in the P6 jerboa foot and of positive control (n = 3 animals). See also Figure 3—figure supplement 3 for more stages and for an additional macrophage marker, F4/80.
Figure 3—figure supplement 1

No evidence of jerboa foot muscle apoptosis.
TUNEL staining (TUNEL and merge with DAPI and Myosin) for apoptotic nuclei in longitudinal and transverse sections of interosseous muscle in the (A) P0 (n = 1 animal), (B) P3 (n = 3), (C) P7 (n = 1), (E) P2 (n = 2), (F) P4 (n = 5), and (G) P5 jerboa foot (n = 3). (D) Apoptotic keratinocytes as positive control for A-C and (H) apoptotic limb bud cells as positive control for E-G. Cleaved Caspase-3 staining (Cleaved Caspase-3 and merge with DAPI and Myosin) for apoptotic nuclei in longitudinal and transverse sections of interosseous muscle in the (I) P3 (n = 1 animal), (J) P4 (n = 5), (L) P5 jerboa foot (n = 2). (K) Apoptotic kerotinocytes as positive control for I-J and in (M) for L. Scale bars are each 20 µm.
Figure 3—figure supplement 2
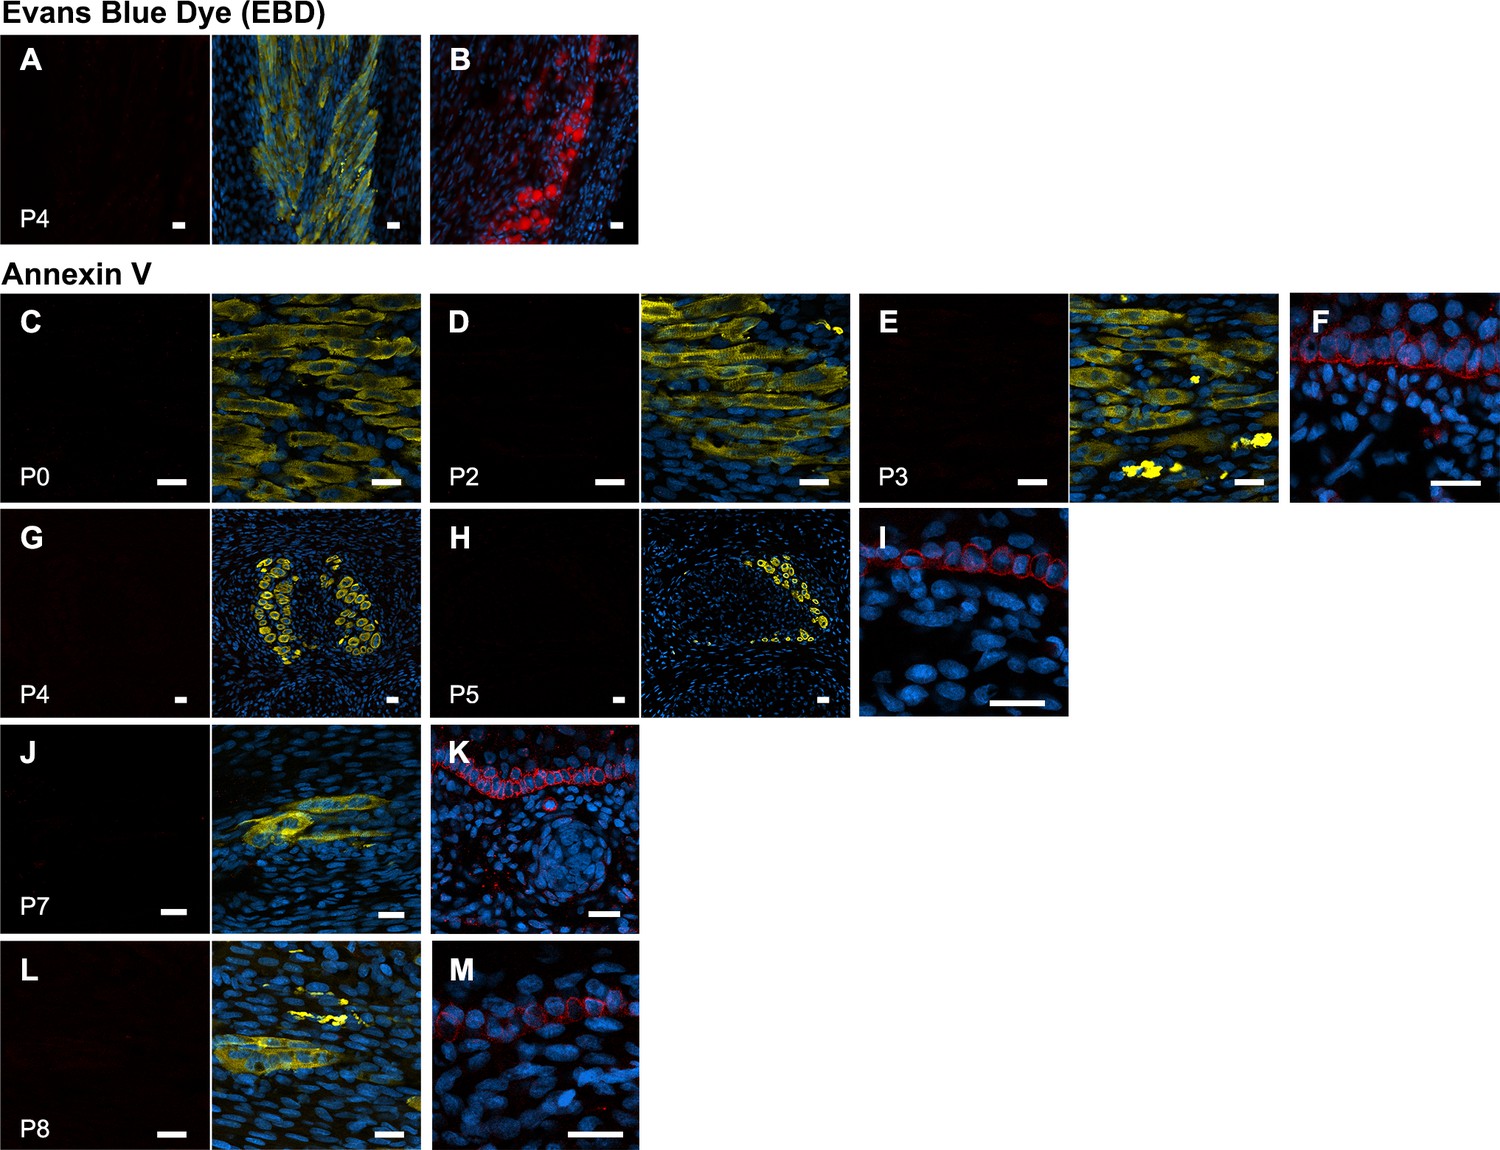
No evidence of jerboa foot muscle necrosis.
(A) EBD detection (EBD and merge with DAPI and Myosin) in longitudinal sections of the third digit interosseous muscle in the P4 jerboa foot (n = 5 animals) and of (B) positive control mechanically injured gastrocnemius muscle. Annexin V immunofluorescence (Annexin V and merge with DAPI annd Myosin) in longitudinal and transverse section of interosseous muscle in the (C) P0 (n = 1), (D) P2 (n = 1), (E) P3 (n = 1), (G) P4 (n = 2), (H) P5 (n = 1), (J) P7 (n = 1), (L) P8 jerboa foot (n = 1). (F) Cornifying skin keratinocytes as positive control for C-D, (I) for G-H, (K) for J, and (M) for L. Scale bars are each 20 µm.
Figure 3—figure supplement 3
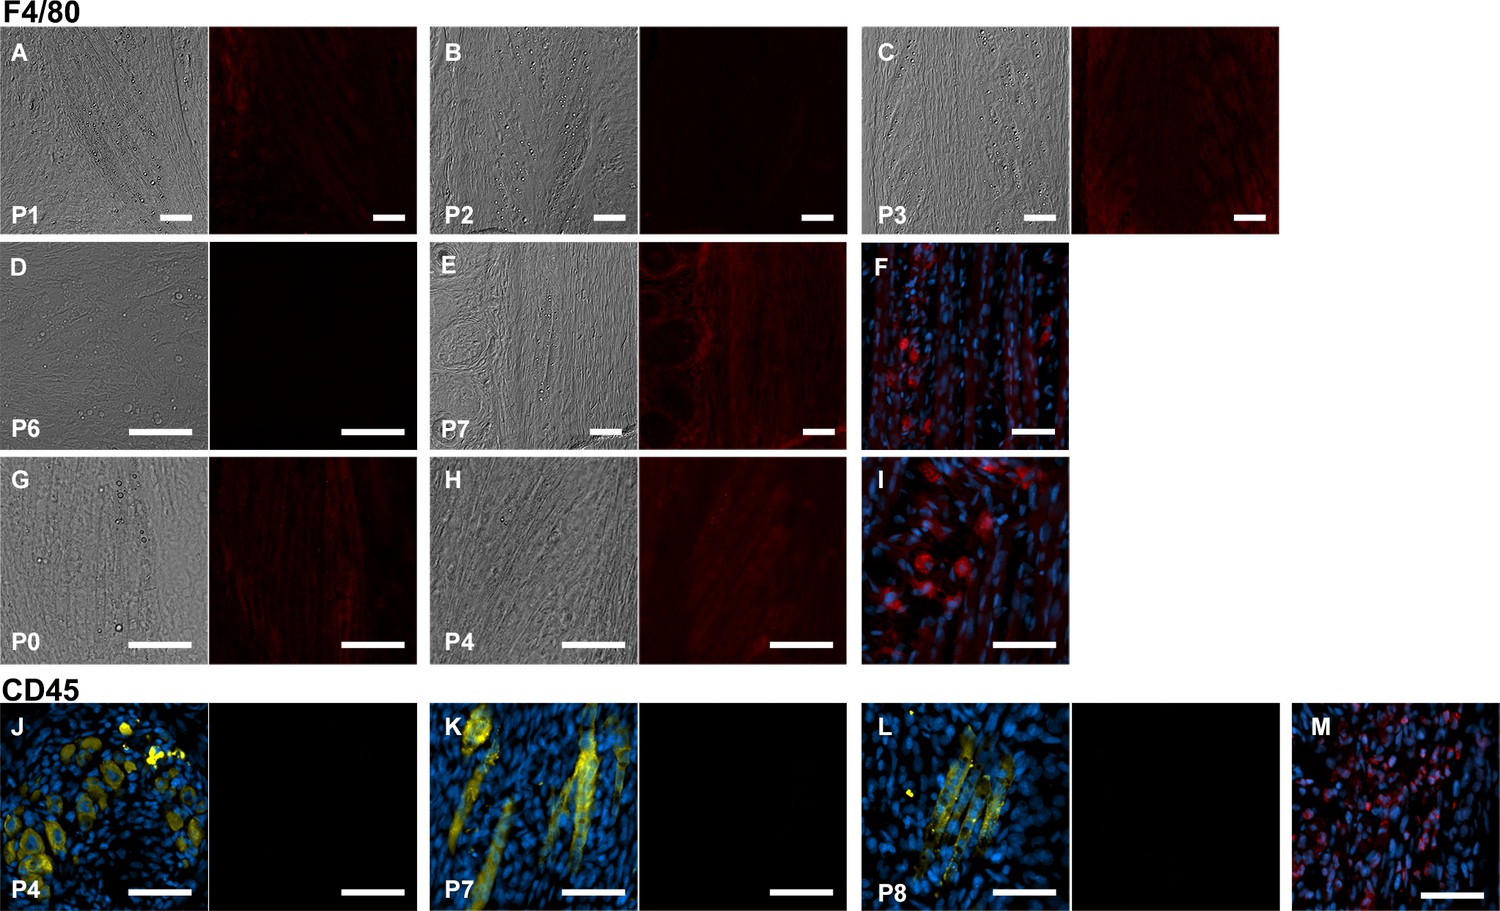
No macrophage infiltration into jerboa foot muscle.
Jerboa foot muscles have a distinct morphology and lipid droplets that can be identified by differential interference microscopy in longitudinal sections. F4/80 immunofluorescence in the same longitudinal sections of the third digit interosseous muscle in the (A) P1 (n = 2 animals), (B) P2 (n = 1), (C) P3 (n = 2), (D) P6 (n = 2) (E) P7 (n = 1), (G) P0 (n = 3), and (H) P4 jerboa foot (n = 2). Positive control illustrating macrophage presence in mechanically injured jerboa gastrocnemius muscle for A-D in F and for G-H in I. CD45 immunofluorescence in sections of the third digit interosseous muscle of jerboas. Left panels are a merge of Myosin and DAPI; right panels are CD45 immunofluorescence in (J) P4 (n = 3), (K) P7 (n = 1), (L) P8 (n = 1) animals. Positive control illustrating macrophage presence in mechanically injured jerboa gastrocnemius muscle for J-L in M. Scale bars are each 50 µm.
Figure 4 with 1 supplement
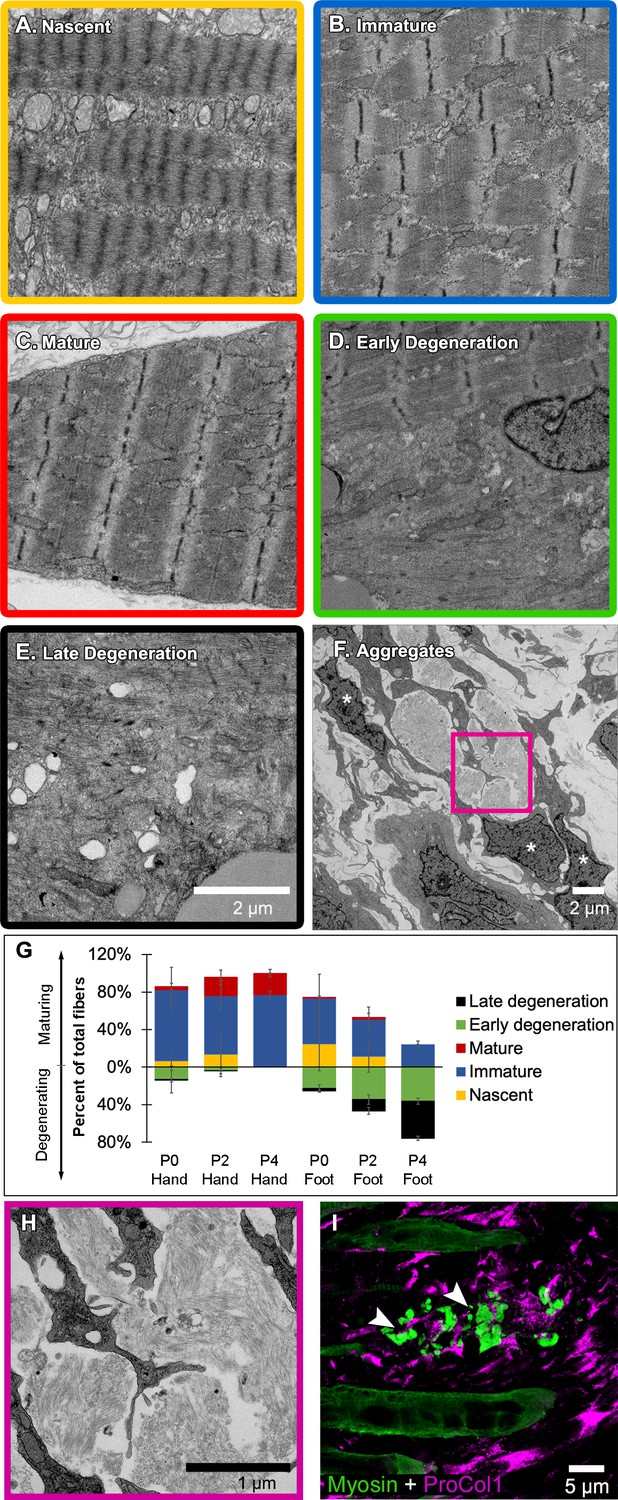
Jerboa foot myofibers degenerate from a nascent state soon after birth.
(A to C) TEM of representative jerboa hand myofibers illustrating categories (A) nascent, (B) immature, and (C) mature. (D and E) TEM of Representative jerboa foot myofibers illustrating categories (D) early degeneration and (E) late degeneration. Scale bar in E is also for A to D. (F) TEM of filamentous aggregates and surrounding fibroblast-like cells (asterisks) observed in jerboa feet. (G) Mean percentage and standard deviation of myofibers in each category in jerboa P0, P2, P4 hand and foot muscles. Number of myofibers pooled from three animals at each stage: hand – (P0), n = 135; (P2), n = 195; (P4), n = 184 (P4); foot – (P0), n = 186; (P2), n = 193; (P4), n = 186. (H) Higher magnification image of myofibril aggregates in F. (I) Pro-Collagen I positive cells surround skeletal muscle myosin+ aggregates (arrowheads) in jerboa feet. See also Figure 4—figure supplement 1.
Figure 4—figure supplement 1
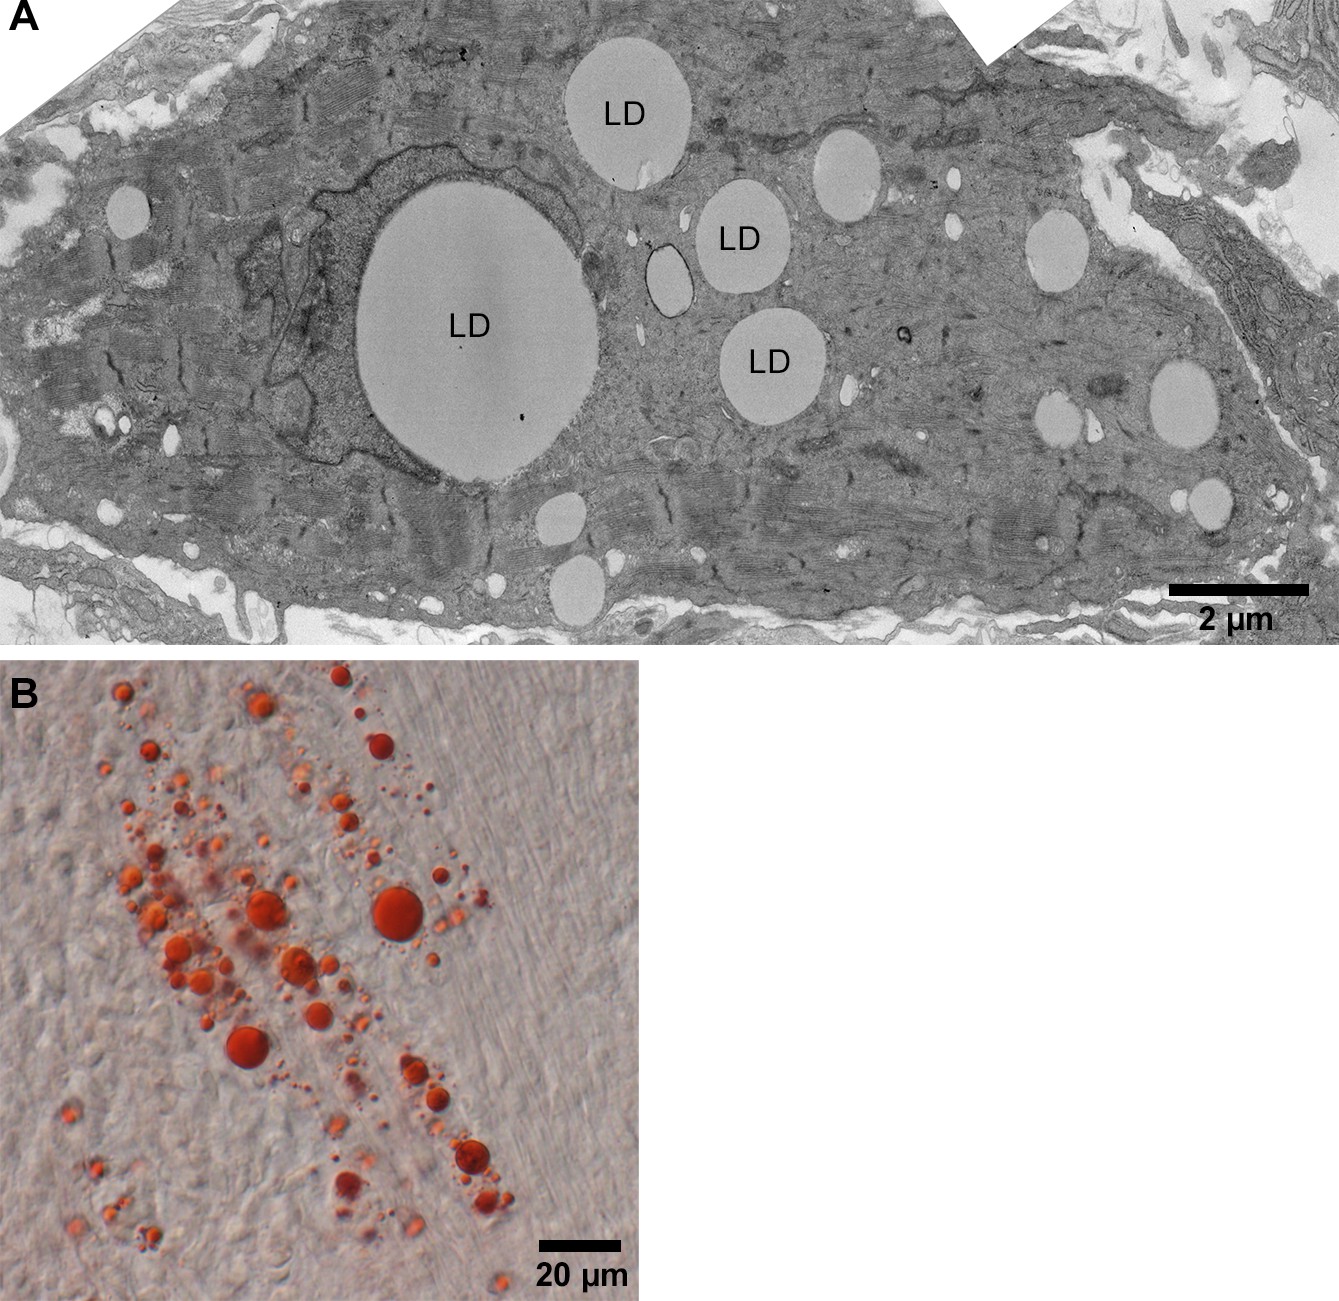
Jerboa foot muscle contains large lipid droplets.
(A) TEM and (B) Oil red O stained representative images of P4 jerboa foot muscles confirms presence of large lipid droplets. LD in (A) denotes each lipid droplet.
Figure 5 with 1 supplement

Sarcomere disorganization and E3 ubiquitin ligase expression suggest an ‘atrophy-like’ mechanism of jerboa foot muscle loss.
(A to E) Multicolor immunofluorescence images of sarcomere protein organization in P4 jerboa foot muscles (representative of 704 myofibers from seven P4 animals). (F) Model of the interpreted order of sarcomere protein disorganization derived from Figure 5—source data 1–5. (G and H) RT-qPCR measurements of (G) Atrogin-1/MAFbx and (H) MuRF1 mRNA normalized to SDHA. Fold-change and standard deviations are expressed relative to the mean for P0 forearm muscle (FDS) of the same species. Mouse P0 FDS (n = 5), foot (n = 4); mouse P3 FDS (n = 3), foot (n4); jerboa P0 FDS (n = 6), foot (n = 5); jerboa P3 FDS (n = 4), foot (n = 6). In G: **p=0.0045, ****p<0.0001. In H: **p=0.0011, ***p=0.0002. (I and J) RT-qPCR measurements of (I) NF-κB2 and (J) Relb mRNA normalized to SDHA. Fold-change and standard deviations are expressed relative to the mean for P0 forearm muscle (FDS) of the same species. Mouse P0 FDS (n = 4), foot (n = 3); mouse P3 FDS and foot (n = 3); jerboa P0 FDS and foot (n = 3); jerboa P3 FDS and foot (n = 4). In I: *p=0.0112, ****p<0.0001. In J from left to right: *p=0.0473, **p=0.0012, **p=0.0017, and **p=0.0012.
-
Figure 5—source data 1
Information extracted from multicolor immunofluorescence of individual myofibers to infer the order of sarcomere protein disorganization in jerboa foot muscles.
‘Good’ represents striated localization of each protein to the sarcomere, and ‘bad’ refers to no distinguishable banded pattern of protein expression. In group 1, we saw myofibers with all three proteins properly localized suggesting disorganization follows an initial state of proper localization. When we compared the dRM and Drm categories, we saw loss of Desmin localization when Tropomyosin and Myosin were ‘good’ and almost no myofibers where Desmin was good and the others were bad. This suggests that Desmin is disorganized prior to Tropomyosin and Myosin. In group 2a, there were cells in the rmT category and almost none in the RMt category, suggesting Tropomyosin and Myosin are disorganized prior to Titin. Group 2b illustrates that both categories RmT and rMT appeared at similar frequency, suggesting it is unclear whether Tropomyosin or Myosin become disorganized prior to the other. In group 3, there were cells in the mtA category and none in the MTa category, suggesting Titin becomes disorganized before Alpha-actinin. Similarly, in group 4, there were cells in the mtY category but not in the MTy category suggesting Titin becomes disorganized before Myomesin. Due to shared antibody isotype for Alpha-actinin and Myomesin, the order of disorganization between these two could not be discerned. See Figure 5—source data 2–5 for full details of the percentage of myofibers in each category for each combination of multicolor immunofluorescence.
- https://doi.org/10.7554/eLife.50645.016
-
Figure 5—source data 2
Percentage of myofibers in each category for Desmin, Tropomyosin, Myosin, and Titin multicolor immunofluorescence of jerboa hand and foot muscles at three postnatal stages.
For the combination of Desmin, Tropomyosin and Myosin: P0 (two animals) hand n = 78 myofibers and foot n = 113 myofibers; P2 (two animals) hand n = 56 and foot n = 54 myofibers; P4 (two animals) hand n = 69 and foot n = 117 myofibers. For the combination of Desmin, Myosin, and Titin: P0 (two animals) hand n = 48 and foot n = 96 myofibers; P2 (two animals) hand n = 71 and foot n = 77 myofibers; P4 (two animals) hand n = 63 and foot n = 92 myofibers.
- https://doi.org/10.7554/eLife.50645.017
-
Figure 5—source data 3
Percentage of myofibers in each category for Tropomyosin, Myosin, and Titin multicolor immunofluorescence of jerboa hand and foot muscles at three postnatal stages.
P0 hand (three animals; n = 125 myofibers) and foot (four animals; n = 225 myofibers); P2 (four animals) hand n = 118 and foot n = 183 myofibers; P4 (three animals) hand n = 104 and foot n = 172 myofibers.
- https://doi.org/10.7554/eLife.50645.018
-
Figure 5—source data 4
Percentage of myofibers in each category for Myosin, Titin, and Alpha-actinin multicolor immunofluorescence of jerboa hand and foot muscles at three postnatal stages.
P0 hand (three animals) n = 156 and foot n = 182 myofibers; P2 (four animals) hand n = 189 and foot n = 203 myofibers; P4 hand (three animals; n = 104 myofibers) and foot (four animals; n = 172 myofibers).
- https://doi.org/10.7554/eLife.50645.019
-
Figure 5—source data 5
Percentage of myofibers in each category for Myosin, Titin, Myomesin multicolor immunofluorescence of jerboa hand and foot muscles at three postnatal stages.
P0 (three animals) hand n = 130 and foot n = 159 myofibers; P2 (three animals) hand n = 126 and foot n = 142 myofibers; P4 hand (three animals; n = 98 myofibers) and foot (four animals; n = 164 myofibers).
- https://doi.org/10.7554/eLife.50645.020
Figure 5—figure supplement 1
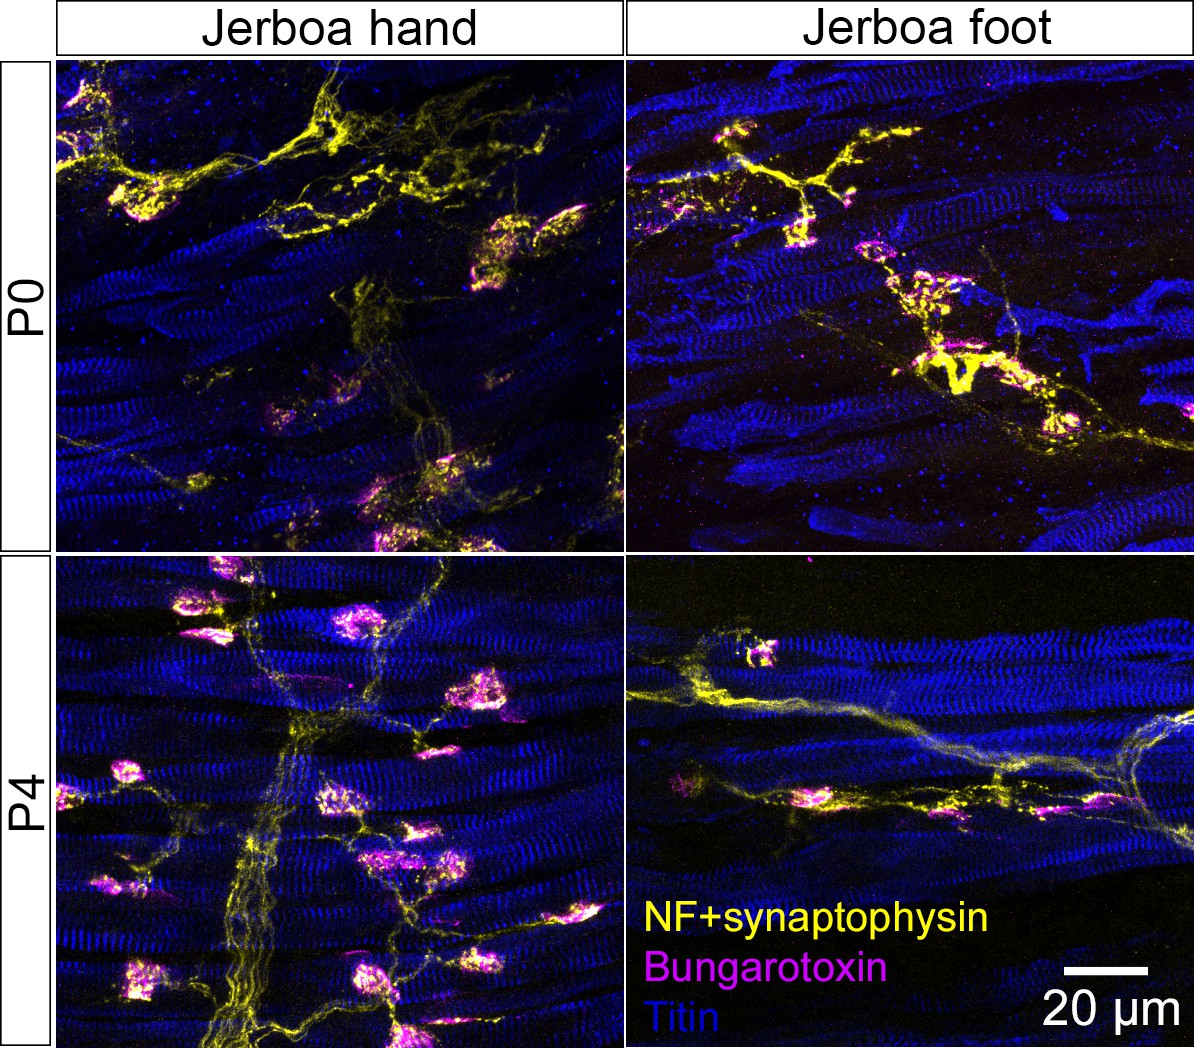
Jerboa foot muscles are innervated.
Representative longitudinal multicolor immunofluorescence images of P0 and P4 jerboa hand and foot muscles with correlated expression of the presynaptic neuronal protein, Synaptophysin, and post-synaptic Acetylcholine Receptor (AchR) (P0: n = 4 animals, P4: n = 5 animals).
Author response image 1
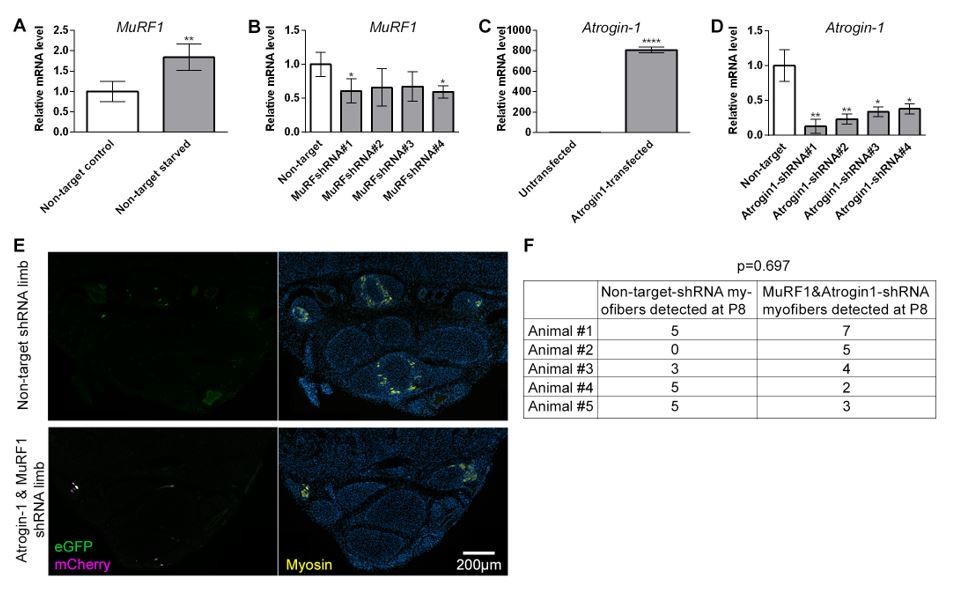
In vitro shRNA validation and outcome of intra muscular electroporation.qRT-PCR measurements of Murf1 or Atrogin-1 mRNA normalized to SDHA from cell culture used for in vitro validation of shRNA targeting Murf1 or Atrogin-1.
(A-B) Quantification of Murf1 mRNA in cells transfected with non-target shRNA or Murf1 shRNAs and subjected to 24 hr starvation. (C) Quantification of Atrogin-1 mRNA in cells untransfected or transfected with Atrogin-1 gene. (D) Quantification of Atrogin-1 mRNA in cells co-transfected with Atrogin-1 gene and non-target or Atrogin-1 shRNAs. *p<0.05, **p<0.01, ****p<0.0001. in vivo electroporation of shRNA constructs at birth and analysis at P8 (D) Representative transverse multicolor immunofluorescence images of non-target shRNA electroporated and of Atrogin-1 and Murf1 shRNA electroporated with correlated expression of eGFP, mCherry, and Myosin, n=5 animals. (E) Quantification of the total number of electroporated myofibers observed in P8 jerboa foot of non-target-shRNA and of Atrogin-1 and Murf1 shRNA electroporated limbs. Paired sample t-test yields p=0.697, 1-β=0.1.
Tables
Key resources table
| Reagent type or resource | Designation | Source or reference | Identifiers | Additional information |
|---|---|---|---|---|
| Antibody | Anti- Col1A1 (mouse monoclonal) | DSHB | SP1.D8 | 1:20 |
| Antibody | Anti- Dystroglycan (mouse monoclonal) | DSHB | 11H6C4 | 1:10 |
| Antibody | Anti- MyHC (mouse monoclonal) | DSHB | MF20 | 1:20 |
| Antibody | Anti- Myomesin (mouse monoclonal) | DSHB | mMaC myomesin B4 | 1:20 |
| Antibody | Anti- Myogenin (mouse monoclonal) | DSHB | F5D | 1:5 |
| Antibody | Anti- Titin (mouse monoclonal) | DSHB | 9D10 | 1:10 |
| Antibody | Anti- Tropomyosin (mouse monoclonal) | DSHB | CH1 | 1:10 |
| Antibody | Anti- Desmin (mouse monoclonal) | Sigma Aldrich | D33 | 1:300 |
| Antibody | Anti- α-actinin (mouse monoclonal) | Sigma Aldrich | EA53 | 1:1000 |
| Antibody | Anti- Annexin-V (rabbit polyclonal) | Abcam | ab14196 | 1:100 |
| Antibody | Anti- Desmin (rabbit monoclonal) | Abcam | ab32362 | 1:500 |
| Antibody | Anti- CD45 (rabbit polyclonal) | Abcam | ab10558 | 1:200 |
| Antibody | Anti- F4/80 (rat monoclonal) | Abcam | ab6640 | 1:200 |
| Antibody | Anti- Cleaved Caspase-3 (Asp175) (rabbit polyclonal) | CST | Cat#9661 | 1:100 |
| Antibody | Alexa 488 conjugated Wheat Germ Agglutinin | Invitrogen | W11261 | 1:200 |
| Antibody | Anti- BrdU | Biorad | MCA2060 | 1:100 |
| Other | In Situ Cell Death Detection Kit, TM-Red | Roche | Cat# 12156792910 |
Additional files
-
Transparent reporting form
- https://doi.org/10.7554/eLife.50645.021
Download links
A two-part list of links to download the article, or parts of the article, in various formats.
Downloads (link to download the article as PDF)
Open citations (links to open the citations from this article in various online reference manager services)
Cite this article (links to download the citations from this article in formats compatible with various reference manager tools)
Evolutionary loss of foot muscle during development with characteristics of atrophy and no evidence of cell death
eLife 8:e50645.
https://doi.org/10.7554/eLife.50645


