Single-cell proteomics reveals changes in expression during hair-cell development
- Pacific Northwest National Laboratory, United States
- Stanford University, United States
- Amgen Inc, United States
- Oregon Health & Science University, United States
- Kyung Hee University, Republic of Korea
- Brigham Young University, United States
Figures
Figure 1 with 2 supplements
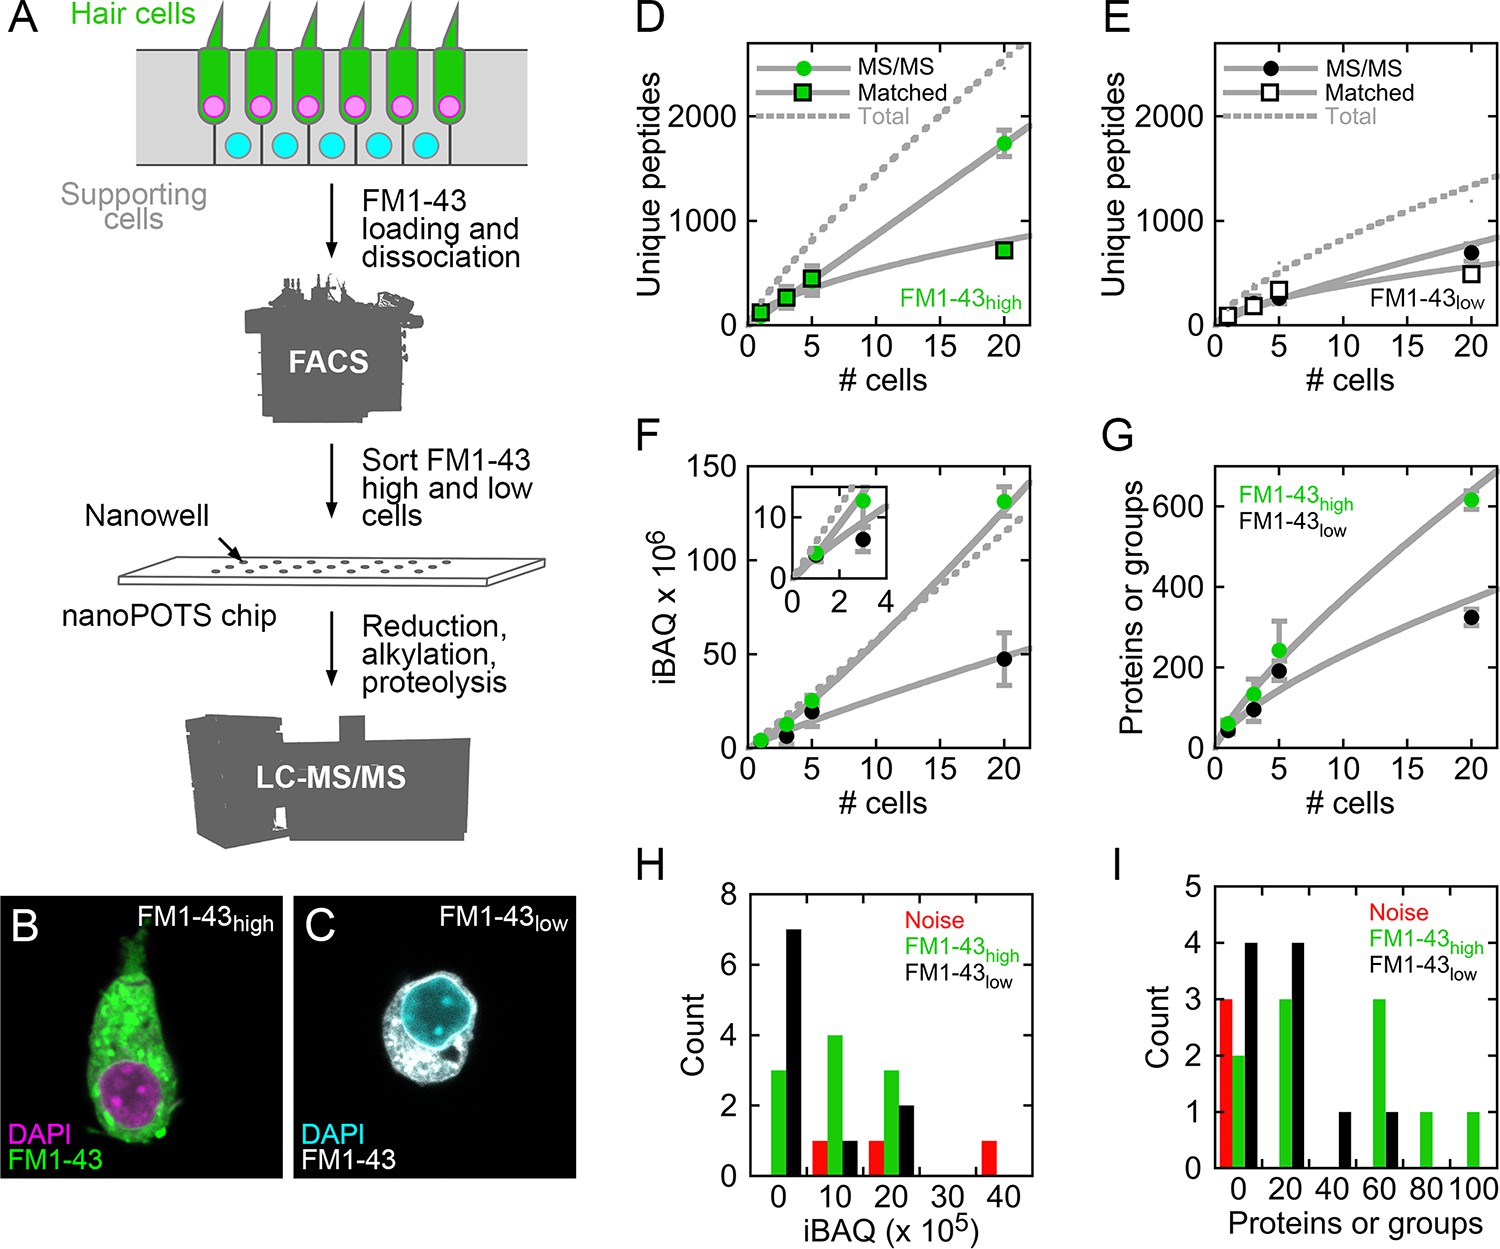
Mass spectrometry of single cells and small cell pools from E15 chick utricle.
(A) Experimental design. The E15 chick utricle’s sensory epithelium consists of sensory hair cells and supporting cells, which are also progenitor cells. FM1-43 labels hair cells more strongly than supporting cells. The dissociated cells were sorted by FACS and deposited into single nanowells in nanoPOTS chips, where sample processing was carried out without transfer. Samples were loaded into glass microcapillaries and were analyzed by mass spectrometry. LC-MS/MS, liquid chromatography-tandem mass spectrometry. (B) FACS-sorted FM1-43high cell with typical hair cell cytomorphology, including apical hair bundle. (C) FACS-sorted FM1-43low cell shows rounded cytomorphology after dissociation. For B and C, FM1-43 dye was added again to cells after sorting in order to visualize cell shape; dye intensity therefore is not representative of the signal used for sorting hair cells from supporting cells. (D–E) Relationship between number of cells and unique peptides. Peptides directly identified by MS2 (peptide fragmentation) spectrum matching are shown by circles and those indirectly identified by Match Between Runs by squares; data are separately plotted for FM1-43high (D) and FM1-43low (E). Gray solid lines are power fits to data through (0,0); gray dashed line is fit to sum of the MS/MS and Matched data. (F) Relationship between number of cells and total iBAQ. Gray solid line is power fit through (0,0); gray dashed line is linear fit through (0,0). Green, FM1-43high; black, FM1-43low. Inset shows 1–3 cells only. (G) Relationship between number of cells and the total number of proteins or protein groups identified. Gray solid line is power fit through (0,0). Data for D-G were from Experiment 1; mean ± SEM are plotted. (H) Distribution of total iBAQ for individual cells (FM1-43high, green; FM1-43low, black) or for blank wells (red). Count refers to the number of cells in a bin. Note that total iBAQ does not distinguish individual cells from noise. (I) Distribution of number of identified proteins or protein groups. This measure distinctly distinguishes individual cells from noise; those FM1-43high or FM1-43low samples with low numbers of identifications likely do not have cells in the nanowells. Data for H-I were from Experiment 2.
-
Figure 1—source data 1
MaxQuant analysis of single cell proteomics data.
Excel file containing data from Experiments 1 and 2 analyzed together by MaxQuant and Andromeda.
- https://doi.org/10.7554/eLife.50777.005
Figure 1—figure supplement 1
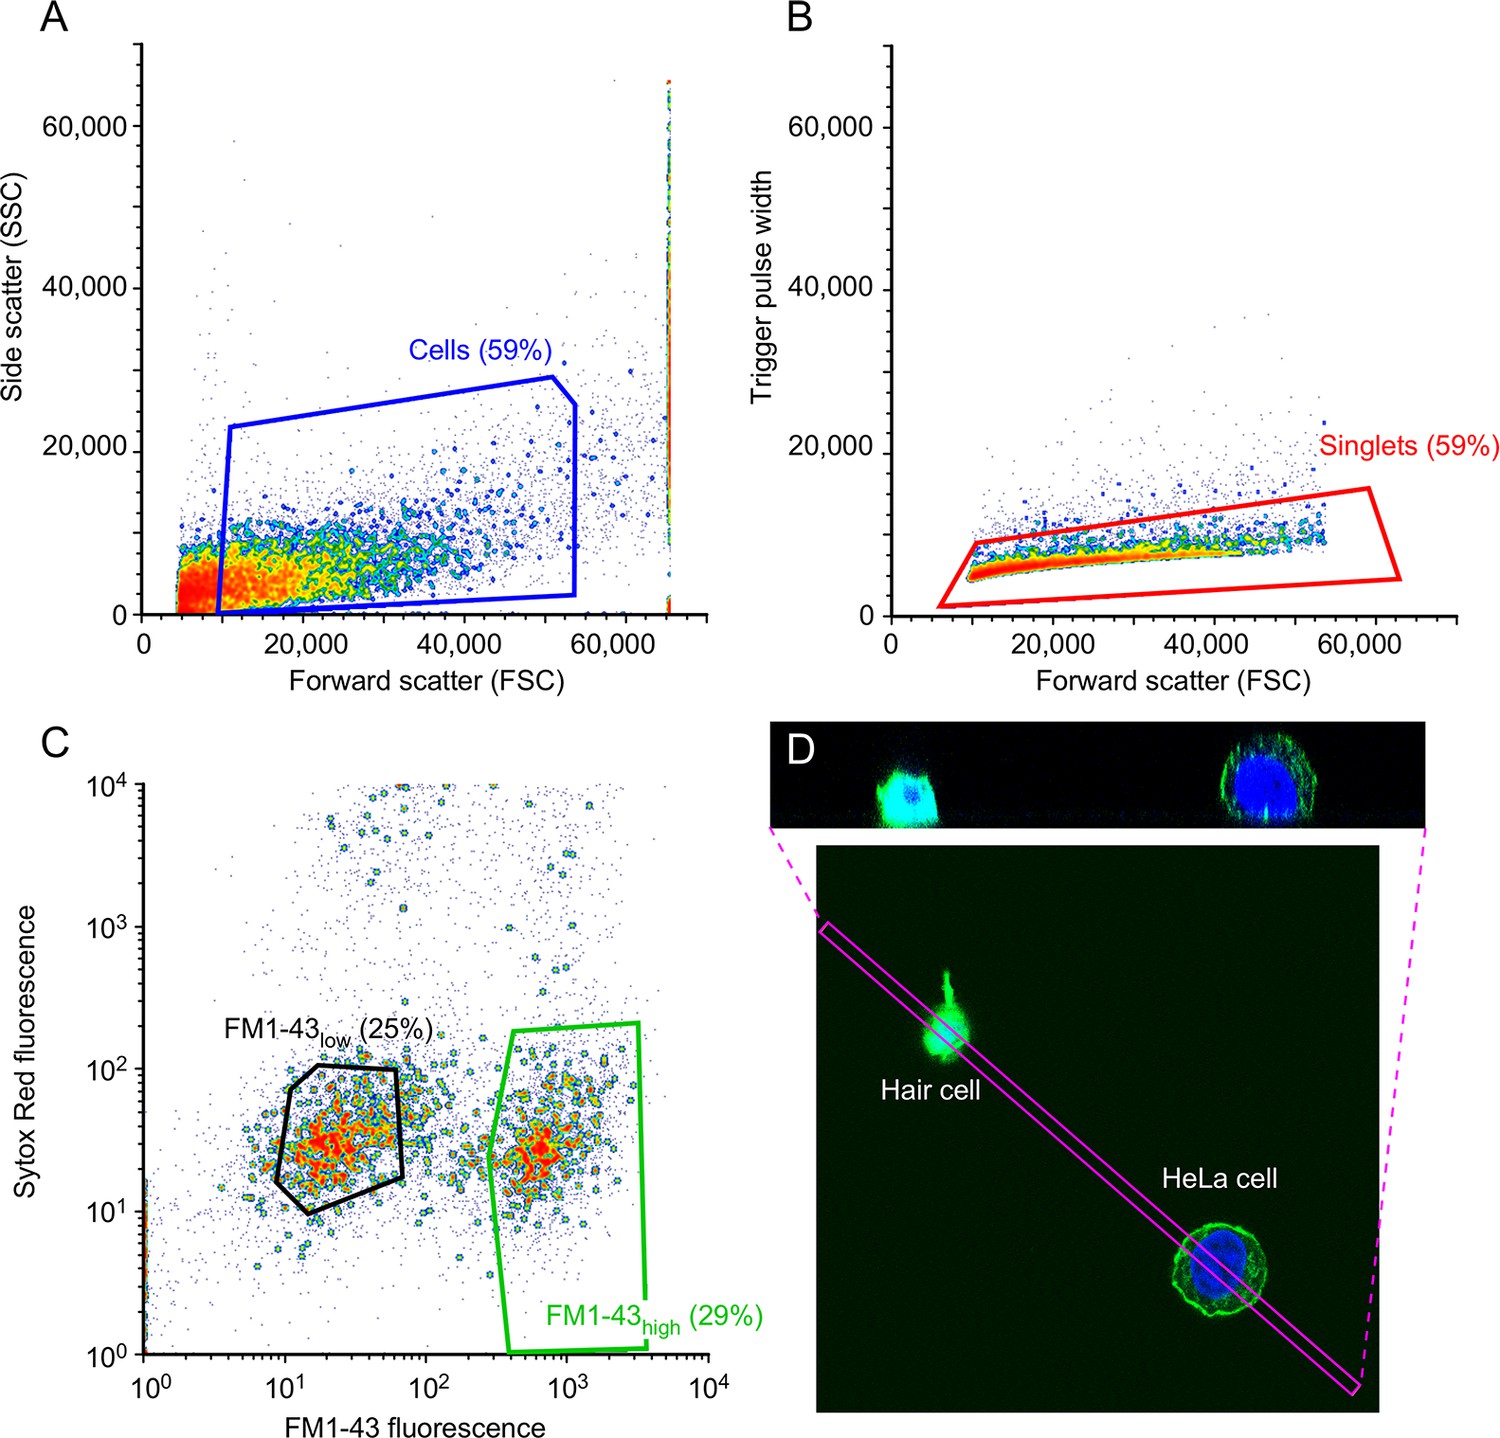
Characterization of isolated utricle cells.
(A-C) FACS gating protocol. (A) Debris was removed based on side-scatter area (SSC-A) and forward-scatter area (FSC-A). Blue box shows cells collected. (B) Doublets were discarded based on forward scatter (FSC) versus trigger pulse width. Red box shows cells collected. (C) SYTOX Red Dead Cell Stain was used to identify live and dead cells, while FM1-43 was used to distinguish single FM1-43low cells (left, black box, 25% of total events) and FM1-43high cells (right, green box, 29% of total events). (D) Isolated hair cell and HeLa cell, labeled after dissociation with FM1-43 (green) and DAPI (blue). The box indicating the x-y extent of the x-z reslice shown in the upper panel is indicated by the magenta box. Average projection was used.
Figure 1—figure supplement 2
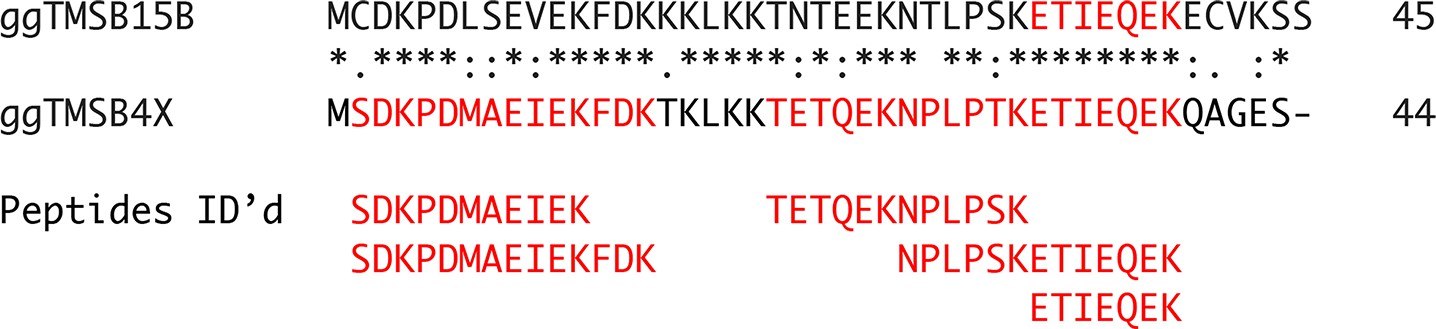
Peptide coverage of TMSB4X in mass spectrometry experiments.
Characterization of isolated utricle cells. (A–C) FACS gating protocol. (A) Debris was removed based on side-scatter area (SSC-A) and forward-scatter area (FSC-A). Blue box shows cells collected. (B) Doublets were discarded based on forward scatter (FSC) versus trigger pulse width. Red box shows cells collected. (C) SYTOX Red Dead Cell Stain was used to identify live and dead cells, while FM1-43 was used to distinguish single FM1-43low cells (left, black box, 25% of total events) and FM1-43high cells (right, green box, 29% of total events). (D) Isolated hair cell and HeLa cell, labeled after dissociation with FM1-43 (green) and DAPI (blue). The box indicating the x-y extent of the x-z reslice shown in the upper panel is indicated by the magenta box. Average projection was used.
Figure 2 with 3 supplements
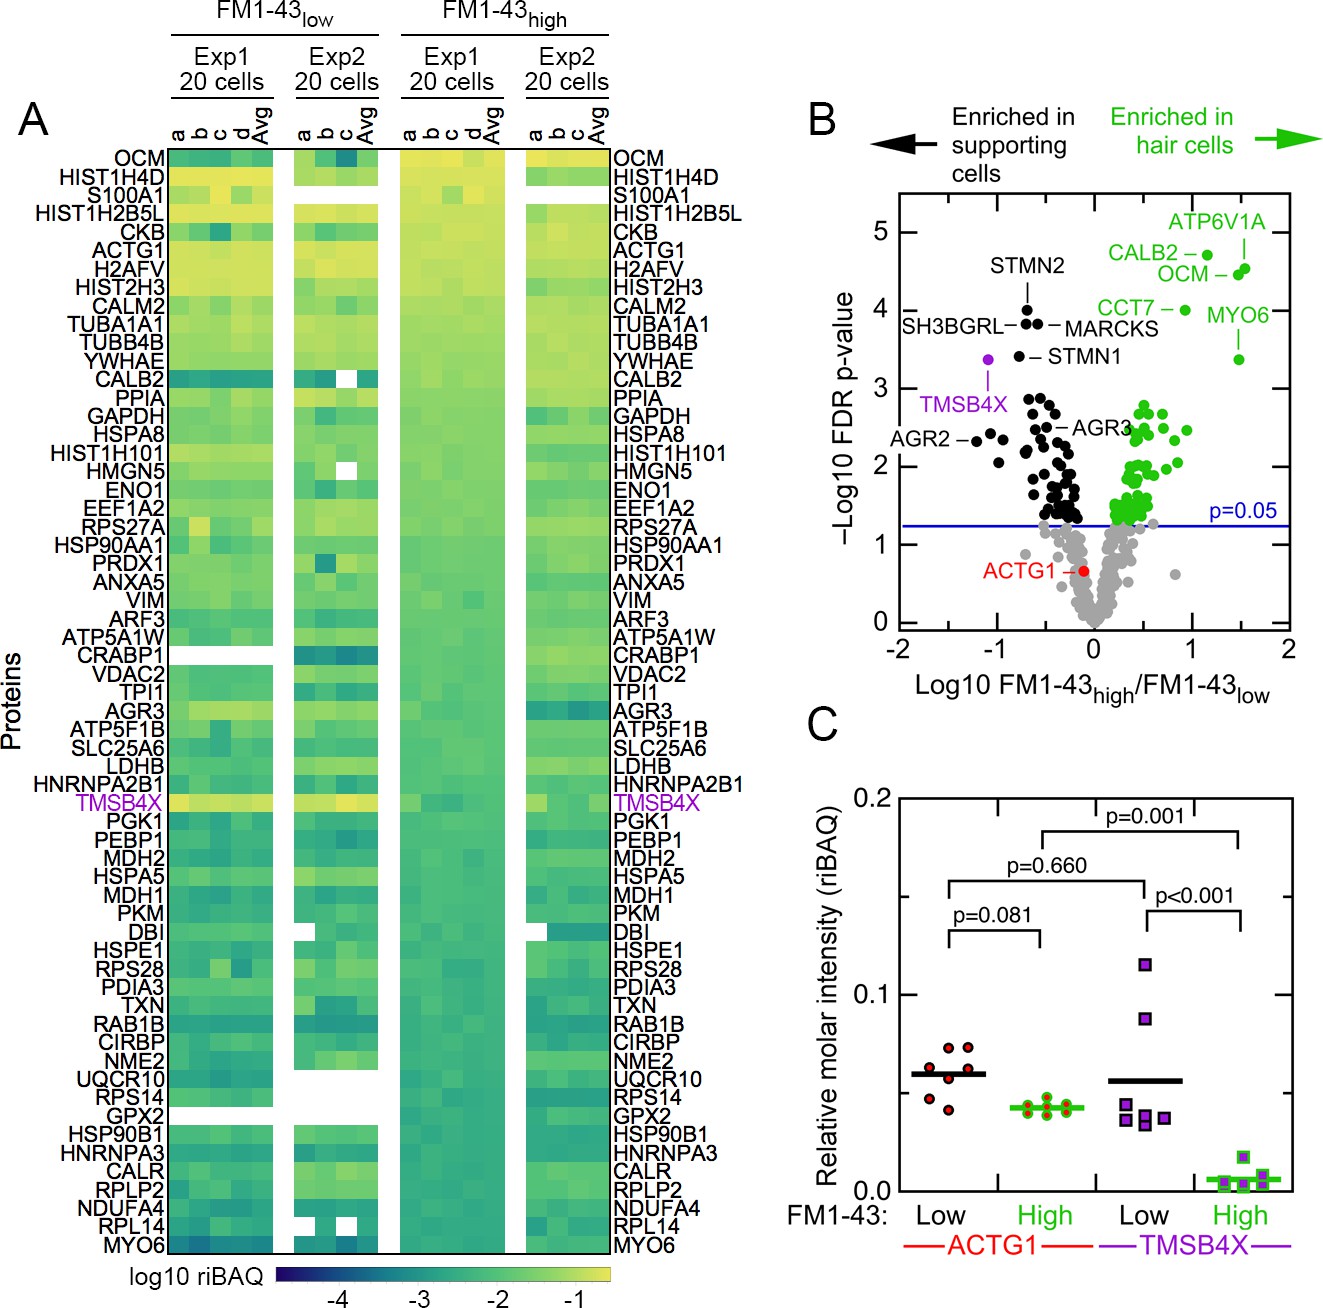
Abundant proteins in small pools of isolated E15 chick utricle cells.
(A) Heat map showing top 60 proteins or protein groups in samples of 20 cells, sorted by the average of the 20 cell FM1-43high samples. FM1-43low and FM1-43high samples from Experiment 1 (Exp1) and Experiment 2 (Exp2) are both displayed, as are the averages of the individual samples. TMSB4X is called out with magenta type. Scale on bottom indicates relationship between riBAQ and color. (B) Volcano plot showing relationship between FM1-43high/FM1-43low enrichment (x-axis) and false discovery rate (FDR)-adjusted p-value (y-axis). Proteins that are significantly enriched are labeled with green (FM1-43high>FM1-43low) or black (FM1-43low>FM1-43high). (C) ACTG1 and TMBS4X quantitation. Relative molar fraction (riBAQ) quantitation of ACTG1 (circle, red fill) and TMSB4X (square, magenta fill) expression in FM1-43high cells (green outline) or FM1-43low cells (black outline). Samples with 20 cells are plotted; lines indicate mean expression level for the group. Statistical significance is indicated.
Figure 2—figure supplement 1

Expression levels for all proteins in samples from Experiments 1 and 2 that contain pools of three cells, five cells, or 20 cells.
Each sample (indicated by letters) under the callout for cell numbers contains that number of cells (i.e., on the left, samples a-c under labels indicating ‘Experiment 1’ and ‘FM1-43 low’ each contain three cells). Log10 riBAQ color scale is indicated at bottom. Heat map is sorted by the average of the 20 cell FM1-43high samples from Experiment 1. Three samples (from Experiment 2) that were collected during FACS experiments using noise to gate are also shown.
Figure 2—figure supplement 2

Expression levels for all proteins in samples from Experiments 1 and 2 from single-cell samples.
Each sample is indicated by letters. ‘Avg’ indicates the average of the 20 cell samples for that condition and experiment. Log10 riBAQ color scale is indicated at bottom. Heat map is sorted by the average of the 20 cell FM1-43high samples from Experiment 1. Three samples (from Experiment 2) that were collected during FACS experiments using noise to gate are also shown.
Figure 2—figure supplement 3
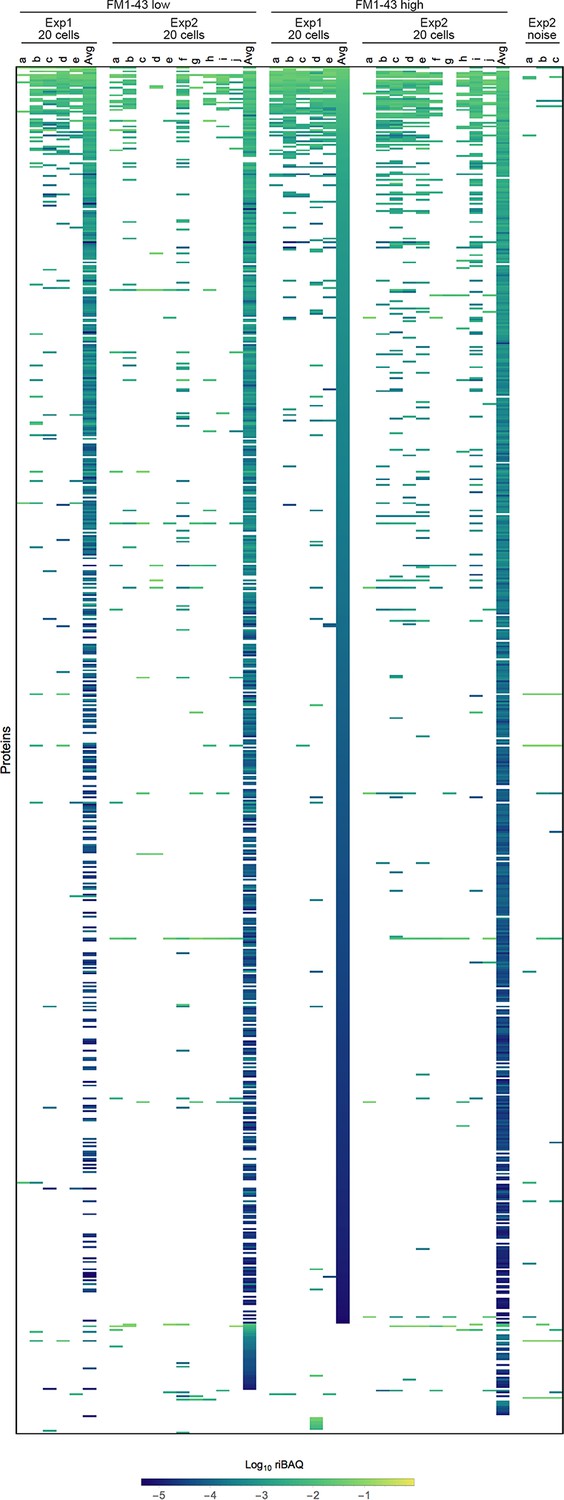
Expression levels for all proteins in single-cell samples in Experiments 1 and 2.
Each sample is indicated by letters. ‘Avg’ indicates the average of the 20 cell samples for that condition and experiment. Heat map, which shows all identified proteins or protein groups in single cells, is sorted by the FM1-43high20 cell average from Experiment 1. Three samples (from Experiment 2) that were collected during FACS experiments using noise to gate are also shown.
Figure 3 with 6 supplements
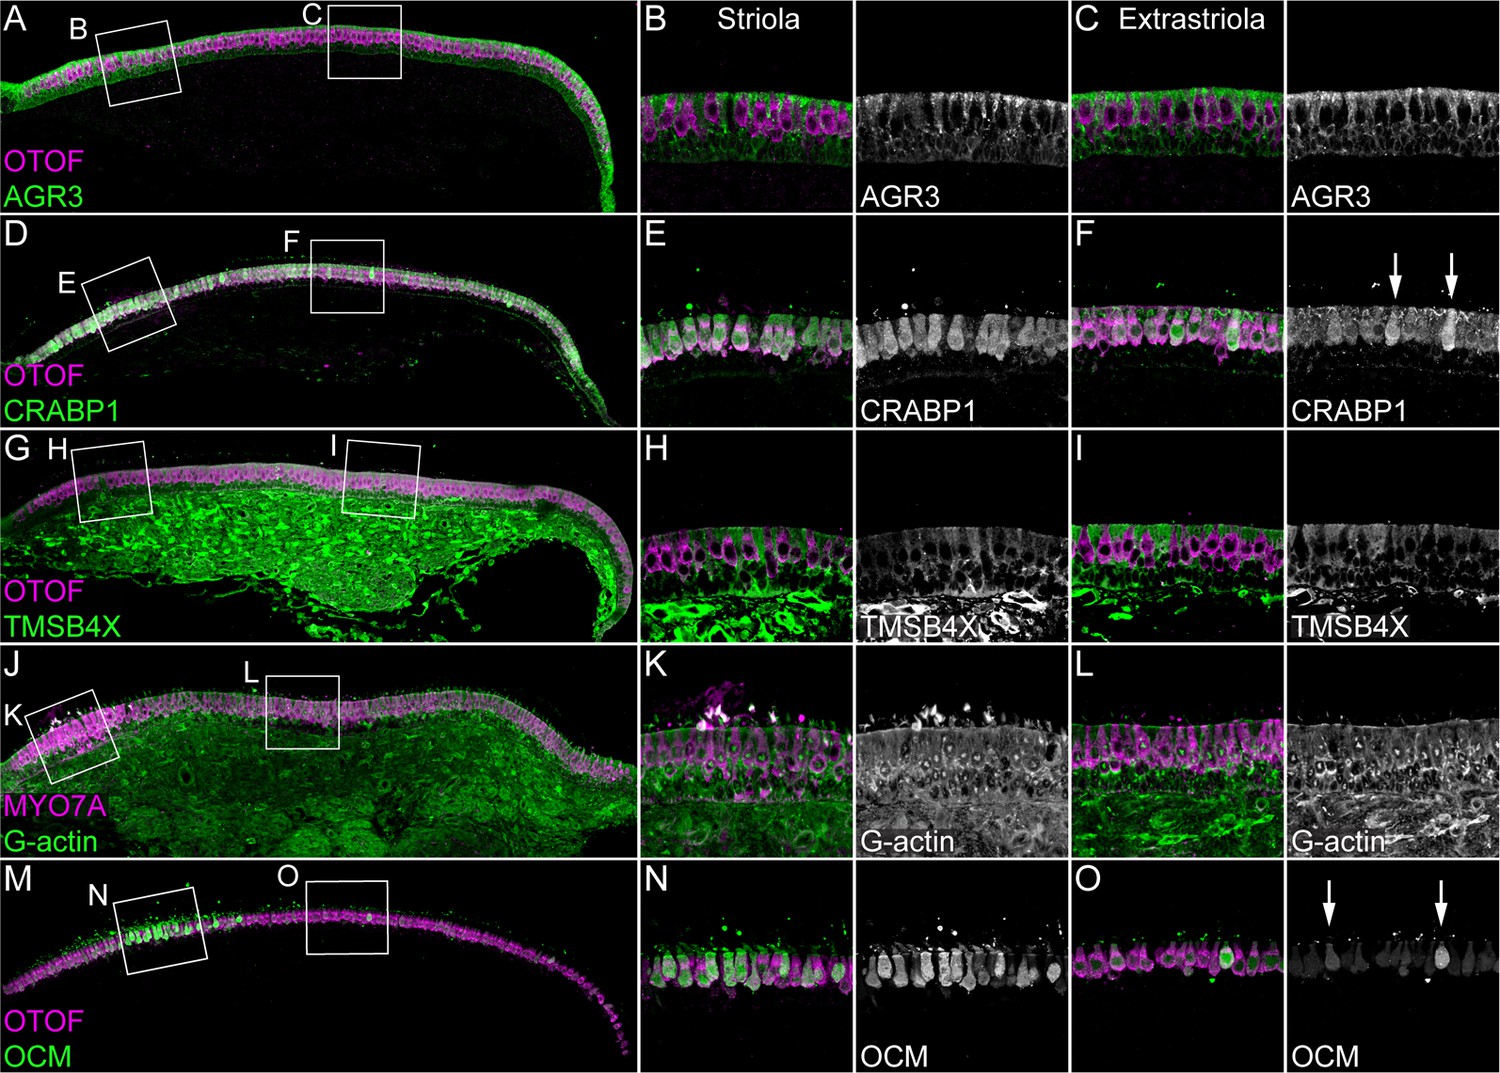
Immunolocalization of proteins enriched in hair cells or supporting cells of E15 chick utricle.
Confocal z-stacks of vibratome cross-sections of the whole utricle were imaged with the tiling and stitching function in Zeiss ZEN. Confocal z-stacks for magnified extrastriolar and striolar regions were collected separately. A subset of the z-stacks series was used for the maximum intensity projection to preserve single-cell resolution. Hair cells are labeled with antibodies against OTOF or MYO7A (each in magenta). (A–C) AGR3 (green) was detected in extrastriolar and striolar supporting cells. Panel full widths: A, 913 µm; B-C, 125 µm. (D–F) CRABP1 (green) is concentrated in hair cells. A few extrastriolar hair cells show very high levels of CRABP1 (arrows). Panel full widths: D, 1038 µm; E-F, 125 µm. (G–I) TMSB4X (green) immunoreactivity was intense in cells of the mesenchymal stromal cell layer. TMSB4X was detectable at moderate levels in extrastriolar and striolar supporting cells and at low levels in hair cells located in extrastriolar and striolar regions. Panel full widths: G, 934 µm; H-I, 125 µm. (J–L) G-actin (JLA20 antibody, green) is expressed at equal levels in hair cells, supporting cells and mesenchymal stromal cells. Panel full widths: J, 839 µm; K-L, 125 µm. (M–O) OCM was detectable at high levels in striolar hair cells and at low levels in extrastriolar hair cells. A few extrastriolar hair cells display high levels of OCM (arrows). Panel full widths: M, 946 µm; N-O, 125 µm. Expanded images of all individual channels (transmitted light, nuclei, F-actin, hair cells, and specific antibody) are shown in Figure 3—figure supplements 1–5.
Figure 3—figure supplement 1

Immunolocalization of AGR3 in E15 chick utricle.
The sensory epithelium and the stroma are indicated in the transmitted-light section. Nuclei were stained with DAPI and F-actin with phalloidin; OTOF and AGR3 were stained with specific antibodies. Magnified panels on right clearly show that hair cells (marked by OTOF staining) have much lower levels of AGR3 than do supporting cells, which surround hair cells. Panel full widths: A, 913 µm; B-C, 125 µm.
Figure 3—figure supplement 2
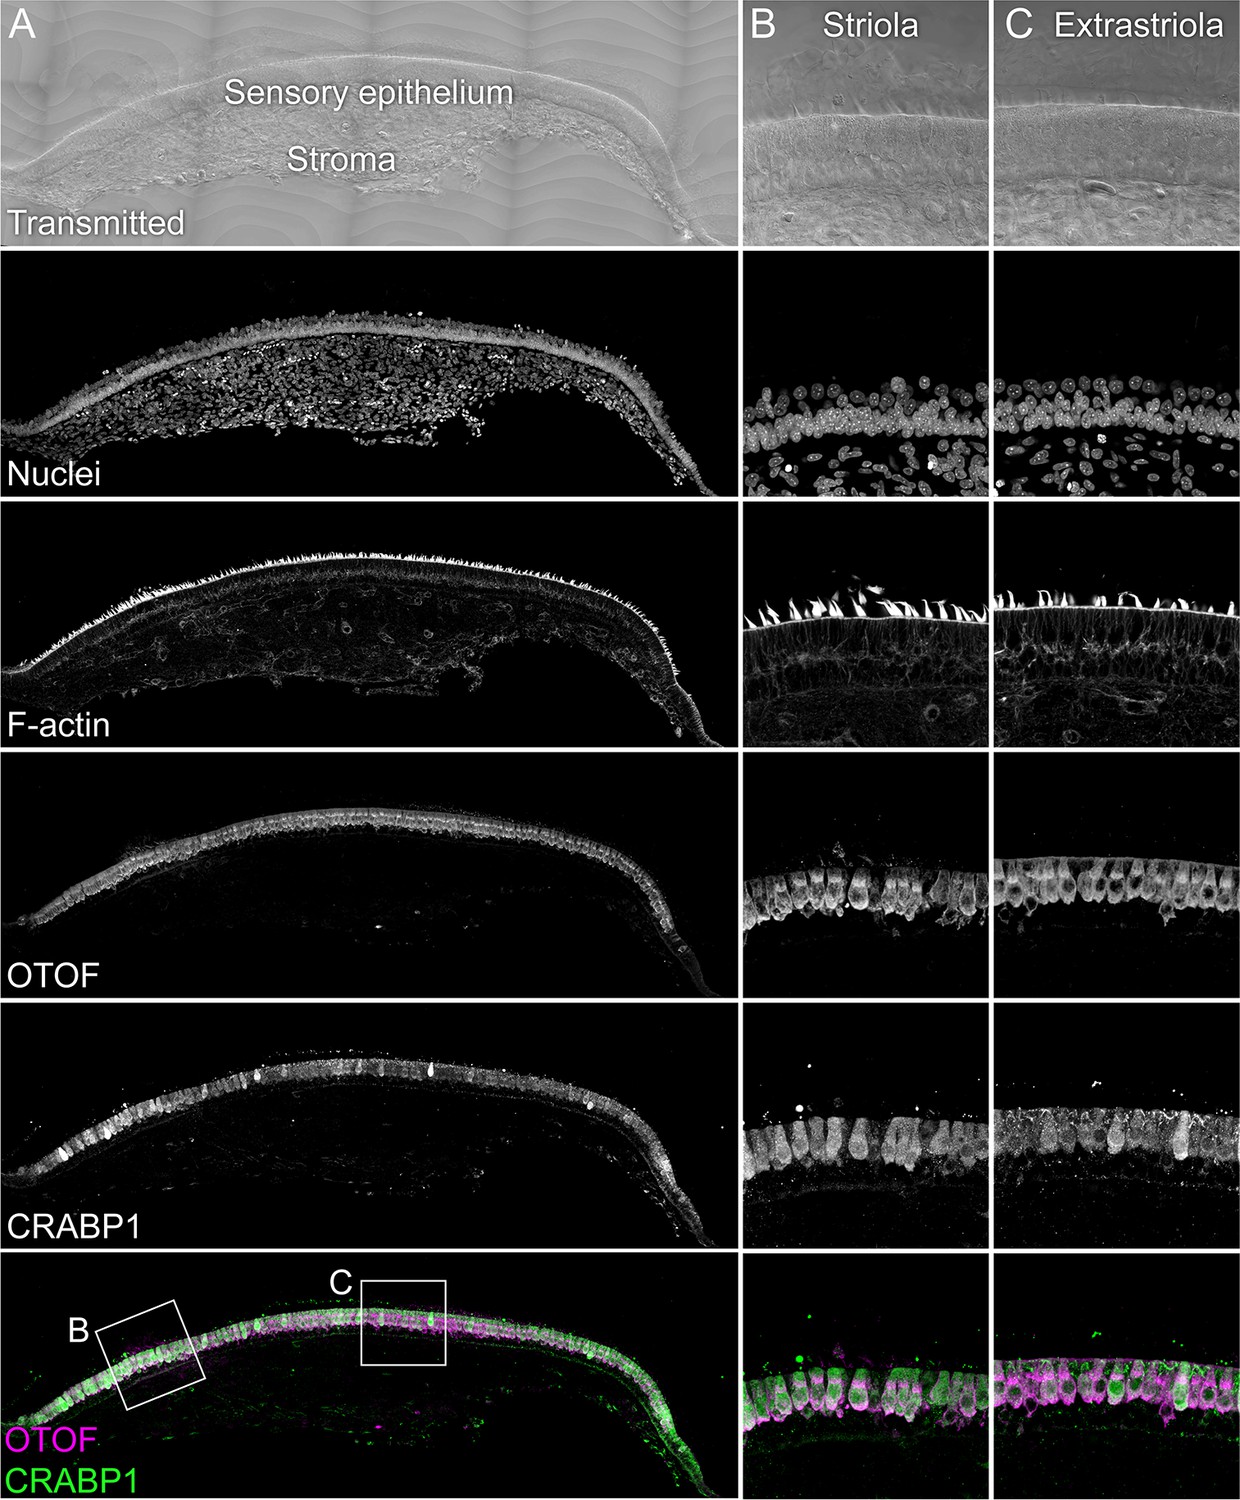
Immunolocalization of CRABP1 in E15 chick utricle.
The sensory epithelium and the stroma are indicated in the transmitted-light section. Nuclei were stained with DAPI and F-actin with phalloidin; MYO7A and CRABP1 were stained with specific antibodies. Magnified panels on right clearly show that hair cells are co-labeled by CRABP1 and OTOF antibodies. Panel full widths: A, 1038 µm; B-C, 125 µm.
Figure 3—figure supplement 3
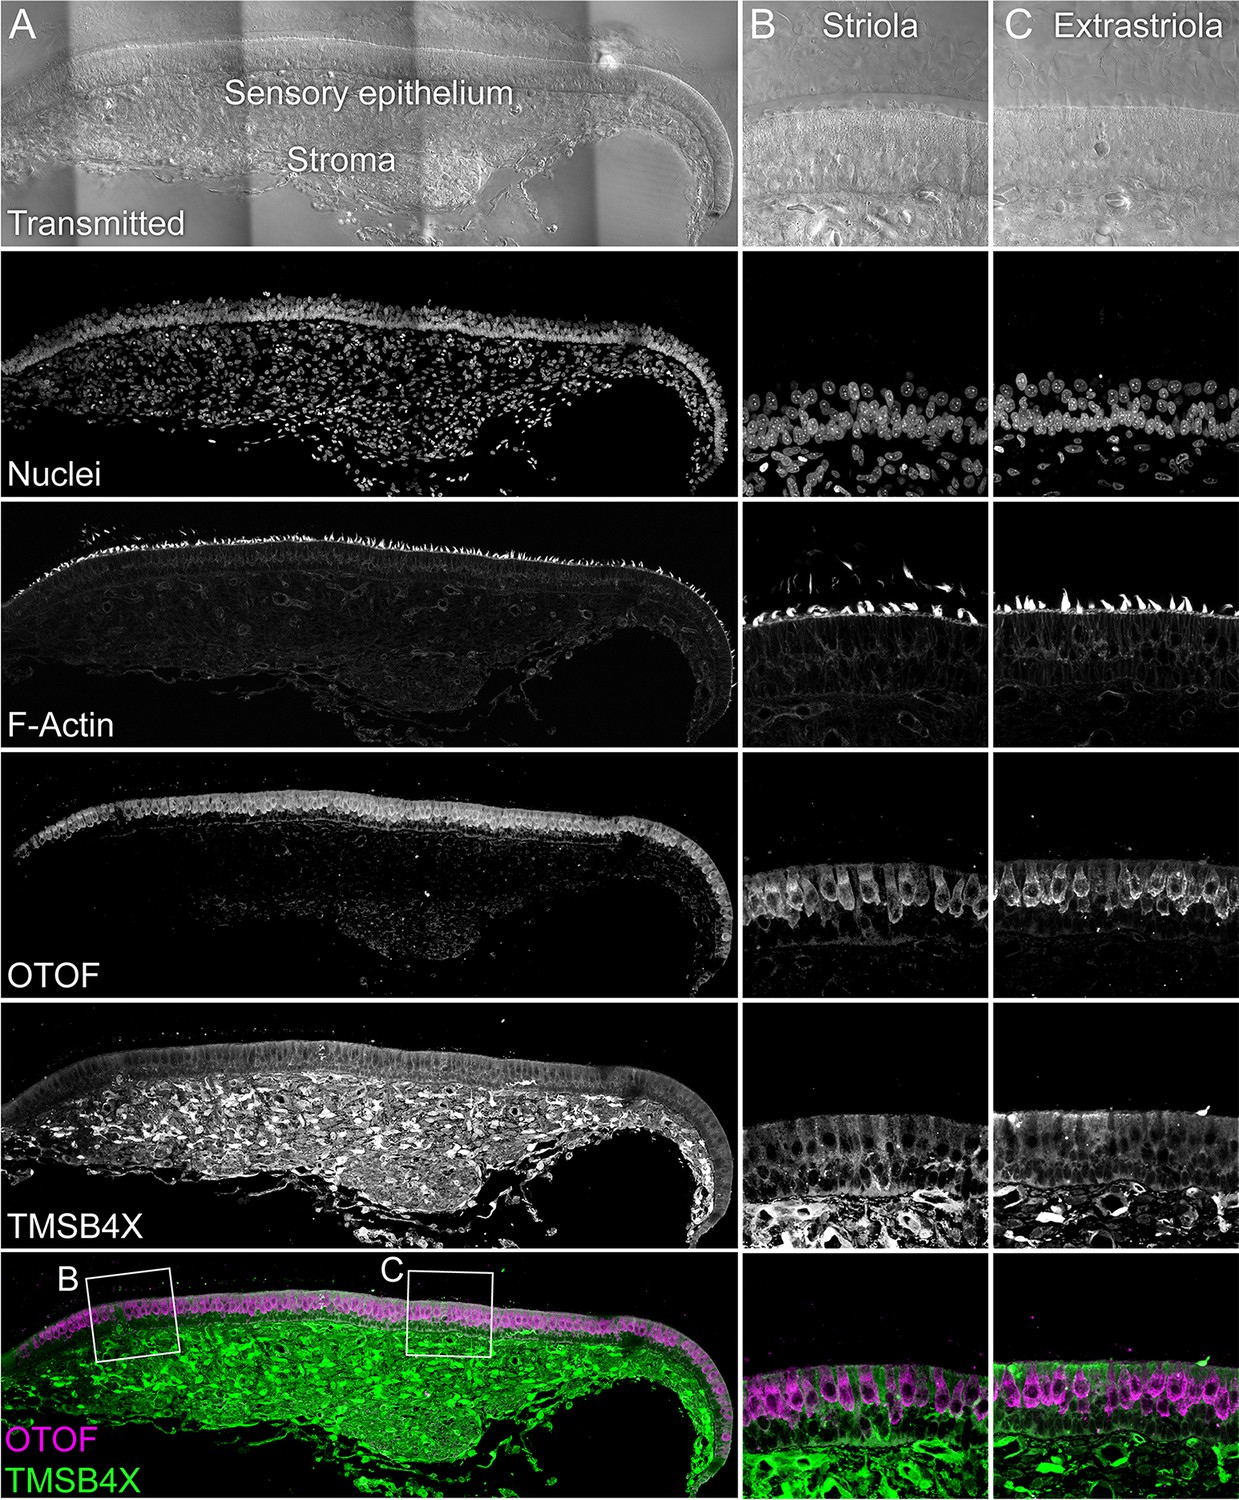
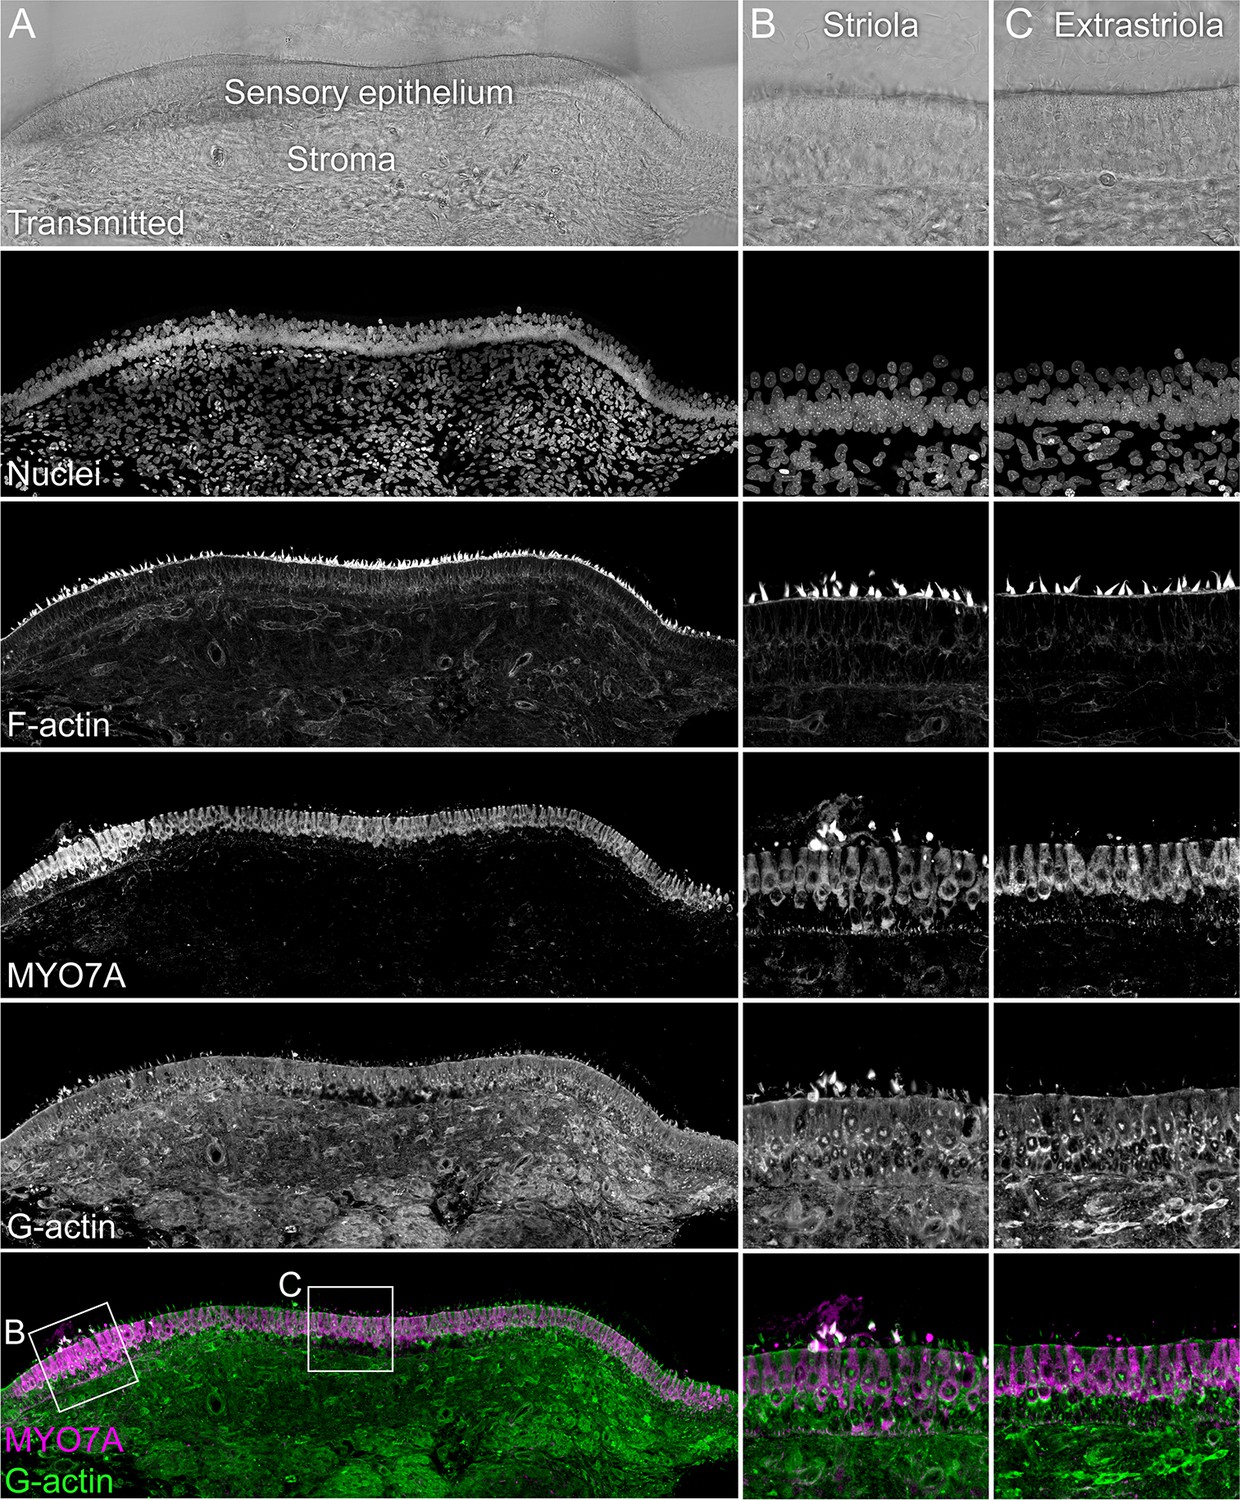
TMSB4X localization.
The sensory epithelium and the stroma are indicated in the transmitted-light section. Nuclei were stained with DAPI and F-actin with phalloidin; OTOF and TMSB4X were stained with specific antibodies. TMSB4X is high in the stroma, at moderate levels in supporting cells, and low in hair cells. Panel full widths: A, 934 µm; B-C, 125 µm.
Figure 3—figure supplement 4
G-actin localization with JLA20 antibody.
The sensory epithelium and the stroma are indicated in the transmitted-light section. Nuclei were stained with DAPI and F-actin with phalloidin; MYO7A and G-actin were stained with specific antibodies. Magnified panels on right show that while both hair cells and supporting cells have JLA20 labeling, supporting-cell labeling is more intense. Panel full widths: A, 839 µm; B-C, 125 µm.
Figure 3—figure supplement 5
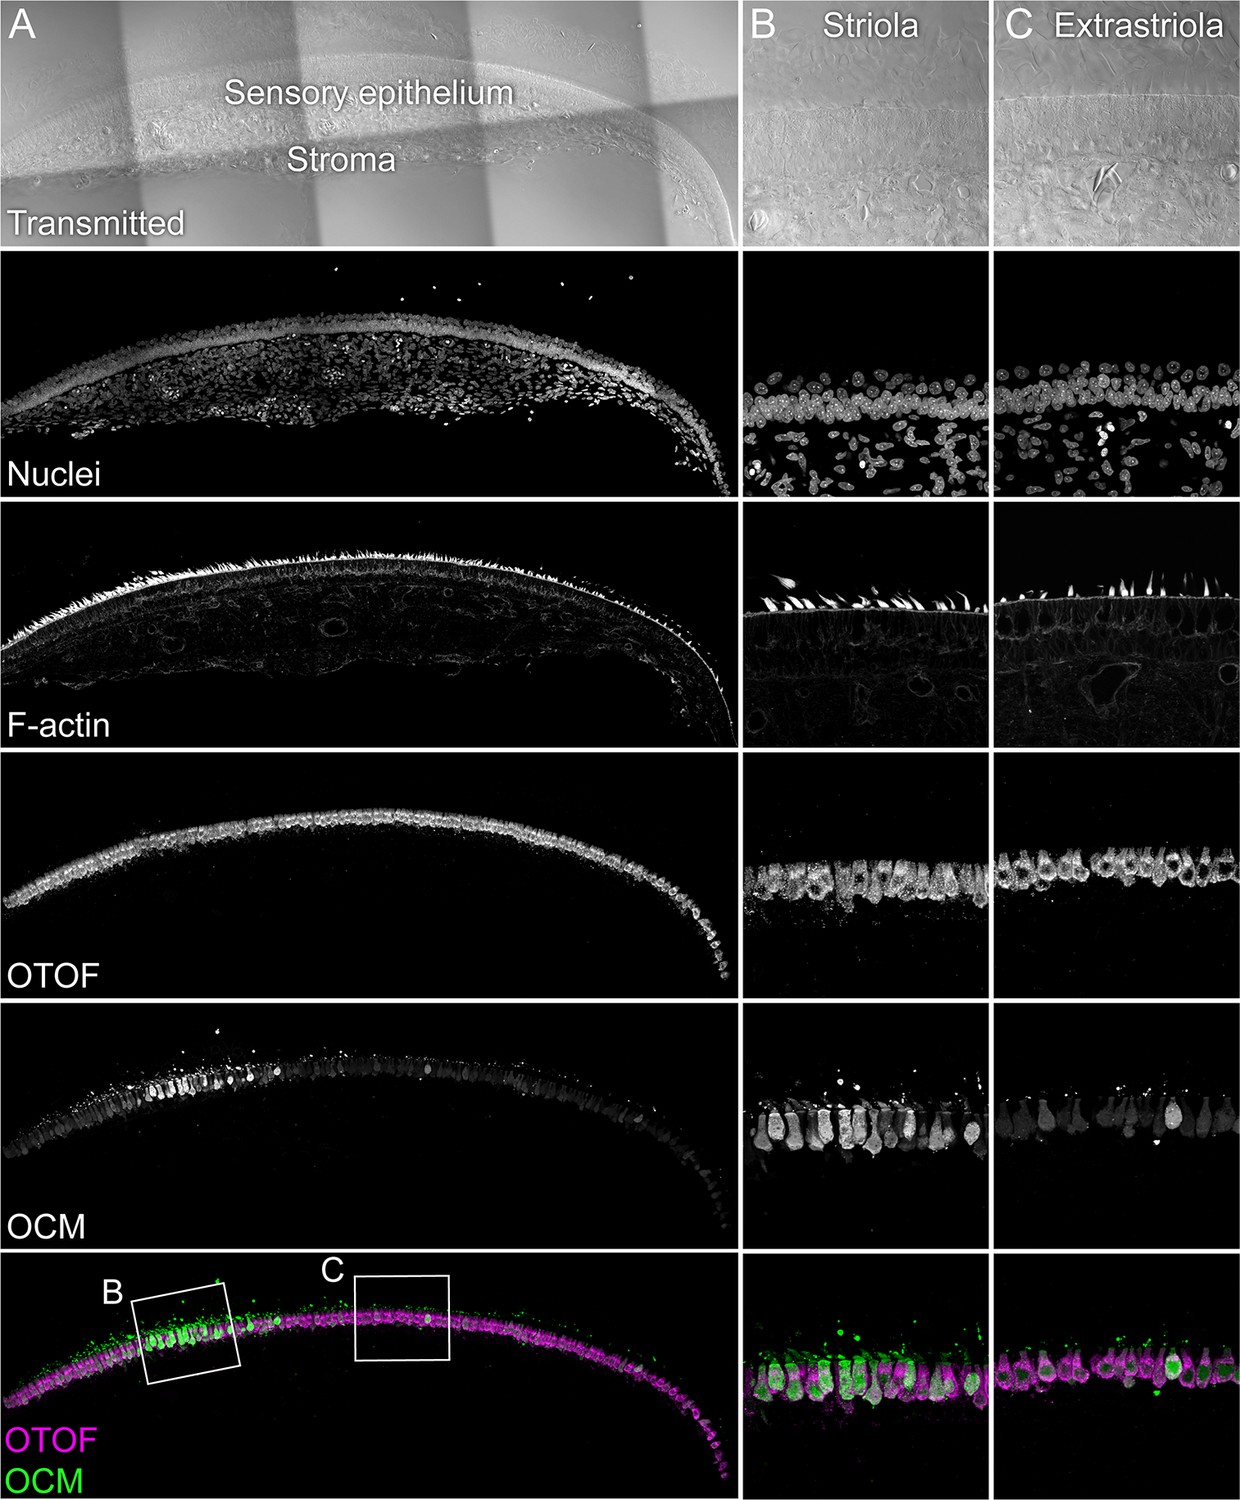
OCM localization with anti-PV3 antibody.
The sensory epithelium and the stroma are indicated in the transmitted-light section. Nuclei were stained with DAPI and F-actin with phalloidin; OTOF and OCM were stained with specific antibodies. Magnified panels on right show that OCM labeling is stronger in the striola than the extrastriola, but that occasional extrastriola cells label strongly. Panel full widths: A, 946 µm; B-C, 125 µm.
Figure 3—figure supplement 6
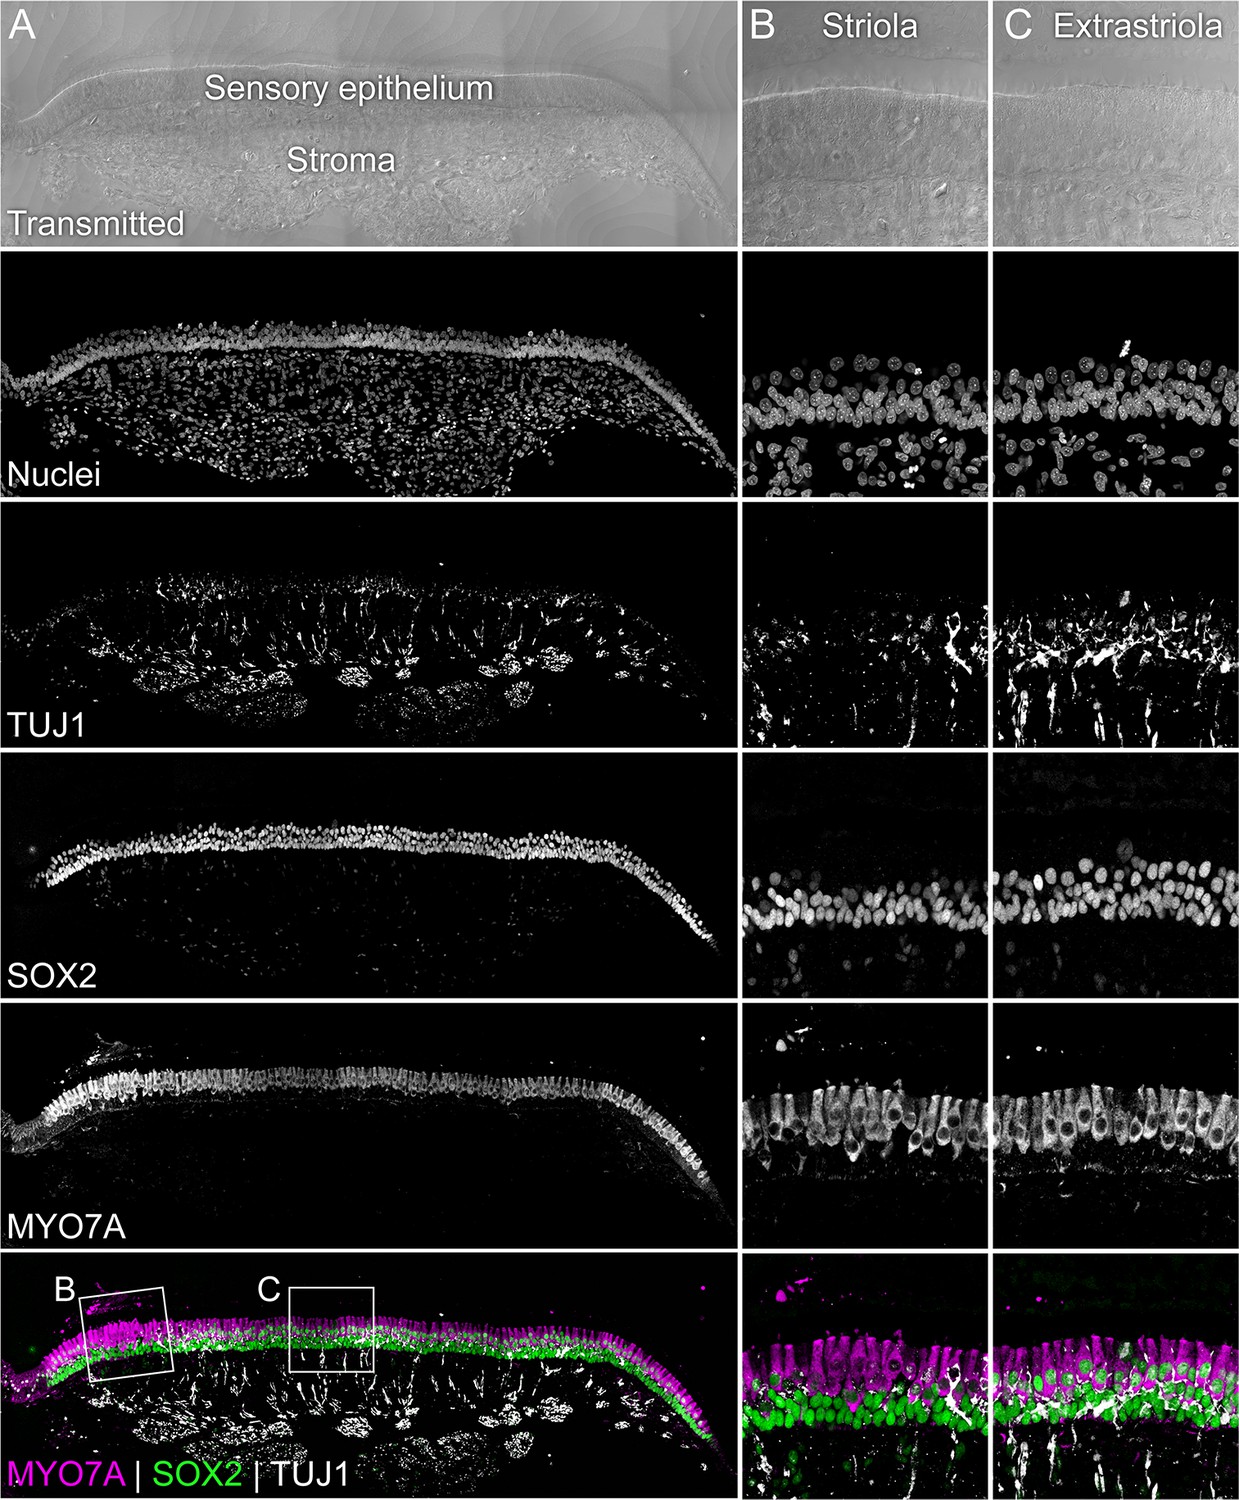
Identification of striola and extrastriola regions.
The sensory epithelium and the stroma are indicated in the transmitted-light section. Nuclei were stained with DAPI and F-actin with phalloidin; SOX2, MYO7A and tubulin beta-3 (TUJ1) were stained with specific antibodies. The striolar region harbors maturing/mature type I hair cells (MYO7A+/SOX2-) with calyx type terminals (TUJ1+). Extrastriolar regions and the striola harbor type II hair cells (MYO7A+/SOX2+), which are innervated by boutons (TUJ1+). Panel full widths: A, 982 µm; B-C, 125 µm.
Figure 4
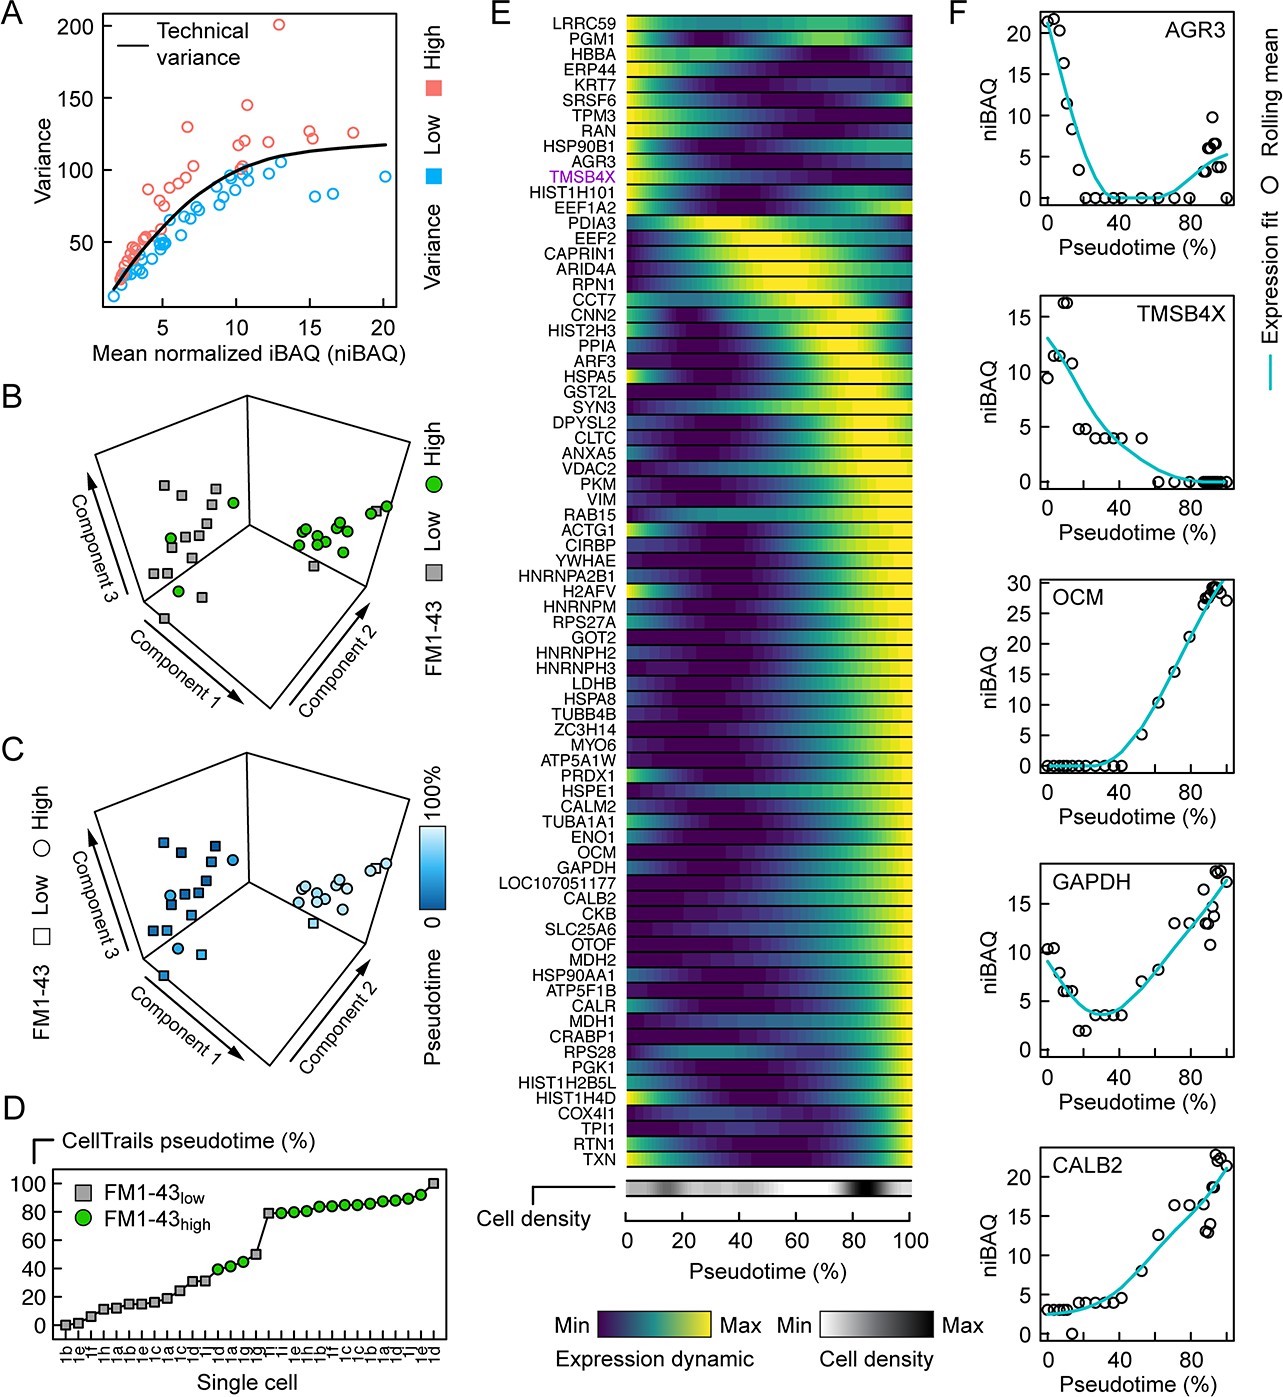
Pseudotemporal ordering of single utricle cells based on proteomics measurements.
(A) Relationship between variance and mean expression, distinguishes proteins or protein groups with low variance (blue) or high variance (salmon). (B) First three components of CellTrails' spectral embedding, with FM1-43low (square, gray) and FM1-43high (circle, green) cells indicated. (C) First three components of CellTrails' spectral embedding with cells colorized by the inferred pseudotime. (D) Chronological ordering of single cells as a function of pseudotime shows that cell ordering correlates with the FM1-43 uptake gradient. (E) Scaled expression dynamics over pseudotime for all analyzed proteins or protein groups. A cubic smoothing spline with four degrees of freedom was fit on the rolling mean for each protein. Cell density bar underneath the heat map shows the density of cells along the pseudotime axis. Heat map and cell density scale is shown below. (F) Absolute expression dynamics of log2 niBAQ expression levels as a function of pseudotime for various proteins. Blue line is expression fit; circle is the rolling mean for each protein.
Figure 5
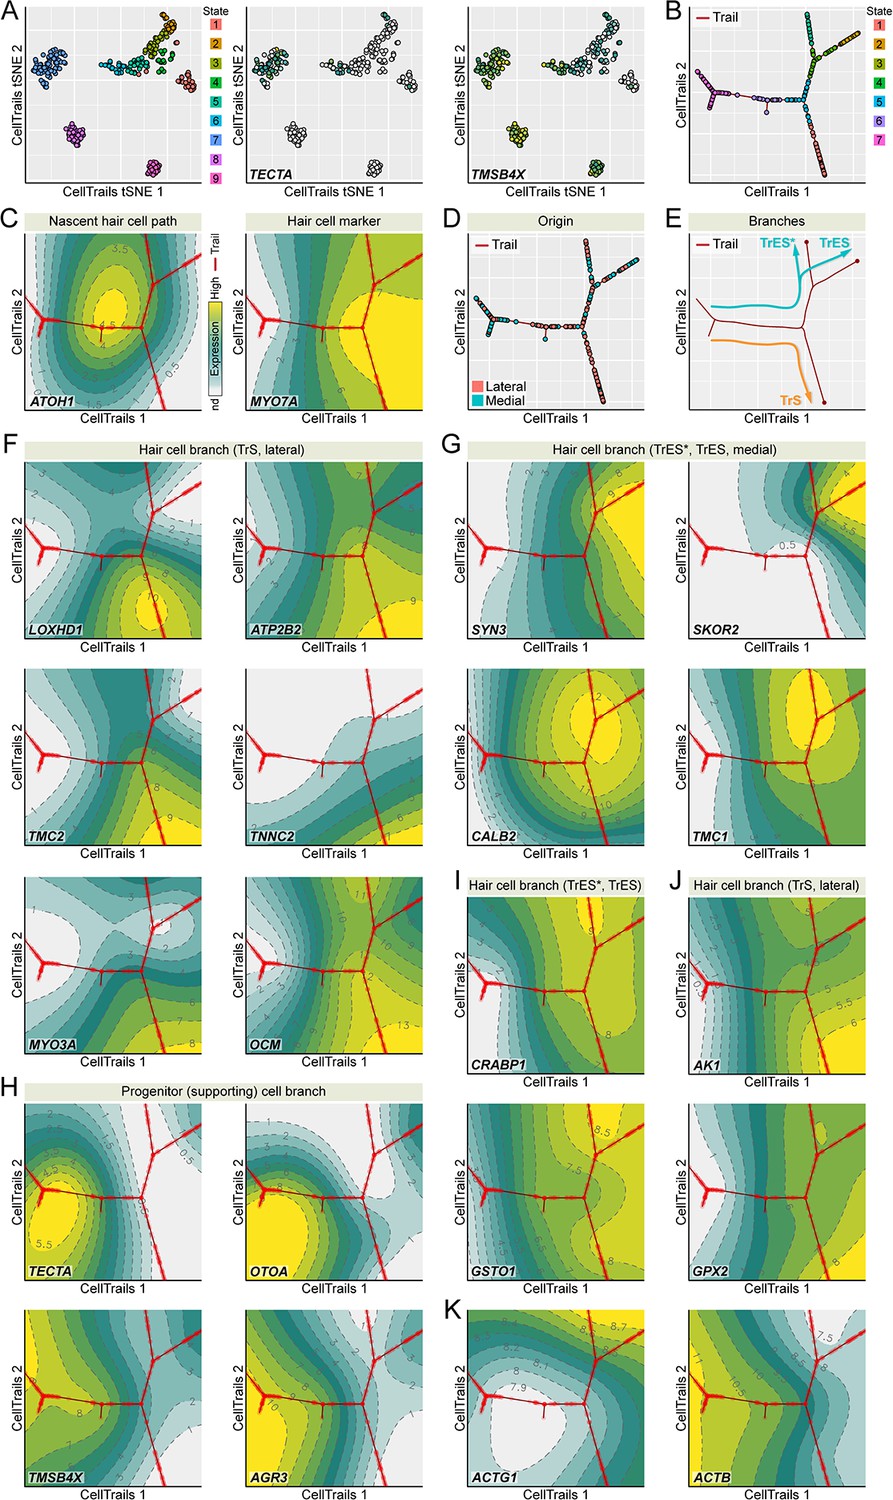
Developmental trajectory identified from single utricle cell RNA-seq measurements.
(A) CellTrails identifies nine distinct states (cellular subgroups). Shown are 328 points representing single utricle cells projected into two-dimensional space using CellTrails t-distributed stochastic neighbor embedding (tSNE). Cells are colored by state affiliation. Two states (S8-9) were classified as stromal cells and excluded from this study based on the lack of TECTA expression and the high levels of TMSB4X expression. (B) CellTrails trail map of 254 single chicken utricle cells reveals a bifurcating trajectory. (C) ATOH1 peaks before the main bifurcation of the right major branches. CellTrails map shows that MYO7A-expressing hair cells are located downstream of the ATOH1 peak on the right half of the trajectory map. (D) Projection of medial and lateral cell origin metadata into the trail map. Cells from the lateral side accumulate along the lower-right trajectory whereas cells from both halves are located along the upper-right trajectory. (E) Predicted developmental extrastriolar (TrES*, TrES), and striolar (TrS) hair cell trajectories. (F) LOXHD1, ATP2B2, TMC2, TNNC2, MYO3A, and OCM expression levels are associated with the lower-right lateral striolar (TrS) branch. (G) CellTrails maps showing high expression of SYN3, SKOR2, CALB2, and TMC1 along the upper-left medial extrastriolar (TrES*, TrES) branch. (H) Expression of supporting cell marker genes TECTA, OTOA, TMSB4X and AGR3 defines the location of the progenitor (supporting) cell population along the left major branch. (I) Expression of CRABP1 and GSTO is associated with the extrastriolar trajectory* (TrES*, see also Figure 3G, high CRABP1 expression extrastriolar hair cells). (J) AK1 and GPX2 are enriched in the striolar trajectory (TrS). (K) ACTB expression decreases and ACTG1 expression increases while hair cells develop.
-
Figure 5—source data 1
CellTrails analysis of single-cell RNA-seq data.
Excel file including: Tab S1A: Single-cell RNA-seq measurements. Count matrix after QC and Normalization (ScNorm) of 186 genes and 328 chicken utricle single cells. Rows display single cells and columns display genes. Non-detected signals were set to 0. Tab S1B: tSNE plots and CellTrails maps. Listed are tSNE plots and CellTrails maps for each gene. The first column lists the gene symbol names, the second column shows the tSNE plots, the third column shows the CellTrails maps with the raw expression values, the fourth column shows the CellTrails maps with smoothed expression values, and the fifth column shows the CellTrails maps with the topographical expression surface. Tab S1C: Inferred expression dynamics. Shown is individual pseudotime gene expression along the extrastriolar (TrES, TrES*) and striolar (TrS) trajectory.
- https://doi.org/10.7554/eLife.50777.020
Tables
Table 1
Summary statistics with confidence intervals for Figure 2C.
https://doi.org/10.7554/eLife.50777.017| 95% Confidence interval | |||||||
|---|---|---|---|---|---|---|---|
| Comparison | Estimate | Std. error | df | t-value | Lower bound | Upper bound | p-value |
| ACTG1 FM-high – ACTG1 FM-low | −0.017 | 0.009 | 22.3 | −1.830 | −0.036 | 0.002 | 0.081 |
| ACTG1 FM-high – TMSB4X FM-high | 0.036 | 0.008 | 12.0 | 4.607 | 0.019 | 0.054 | 0.001 |
| ACTG1 FM-low - TMSB4X FM-low | 0.004 | 0.008 | 12.0 | 0.451 | −0.014 | 0.021 | 0.66 |
| TMSB4X FM-low - TMSB4X FM-low | −0.050 | 0.009 | 22.3 | −5.356 | −0.069 | −0.031 | <0.001 |
Key resources table
| Reagent type (species) or resource | Designation | Source or reference | Identifiers | Additional information |
|---|---|---|---|---|
| Biological sample (Gallus gallus) | Embryonic day 15 utricle | eggs from Texas A and M University Poultry Science Department | n/a | Freshly isolated from Gallus gallus |
| Chemical compound, drug | FM1-43FX | Thermo Fisher | Cat# F35355 | 10 µM |
| Chemical compound, drug | SYTOX Red Dead Cell Stain | Thermo Fisher | Cat# S34859 | 1:1000 (final 5 nM) |
| Chemical compound, drug | thermolysin from geobacillus stearothermophilus | Sigma-Aldrich | Cat# T7902 | 0.5 mg/ml |
| Chemical compound, drug | Accutase | Innovative Cell Technologies | Cat# AT104 | full strength |
| Chemical compound, drug | n-dodecyl β-D-maltoside | Sigma-Aldrich | Cat# D4641 | 0.1% (w/v) |
| Chemical compound, drug | trypsin | Promega | Cat# V5280 | 10 ng/µl |
| Chemical compound, drug | Lys-C | Promega | Cat# V1671 | 10 ng/µl |
| Chemical compound, drug | DAPI | Thermo Fisher | Cat# D1306 | 1 µg/ml |
| Chemical compound, drug | Alexa Fluor 488-conjugated phalloidin | Thermo Fisher | Cat# A12379 | 1:1000 |
| Antibody | rabbit polyclonal anti-TMSB4X | Proteintech | Cat# 19850–1-AP, RRID: AB_10642437 | 1:250 |
| Antibody | rabbit polyclonal anti-AGR3 | Proteintech | Cat# 11967–1-AP, RRID: n/a | 1:250 |
| Antibody | rabbit polyclonal anti-CRABP1 | Proteintech | Cat# 12588–1-AP, RRID: AB_2292271 | 1:250 |
| Antibody | mouse monoclonal anti-G-actin | Developmental Studies Hybridoma Bank | Cat# JLA20, RRID: AB_528068 | 1:250 |
| Antibody | mouse monoclonal anti-otoferlin | Developmental Studies Hybridoma Bank | Cat# HCS-1, RRID: AB_10804296 | 1:250 |
| Antibody | goat polyclonal anti-SOX2 | Santa Cruz Biotechnology | Cat# sc-17320, RRID: AB_2286684 | 1:100 |
| Antibody | mouse monoclonal anti-tubulin beta-3 | BioLegend | Cat# TUJ1, RRID: AB_2313773 | 1:250 |
| Antibody | rabbit polyclonal anti-parvalbumin-3/oncomodulin | Heller laboratory | n/a | 1:1000 |
| Antibody | rabbit polyclonal anti-MYO7A | Proteus Biosciences | Cat# 25–6790, RRID: AB_2314838 | 1:1000 |
| Antibody | Alexa Fluor 546 donkey anti-rabbit polyclonal | Thermo Fisher | Cat# A10040, RRID: AB_2534016 | 1:250 |
| Antibody | Alexa Fluor 647 donkey anti-mouse polyclonal | Thermo Fisher | Cat# A31571, RRID: AB_162542 | 1:100 |
| Antibody | Alexa Fluor 488 donkey anti-goat polyclonal | Thermo Fisher | Cat# A11055, RRID: AB_2534102 | 1:250 |
| Commercial assay or kit | SMARTscribe | Clontech | Cat# 639538 | |
| Commercial assay or kit | Hifi HotStart ReadyMix (2X) | Kapa Biosystems | Cat# KK2602 | |
| Software, algorithm | MaxQuant | Cox lab, Max Planck Institute of Biochemistry | https://www.maxquant.org | |
| Software, algorithm | FIJI (ImageJ) | n/a | http://fiji.sc/ | |
| Software, algorithm | R | The R Project for Statistical Computing | https://www.r-project.org/ | |
| Software, algorithm | limma R package | Bioconductor | DOI: 10.18129/B9.bioc.limma | |
| Software, algorithm | sva R package | Bioconductor | DOI: 10.18129/B9.bioc.sva | |
| Software, algorithm | CellTrails R package | Bioconductor | DOI: 10.18129/B9.bioc.CellTrails | |
| Other | Medium 199 | Thermo Fisher | Cat# 12350039 | |
| Other | SPHERO Drop Delay Calibration Particles | Spherotech | Cat# DDCP-70–2 | |
| Other | nanoPOTS chips | Custom built | n/a |
Table 2
Antibodies used.
https://doi.org/10.7554/eLife.50777.021| Antibody | Dilution | Supplier | Catalog # | Validation |
|---|---|---|---|---|
| rabbit anti-TMSB4X | 1:250 | Proteintech | 19850–1-AP | (Zhou et al., 2013; Li et al., 2018) |
| rabbit anti-AGR3 1:250 | 1:250 | Proteintech | 11967–1-AP | From manufacturer’s website: correct-sized band by protein immunoblot in SKOV-3 cells, MCF-7 cells (chicken protein 88% identical to mouse) |
| rabbit anti-CRABP1 1:250 | 1:250 | Proteintech | 12588–1-AP | From manufacturer’s website: correct-sized band by protein immunoblot in human spleen tissue, transfected HEK-293 cells (chicken protein 95% identical to human) |
| mouse anti-G-actin 1:250 | 1:250 | Developmental Studies Hybridoma Bank | JLA20 | (Lin, 1981) |
| mouse anti-otoferlin 1:250 | 1:250 | Developmental Studies Hybridoma Bank | HCS-1 | (Goodyear et al., 2010) (chicken protein 73% identical to mouse) |
| goat anti-SOX2 1:100 | 1:100 | Santa Cruz Biotechnology | sc-17320 | From manufacturer’s website: ‘recommended for detection of Sox-2 of mouse, rat, human and avian origin by WB, IP, IF, IHC(P) and ELISA’ |
| mouse anti-tubulin beta-3 TUJ1. 1:250 | 1:250 | BioLegend | 801202 | (Lee et al., 1990) |
| rabbit anti-parvalbumin3/oncomodulin | 1:1000 | Heller lab | 16910 | (Heller et al., 2002) |
| rabbit anti-MYO7A | 1:1000 | Proteus Biosciences | 25–6790 | (Morgan et al., 2016) |
Table 3
Genes included in scRNA-seq CellTrails analysis.
https://doi.org/10.7554/eLife.50777.022| ABCA5 | (WHRN) | (NSG2) | PLSCR5 | TMSB4X |
|---|---|---|---|---|
| ACO1 | DFNB59 | LOC423919 | PNPT1 | TNNC2 |
| ACTB | (PJVK) | (SHTN1) | PODXL2 | TOLLIP |
| ACTG1 | DIAPH1 | LOC772075 | POU4F3 | TPM1 |
| ACTN1 | DNM1 | (XIRP2) | PPP1R14D | TPM3 |
| ADGRV1 | DPF3 | LOXHD1 | PRPS1 | TPRN |
| AGR3 | DRGX | MAP1A | PTPRQ | TRIOBP |
| AK1 | EFCAB6 | MAPK10 | PTPRT | TTLL12 |
| AKAP5 | EFR3A | MCOLN3 | PTPRZ1 | TUBA3E |
| ANKRD24 | ELMOD1 | MPRIP | RAB26 | TUBAL3 |
| APPL2 | EML1 | MSN | RDX | TUBB2B |
| ARF1 | EPS8L2 | MSRB3 | RFX8 | TUBB6 |
| ARF4 | ESPN | MYH9 | RPS6KA2 | TWF2 |
| ARHGAP17 | ESPNL | MYO15A | RPS6KA5 | USH1C |
| ARMC4 | EZR | MYO1C | RSPH1 | USH1G |
| ATOH1 | FOXJ1 | MYO1H | RSPH9 | USH2A |
| ATP2B1 | FSCN1 | MYO3A | SCG3 | |
| ATP2B2 | FSCN2 | MYO3B | SERPINB6 | |
| ATP2B4 | GALNT9 | MYO6 | SGCB | |
| ATP6V1B2 | GAPDH | MYO7A | SGCG | |
| ATP6V1E1 | GDI2 | NFATC1 | SGIP1 | |
| ATP8B1 | GNAI1 | NMNAT2 | SH3GLB2 | |
| B3GNTL1 | GNAI2 | NPEPPS | SKOR2 | |
| BAIAP2L2 | GNAI3 | OCM | SLC17A8 | |
| BRSK2 | GNAL | OSBP2 | SLC8A1 | |
| CAB39L | GNAS | OSBPL11 | SLC9A3R2 | |
| CACNA2D2 | GNG4 | OSBPL1A | SMPX | |
| CALB2 | GPSM2 | OTOA | SPAG1 | |
| CAPZA1 | GPX2 | OTOF | SPTAN1 | |
| CAPZA2 | GRXCR1 | PAICS | STARD10 | |
| CAPZB | GRXCR2 | PAK1 | STXBP1 | |
| CCDC50 | GSTO1 | PAK2 | SYN3 | |
| CDH23 | HSF5 | PAK3 | TECTA | |
| CHRNA10 | HYDIN | PCDH15 | TECTB | |
| CHRNA9 | IRX2 | PDCD6IP | TMC1 | |
| CIB2 | KIAA1211L | PDK4 | TMC2 | |
| CKB | (KIAA1211) | PDZD7 | TMC5 | |
| CLIC5 | KIAA1549 | PGM2L1 | TMCC2 | |
| CORO2B | KIF1A | PHF21B | TMEM117 | |
| CRABP1 | KLHDC7A | PI4KA | TMEM255B | |
| CSNK2A1 | LCP1 | PITPNA | TMEM30A | |
| CTH | LHFPL5 | PITPNB | TMIE | |
| CUL1 | LHX3 | PLS1 | TMPRSS3 | |
| DFNB31 | LOC416212 | PLS3 | TMPRSS7 | |
| ABCA5 | (WHRN) | (NSG2) | PLSCR5 | TMSB4X |
| ACO1 | DFNB59 | LOC423919 | PNPT1 | TNNC2 |
| ACTB | (PJVK) | (SHTN1) | PODXL2 | TOLLIP |
| ACTG1 | DIAPH1 | LOC772075 | POU4F3 | TPM1 |
| ACTN1 | DNM1 | (XIRP2) | PPP1R14D | TPM3 |
| ADGRV1 | DPF3 | LOXHD1 | PRPS1 | TPRN |
| AGR3 | DRGX | MAP1A | PTPRQ | TRIOBP |
| AK1 | EFCAB6 | MAPK10 | PTPRT | TTLL12 |
| AKAP5 | EFR3A | MCOLN3 | PTPRZ1 | TUBA3E |
| ANKRD24 | ELMOD1 | MPRIP | RAB26 | TUBAL3 |
| APPL2 | EML1 | MSN | RDX | TUBB2B |
| ARF1 | EPS8L2 | MSRB3 | RFX8 | TUBB6 |
| ARF4 | ESPN | MYH9 | RPS6KA2 | TWF2 |
| ARHGAP17 | ESPNL | MYO15A | RPS6KA5 | USH1C |
| ARMC4 | EZR | MYO1C | RSPH1 | USH1G |
| ATOH1 | FOXJ1 | MYO1H | RSPH9 | USH2A |
| ATP2B1 | FSCN1 | MYO3A | SCG3 | |
| ATP2B2 | FSCN2 | MYO3B | SERPINB6 | |
| ATP2B4 | GALNT9 | MYO6 | SGCB | |
| ATP6V1B2 | GAPDH | MYO7A | SGCG | |
| ATP6V1E1 | GDI2 | NFATC1 | SGIP1 | |
| ATP8B1 | GNAI1 | NMNAT2 | SH3GLB2 | |
| B3GNTL1 | GNAI2 | NPEPPS | SKOR2 | |
| BAIAP2L2 | GNAI3 | OCM | SLC17A8 | |
| BRSK2 | GNAL | OSBP2 | SLC8A1 | |
| CAB39L | GNAS | OSBPL11 | SLC9A3R2 | |
| CACNA2D2 | GNG4 | OSBPL1A | SMPX | |
| CALB2 | GPSM2 | OTOA | SPAG1 | |
| CAPZA1 | GPX2 | OTOF | SPTAN1 | |
| CAPZA2 | GRXCR1 | PAICS | STARD10 | |
| CAPZB | GRXCR2 | PAK1 | STXBP1 | |
| CCDC50 | GSTO1 | PAK2 | SYN3 | |
| CDH23 | HSF5 | PAK3 | TECTA | |
| CHRNA10 | HYDIN | PCDH15 | TECTB | |
| CHRNA9 | IRX2 | PDCD6IP | TMC1 | |
| CIB2 | KIAA1211L | PDK4 | TMC2 | |
| CKB | (KIAA1211) | PDZD7 | TMC5 | |
| CLIC5 | KIAA1549 | PGM2L1 | TMCC2 | |
| CORO2B | KIF1A | PHF21B | TMEM117 | |
| CRABP1 | KLHDC7A | PI4KA | TMEM255B | |
| CSNK2A1 | LCP1 | PITPNA | TMEM30A | |
| CTH | LHFPL5 | PITPNB | TMIE | |
| CUL1 | LHX3 | PLS1 | TMPRSS3 | |
| DFNB31 | LOC416212 | PLS3 | TMPRSS7 |
Additional files
-
Reporting standard 1
Reporting guidelines for mass spectrometry.
- https://doi.org/10.7554/eLife.50777.023
-
Transparent reporting form
- https://doi.org/10.7554/eLife.50777.024
Download links
A two-part list of links to download the article, or parts of the article, in various formats.
Downloads (link to download the article as PDF)
Open citations (links to open the citations from this article in various online reference manager services)
Cite this article (links to download the citations from this article in formats compatible with various reference manager tools)
Single-cell proteomics reveals changes in expression during hair-cell development
eLife 8:e50777.
https://doi.org/10.7554/eLife.50777


