Cell-type-specific regulation of neuronal intrinsic excitability by macroautophagy
- Columbia University Vagelos College of Physicians and Surgeons, United States
- Karolinska Institute, Sweden
- New York State Psychiatric Institute, United States
Figures
Figure 1
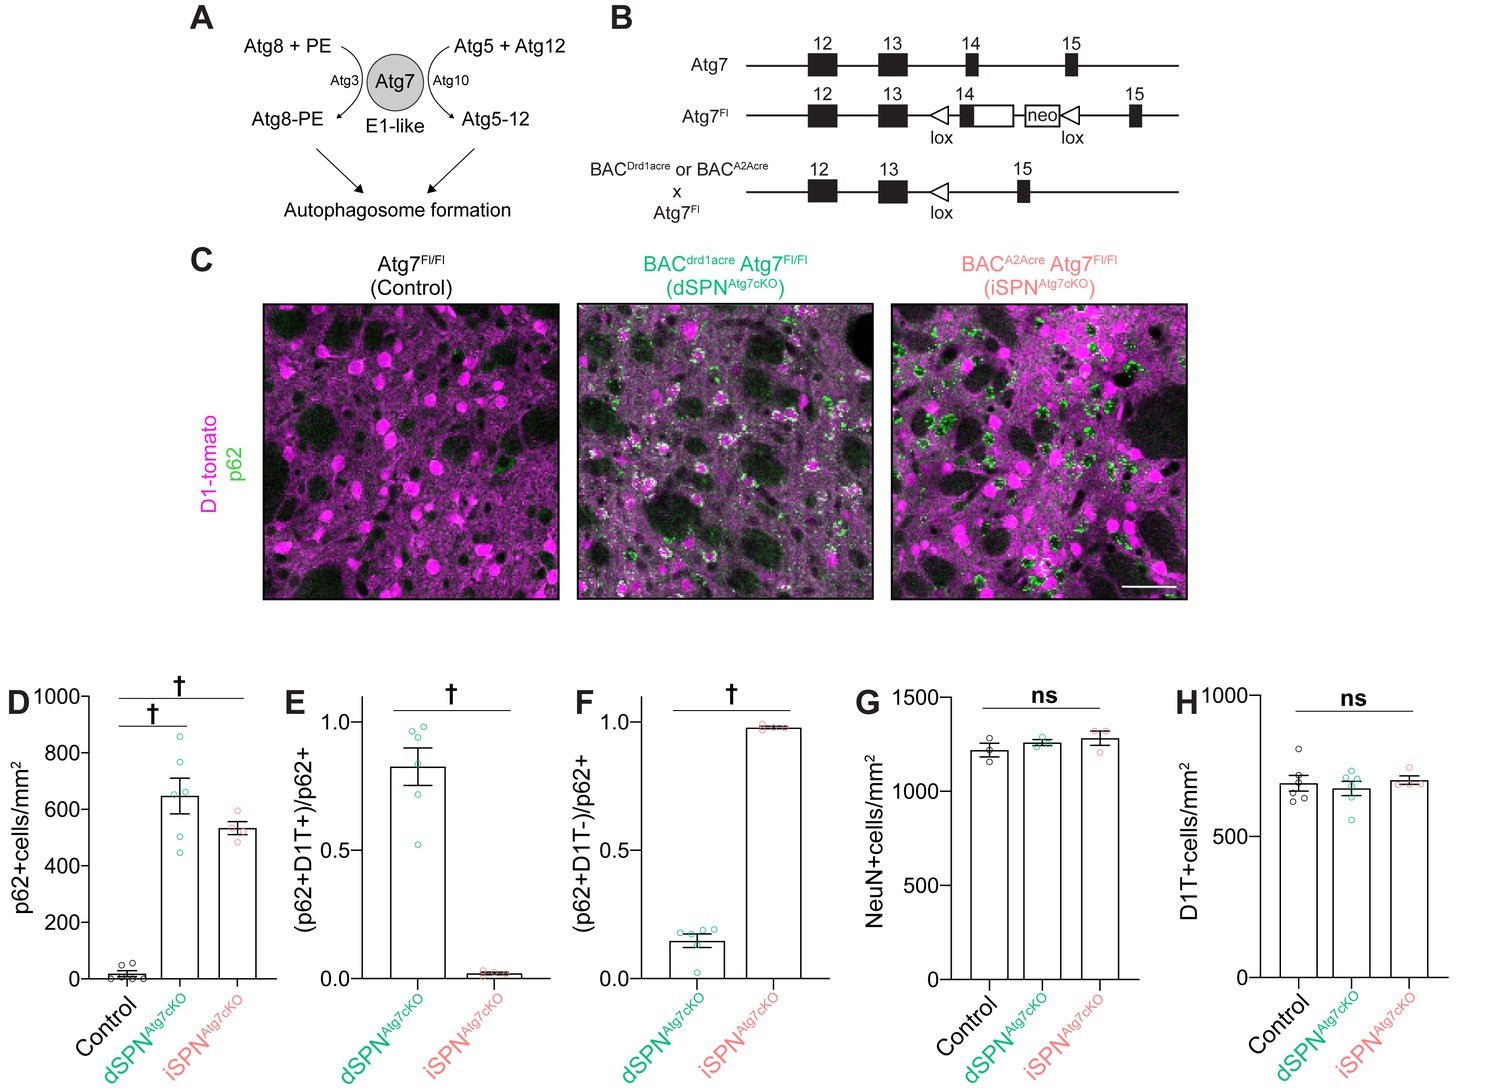
Specific loss of Atg7-mediated autophagy in dSPNs or iSPNs in the absence of neurodegeneration in dSPNAtg7cKO mice and iSPNAtg7cKO, respectively.
(A) Schematic representation of the role of Atg3, 5, 7, 8, 10, and Atg12 in a cascade leading to autophagosome formation. (B) Schematic of Atg7 locus in Atg7Fl/Fl mice and following Cre-mediated recombination. (Adapted from Komatsu et al., 2006). (C) Immunofluorescent images of striatal sections from Atg7Fl/Fl (Control), D1-cre Atg7Fl/Fl (dSPNAtg7cKO) or A2Acre-Atg7Fl/Fl (iSPNAtg7cKO) mice. (D) p62+ cells per field in control, dSPNAtg7cKO or iSPNAtg7cKO mice. Control: N=6 mice, dSPNAtg7cKO: N = 6 mice, iSPNAtg7cKO: N=4 mice. Data analyzed by one-way ANOVA, F(2,13)=65.73, p = 0.001. (E-F) Number of (E) D1-tomato+ or (F) D1-Tomato-, p62+ cells in dSPNAtg7cKO and iSPNAtg7cKO mice. N = 6 dSPNAtg7cKO mice and N=4 iSPNAtg7cKO mice. Data in (E-F) were analyzed by two-tailed unpaired t test. (E) t8=8.816, p = 0.0001. (F) t8=24.94, p = 0.0001. (G-H) There were no differences in NeuN+ [Control: N = 3 mice, dSPNAtg7cKO: N = 3 mice, iSPNAtg7cKO: N = 3 mice; analyzed by one-way ANOVA F(2,6) = 1.019, p = 0.4160] or D1-tomato+ cells per field [Control: N=6 mice, dSPNAtg7cKO: N = 6 mice, iSPNAtg7cKO: N=4 mice; analyzed by one-way ANOVA F(2,13) = 0.3144, p = 0.7356]. ns p>0.05, * p<0.05, ** p<0.01, *** p<0.001, † p<0.0001.
Figure 2
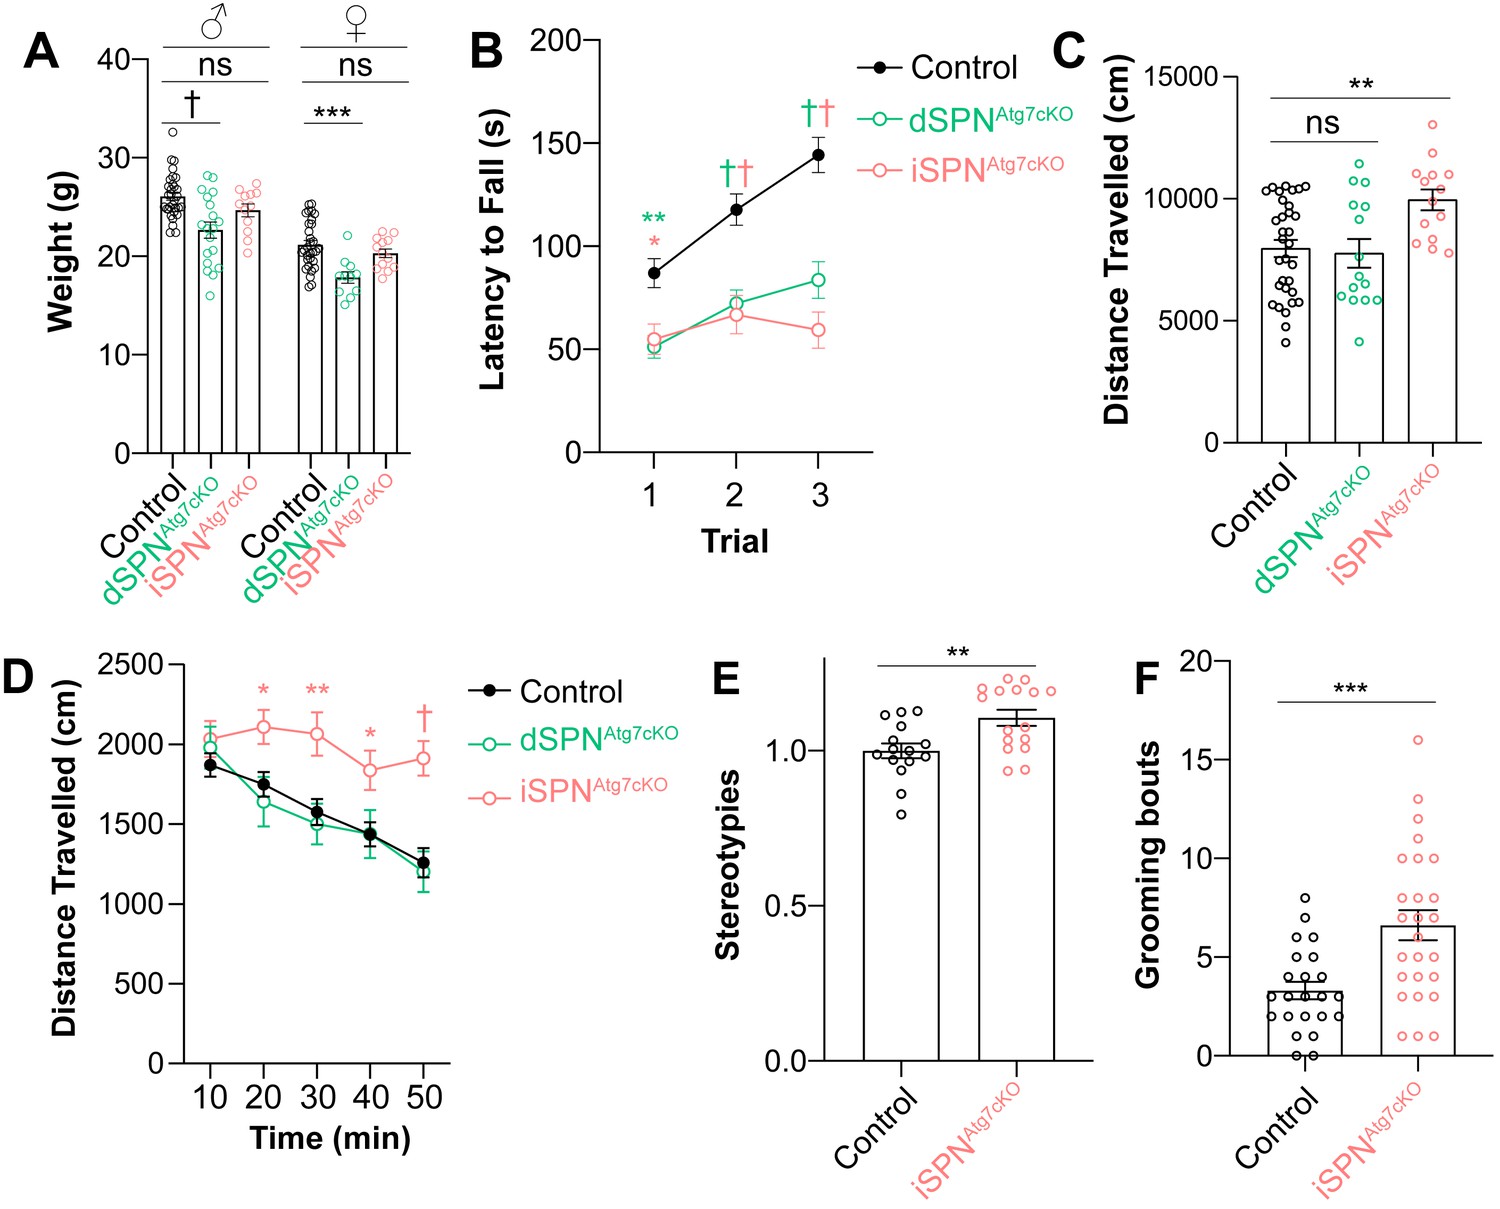
Atg7 in SPNs is required for motor performance and learning.
(A) Nine-week-old male and female dSPNAtg7cKO mice, but not iSPNAtg7cKO mice, weigh less than controls. Data were analyzed by two-way ANOVA followed by Bonferroni post-hoc test. Sex x Genotype: F(2,111) = 0.1073, p = 0.8983; Genotype: F(2,111) = 17.58, p<0.0001; Sex: F(1,111) = 87.65, p<0.0001. (B) Both dSPNAtg7cKO and iSPNAtg7cKO mice have a lower latency to fall off the accelerating rotarod. Control n = 50, dSPNAtg7cKOn = 34, iSPNAtg7cKOn = 23. Data were analyzed by two-way ANOVA followed by Bonferroni post-hoc test. Trial x Genotype: F(4,208) = 6.198, p<0.0001; Trial: F(2,208) = 26.34, p<0.0001; Genotype: F(2,104) = 20.73, p<0.0001. (C) iSPNAtg7cKO mice, but not dSPNAtg7cKO, demonstrate locomotor hyperactivity in the open field arena. One-way ANOVA followed by Bonferroni post-hoc test. (D) Time course of locomotor activity in the open field. Control n = 32, dSPNAtg7cKOn = 15, iSPNAtg7cKOn = 14. Data were analyzed by two-way ANOVA followed by Bonferroni post-hoc test. Time x Genotype: F(8,240) = 2.547, p = 0.0111; Time: F(4,240) = 21.99, p<0.0001; Genotype: F(2,60) = 6.270, p = 0.0034. (E) Automated scoring of stereotypies in the open field. Control: n = 15; iSPNAtg7cKO: n = 16. Data analyzed by two-tailed, unpaired t test. t29 = 2.994, p = 0.0056. (F) Manual scoring of grooming bouts over thirty minutes following habituation during a separate session. Control: n = 23; iSPNAtg7cKO: n = 26. Data analyzed by two tailed, unpaired t test. t47 = 3.623, p = 0.0007. See Table 1 for detailed statistics split by sex. ns p>0.05, *p<0.05, **p<0.01, ***p<0.001, † p<0.0001.
Figure 3
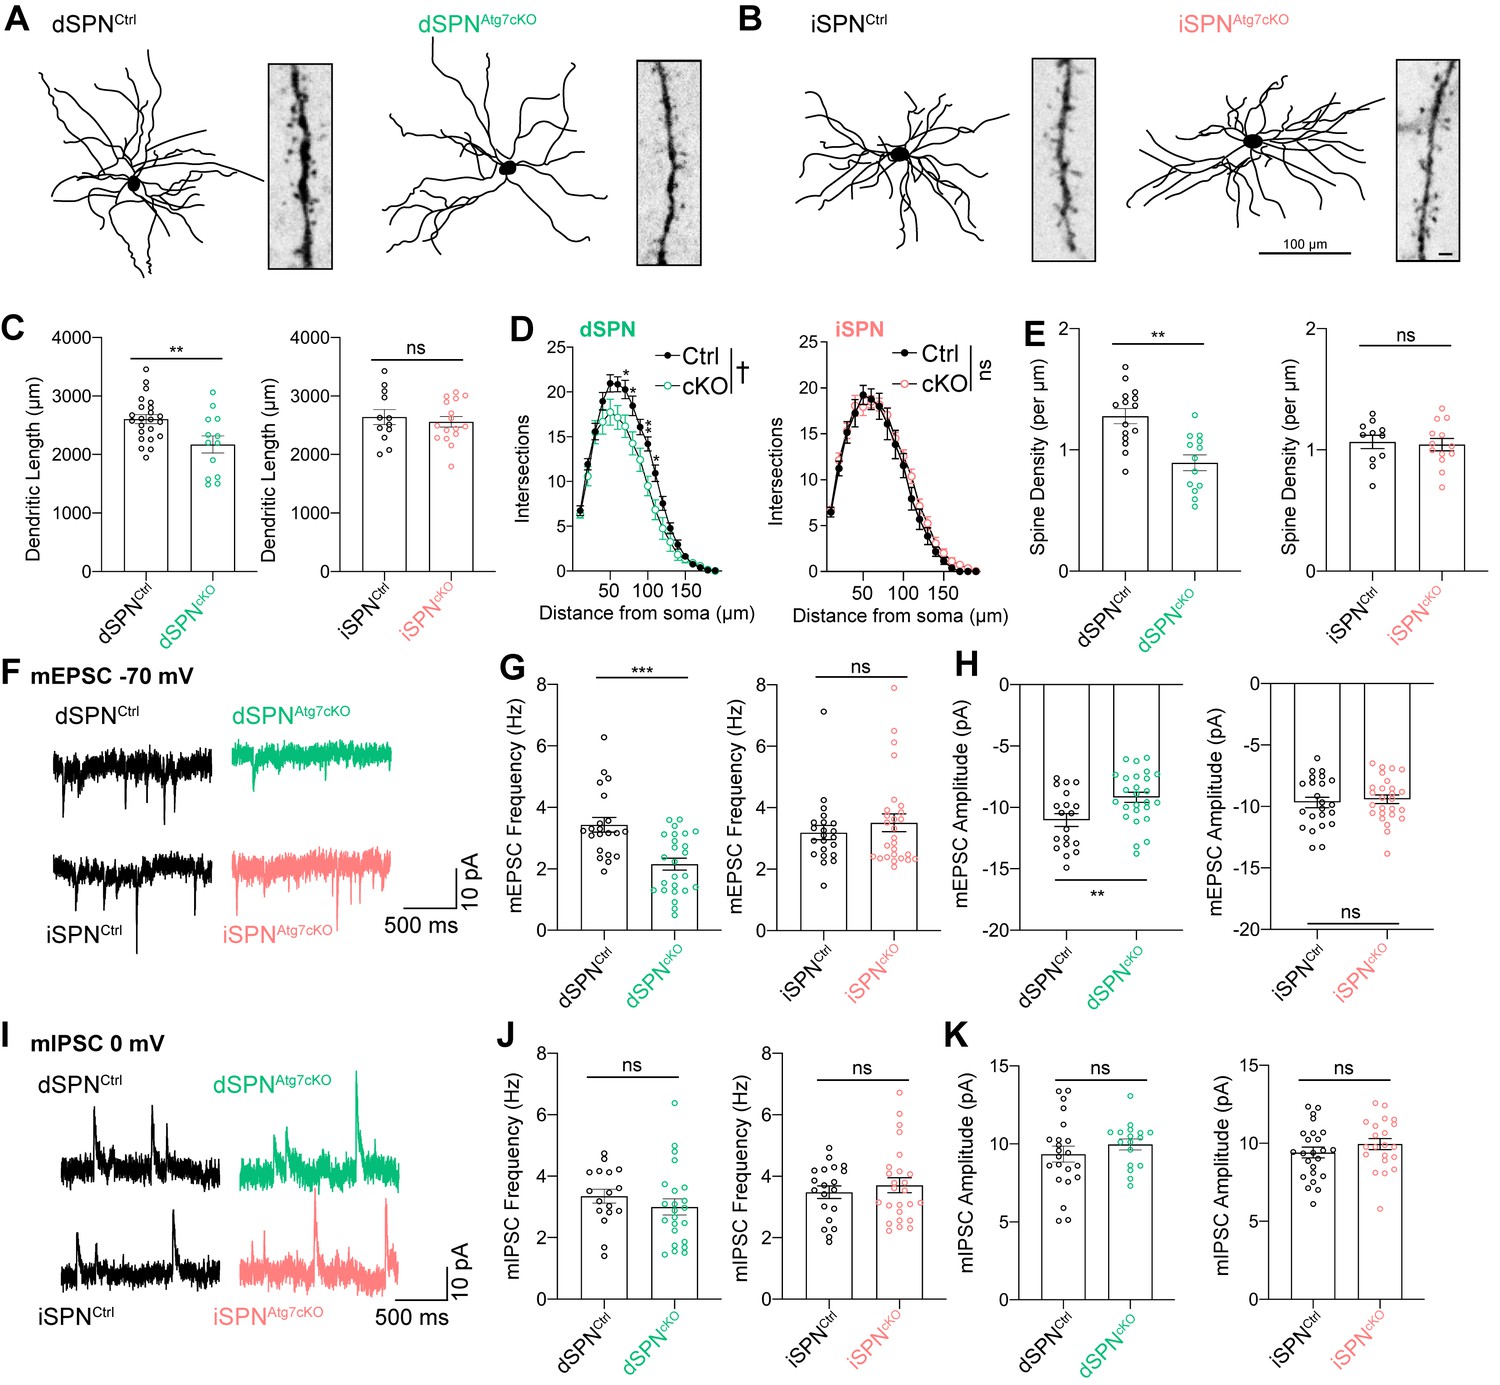
Atg7 contributes to synaptic function and dendritic complexity in dSPNs but not iSPNs.
(A) Sample dendritic trees of dSPNs from control of dSPNAtg7cKO mice. Reconstructions of neurobiotin filled neurons (left) and dendritic segment (right). (B) Sample dendritic trees from reconstructed iSPNs in control or iSPNAtg7cKO mice. Left: reconstructed dendritic tree, scale bar 100 μm. Right: dendritic segment, scale bar 1 μm. (C) Cumulative dendritic length is significantly reduced in dSPNs from dSPNAtg7cKO mice compared to control (left) but not in iSPNs from iSPNAtg7cKO mice compared to control (right). dSPNCtrl: n = 22 cells, five mice, dSPNcKO: n = 12,4. iSPNCtrl: n = 12,3; iSPNcKO: n = 16,3. (D) Sholl analysis reveals a significant reduction in dendritic complexity in dSPNs from dSPNAtg7cKO mice compared to control (left) but not in iSPNs from iSPNAtg7cKO mice compared to control (right). dSPNCtrl: n = 22, 5, dSPNcKO: n = 12,4. iSPNCtrl: n = 13,3; iSPNcKO: n = 16,3. (E) Dendritic spine density on dendritic segments 50–100 µm from the soma. dSPNCtrl: n = 15, 5, dSPNcKO: n = 13,4. iSPNCtrl: n = 8,3; iSPNcKO: n = 8,3. (F) Representative traces of mEPSCs in dSPNs (top) and iSPNs (bottom). (G-H) A significant reduction in (G) mEPSC frequency and (H) mEPSC amplitude in dSPNs from dSPNAtg7cKO mice compared to control but no difference in iSPN mEPSC frequency or amplitude between genotypes. Frequency: dSPNCtrl: n = 21, 5, dSPNcKO: n = 25,4. iSPNCtrl: n = 22,3; iSPNcKO: n = 26,4. Amplitude: dSPNCtrl: n = 19, 5, dSPNcKO: n = 26,4. iSPNCtrl: n = 23,5; iSPNcKO: n = 26,4. (I) Representative traces of mIPSCs in dSPNs (top) and iSPNs (bottom) (J-K) No difference in mIPSC frequency or amplitude after loss of autophagy in either dSPNs or iSPNs. Frequency: dSPNCtrl: n = 17, 5, dSPNcKO: n = 23,4. iSPNCtrl: n = 20,5; iSPNcKO: n = 25,4. Amplitude: dSPNCtrl: n = 17,5, dSPNcKO: n = 22,4. iSPNCtrl: n = 21,5; iSPNcKO: n = 24,4. See Table 2 for detailed statistics. ns p>0.05, *p<0.05, **p<0.01, † p<0.0001.
Figure 4 with 1 supplement
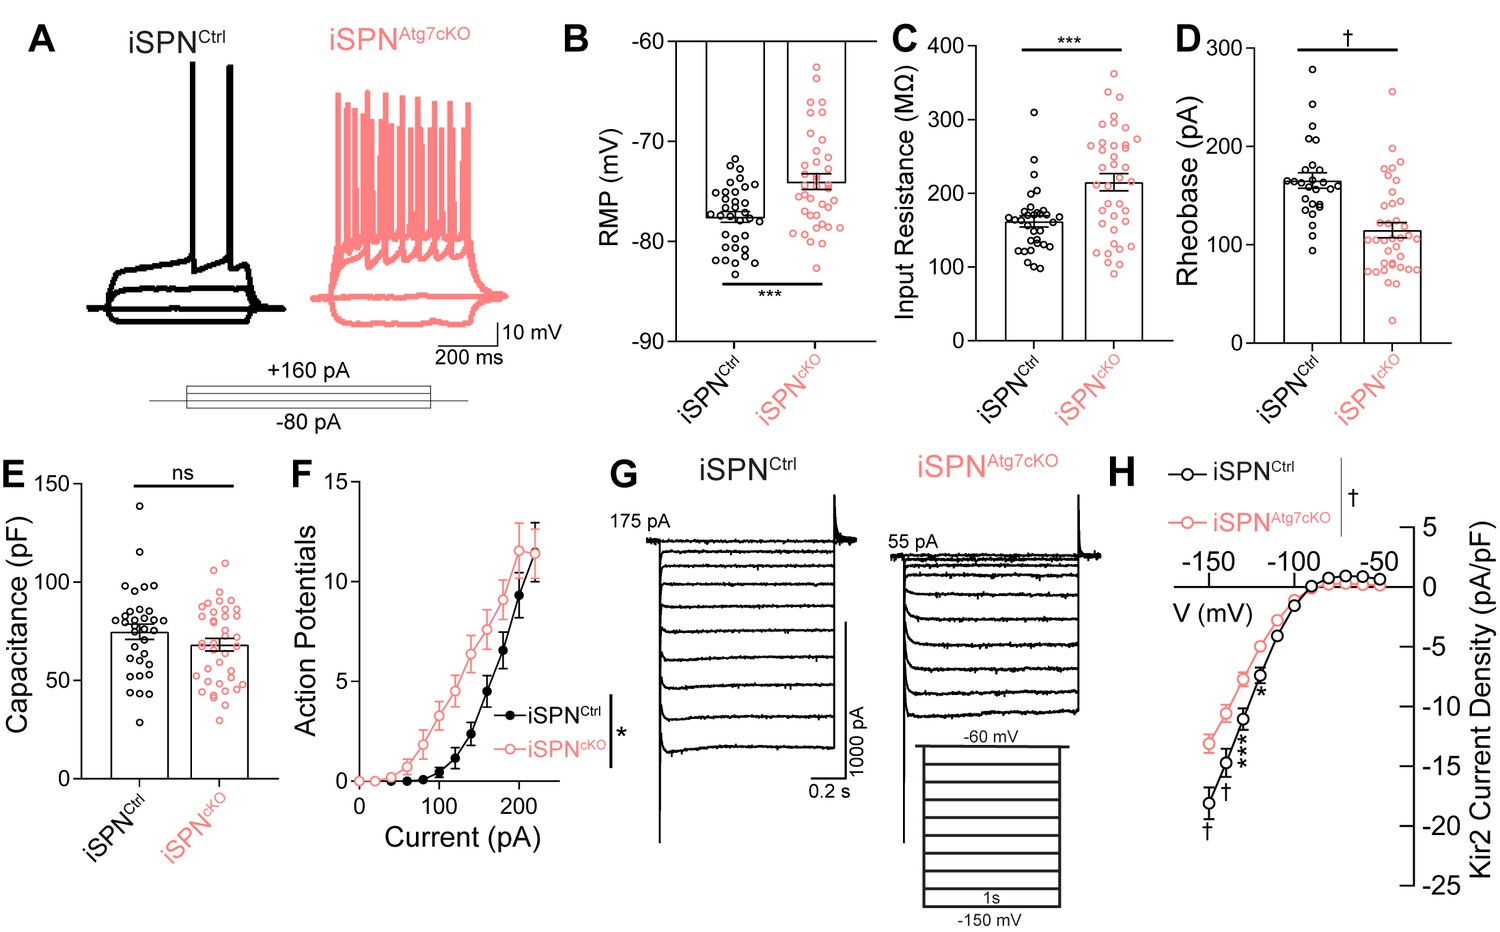
Loss of Atg7 leads to intrinsic hyperexcitability due to reduced Kir2 currents in iSPNs.
(A) Representative current clamp traces in iSPNs from control or iSPNAtg7cKO mice. (B-F) iSPNs lacking Atg7 display (B) depolarized resting membrane potential (t70=3.617, p = 0.0006; iSPNCtrl: n=34 (8), iSPNAtg7cKO: n=38 (9)), (C) elevated input resistance (t68=3.630, p = 0.0005; iSPNCtrl: n=32 (8), iSPNAtg7cKO: n=38 (9)), (D) decreased rheobase (t61=4.456, p<0.0001; iSPNCtrl: n=26 (7), iSPNAtg7cKO: n=37(9)), (E) no change in capacitance (t67 = 0.8096, p = 0.4210; iSPNCtrl: n=33 (8), iSPNAtg7cKO: n=39 (9)) and (F) a left-shifted current-response curve [APs/500 msec (Current x Genotype: F(13,772) = 1.538, p = 0.0983; Current F(13,772)=421.5, p<0.0001; Genotype: F(1,772) = 6.586, p = 0.0141); iSPNCtrl: n=25(7), iSPNAtg7cKO: n=36(8)]. Data in (B-F) analyzed with a two-tailed, unpaired t test. Data in (F) analyzed with two-way repeated measures ANOVA. (G) Representative voltage clamp recordings of Kir2 currents. (H) iSPNs have lower Kir2 current density in iSPNAtg7cKO mice compared to iSPNs in iSPNCtrl mice. iSPNCtrl: n = 17(5), iSPNAtg7cKO: n=25(6). Data analyzed with a two-way repeated measures ANOVA, followed by Bonferooni post-hoc test. Voltage x Genotype: F(10,400) = 13.39, p<0.0001. ns p>0.05, * p<0.05, *** p<0.001, † p<0.0001.
Figure 4—figure supplement 1
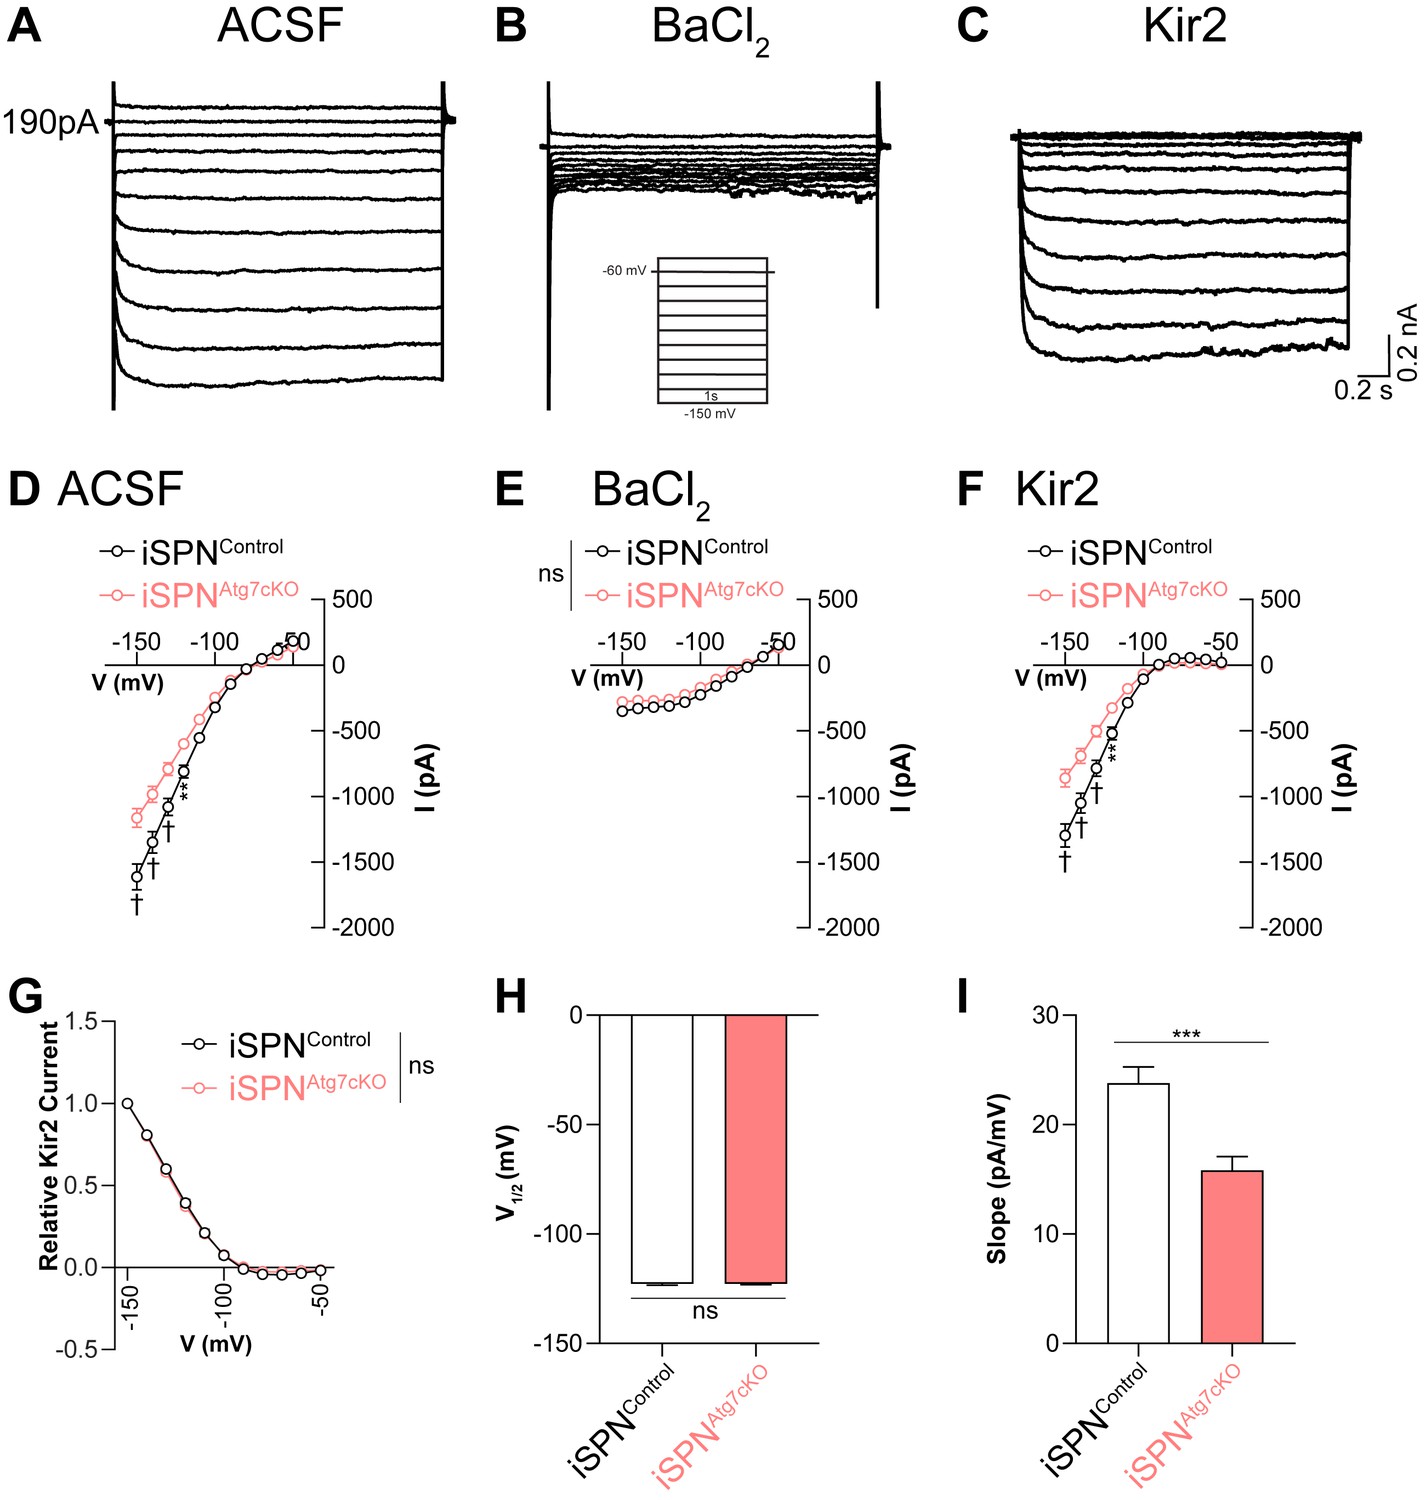
Atg7 is required for maximal Kir2 current but does not affect Kir2 voltage dependence.
(A–C) Representative traces of voltage clamp recordings of iSPNs in (A) ACSF, (B) ACSF + BaCl2, and (C) BaCl2-sensitive (Kir2) currents. (D-F) Reduction in Ba2+-sensitive current Kir2 current, but not the Ba2+-resistant leak current, in iSPNs lacking autophagy. iSPNCtrl: N = 19,5; iSPNAtg7cKO: N = 25,6. (D) Data analyzed with repeated measure two-way ANOVA. Voltage x Genotype: F(10,400) = 13.31, p<0.0001. (E) Data analyzed with repeated measure two-way ANOVA. Voltage x Genotype: F(10,400) = 1.852, p = 0.0503; Voltage: F(10, 400)=250.1, p<0.0001; Genotype: F(1,40)=2.942, p = 0.0941. (F) Data analyzed with repeated measure two-way ANOVA. Voltage x Genotype: F(10,400) = 17.33, p<0.0001. (G) No difference in the voltage dependence or (H) voltage at half-maximal activation for Kir2 currents between genotypes. (G) Data analyzed with repeated measure, two-way ANOVA. Voltage x Genotype: F(10,400) = 0.8522, p = 0.5785; Voltage: F(10,400)=2599, p<0.0001; Genotype: F(1,40) = 0.01361, p = 0.9077. (I) Slope of Kir2 current is greater in iSPNControl than iSPNAtg7cKO cells. Data in (H-I) analyzed with a two-tailed, unpaired t test. Data in D-G were analyzed with a repeated measures two-way ANOVA followed by Bonferroni post-hoc tests. Data in H and I were analyzed with a two-tailed unpaired t test. ns p>0.05, *p<0.05, **p<0.01, ***p<0.001, † p<0.0001.
Figure 5 with 3 supplements
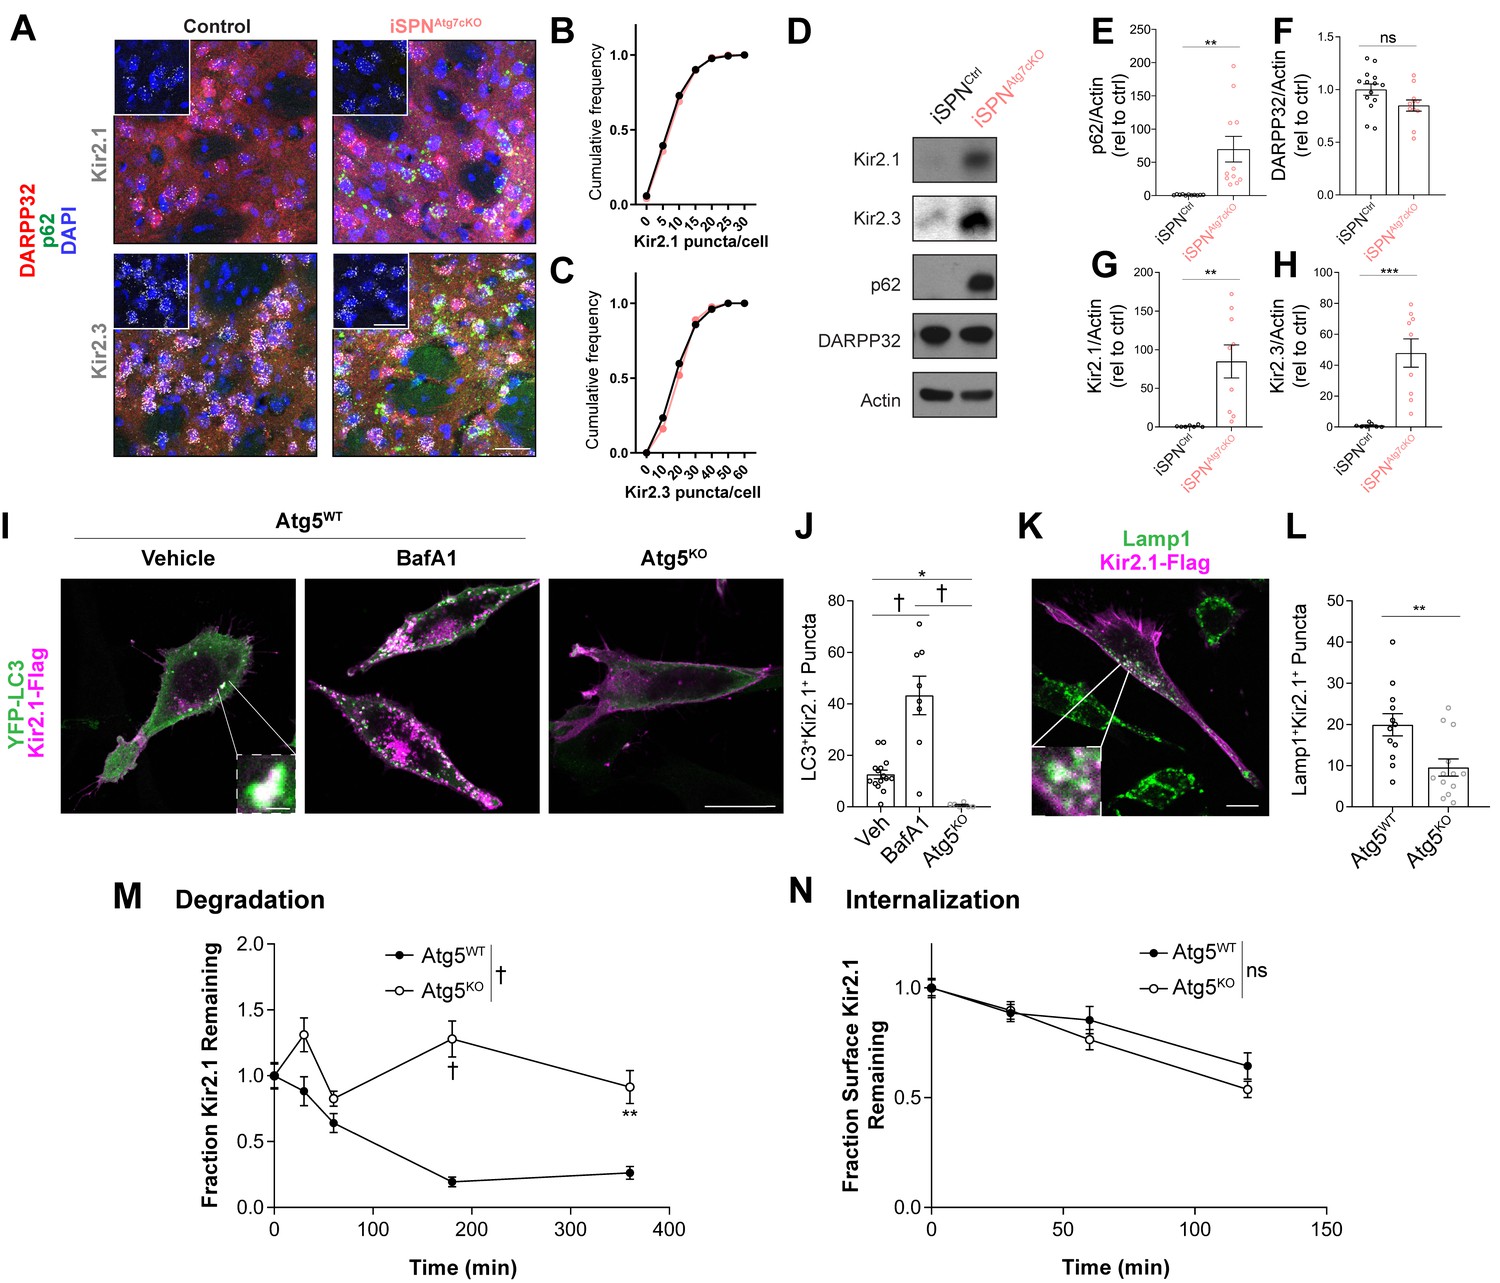
Autophagy is required for Kir2 degradation.
(A–C) There was no difference in Kir2.1 or Kir2.3 mRNA expression in SPNs of iSPNAtg7cKO mice in an RNAscope assay (N = 77–173 cells from three mice per group). Inset shows just RNAscope and DAPI. Scale bar 30 µm. Data analyzed by the Kolmogorov-Smirnov test, Genotype effect: p>0.05 for Kir2.1 and Kir2.3. (D) Representative western blots of specified proteins from total striatal lysates from iSPNCtrl or iSPNAtg7cKO mice. Quantifications of (E) p62 (t20 = 3.551, p = 0.0020), (F) DARPP32 (t23 = 1.984, p = 0.0593), (G) Kir2.1 (t14 = 3.435, p = 0.0040), and (H) Kir2.3 (t14 = 4.492, p = 0.0005) relative to actin. p62: iSPNctrl: n = 11, iSPNAtg7cKO: n = 11. DARPP32: iSPNctrl: n = 14, iSPNAtg7cKO: n = 11. Kir2.1: iSPNctrl: n = 7, iSPNAtg7cKO: n = 9. Kir2.3: iSPNctrl: n = 7, iSPNAtg7cKO: n = 9. Data analyzed by two-tailed, unpaired t test. (I-J) Kir2.1 is localized in LC3-GFP+ puncta in Atg5WT but not Atg5KO MEFs. BafilomycinA1 (BafA1; 100 nM 2 hr) treatment increases the number of LC3/Kir2.1-double labeled puncta in Atg5WT MEFs. Scale bar 20 µm. Inset scale bar 1 µm. Analyzed by one-way ANOVA followed by Bonferroni post-hoc test. F(2,26)=25.64, p<0.0001. (K-L) A reduction of Lamp1+Kir2.1+ puncta in Atg5KO MEFs. Scale bar 20 µm, inset scale bar 1 µm. Data analyzed by two-tailed, unpaired t test. t23 = 3.083, p = 0.0053. (M) Reduced degradation of SNAP-tag labeled Kir2.1 in Atg5KO MEFs. N: (WT,KO): T = 0 min (35,30), T = 30 min (30,27), T = 60 min (25,38), T = 180 min (33,67), T = 360 min (40,20). Data analyzed by two-way ANOVA. Genotype x time: F4,335 = 7.880, p<0.0001. (N) No significant difference in the internalization of antibody-labeled surface Kir2.1 channels in Atg5KO MEFs. N: (WT,KO): T = 0 min (76,56), T = 30 min (52,37), T = 60 min (41,42), T = 120 min (28,38). Data analyzed by two-way ANOVA. Genotype x time: F3,362 = 0.8038, ns; Time: F(3,362) = 25.88, p = 0.0001; Genotype: F(1,362) = 1.877, ns. ns p>0.05, *p<0.05, **p<0.01, ***p<0.001, † p<0.0001.
-
Figure 5—source data 1
Source data for Figure 5.
- https://cdn.elifesciences.org/articles/50843/elife-50843-fig5-data1-v2.pdf
Figure 5—figure supplement 1
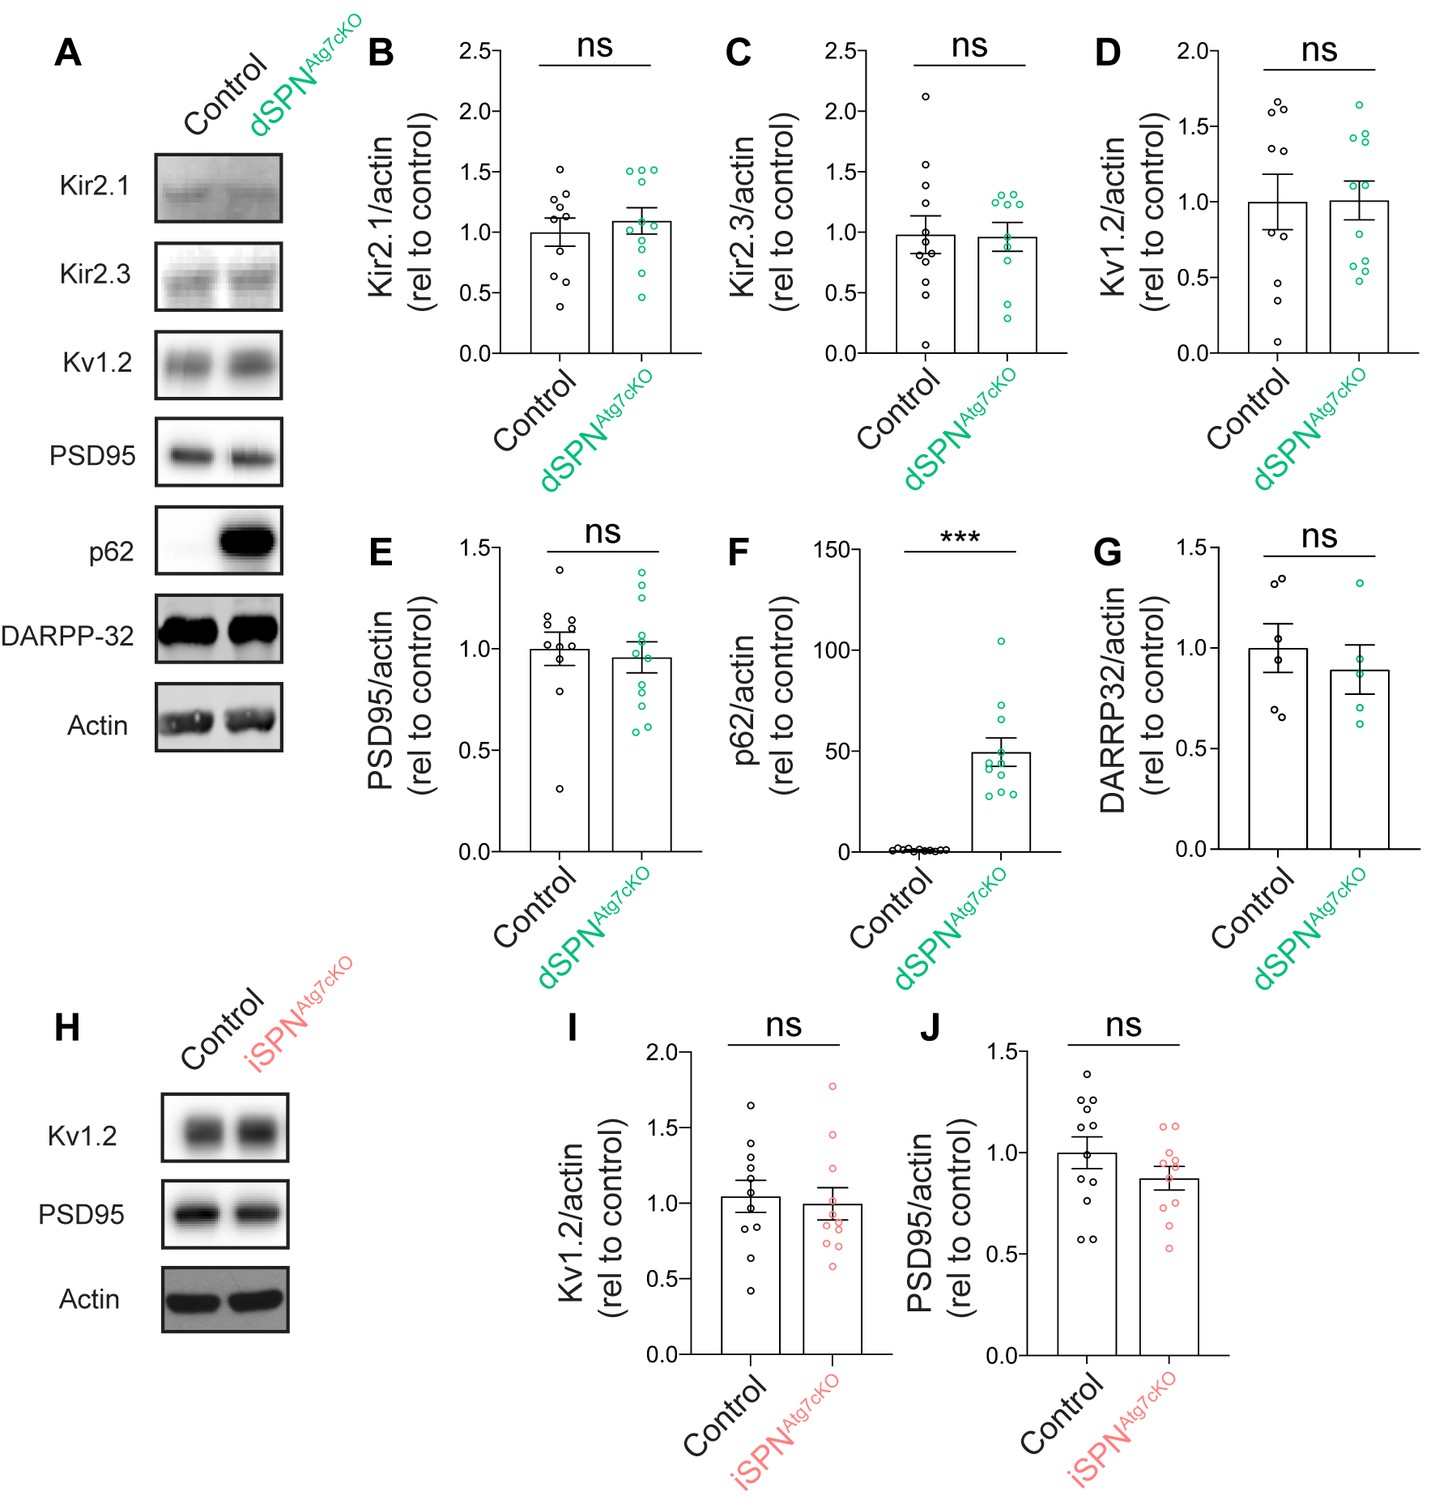
Loss of autophagy does not affect Kir2.1 expression in dSPNAtg7cKO mice.
(A) Representative western blots from control or dSPNAtg7cKO mice. (B-G) Quantification of relative protein levels in control and dSPNAtg7cKO mice shows no significant difference between (B) Kir2.1 [dSPNCtrl: n = 10, dSPNAtg7cKO: n = 11; t19 = 0.5816, p = 0.5677], (C) Kir2.3 [dSPNCtrl: n = 12, dSPNAtg7cKO: n = 10; t20 = 0.08775, p = 0.9309], (D) Kv1.2 [dSPNCtrl: n = 10, dSPNAtg7cKO: n = 11; t19 = 0.04627, p = 0.9636], (E) PSD95 [dSPNCtrl: n = 11, dSPNAtg7cKO: n = 12; t21 = 0.3730, p = 0.7129], or (G) DARPP32 [dSPNCtrl: n = 6, dSPNAtg7cKO: n=5; t9 = 0.6178, p = 0.5520], but a significant increase in (F) p62 [dSPNCtrl: n = 11, dSPNAtg7cKO: n = 11; t20=6.936, p<0.0001]. (H) Representative western blots for Kv1.2 and PSD95 in control or iSPNAtg7cKO mice. (I-J) Quantification of Kv1.2 [iSPNCtrl: n = 11, iSPNAtg7cKO: n = 11; t20 = 0.3213, p = 0.7513] and PSD95 [iSPNCtrl: n = 12, iSPNAtg7cKO: n = 11; t21 = 1.264, p = 0.2202] shows no difference between control and iSPNAtg7cKO mice. Data analyzed by two-tailed unpaired t test. ns p>0.05, *** p<0.0001.
-
Figure 5—figure supplement 1—source data 1
Source data for Figure 5—figure supplement 1.
- https://cdn.elifesciences.org/articles/50843/elife-50843-fig5-figsupp1-data1-v2.pdf
-
Figure 5—figure supplement 1—source data 2
Source Data for Figure 5—figure supplement 1 continued.
- https://cdn.elifesciences.org/articles/50843/elife-50843-fig5-figsupp1-data2-v2.pdf
Figure 5—figure supplement 2
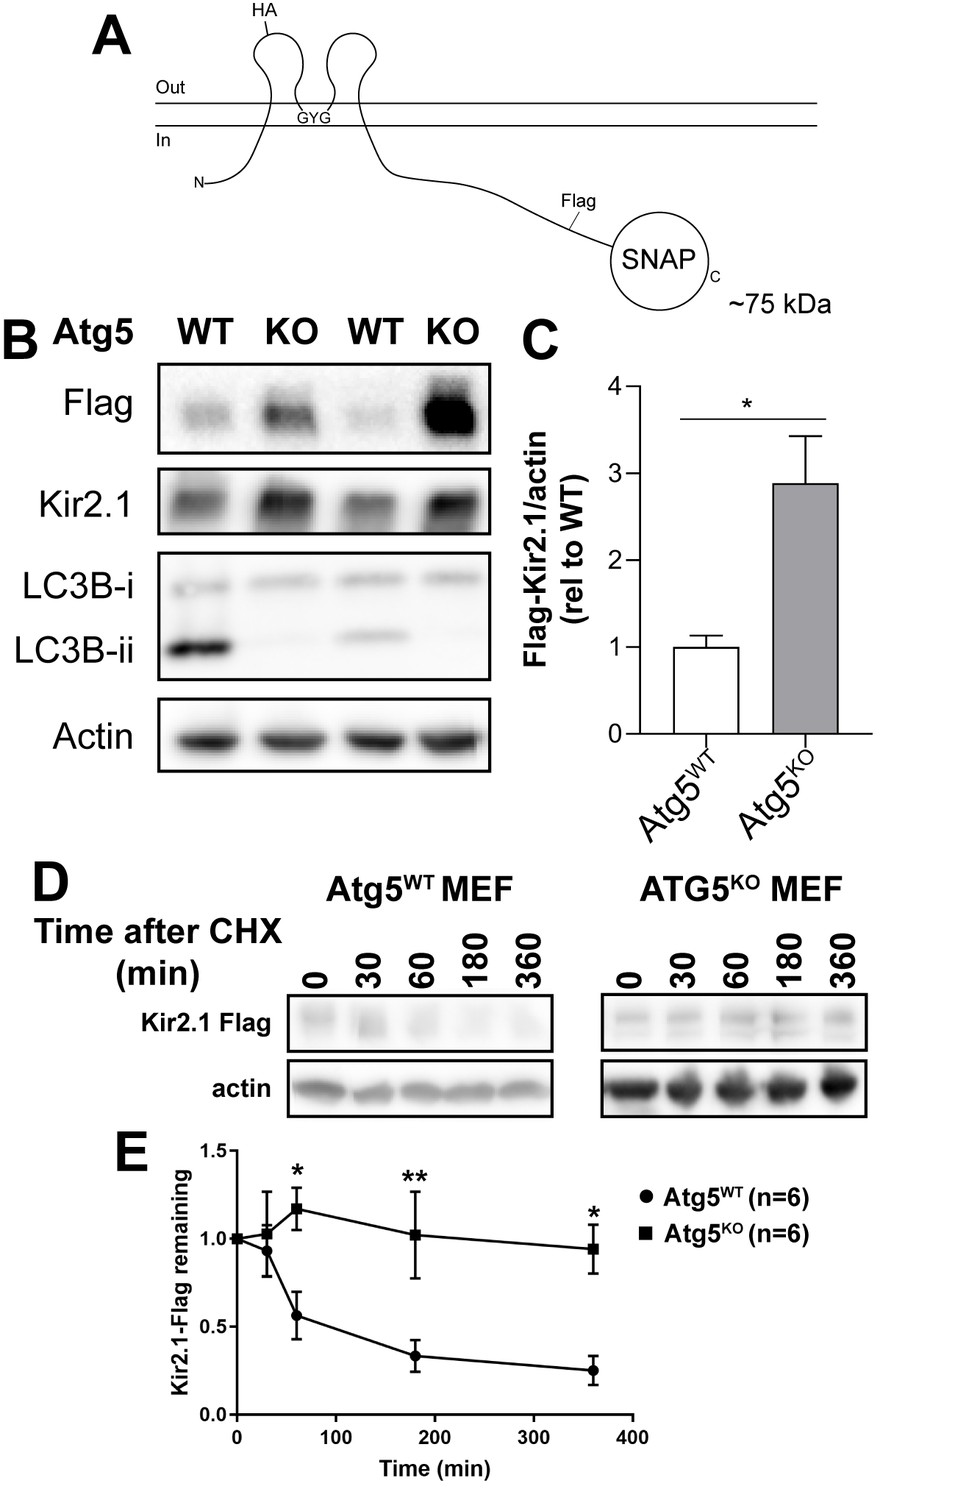
Higher steady-state levels of Kir2.1 and reduced degradation of Kir2.1 in Atg5KO MEFs.
(A) Schematic of Kir2.1-externalHA-Flag-SNAP (abb. Kir2.1 below) construct. (B) Representative western blots and (C) quantification for Flag, Kir2.1, LC3B and actin show elevated steady state levels of Kir2.1 in transiently transfected in Atg5KO MEFs compared to Atg5WT MEFs. N = 3 per genotype. Data analyzed with two-tailed unpaired t test, t4 = 3.390, p = 0.0275. (D and E) Representative blots and aggregate data from six independent replicates per timepoint treated with cycloheximide at t = 0 min. Data were analyzed with a two-way ANOVA followed by Bonferroni post-hoc test. Time x genotype: F(4,44)=2.764, p = 0.0391. ns p>0.05, *p<0.05, **p<0.01, ***p<0.001, † p<0.0001.
-
Figure 5—figure supplement 2—source data 1
Source Data for Figure 5—figure supplement 2B.
- https://cdn.elifesciences.org/articles/50843/elife-50843-fig5-figsupp2-data1-v2.pdf
-
Figure 5—figure supplement 2—source data 2
Source Data for Figure 5—figure supplement 2D.
- https://cdn.elifesciences.org/articles/50843/elife-50843-fig5-figsupp2-data2-v2.pdf
Figure 5—figure supplement 3
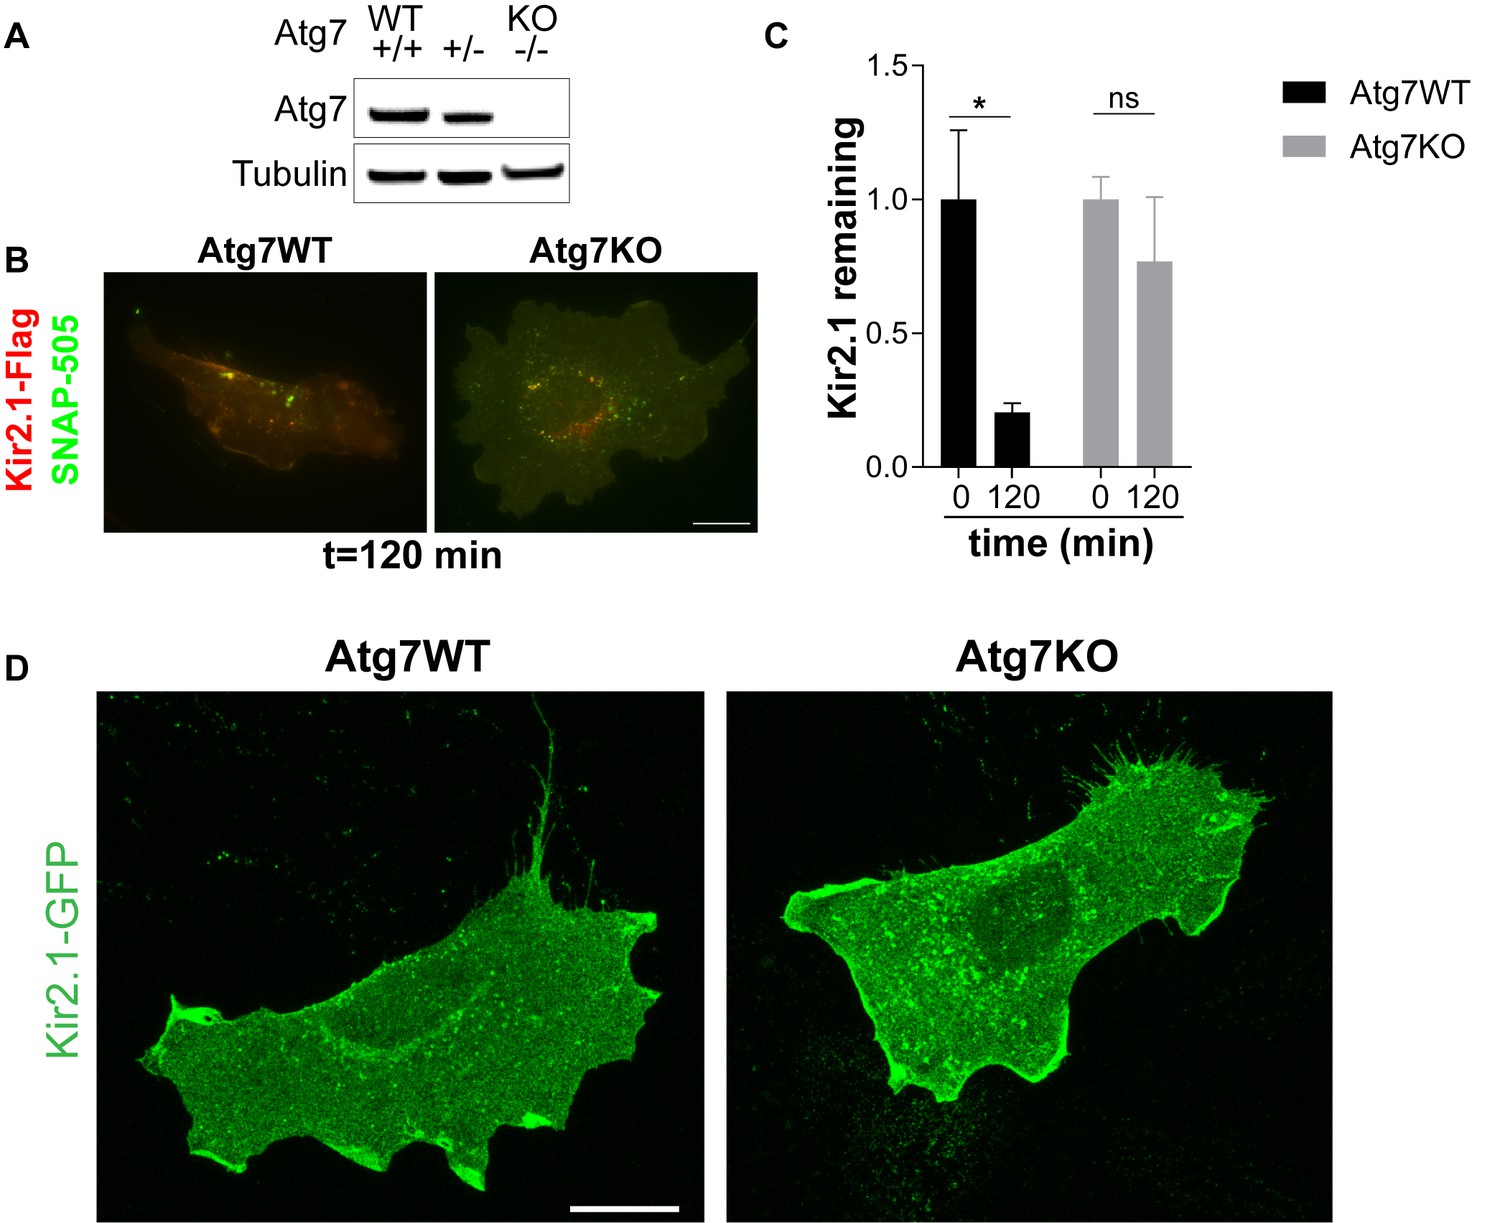
Kir2.1 degradation is disrupted in Atg7KO MEFs.
(A) Representative western blot showing the absence of Atg7 in Atg7KO primary MEFs. (B) Representative images of primary MEFs transfected with Kir2.1-Flag-SNAP and labeled with SNAPcell ligand. (C) Snap-labeled Kir2.1 is significantly reduced in Atg7WT cells but not Atg7KO cells. N: (0,120 min) WT: (7,6), KO: (7,6). Data analyzed by two-way ANOVA. Genotype x time: F(1,22)=2.323, p = 0.1417; Genotype: F(1,22)=2.323, p = 0.1417. Time: F(1,22)=7.675, p = 0.0112. (D) The distribution of Kir2.1 is not different between Atg7WT and Atg7KO cells. Data are combined from two independent replicates. *p<0.05.
-
Figure 5—figure supplement 3—source data 1
Source Data for Figure 5—figure supplement 3A.
- https://cdn.elifesciences.org/articles/50843/elife-50843-fig5-figsupp3-data1-v2.pdf
Figure 6
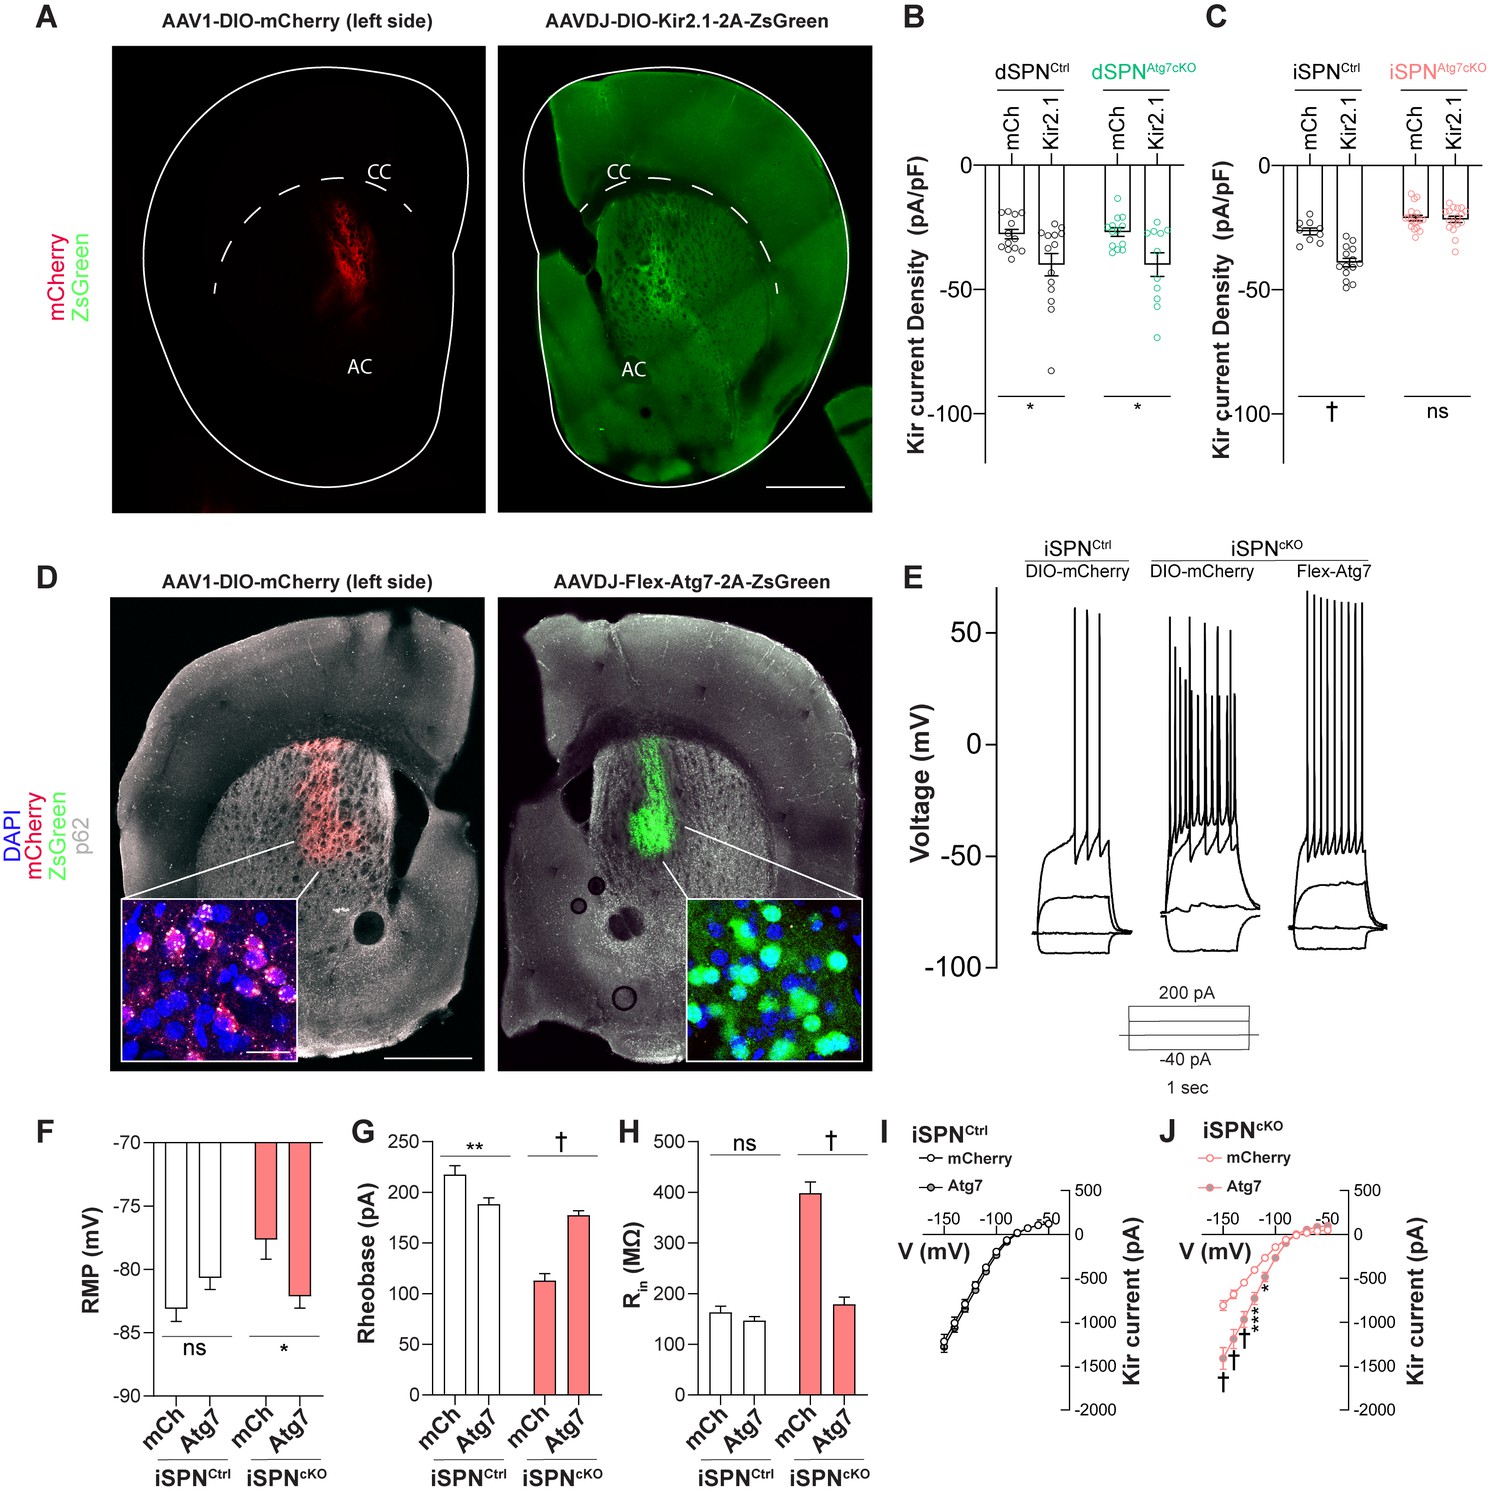
Atg7 reexpression but not Kir2.1 overexpression rescues changes in iSPN physiology.
(A) Immunofluorescent images of striatal hemisections from mice injected with AAV1-DIO-mCherry or AAVDJ-DIO-Kir2.1-t2A-zsGreen stained against mCherry (left) or GFP (right). Scale bar 500 µm. (B) Significant effect of Kir2.1 overexpression on Kir2 current density in dSPNs from control and dSPNs from dSPNAtg7cKO mice. Data analyzed with two-way ANOVA. Genotype x virus: F(1,47)=0.01278, p = 0.9105; Genotype: F(1,47)=0.01840, p = 0.8937; Virus: F(1,47) = 13.23, p=0.0007. N = dSPNCtrl (D1cre Atg7wt/wt, mCh: n = 13(4), Kir2.1: n = 14(4)) or dSPNAtg7cKO (D1cre Atg7Fl/Fl, mCh: n = 13(4), Kir2.1: n = 11 (3)). (C) Significant effect of Kir2.1 overexpression on Kir2 current density in iSPNs from control but not from iSPNAtg7cKO mice. Data analyzed with two-way ANOVA. Genotype x virus: F(1,54) = 17.62, p = 0.0001. N = iSPNCtrl (A2Acre Atg7wt/wt, mCh: n = 9 (3), Kir2.1: n = 14(3)) or iSPNAtg7cKO (A2Acre Atg7Fl/Fl, mCh: n = 18(5), Kir2.1: n = 17(4)). (D) Representative hemisections from iSPNAtg7cKO mice injected with AAV1-DIO-mCherry (left) or AAVDJ-Flex-Atg7-2A-ZsGreen (right) showing reduction in p62 puncta in cells expressing Atg7 (right) compared to mCherry (left). Scale Bar 500 µm. Inset, scale bar 20 µm. (E) Representative current clamp traces from mCherry-expressing iSPN in a control (A2Acre) mouse, mCherry expressing iSPN in an iSPNAtg7cKO mouse or an Atg7-expressing iSPN from an iSPNAtg7cKO mouse. (F-J) Reexpression of Atg7 normalizes RMP [N = iSPNCtrl: mCh: n = 25(5), Kir2.1: n = 26(5)) or iSPNAtg7cKO: mCh: n = 13(3), Kir2.1: n = 15(3). Genotype x virus: F(1,76)=9.491, p = 0.0029], rheobase [N = iSPNCtrl: mCh: n = 25(5), Kir2.1: n = 26(5)) or iSPNAtg7cKO: mCh: n = 14(3), Kir2.1: n = 15(3). Genotype x virus: F(1,75)=36.54, p<0.0001], Rin [N = iSPNCtrl: mCh: n = 25(5), Kir2.1: n = 26(5)) or iSPNAtg7cKO: mCh: n = 13(3), Kir2.1: n = 16(3). Genotype x virus: F(1,76)=55.55, p<0.0001], and Kir2 current in iSPNs from iSPNAtg7cKO mice compared to mCherry control but only reduces Rin in controls. All data analyzed by two-way ANOVA. In (I), N = iSPNCtrl: mCh: n = 9 (5), Kir2.1: n = 9 (5). Voltage x virus: F(10,160)=0.1170, p = 0.9996; Voltage: F(10,160) = 178.8, p<0.0001; Virus: F(1,16)=0, p = 0.9929. In (J), N = iSPNAtg7cKO: mCh: n = 10(3), Kir2.1: n = 12(3). Genotype x virus: F(10,200) = 18.56, p<0.0001. ns p>0.05, *p<0.05, **p<0.01, ***p<0.001, † p<0.0001.
Figure 7 with 1 supplement
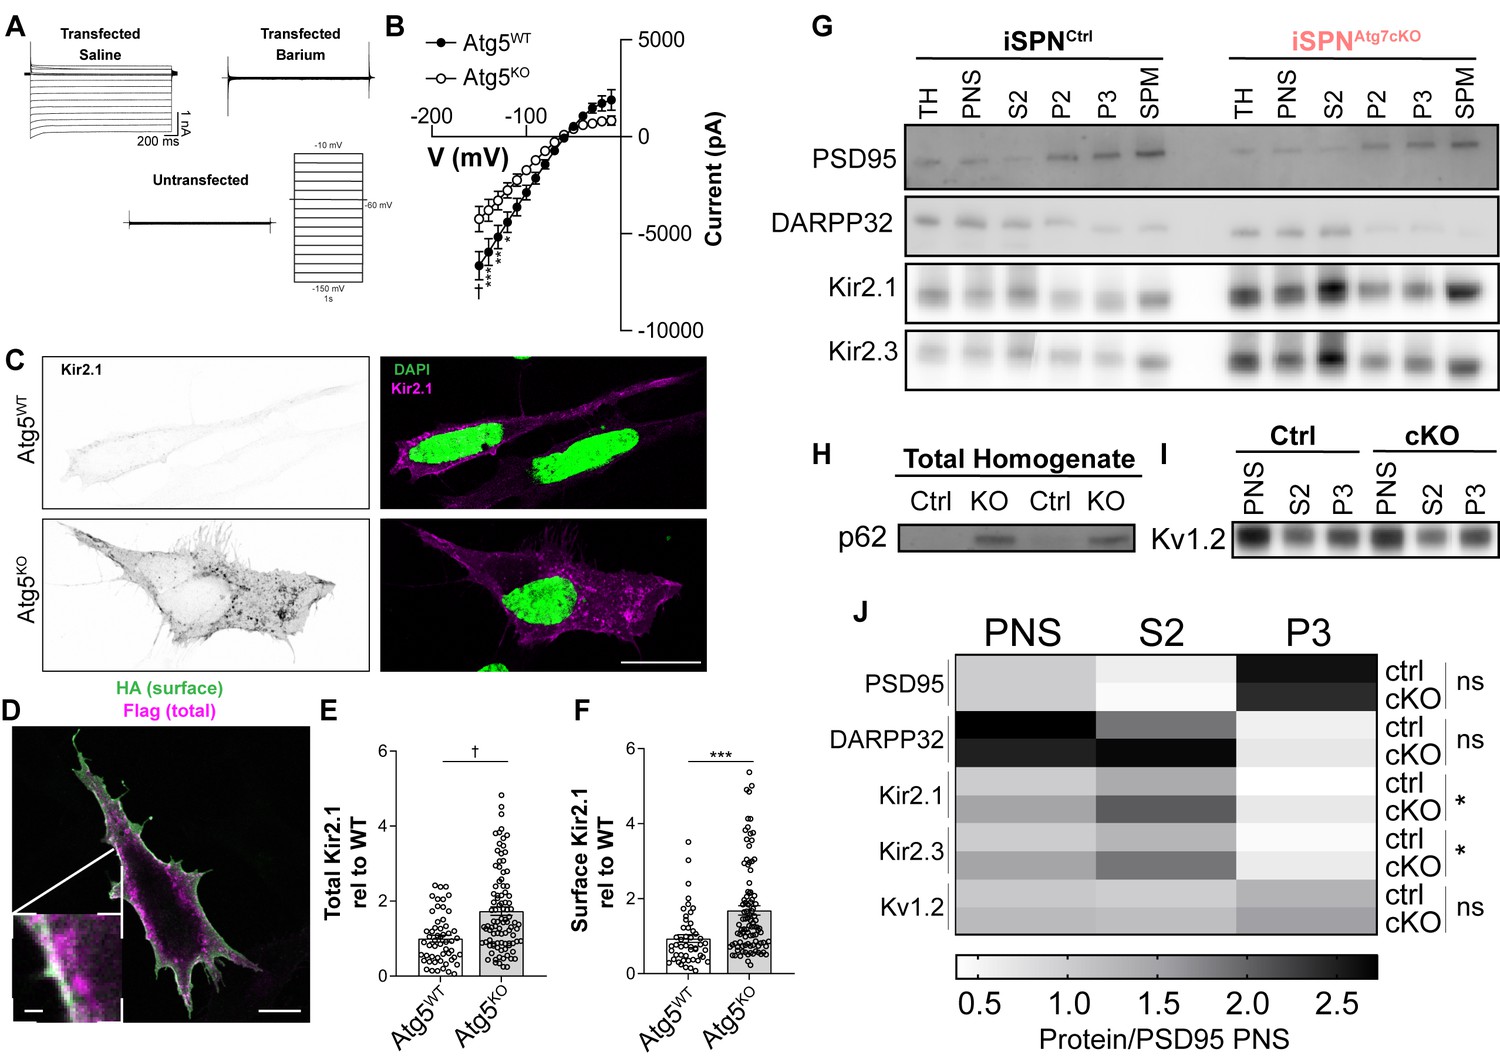
Autophagy is not required for Kir2 trafficking.
(A) Sample traces from MEFs transfected with Kir2.1 demonstrate an inwardly rectifying, barium sensitive current that is absent in untransfected cells. (B) Atg5KO MEFs have reduced Kir2.1 current compared to Atg5WT MEFs. WT: N = 8, KO: N = 12. Voltage step x genotype: F(14, 252)=8.985, p<0.0001. (C) Representative micrographs of Atg5WT and Atg5KO MEFs. On right, the Kir2.1 channel in the WT image has been contrasted to compare staining pattern. Scale bar 20 µm. (D-F) Elevated levels of both surface and total levels of Kir2.1 in Atg5KO MEFs. Scale bar 20 µm, inset scale bar 1 µm. (E) t147=4.511, p<0.0001. (F) t147=4.511, p<0.0001. (G-J) Subcellular fractionation reveals elevated levels of Kir2.1 and Kir2.3 in all fractions of iSPNAtg7cKO mice compared to controls but no change in the relative distribution of Kir2.1 or Kir2.3 between genotypes. (H) p62 is elevated in the total homogenate of iSPNAtg7KO mice. (I) No change in distribution or level of Kv1.2 between genotypes. iSPNCtrl: N = 5. iSPNAtg7cKO: N = 3. TH, total homogenate; PNS, post-nuclear supernatant; S2, 20,000xg supernatant; P2, 20,000xg pellet; P3, resuspended P2 spun at 100,000xg; SPM, synaptic plasma membranes isolated from 1.0M and 1.2M sucrose interface. Data were analyzed by two-way ANOVA for each analyzed protein with fraction and genotype as factors. No significant interaction between fraction and genotype was found for any protein. Fraction was significant for each protein. Genotype was only significant for Kir2.1 and Kir2.3. Kir2.1: Genotype: F(1,6)=9.373, p = 0.0222. Kir2.3: Genotype: F(1,6)=6.615, p = 0.0422. See Table 1 for detailed statistics. ns p>0.05, *p<0.05, **p<0.01, ***p<0.001, † p<0.0001. Experiments in B, E, and F were combined from at least three independent experiments.
-
Figure 7—source data 1
Source Data for Figure 7.
- https://cdn.elifesciences.org/articles/50843/elife-50843-fig7-data1-v2.pdf
Figure 7—figure supplement 1

Plasma membrane floatation and MBCD treatment.
(A) Schematic of iodixanol gradient. (B,D) representative blots of gradient fractions. (C) Aggregate data of Kir2.1 in each fraction normalized to the total amount of Kir2.1 across the gradient. No difference in Kv1.2 levels or distribution and no difference in Kir2.1 distribution was seen. N = 3 mice per genotype. Data analyzed by repeated measure, two-way ANOVA. Genotype x fraction: F(8,48) = 0.3456, p = 0.9433; Genotype: F(1,6)=2.455, p = 0.1682; Fraction: F(8,48) = 16.28, p<0.0001. (E) Kir2 currents from iSPNs from slices pretreated with methyl-β-cyclodextrin (MBCD; 10 mM) were recorded. No effect of MBCD was seen at either genotype. iSPNCtrl: Veh N = 8, MBCD N = 6. iSPNAtg7cKO: Veh N = 5, MBCD N = 7 (Cells from two mice per condition).
Figure 8 with 1 supplement
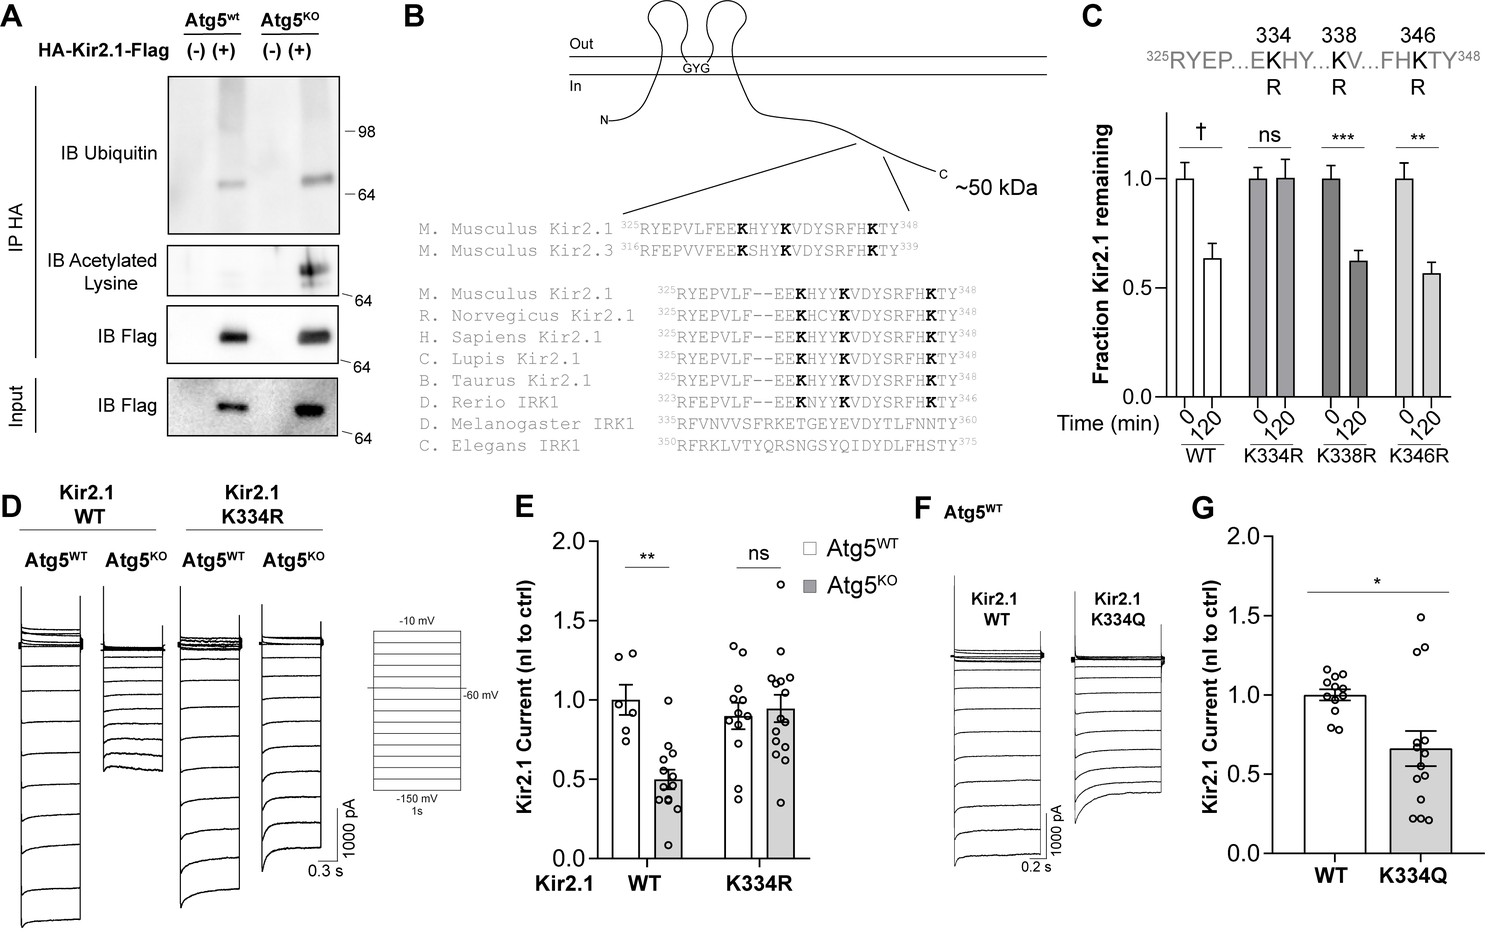
Hyperacetylation of Kir2.1 at K334 in the absence of autophagy inhibits channel activity.
(A) Immunoprecipitation of Kir2.1 reveals elevated levels of acetylated lysines on Kir2.1 in Atg5KOMEFs without a change in ubiquitination. Representative blots shown from at least three independent replicates. (B) A conserved motif in the C-terminal tail of Kir2.1 and Kir2.3 contains three modifiable lysines and has previously been implicated in Kir2 channel degradation. (C) A degradation screen in which K334, K338 and K346 were mutated to the unmodifiable residue, arginine, reveals that K334 is required for Kir2.1 degradation in Atg5WT MEFs. N: (T=0min, T = 120 min) WT (52,79), K334R (27,51), K338R (40,41), K346R (23,11). Data analyzed by two-way ANOVA followed by Bonferroni post-hoc test. Kir genotype x time: F(3,390) = 3.211, p = 0.0230. (D-E) Kir2.1 K334R current is normalized in Atg5KO MEFs but does not affect Kir2.1 current in Atg5WT MEFs. Data analyzed by two-way ANOVA followed by Bonferroni post-hoc test. Cell genotype x Kir genotype: F(1,42) = 9.603, p = 0.0035. (F-G) Kir2.1 K334Q, with an acetylation-mimic at K334, has reduced current in Atg5WT MEFs. Voltage step protocol is the same as in (D). Data analyzed by two-tailed unpaired t test. t24=2.707, p=0.0123. ns p>0.05, * p<0.05, ** p<0.01, *** p<0.001, † p<0.0001. Experiments in C, E and G were combined from at least three independent experiments.
-
Figure 8—source data 1
Source Data for Figure 8.
- https://cdn.elifesciences.org/articles/50843/elife-50843-fig8-data1-v2.pdf
Figure 8—figure supplement 1

Reduced acetylation of Kir2.1 K334R in Atg5KO MEFs but acetylation status at K334 does not affect surface residence of Kir2.1.
(A) Representative western blots of immunoprecipitated WT Kir2.1extHA-Flag-SNAP or Kir2.1extHA-Flag-SNAP K334R. Immunoblots for acetylated lysines (AceK) or Flag. (B) Quantification of acetylated lysine signal normalized to WT or K334R Kir2.1extHA-Flag-SNAP in immunoprecipiates from Atg5KO MEFs shows a reduction in total Kir2.1 acetylation when K334 is mutated to arginine. Data analyzed with two-tailed, unpaired t test. t10 = 2.452; p = 0.0341. (C) Surface staining for WT Kir2.1, Kir2.1 K334R, and Kir2.1 K334Q in Atg5WT or Atg5KO MEFs reveals that mutations at K334 does not affect surface localization of Kir2.1 in either MEF cell line. Data analyzed with two-way ANOVA. Cell genotype x Channel genotype: F(2,142)=0.04505, p = 0.9560; Cell genotype: F(1,142)=75.66, p<0.0001; Channel Genotype: F(2,142)=0.6539, p = 0.5216. *p<0.05, † p<0.0001.
Author response image 1
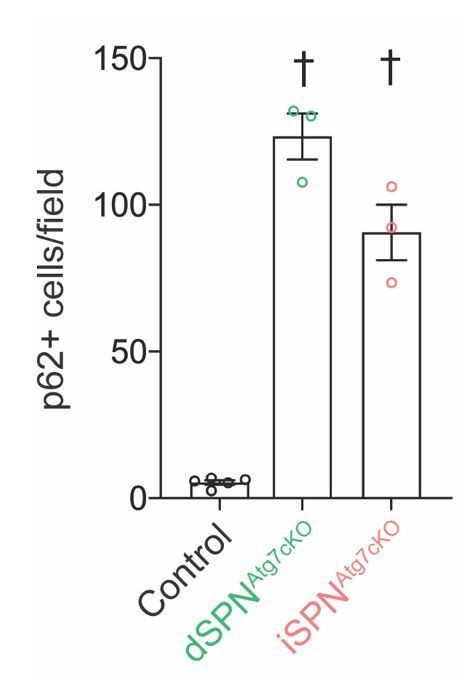
Similar numbers of p62+ cells in dSPNAtg7cKO and iSPNAtg7cKO striatum at P28.
Data were analyzed with a one-way ANOVA followed by a Bonferroni post-hoc test.
Author response image 2
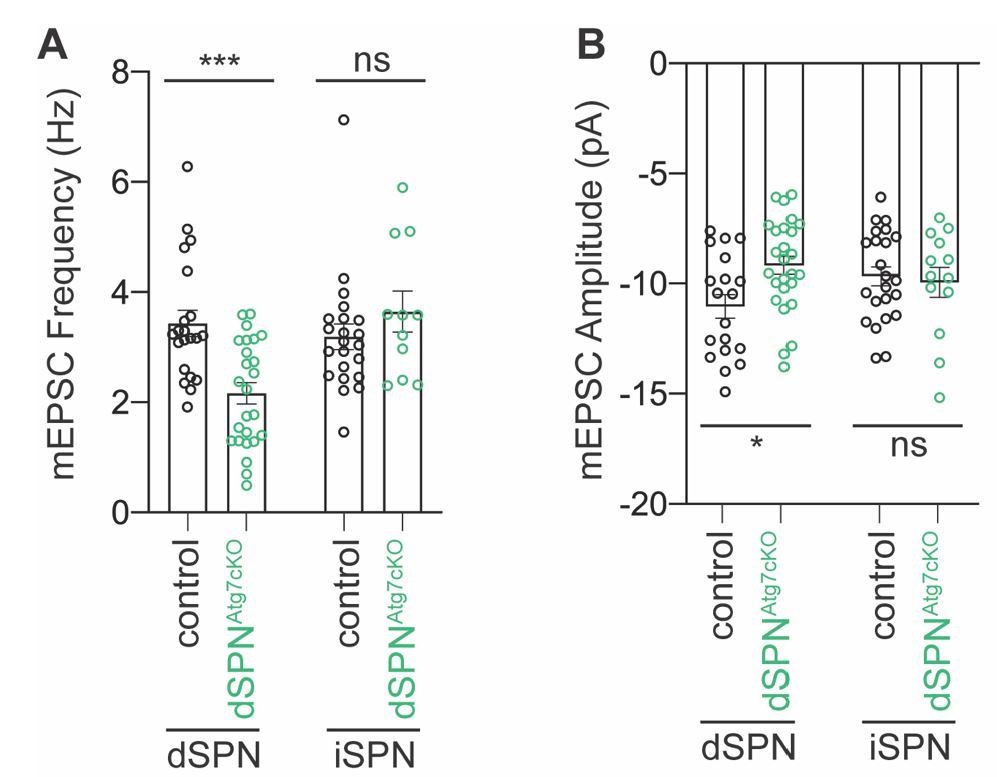
No change in mEPSC frequency or amplitude in iSPNs from dSPNAtg7cKO mice.
mEPSCs were recorded from iSPNs in dSPNAtg7cKO mice and compared to control iSPNs. We show here that iSPNs from dSPNAtg7cKO mice have equivalent (A) mEPSC frequency and (B) mEPSC amplitude as iSPNs from control mice. Data from dSPNs arising from control or dSPNAtg7cKO mice are reproduced here for reference from Figure 3. Control iSPN data, also reproduced from Figure 3. Data are analyzed by two-way ANOVA followed by Bonferroni posthoc test. (A) Subtype x Genotype: F(1,75)=11.57, p=0.0011. (B) Subtype x Genotype: F(1,77)=4.444, p=0.0383. iSPNs from dSPNAtg7cKO mice: n=11,3. N for other group are the same as in Figure 3.
Author response image 3
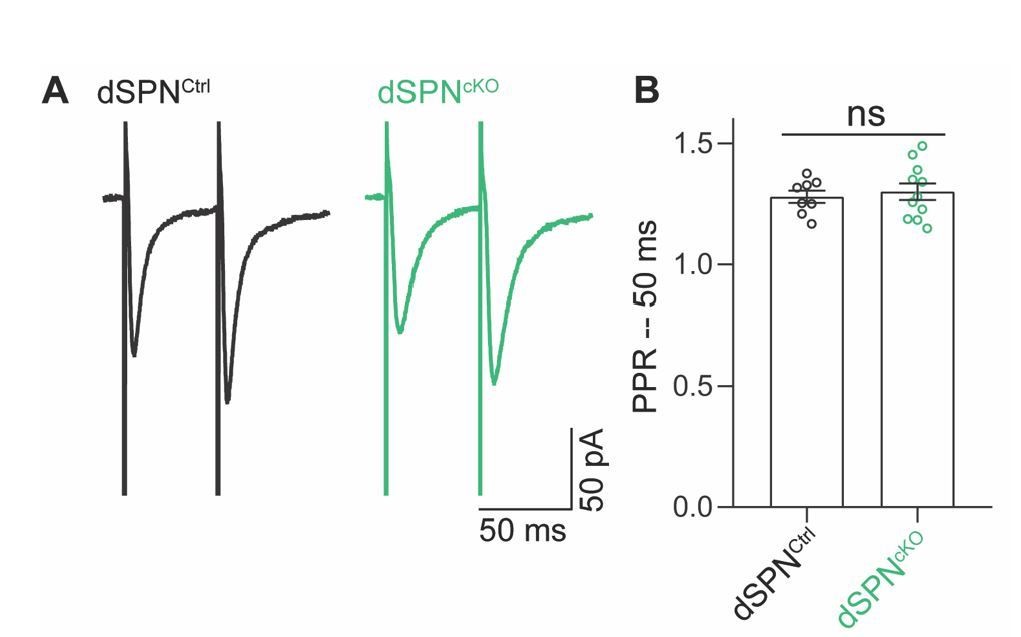
No change in paired-pulse ratio (PPR) of excitatory inputs to dSPNs from dSPNAtg7cKO mice.
(A) Representative traces of evoked EPSCs in dSPNs from control or dSPNAtg7cKO mice. EPSCs were evoked in the presence of 25 μM picrotoxin following electrical stimulation within the striatum >100μm from the cell body. (B) No effect of loss of dSPN autophagy on the paired pulse ratio of evoked EPSCs. Control: n=7,2; dSPNAtg7cKO: n=11,3. Latency of EPSC is between 5-10 ms in all cells examined.
Author response image 4
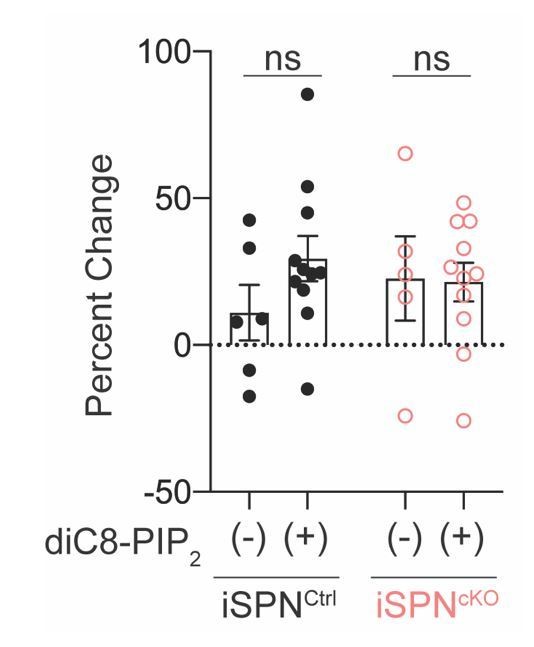
Increasing cellular PIP2 levels does not rescue Kir2 currents in Atg7-deficient iSPNs.
(A) diC8-PIP2 (50 μM) was included in the intracellular solution. Percent change in Kir2 currents after 12 minutes of dialysis with the internal solution ((Lieberman et al., 2018). No effect of diC8-PIP2 was found in either genotype. Data analyzed with two-way ANOVA followed by Bonferroni test. Genotype x PIP2: F(1,29)=1.124, p=0.2978; Genotype: F(1,29)=0.8626, p=0.3607; PIP2: F(1,29)=0.03962, p=0.8436. Each condition arose from >3 mice each.
Author response image 5
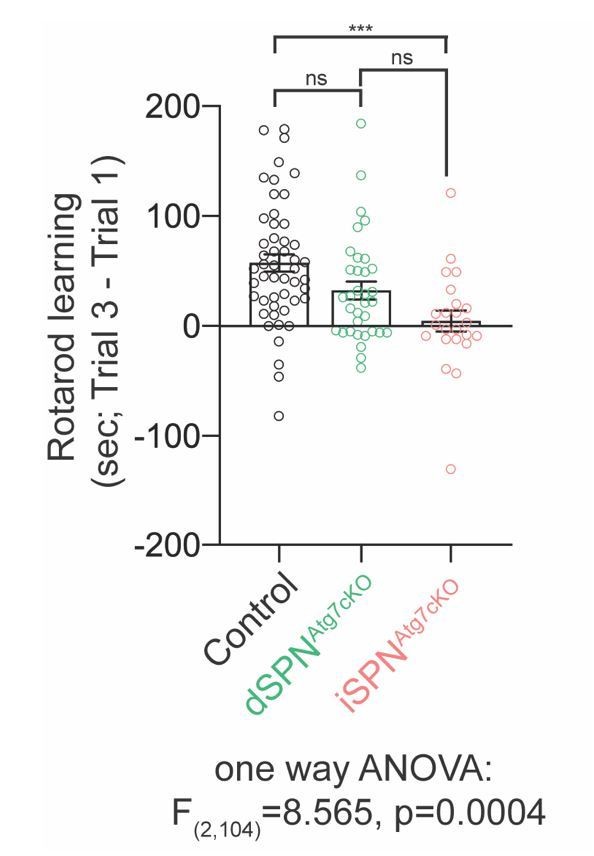
Motor learning differences between control, dSPNAtg7cKO and iSPNAtg7cKO mice.
The difference in latency to fall between trial 3 and trial 1 were plotted for each mouseincluded in Figure 2B. Data was analysed with a one-way ANOVA followed by a Bonferroni post-hoc test.
Author response image 6

Specificity of Kir2.1 antibody.
Lysates were generated from Atg5WT and Atg5KO MEFs, with or without transfection with Kir2.1FlagSNAP and blotted for Flag, Kir2.1, Kir2.3, p62 and actin.
Tables
Table 1
Statistics split by sex for behavioral experiments in Figure 2.
| Sex | Genotype (N) | Mean (SEM) | Statistics |
|---|---|---|---|
| Rotarod – learning rate (rpm/trial; trial 3- trial 1) | |||
| Male | Control (28) | 57.29 (10.17) | p = 0.0088 |
| dSPNAtg7cKO (20) | 15.85 (8.333) | ||
| iSPNAtg7cKO (11) | 22.45 (13.17) | ||
| Female | Control (22) | 57.18 (12.89) | p = 0.0029 |
| dSPNAtg7cKO (14) | 38.43 (12.69) | ||
| iSPNAtg7cKO (12) | −11.92 (12.33) | ||
| Combined | Control (50) | 57.24 (7.954) | p = 0.0001 |
| dSPNAtg7cKO (34) | 25.15 (7.306) | ||
| iSPNAtg7cKO (23) | 4.522 (9.526) | ||
| Sex x Genotype F(2,101) = 2.218 p = 0.1141 | |||
| Weight (g) | |||
| Male | Control (31) | 26.07 (0.4074) | p = 0.0003 |
| dSPNAtg7cKO (19) | 22.66 (0.8216) | ||
| iSPNAtg7cKO (12) | 24.67 (0.6438) | ||
| Female | Control (31) | 21.15 (0.4341) | p = 0.0003 |
| dSPNAtg7cKO (11) | 17.85 (0.5850) | ||
| iSPNAtg7cKO (13) | 20.29 (0.4439) | ||
| Sex x Genotype F(2,111) = 0.1073 p = 0.8983 | |||
| Open Field – Distance traveled (cm) | |||
| Male | Control (17) | 6777 (397.9) | p = 0.0159 |
| dSPNAtg7cKO (7) | 8073 (883.5) | ||
| iSPNAtg7cKO (6) | 9318 (573.1) | ||
| Female | Control (15) | 9307 (369.4) | p = 0.0257 |
| dSPNAtg7cKO (7) | 7967 (773.3) | ||
| iSPNAtg7cKO (8) | 10433 (584.5) | ||
| Combined | Control (32) | 7963 (351.7) | p = 0.0048 |
| dSPNAtg7cKO (15) | 7762 (585.4) | ||
| iSPNAtg7cKO (15) | 9955 (427.4) | ||
| Sex x Genotype F(2,54) = 3.045 p = 0.0558 | |||
| Open Field – Stereotypies (data normalized) | |||
| Male | iSPNCtrl (7) | 1.00 (0.030) | p = 0.0293 |
| iSPNcKO (6) | 1.136 (0.047) | ||
| Female | iSPNCtrl (8) | 1.00 (0.038) | p = 0.0819 |
| iSPNcKO (8) | 1.094 (0.032) | ||
| Combined | iSPNCtrl (15) | 1.00 (0.024) | p = 0.0043 |
| iSPNcKO (14) | 1.112 (0.027) | ||
| Sex x genotype F(1,25) = 0.3226 p = 0.5751 | |||
| Grooming bouts | |||
| Male | iSPNCtrl (11) | 3.091 (0.8252) | p = 0.0542 |
| iSPNcKO (13) | 5.846 (1.031) | ||
| Female | iSPNCtrl (12) | 3.500 (0.4174) | p = 0.0048 |
| iSPNcKO (13) | 7.385 (1.130) | ||
| Combined | iSPNCtrl (23) | 3.304 (0.4420) | p = 0.0007 |
| iSPNcKO (26) | 6.615 (0.7648) | ||
-
Sex x genotype F(1,45) = 0.3781 p = 0.5417.
Table 2
Detailed statistics for Figure 3.
| Figure | Groups (n;N)*: Mean (sem) | Test$ | Results | p-value |
|---|---|---|---|---|
| 3C (left) | dSPNCtrl (23;5): 26.05 (77.83) dSPNAtg7cKO (13;4): 2172 (145.6) | Two-tailed, unpaired t test | T34 = 2.888 | 0.0067 |
| 3C (right) | iSPNCtrl (12;3): 2640 (128.4) iSPNAtg7cKO (16;3): 2556 (90.11) | Two-tailed, unpaired t test | T26 = 0.5380 | 0.5952 |
| 3D (left) | dSPNCtrl (22;5) dSPNAtg7cKO (12;4) | Two-way repeated measures ANOVA | Distance: F(18,576) = 198.9 Genotype: F(1,32) = 7.124 Interaction: F(18,576) = 2.981 | Distance:<0.0001 Genotype: 0.0118 Intx:<0.0001 |
| 3D (right) | iSPNCtrl (13;3) iSPNAtg7cKO (16;3) | Two-way repeated measures ANOVA | Distance: F(18,486) = 204.9 Genotype: F(1,27) = 0.8747 Interaction: F(18,486) = 0.5927 | Distance:<0.0001 Genotype: 0.3580 Intx: 0.9057 |
| 3E (left) | dSPNCtrl (15;5): 1.428 (0.062) dSPNAtg7cKO (13;4): 0.8928 (0.066) | Two-tailed, unpaired t test | T26 = 4.286 | 0.0002 |
| 3E (right) | iSPNCtrl (8;3): 1.062 (0.07246) iSPNAtg7cKO (8;3): 1.054 (0.06648) | Two-tailed, unpaired t test | T16 = 0.07856 | 0.9384 |
| 3G (left) | dSPNCtrl (21;5): 3.435 (0.2402) dSPNAtg7cKO (25;4): 2.155 (0.1928) | Two-tailed, unpaired t test | T44 = 4.206 | 0.0001 |
| 3G (right) | iSPNCtrl (22;5): 3.192 (0.2325) iSPNAtg7cKO (26;4): 3.344 (0.2382) | Two-tailed, unpaired t test | T46 = 0.4523 | 0.6531 |
| 3H (left) | dSPNCtrl (19;5): −11.03 (0.5341) dSPNAtg7cKO (26;4): −9.174 (0.4162) | Two-tailed, unpaired t test | T43 = 2.788 | 0.0079 |
| 3H (right) | iSPNCtrl (23;5): −9.669 (0.4282) iSPNAtg7cKO (26;4): −9.417 (0.3507) | Two-tailed, unpaired t test | T47 = 0.4599 | 0.647 |
| 3J (left) | dSPNCtrl (17;5): 3.351 (0.2287) dSPNAtg7cKO (23;4): 3.000 (0.2634) | Two-tailed, unpaired t test | T38 = 0.9654 | 0.3404 |
| 3J (right) | iSPNCtrl (20;5): 3.480 (0.2026) iSPNAtg7cKO (25;4): 3.708 (0.2449) | Two-tailed, unpaired t test | T43 = 0.6942 | 0.4913 |
| 3K (left) | dSPNCtrl (17;5): 9.972 (0.3499) dSPNAtg7cKO (22;4): 9.346 (0.5072) | Two-tailed, unpaired t test | T37 = 0.9558 | 0.3454 |
| 3K (right) | iSPNCtrl (21;5): 9.950 (0.3571) iSPNAtg7cKO (24;4): 9.409 (0.3485) | Two-tailed, unpaired t test | T43 = 1.081 | 0.2859 |
-
*n is the number of cells, N is the number of mice.
$ Post hoc analysis: for two way ANOVA, we used Bonferroni post-hoc test. For one way ANOVA, we used the Holm-Sidak posthoc test.
Table 3
Intrinsic excitability in dSPNs from control, dSPNAtg7cKO, and iSPNAtg7cKO mice.
| Genotype | RMP (mV) | Rin (MΩ) | Rheobase (pA) | Capacitance (pF) | Kir2 current density (pA/pF) |
|---|---|---|---|---|---|
| dSPNControl | −77.39 ± 0.8508 (24) | 145.7 8.110 (24) | 175 6.285 (24) | 80.28 ± 4.808 (22) | −16.59 ± 0.8121 (20) |
| dSPNAtg7cKO | −77.75 ± 0.9328 (30) | 189.3 12.52 (25) ** | 156.1 9.409 (26) | 62.22 ± 4.766 (27) * | −17.05 ± 0.8715 (22) |
| dSPNs from iSPNAtg7cKO | −78.40 ± 0.7481 (16) | 129.1 8.452 (14) | 177.8 8.685 (14) | 81.58 ± 4.728 (14) | −15.20 ± 1.675 (14) |
Key resources table
| Reagent type (species) or resource | Designation | Source or reference | Identifiers | Additional information |
|---|---|---|---|---|
| Gene (Mouse) | Atg7 | Ensembl:ENSMUSG00000030314 | ||
| Gene (Mouse) | Atg5 | Ensembl:ENSMUSG00000038160 | ||
| Strain, strain background (M. musculus, Male and Female) | C57/Bl6J | |||
| Strain, strain background (E. coli) | DH5α | ThermoFisher | Cat # 18265017 | |
| Genetic reagent (Mouse) | B6.Cg-Tg(Drd1a-tdTomato)6Calak/J | Jackson Laboratories | RRID: IMSR_JAX:016204 | |
| Genetic reagent (Mouse) | Tg(Adora2a-cre)KG139Gsat | MMMRC | RRID:MMRRC_031168-UCD | |
| Genetic reagent (Mouse) | Tg(Drd1-cre)EY262Gsat | MMMRC | RRID:MMRRC_030989-UCD | |
| Genetic reagent (Mouse) | Atg7tm1.1Tchi/Atg7tm1.1Tchi | Gift of Masaaki Komatsu | RRID:MGI:3590136 | (Komatsu et al., 2005) |
| Genetic reagent (Mouse) | 129S1/Sv-Hprttm1(CAG-cre)Mnn/J | (Tang et al., 2002) | RRID:IMSR_JAX:004302 | |
| Cell line (Mouse) | Atg5-/- transformed MEF | Gift of Ana Maria Cuervo; (Kuma et al., 2004) | RRID:CVCL_0J75 | |
| Cell line (Mouse) | Atg5+/+ transformed MEF | Gift of Ana Maria Cuervo; (Kuma et al., 2004) | ||
| Cell line (Mouse) | Atg7-/- primary MEF | This study | See Materials and methods | |
| Cell line (Mouse) | Atg7+/+ primary MEF | This study | See Materials and methods | |
| Antibody | Rabbit anti-Red fluorescent protein polyclonal | Rockland | Cat # 600-401-379 | See Table S3 in Supplementary file 1 |
| Antibody | Rabbit anti-DARPP32 monoclonal | Cell Signaling Technology | Cat # 2306S | See Table S3 in Supplementary file 1 |
| Antibody | Mouse anti-beta actin monoclonal | Novus Biologicals | Cat # NB600-501 | See Table S3 in Supplementary file 1 |
| Antibody | Mouse anti-Kir2.1 monoclonal | Antibodies Incorporated | Item # 73–210 RRID:AB_11000720 | See Table S3 in Supplementary file 1 |
| Antibody | Mouse anti-Kir2.3 monoclonal | Antibodies Incorporated | Item # 75–069 RRID:AB_2130742 | See Table S3 in Supplementary file 1 |
| Antibody | Mouse anti-Kv1.2 monoclonal | Antibodies Incorporated | Item # 75–008 RRID:AB_2296313 | See Table S3 in Supplementary file 1 |
| Antibody | Rabbit anti-PSD95 polyclonal | Abcam | Cat # Ab18258 | See Table S3 in Supplementary file 1 |
| Antibody | Guinea pig anti p62 polyclonal | American Research Products | Cat # 03-GP62-C | See Table S3 in Supplementary file 1 |
| Antibody | Rabbit anti p62 polyclonal | MBL | Cat # PM045 | See Table S3 in Supplementary file 1 |
| Antibody | Rabbit anti LC3B polyclonal | Novus Biologicals | Cat # NB600-1384 | See Table S3 in Supplementary file 1 |
| Antibody | Chicken anti GFP polyclonal | Abcam | Cat # Ab13970 | See Table S3 in Supplementary file 1 |
| Antibody | Rat anti Lamp1 monoclonal | Iowa Hybridoma Bank | Cat # 1D4B | See Table S3 in Supplementary file 1 |
| Antibody | Rabbit anti Kir2.1 polyclonal | Alomone Labs | Cat # APC-026 | See Table S3 in Supplementary file 1 |
| Antibody | Mouse anti ubiquitin antibody monoclonal VU-1 | LifeSensors | Cat # VU101 | See Table S3 in Supplementary file 1 |
| Antibody | Mouse anti-acetyl-lysine monoclonal, clone 4G12 | Millipore | Cat # 05–515 | See Table S3 in Supplementary file 1 |
| Antibody | Mouse Anti-Flag M2 monoclonal | Sigma | Cat # F1804 | See Table S3 in Supplementary file 1 |
| Antibody | Rabbit anti-HA polyclonal | Abcam | Cat # ab9110 | See Table S3 in Supplementary file 1 |
| Antibody | Mouse anti-NeuN, monoclonal clone A60 | Millipore | Cat # MAB377 | See Table S3 in Supplementary file 1 |
| Antibody | Rabbit Anti-Atg7 (D12B11) monoclonal | Cell Signaling Technology | Cat # 8558 | See Table S3 in Supplementary file 1 |
| Antibody | Mouse anti-Tubulin (TU-01) | Invitrogen | Cat # 13–8000 | See Table S3 in Supplementary file 1 |
| Antibody | Pierce Protein A/G Magnetic Beads | Thermo | Cat # 88802 | See Table S3 in Supplementary file 1 |
| Antibody | Goat anti Guinea Pig IgG (H+L) Secondary antibody, Alexa 488 | Invitrogen | Cat # A-11073 | See Table S3 in Supplementary file 1 |
| Antibody | Goat anti Guinea Pig IgG (H+L) Secondary antibody, Alexa 647 | Invitrogen | Cat # A-24150 | See Table S3 in Supplementary file 1 |
| Antibody | Donkey anti-Rabbit IgG (H+L) Secondary Antibody, Alexa 488 | Invitrogen | Cat # A-21206 | See Table S3 in Supplementary file 1 |
| Antibody | Donkey anti-Rabbit IgG (H+L) Secondary Antibody, Alexa 594 | Invitrogen | Cat # A-21207 | See Table S3 in Supplementary file 1 |
| Antibody | Goat anti-Mouse IgG1 (H+L) Secondary Antibody, Alexa 488 | Invitrogen | Cat # A-21121 | See Table S3 in Supplementary file 1 |
| Antibody | Donkey anti-Mouse IgG1 (H+L) Secondary Antibody, Alexa 594 | Invitrogen | Cat # A-21125 | See Table S3 in Supplementary file 1 |
| Antibody | Goat anti-Chicken IgY (H+L) Secondary Antibody, Alexa 488 | Invitrogen | Cat # A-11039 | See Table S3 in Supplementary file 1 |
| Antibody | Goat anti-Rat IgG1 (H+L) Secondary Antibody, Alexa 647 | Invitrogen | Cat # A-21248 | See Table S3 in Supplementary file 1 |
| Antibody | Donkey anti-Rabbit IgG (H+L) Secondary IRDye 680LT | LI-COR | P/N 925–68023 | See Table S3 in Supplementary file 1 |
| Antibody | Streptavidin, Alexa 488 conjugate | Invitrogen | S11223 | See Table S3 in Supplementary file 1 |
| Antibody | Donkey anti-Mouse IgG (H+L) conjugated to HRP | Jackson Immunoresearch | Code: 715-035-151 | See Table S3 in Supplementary file 1 |
| Antibody | Donkey anti-Rabbit IgG (H+L) conjugated to HRP | Jackson Immunoresearch | Code: 715-035-152 | See Table S3 in Supplementary file 1 |
| Recombinant DNA reagent | AAVDJ-CMV-DIO-Kir2.1-t2A-ZsGreen | Stanford Viral Vector Core (Rothwell et al., 2014) | AAV61 | |
| Recombinant DNA reagent | AAV2-EF1a-DIO-mCherry (3.2 × 10¹² viral genomes/mL) | UNC Viral Vector Core | ||
| Recombinant DNA reagent | AAVDJ-hSyn-FLEX-mmAtg7-t2A-ZsGreen (1.7 × 10¹³ genome copies/mL) | Vector BioLabs | This study | |
| Sequence-based reagent | RNAScope Multiplex Fluorescent Reagent | Advanced Cell Diagnostics | Cat # 320850 | |
| Sequence-based reagent | RNAScope probe: Mm-Kcnj2 (Kir2.1) | Advanced Cell Diagnostics | Cat # 476261 | |
| Sequence-based reagent | RNAScope probe: Mm-Kcnj4 (Kir2.3) | Advanced Cell Diagnostics | Cat # 525181-C3 | |
| Commercial assay or kit | BCA protein assay kit | ThermoFisher | Cat # 23225 | |
| Commercial assay or kit | Immobilon Western Chemiluminescent HRP Substrate | Millipore | Can # WBKLS0500 | |
| Commercial assay or kit | XhoI | New England Biolabs | Cat # R0146S | |
| Commercial assay or kit | BamHI-HF | New England Biolabs | Cat # R3136S | |
| Commercial assay or kit | HindIII-HF | New England Biolabs | Cat # R3104S | |
| Commercial assay or kit | DpnI | New England Biolabs | Cat # R0176S | |
| Commercial assay or kit | Herculase II fusion DNA polymerase | Agilent Technologies | Cat # 600675 | |
| Commercial assay or kit | dNTP mix | ThermoFisher | Cat # R0191 | |
| Commercial assay or kit | Halt Protease Inhibitor Cocktail (100X) | ThermoFisher | Cat # 78430 | |
| Chemical compound, drug | Bafilomycin A1 | Tocris Biosciences | Cat # 1334 | |
| Chemical compound, drug | Tetrodotoxin citrate | Tocris Biosciences | Cat # 1069/1 | |
| Chemical compound, drug | Picrotoxin | Tocris Biosciences | Cat # 1128/1G | |
| Chemical compound, drug | SNAP-Cell 505-Star | New England Biolabs | Cat # S9103S | |
| Chemical compound, drug | SNAP-Cell TMR-Star | New England Biolabs | Cat # S9105S | |
| Chemical compound, drug | Neurobiotin tracer | Vector Laboratories | Cat # SP-1120 | |
| Chemical compound, drug | TrypLE | ThermoFisher | Cat # 12604054 | |
| Chemical compound, drug | Trichostatin A | Tocris Biosciences | Cat # 1406 | |
| Chemical compound, drug | Nicotinamide | Tocris Biosciences | Cat # 4106 | |
| Chemical compound, drug | N-ethylmaleimide | Sigma | Cat # E3876 | |
| Chemical compound, drug | PR-619 | Sigma | Cat # SML0430 | |
| Software, algorithm | Igor | Wavemetrics | RRID:SCR_000325 | |
| Software, algorithm | pClamp | Molecular Devices | RRID:SCR_011323 | |
| Software, algorithm | Image Studio Lite | LI-COR | RRID:SCR_014211 | |
| Software, algorithm | Benchling | RRID:SCR_013955 | ||
| Software, algorithm | GraphPad Prism 7 | RRID:SCR_002798 | ||
| Software, algorithm | ImageJ | NIH | RRID:SCR_003070 |
Additional files
-
Source data 1
Source data for all Figures.
- https://cdn.elifesciences.org/articles/50843/elife-50843-data1-v2.xlsx
-
Source code 1
Source code for peak identification.
- https://cdn.elifesciences.org/articles/50843/elife-50843-code1-v2.rtf
-
Supplementary file 1
Supplemental Tables.
- https://cdn.elifesciences.org/articles/50843/elife-50843-supp1-v2.docx
-
Transparent reporting form
- https://cdn.elifesciences.org/articles/50843/elife-50843-transrepform-v2.pdf
Download links
A two-part list of links to download the article, or parts of the article, in various formats.
Downloads (link to download the article as PDF)
Open citations (links to open the citations from this article in various online reference manager services)
Cite this article (links to download the citations from this article in formats compatible with various reference manager tools)
Cell-type-specific regulation of neuronal intrinsic excitability by macroautophagy
eLife 9:e50843.
https://doi.org/10.7554/eLife.50843


