Single-molecule observation of ATP-independent SSB displacement by RecO in Deinococcus radiodurans
- Department of Chemistry, Seoul National University, Republic of Korea
- Laboratory of Chemical Physics, National Institute of Diabetes and Digestive and Kidney Diseases, National Institutes of Health (NIH), United States
- Daegu National Science Museum, Republic of Korea
- Department of Physics, Pohang University of Science and Technology, Republic of Korea
Figures
Figure 1 with 2 supplements
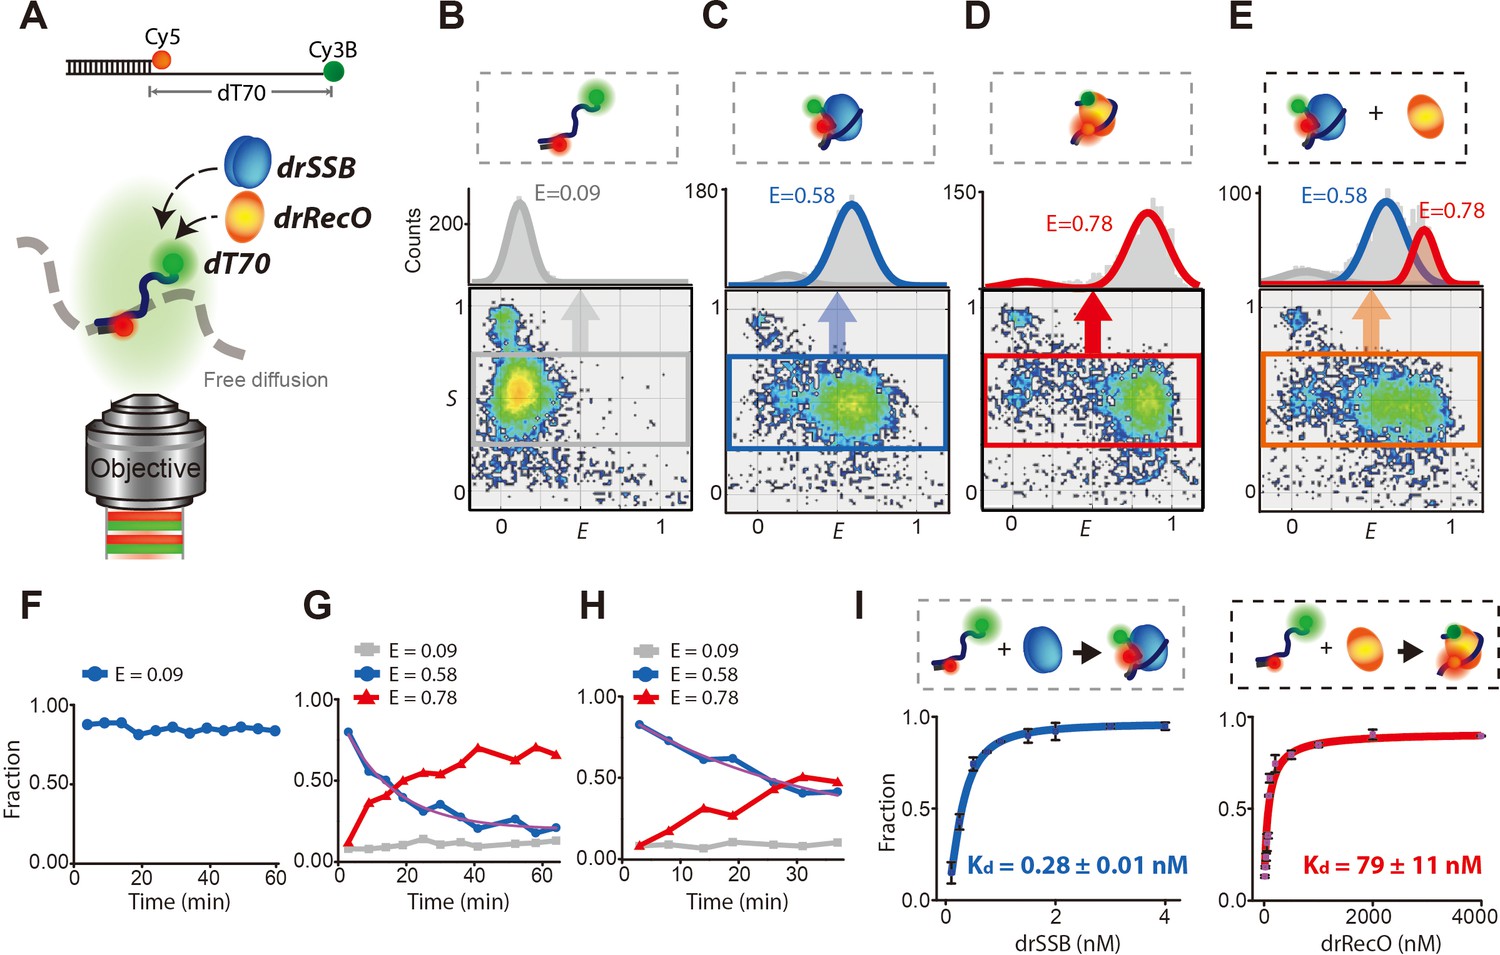
Displacement of drSSB from individual diffusing ssDNA by drRecO.
(A) Schematic illustration of the single-molecule FRET measurement for freely diffusing drSSB- and/or the drRecO–ssDNA complex by ALEX-FRET. Cy3B (donor) and Cy5 (acceptor) were attached to the ends of ssDNAs composed of 70 nucleotides (dT70) and a ssDNA–dsDNA junction, respectively. The donor and acceptor were 70 nt apart, which enabled the monitoring of drSSB or drRecO binding to ssDNA. (B–E) Two-dimensional E-S graphs obtained by ALEX-FRET. E-S graphs are used to select ssDNAs labeled with both donor and acceptor dyes (the gray box in panel B). The 1D FRET histogram of the selected ssDNAs is plotted above the E-S graph: (B) dT70, (C) dT70 + drSSB and (D) dT70 + drRecO. (E) After the formation of the drSSB–dT70 complex was allowed to proceed for 10 min, 500 nM drRecO were added to the mixture. Averaged E values were obtained by fitting 1D FRET histograms with Gaussian function. E = 0.09 (gray lines), 0.58 (blue lines) and 0.78 (red lines) for dT70, drSSB–dT70, and drRecO–dT70, respectively, were obtained. (F–H) Time-dependent population changes of dT70 (E = 0.09), drSSB–dT70 (E = 0.58), and drRecO–dT70 (E = 0.78). The final concentrations of drSSB and dT70 were 200 nM and 100 pM, respectively. In the absence of drRecO, drSSB–dT70 remained stable for more than 60 min (F). The addition of (G) 200 nM and (H) 100 nM drRecO into the preassembled dT70–drSSB complex facilitated drastic changes in the population ratios. The exchange rates (purple lines) were 1.10 × 10⁻³ s−1 and 5.02 × 10⁻⁴s−1 for panels (G) and (H), respectively (see 'Materials and methods'). (I) Measurement of the apparent dissociation constants (Kd) of drSSB–ssDNA and drRecO–ssDNA. The ALEX-FRET method allowed the measurement of the Kd values of drSSB–ssDNA and drRecO–ssDNA (see 'Materials and methods'). From the half-saturation, the Kd values were found to be 0.28 ± 0.01 nM and 79 ± 11 nM for drSSB–ssDNA and drRecO–ssDNA, respectively.
Figure 1—figure supplement 1
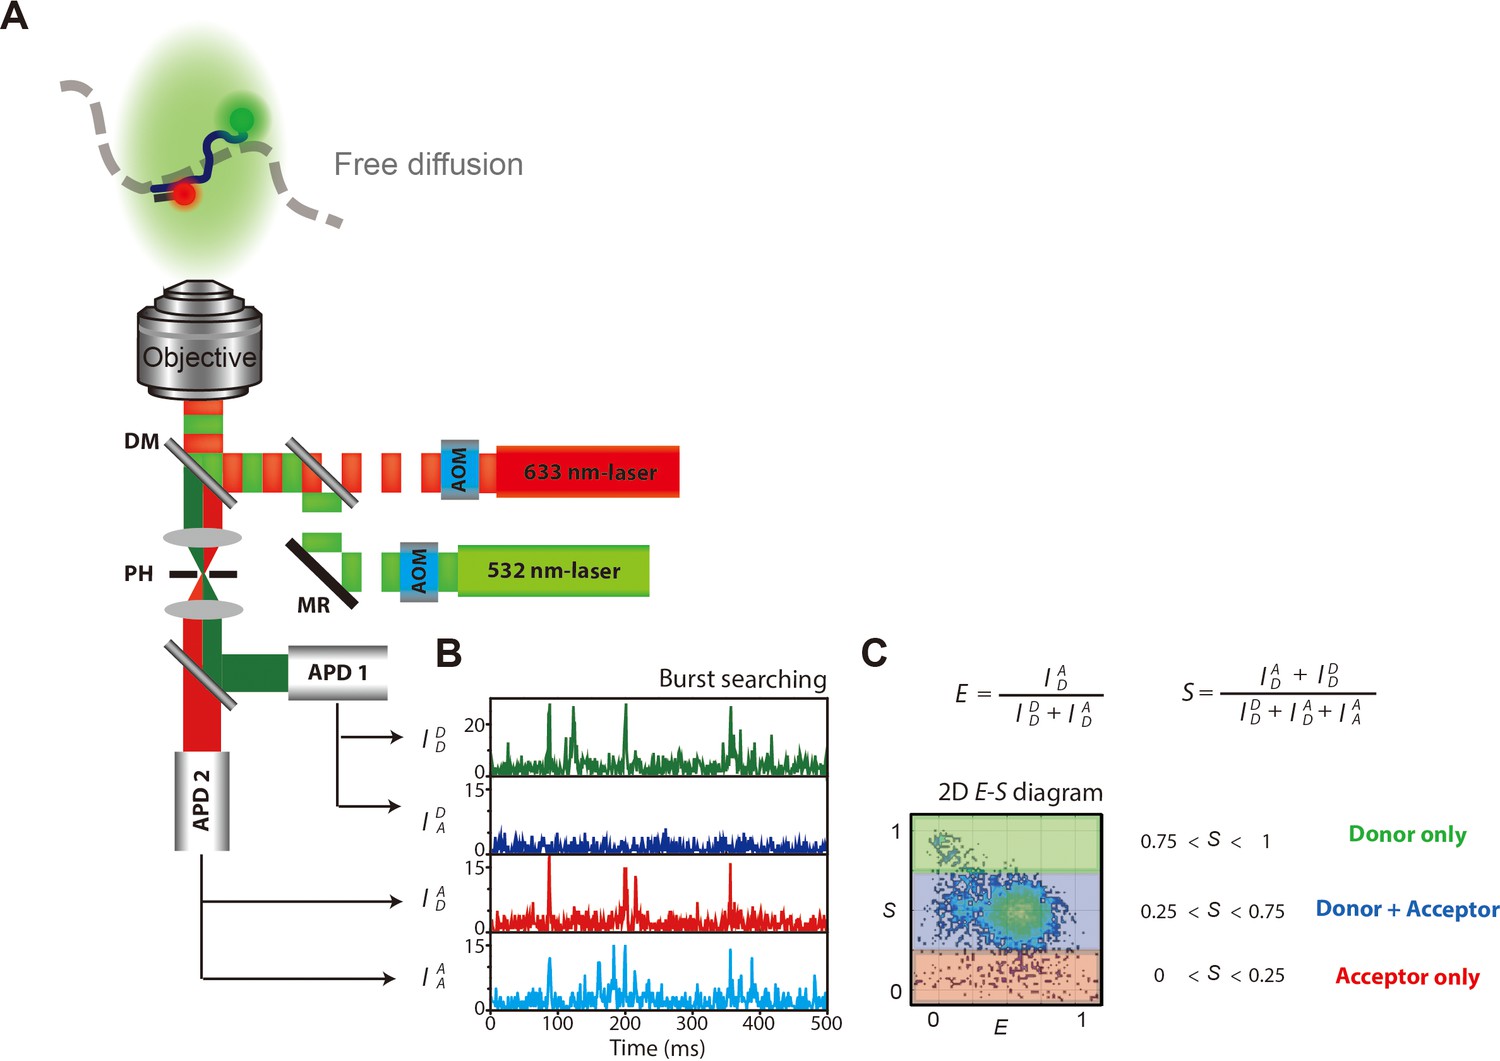
Schematic illustration of ALEX microscope setup and data interpretation.
(A) Schematic description of microscope set-up and data acquisition for ALEX-FRET measurement. (AOM, acoustic optical modulator; MR, mirror; DM, dichroic mirror; PH, pinhole; APD, avalanche photodiode.) Donor and acceptor fluorophores were labeled at the ends of the ssDNA that was composed of poly dT with 70-nt (dT70). (B) Four types of fluorescence from ssDNAs were detected, which were represented as a time-trace. (C) Each burst from the time-trace was selected and assigned its E and S values. Each dot in the 2D E-S graph represents a detected single molecule. Dual-labeled ssDNAs were selected by 0.25 < S < 0.75.
Figure 1—figure supplement 2
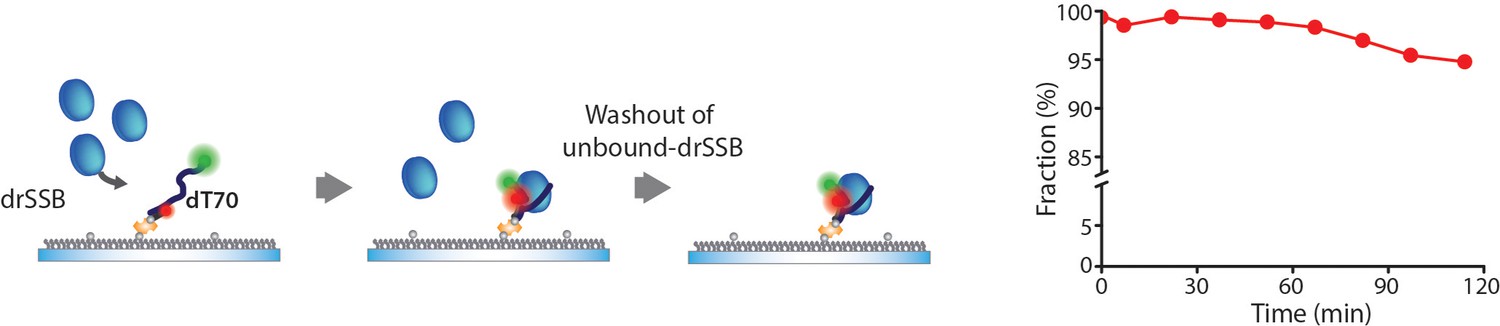
Dissociation kinetics of drSSB–ssDNA.
We performed a surface-tethering experiment to measure the dissociation rate of drSSB by employing a Total internal reflection fluorescence (TIRF) microscope. drSSB was incubated with the surface-tethered dT70 for 5 min, then the free drSSBs were washed out by injecting a buffer. We then measured the fraction of drSSB that was dissociated from dT70. To reduce the artifact of photo-bleaching, we acquired images for 40 s at each time point and checked the non-bleaching of Cy5 by introducing an additional red laser (638 nm CW laser) for 10 s. All data points were acquired from >300 molecules. The fraction of drSSB that was dissociated from dT70 was 5.2% for 2 hr. We sealed the channels and scavenged the dissolved oxygens to protect the fluorophore from damage induced by the oxygen for long-term observation, but the bleaching and blinking of the fluorophores were drastically increased as the acquisition time proceeded over 2 hr.
Figure 2 with 1 supplement
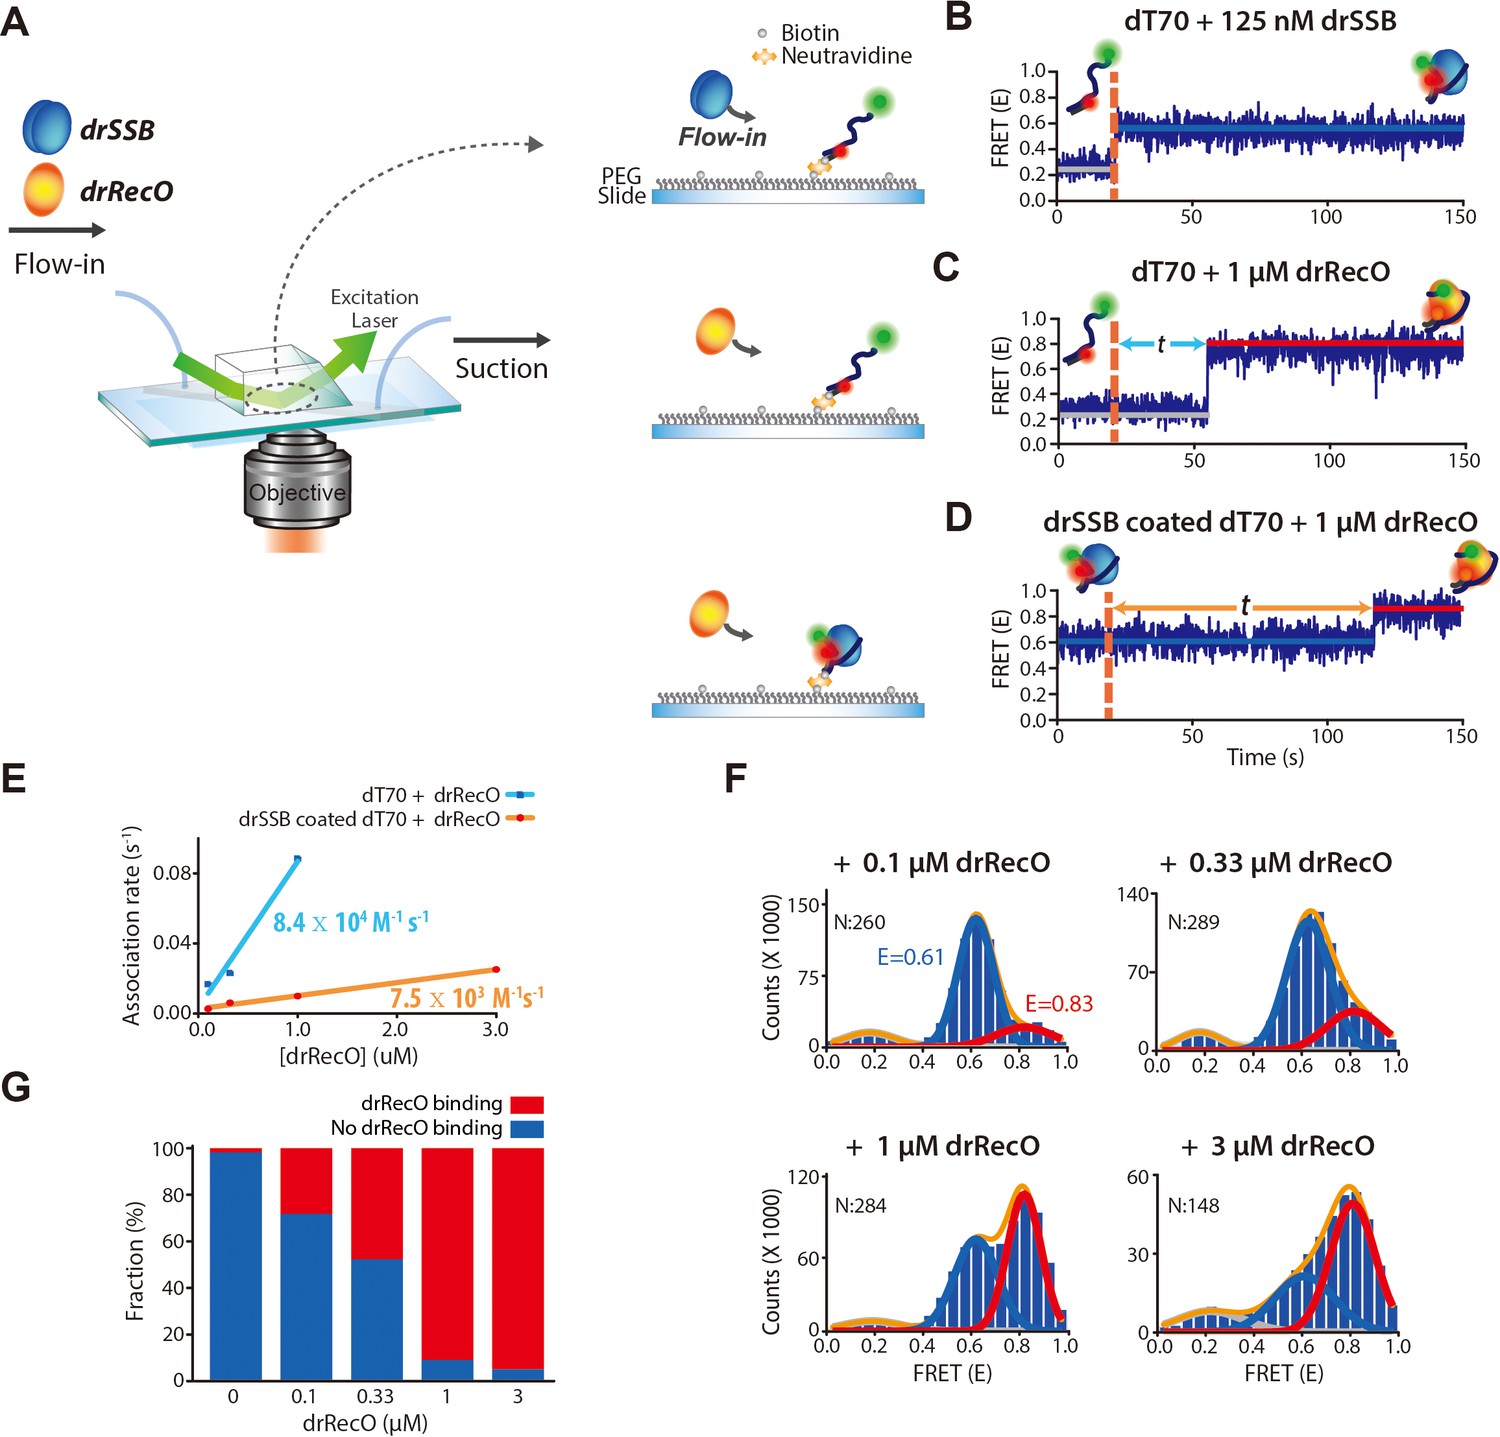
Real-time observation of drSSB displacement from immobilized ssDNA by drRecO.
(A) Schematic descriptions of TIRF microscopy and the experimental scheme for the real-time measurement of drRecO-mediated drSSB displacement from ssDNA. dT70 ssDNA was tethered to the glass surface using the NeutrAvidin–biotin interaction. Then, drSSB and drRecO were allowed to flow into the reaction chamber. All time traces were obtained for 5 min. (B) Single-molecule FRET time trace of dT70 binding to drSSB. drSSB (125 nM) was injected into the flow channel (the dashed line denotes the injection time of drSSB), where dT70 was immobilized on the surface. The FRET efficiency increased from ~0.2 (bare ssDNA) to ~0.6 (drSSB–ssDNA complex) in the time trace. The FRET peak centered at 0.62 for the cumulated histogram of all FRET efficiencies (Figure 2—figure supplement 1A). The FRET change occurred immediately after the addition of drSSB. (C) Single-molecule FRET time-trace of dT70 binding to drRecO. First, 1 μM drRecO was injected into the flow channel (the dashed line denotes the injection time of drRecO), and dT70 was immobilized on the surface. The FRET efficiency was increased from ~0.2 to ~0.8 (drRecO–ssDNA complex). The FRET peak was centered at 0.83 in the FRET distribution for all molecules (Figure 2—figure supplement 1B). The time required for drRecO to bind ssDNA (t) is longer than that for drSSB. (D) Single-molecule FRET time-trace of drSSB displacement from dT70 by drRecO. 125 nM drSSB was injected into the flow channel and incubated for 10 min for the formation of the drSSB–dT70 complex. Then, 1 μM drRecO was injected into the flow channel (the dashed line). During the injection of drRecO, unbound drSSB was washed out. The FRET efficiency increased from ~0.6 to ~0.8, which denote drSSB–dT70 and drRecO–dT70, respectively. Two populations were distinctively separated in the cumulative histogram of all FRET efficiencies (Figure 2—figure supplement 1C). (E) Comparison of the association kinetics of drRecO to dT70 and to the drSSB–dT70 complex. The time required for drRecO to bind ssDNA is marked as t in panels (C) and (D). From the average t, the association rates between drRecO and dT70 and between drRecO and drSSB-coated dT70 were obtained. As the concentration of drRecO increased, the association rates increased. The linear fits yielded the first-order rate constants of 8.4 × 10⁴ M−1·s−1 and 7.5 × 10³ M−1·s−1 for dT70 and drSSB-dT70, respectively. (F) 1D FRET histograms of drSSB displacement by drRecO at different concentrations of drRecO. The cumulative histograms of all FRET efficiencies were obtained by applying different drRecO concentrations to drSSB-coated dT70 in panel (D). N denotes the number of time traces accumulated. The Gaussian fit for each population was used to find the binding fraction of drRecO–dT70 (red lines at E = 0.83). The population at E = 0.61 denotes drSSB–dT70. (G) Fraction of drRecO binding to drSSB–ssDNA complex at various drRecO concentrations. We counted time traces that showed E = 0.8, which indicated the successful replacement of drSSB by drRecO on ssDNA within 5 min of observation time. The number of time traces analyzed is presented in panel (F).
-
Figure 2—source data 1
Data summary table for the results shown in Figure 2E.
- https://cdn.elifesciences.org/articles/50945/elife-50945-fig2-data1-v2.docx
-
Figure 2—source data 2
Data summary table for the results shown in Figure 2G.
- https://cdn.elifesciences.org/articles/50945/elife-50945-fig2-data2-v2.docx
Figure 2—figure supplement 1
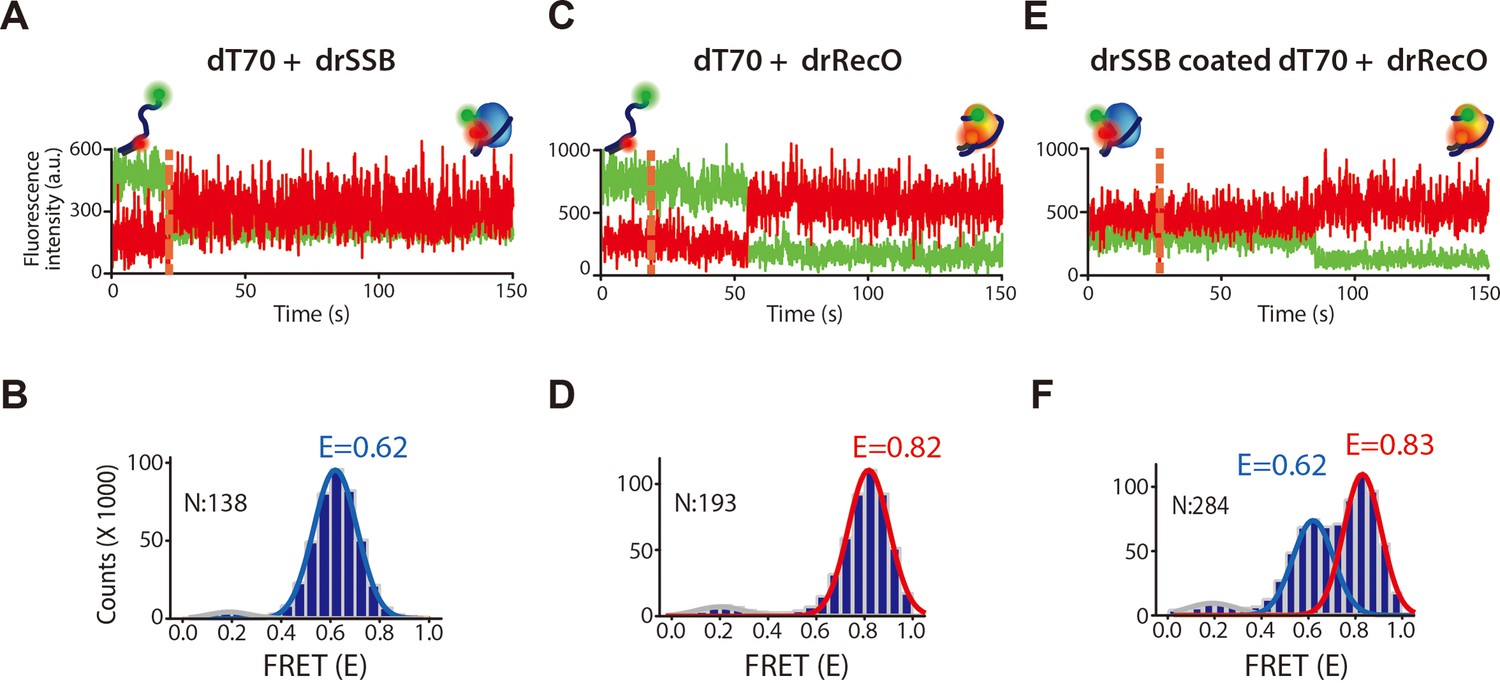
The fluorescence intensity time traces and cumulated FRET histograms of drSSB and drRecO binding to dT70 and drRecO binding to drSSB-coated dT70.
(A, B) The time traces of the donor and acceptor intensity and the cumulated FRET histograms for drSSB binding to dT70, presented in Figure 2B. 138 time traces were accumulated. The FRET peak centered at E = 0.62. (C, D) The time traces of the donor and acceptor intensity and the cumulated FRET histograms for drRecO binding to dT70, presented in Figure 2C. 193 time traces were accumulated. The FRET peak centered at E = 0.82. (E, F) The time traces of the donor and acceptor intensity and the cumulated FRET histograms for drRecO binding to drSSB-coated dT70, presented in Figure 2D. 284 time traces were accumulated. Two binding states of dT70 were distinctively separated as E = 0.62 and E = 0.83, which were the same for each value of drSSB-bound dT70 and drRecO-bound dT70.
Figure 3 with 1 supplement
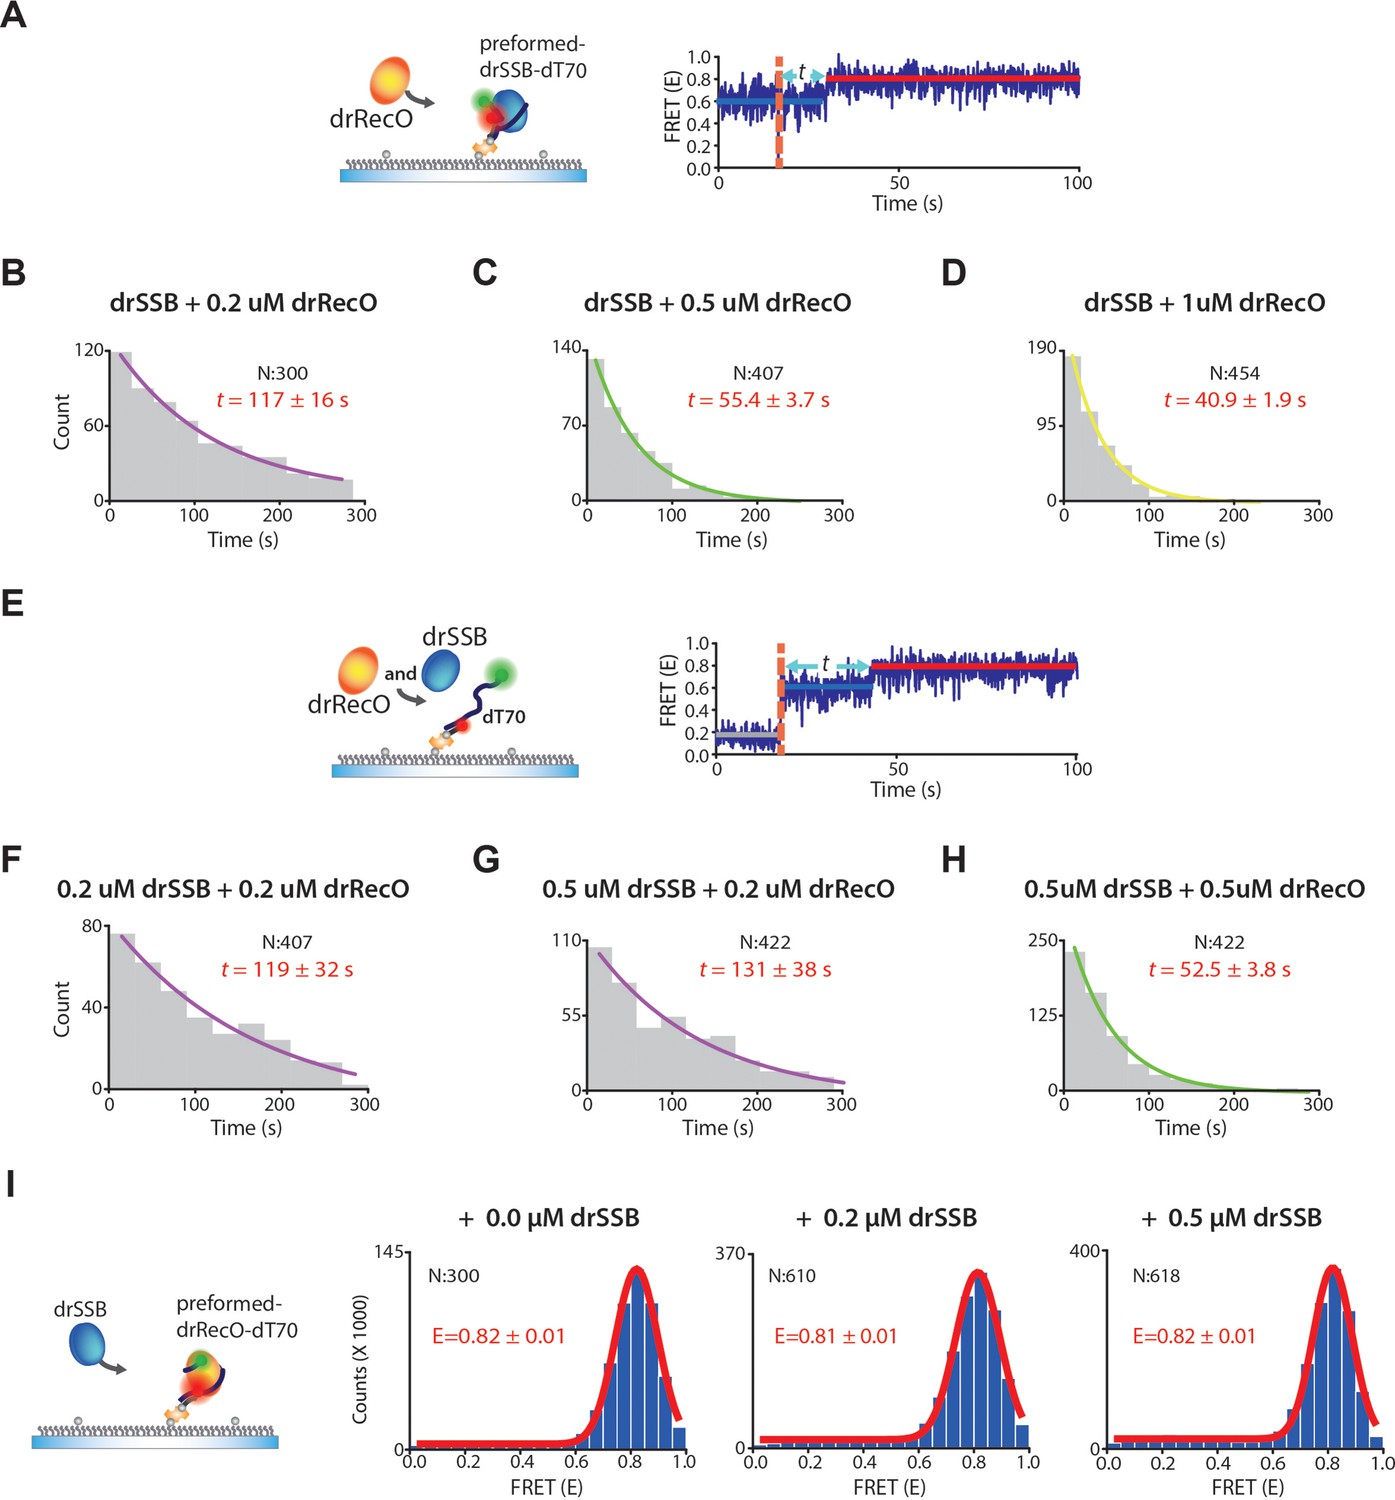
The exchange rates by drRecO in the preformed and competitive conditions.
(A) Schematic illustration of the preformed condition. (B–D) The concentration-dependent exchange rates by drRecO in the preformed condition. drSSB was washed out when drRecO was injected. We added 0.2 μM, 0.5 μM, and 1.0 μM drRecO, respectively. (E) Schematic illustration of the competitive condition. We added drRecO and drSSB simultaneously. (F–H) The concentration-dependent rates of drRecO exchange in the competitive condition. We added (F) 0.2 μM drSSB and 0.2 μM drRecO, (G) 0.5 μM drSSB and 0.2 μM drRecO SSB, and (H) 0.5 μM drSSB and 0.5 μM drRecO, respectively. The exchange rate is primarily affected by the concentration of drRecO, whereas the concentration of drSSB does not notably change the rate. (I) Schematic illustration and the FRET histogram at various concentrations of drSSB to confirm whether drSSB displaces drRecO from the preformed drRecO–dT70 complex in real-time TIRF measurement. FRET values of drRecO–dT70 were not affected by drSSB. Thus, drSSB does not displace drRecO from the preformed drRecO–dT70.
Figure 3—figure supplement 1
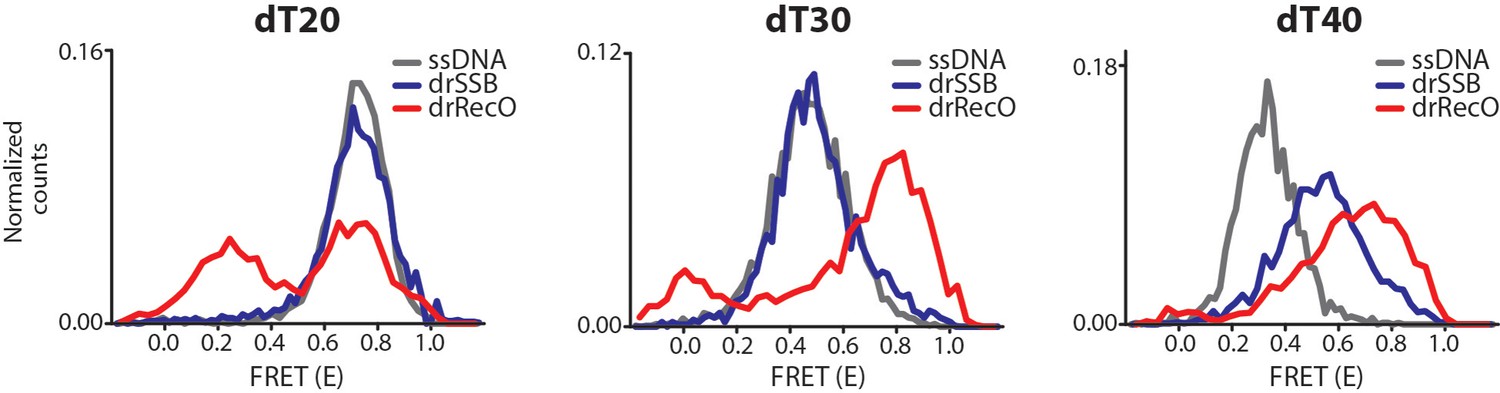
Observation of drSSB and drRecO binding to short ssDNAs (dT20, dT30 and dT40) by ALEX-FRET.
We performed additional experiments to understand why the reverse reaction was not favored. The number of free nucleotides may be an important factor. To check this possibility, we used ALEX-FRET to observe the binding between the proteins and short ssDNAs and to measure how many nucleotides are required to load drSSB and drRecO onto ssDNA. Either 500 nM drSSB or 2 μM drRecO were incubated with ssDNAs (dT20, dT30 and dT40) for 30 min to construct fully bound complexes. drRecO changed the FRET values of all ssDNAs of dT20, dT30 and dT40, which indicates high and low FRET values that correspond to fully bound and partially bound complexes. However, compared to drRecO, drSSB only changed the FRET value of dT40. drSSB binds to ssDNA with 47–54 nt to form fully wrapped drSSB–ssDNA complexes (Witte et al., 2005). Thus, drSSB seemed to make a partially bound complex with dT40 and did not bind to dT20 and dT30. drRecO formed a nearly fully bound complex with dT30 and dT40 and a partially bound complex with dT20. Thus, it is possible that drSSB may not displace the resident drRecO from the preformed drRecO–ssDNA complex because drSSB requires a high number of free nucleotides for ssDNA binding compared to drRecO.
Figure 4 with 2 supplements
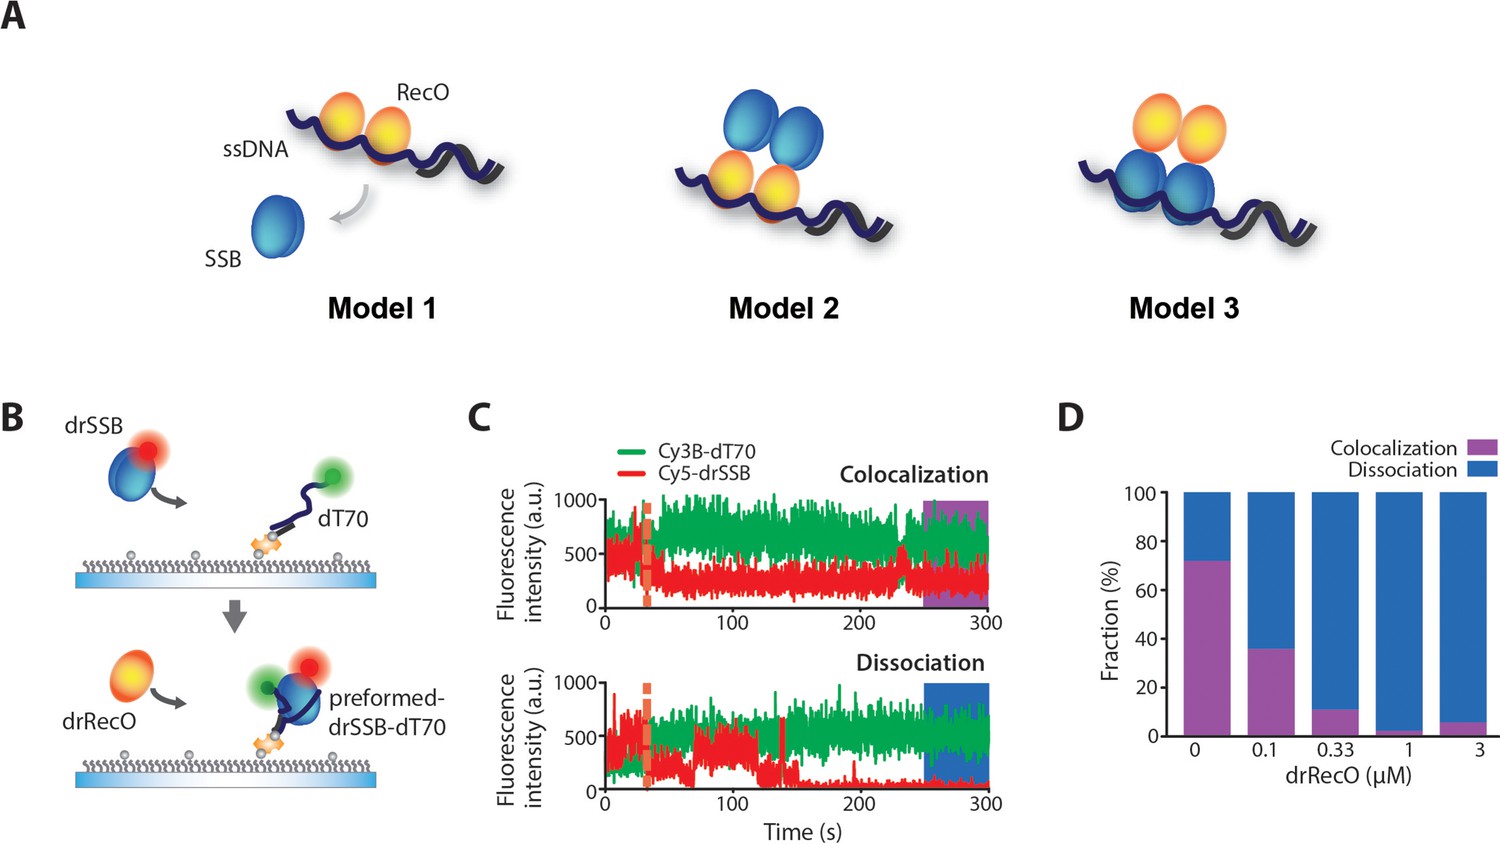
Colocalization of drSSB and ssDNA after drSSB displacement by drRecO.
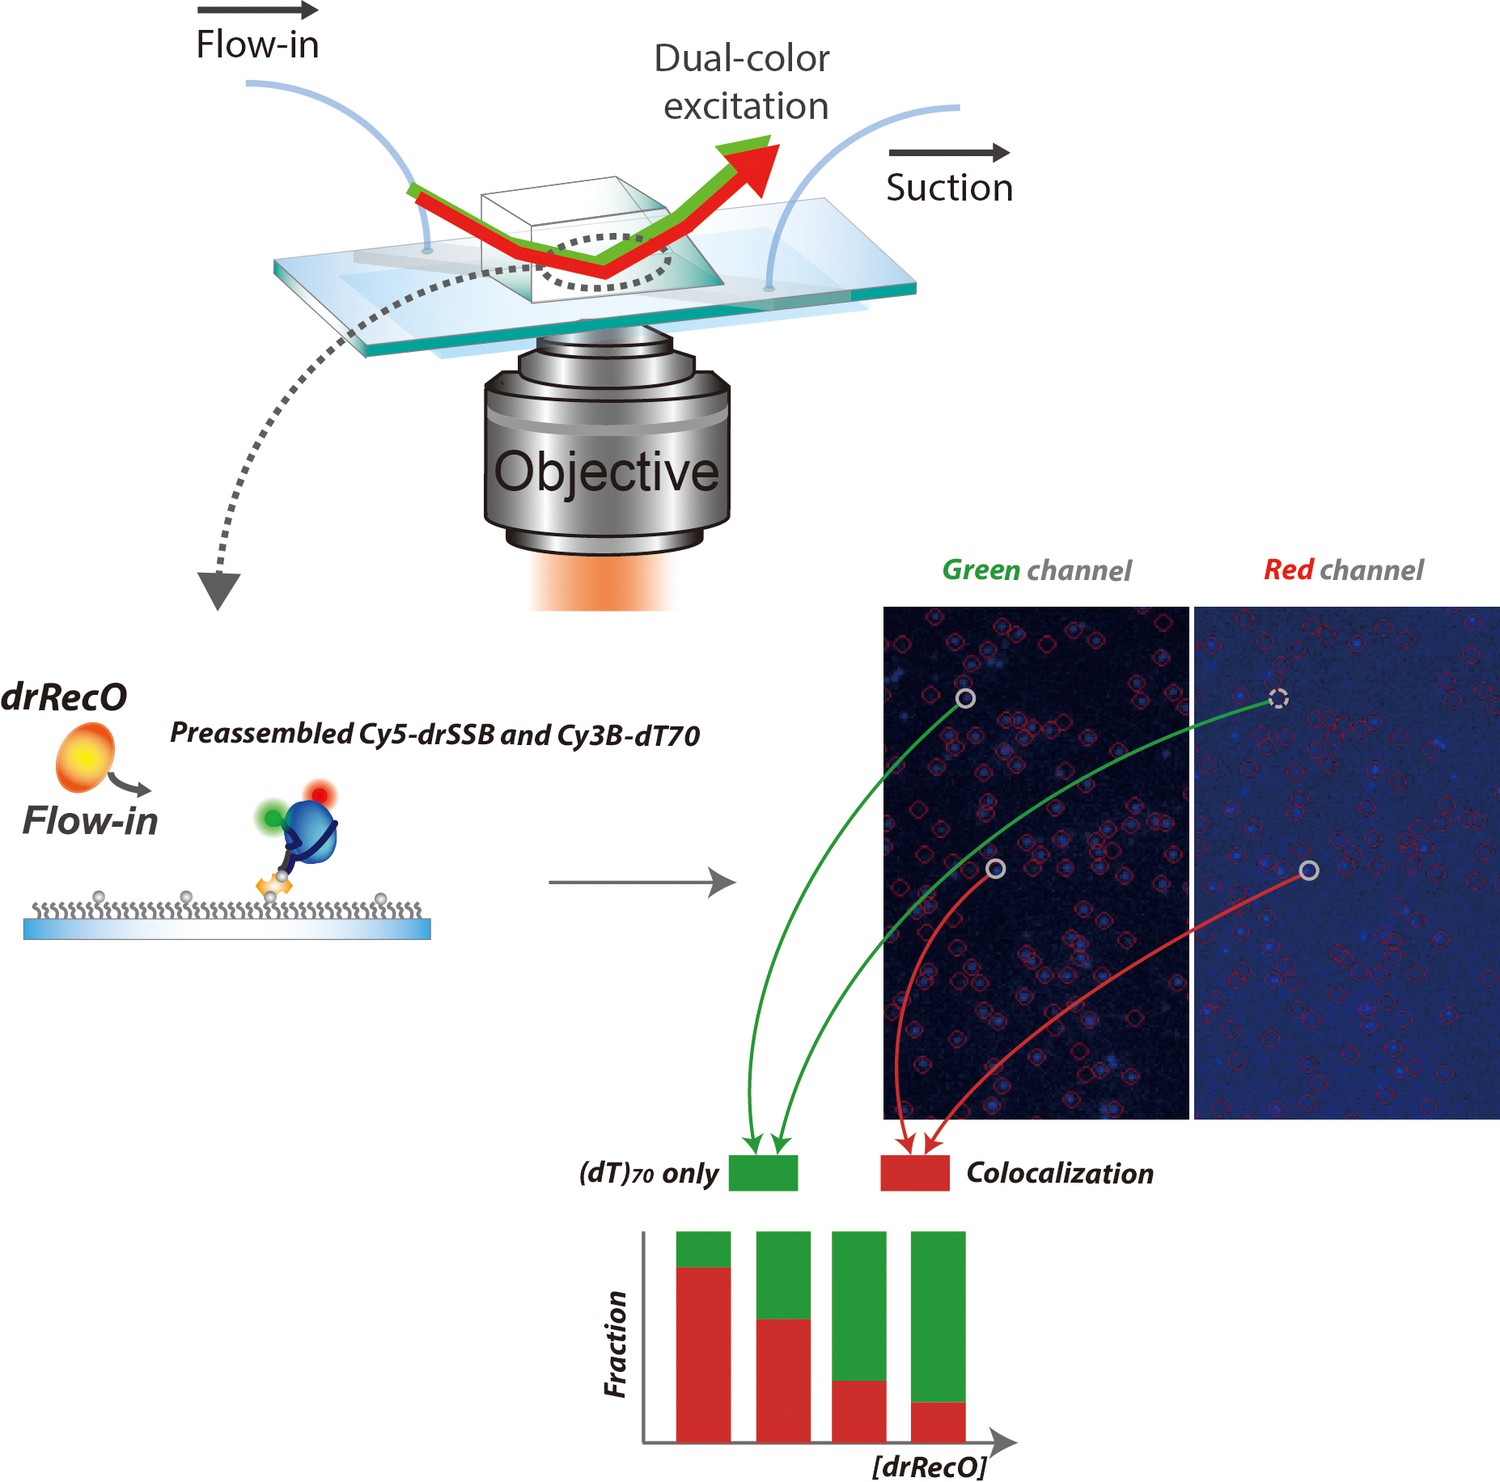
(A) Three models of SSB displacement from ssDNA by RecO. In Model 1, SSB is completely dissociated from ssDNA by RecO. In Model 2, RecO displaces SSB, but SSB remains on the complex by binding to RecO. In Model 3, RecO does not dissociate SSB from ssDNA but alters the motion of SSB. (B) A schematic representation of the drRecO-dependent colocalization measurement of Cy5–drSSB and Cy3B–dT70 using two-color TIRF microscopy. Cy5–drSSB was preincubated with surface-tethered Cy3b–dT70 to form drSSB–dT70 complex. Then, drRecO was flowed through the reaction chamber. During the injection of drRecO, unbound drSSB was washed out. (C) Representative time trajectories of the colocalization of drSSB and dT70 (top panel) and the dissociation of drSSB from dT70 by drRecO (bottom panel). The orange dashed line indicates the time of drRecO injection. The ratio of colocalization was obtained from the trajectories at 4.5 min after the addition of drRecO. (D) Colocalization fractions of drSSB and dT70 at various concentrations of drRecO. Higher concentrations of drRecO induced more dissociation between drSSB and dT70, implying that drRecO induces the dissociation of drSSB from ssDNA, as shown in Model 1.
-
Figure 4—source data 1
Data summary table for the results shown in Figure 4D.
- https://cdn.elifesciences.org/articles/50945/elife-50945-fig4-data1-v2.docx
Figure 4—figure supplement 1
Colocalization measurement of fluorescently labeled drSSB and ssDNA.
Schematic representation of the prism-type TIRF system and the inside of a flow channel on a microscope slide. Fluorescently labeled drSSB and ssDNA were used. dT70 was labeled with Cy3B on its 3′ overhang (Cy3B–dT70) and immobilized on a polyethylene glycol (PEG)-coated surface using the biotin–neutravidin interaction. The G120C drSSB mutant was used for Cy5 labeling (Cy5–drSSB). ssDNA–drSSB complex was pre-formed by adding 10 nM Cy5–drSSB to the flow channel, which was incubated for 10 min. Then, we added various concentrations of drRecO into the flow channel. Colocalization of ssDNA and drSSB was measured by matching the positions of the green and red spots, which were Cy3B–ssDNA and Cy5–drSSB, respectively. As the concentration of drRecO was increased, the displacement of drSSB occurred more effectively. If drSSB tethers on ssDNA in the presence of drRecO, however, the fraction of co-localization of drSSB and ssDNA will be independent of the concentrations of drRecO injected. If drSSB dissociates from ssDNA after drRecO replacement, the fraction of colocalization of ssDNA and drSSB will be reduced as the concentration of drRecO is increased. The result in Figure 4D corresponds to the latter case, where drSSB dissociates from ssDNA.
Figure 4—figure supplement 2
Measurement of photo-bleaching and blinking on TIRF imaging.
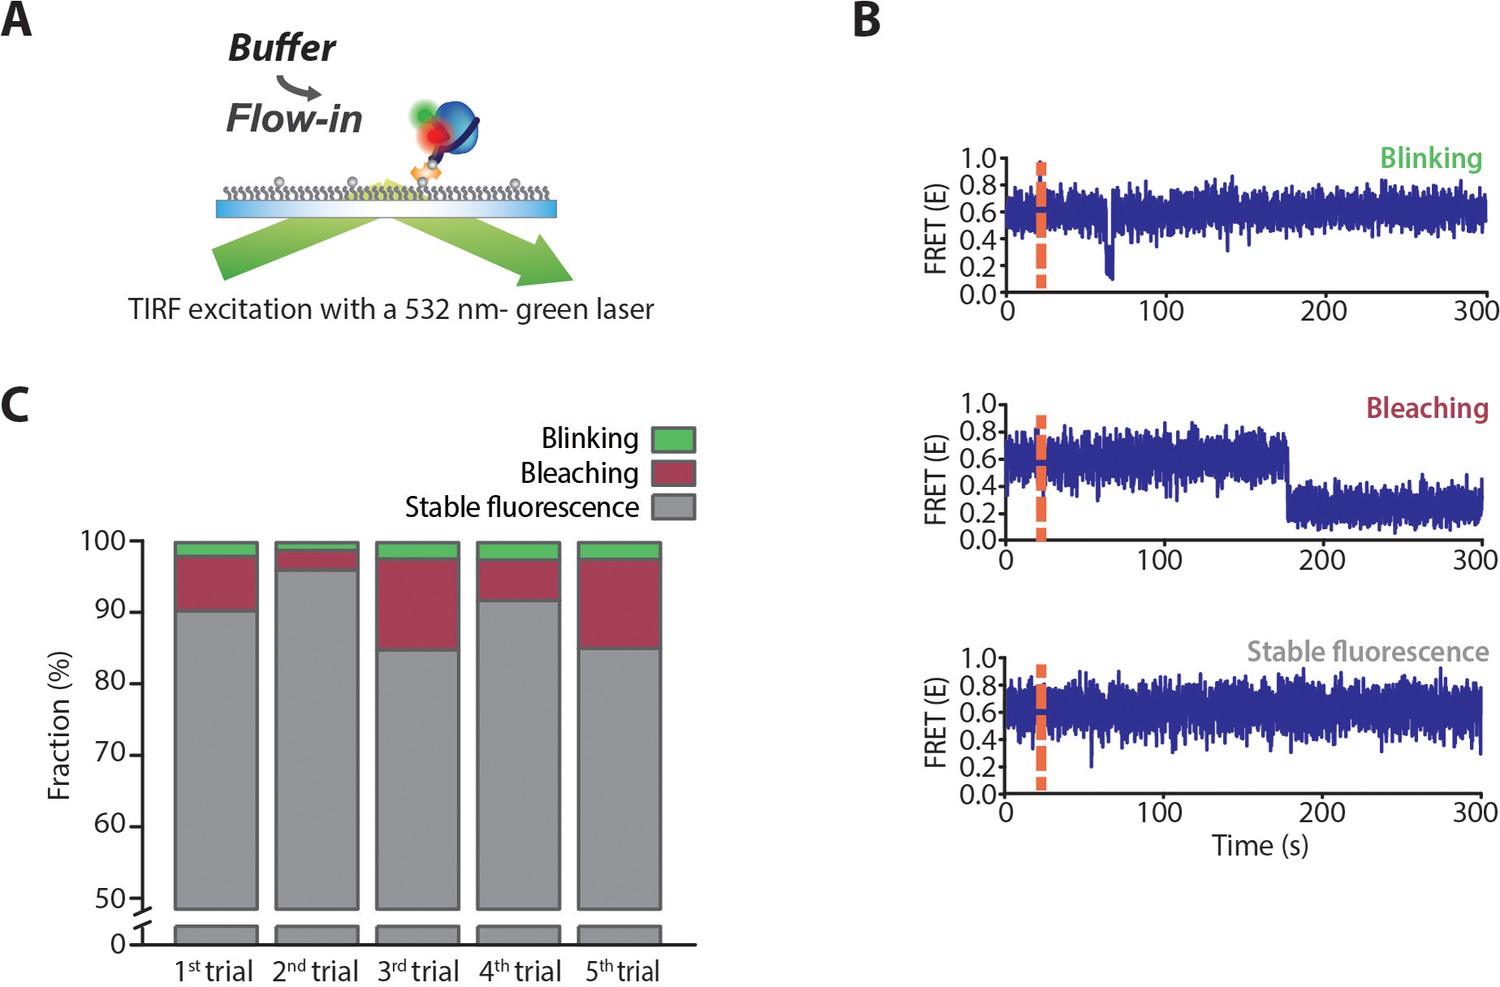
(A) Schematic representation of the measurement of blinking (a temporary dark state of fluorophore) and bleaching (permanent ‘switching off’) of the acceptor in the smFRET experiment using TIRF microscopy. Dual-labeled dT70 was immobilized on the glass surface and excited by a continuous-wave green laser of 532 nm. Since bleaching and blinking of a fluorophore can be easily affected by its local environments, especially by proteins, we used drSSB-bound dT70 complex to count these frequencies. 125 nM drSSB was added and incubated with dT70 for 10 min to form a stable drSSB–dT70 complex. Then, unbound drSSB was washed away with a buffer. (B) Representative time traces for photo blinking and photobleaching. Even though the solution contains reagents that prevent the blinking and bleaching of fluorophore, photo-blinking and bleaching of fluorescence signal were observed in the time trajectories as well as in the stable fluorescence signal (stable fluorescence). (C) Fractions of the molecules showing photo-blinking, bleaching, and stable fluorescence obtained from five independent measurements. Photo-blinking occurs in less than 3% of molecules, while photo-bleaching occurs in approximately 10% of molecules. The fraction of photo-bleaching showed a large variation for each measurement.
Figure 5

Observation of the intermediate state during drSSB displacement from ssDNA by drRecO.
(A) Schematic illustration of the binding of drRecO to the preassembled drSSB–dT70 complex. The same measurement is presented in Figure 2D. (B, C) FRET time traces of the binding of drRecO to the preassembled drSSB–dT70 complex. The orange dashed lines indicate the time at which 1 µM drRecO was applied. Most time traces exhibited no intermediate state, as shown in panel (B). Approximately 2% of the time traces presented an intermediate state with E = ~0.2, as shown in panel (C). (D) A possible model for the intermediate state of a trimer (drRecO–ssDNA–drSSB) formed before drSSB displacement from the complex. The low E value (~0.2) indicates that ssDNA has a relatively stretched form.
Figure 6 with 2 supplements
Real-time observation of drRecO binding to various lengths of ssDNA.
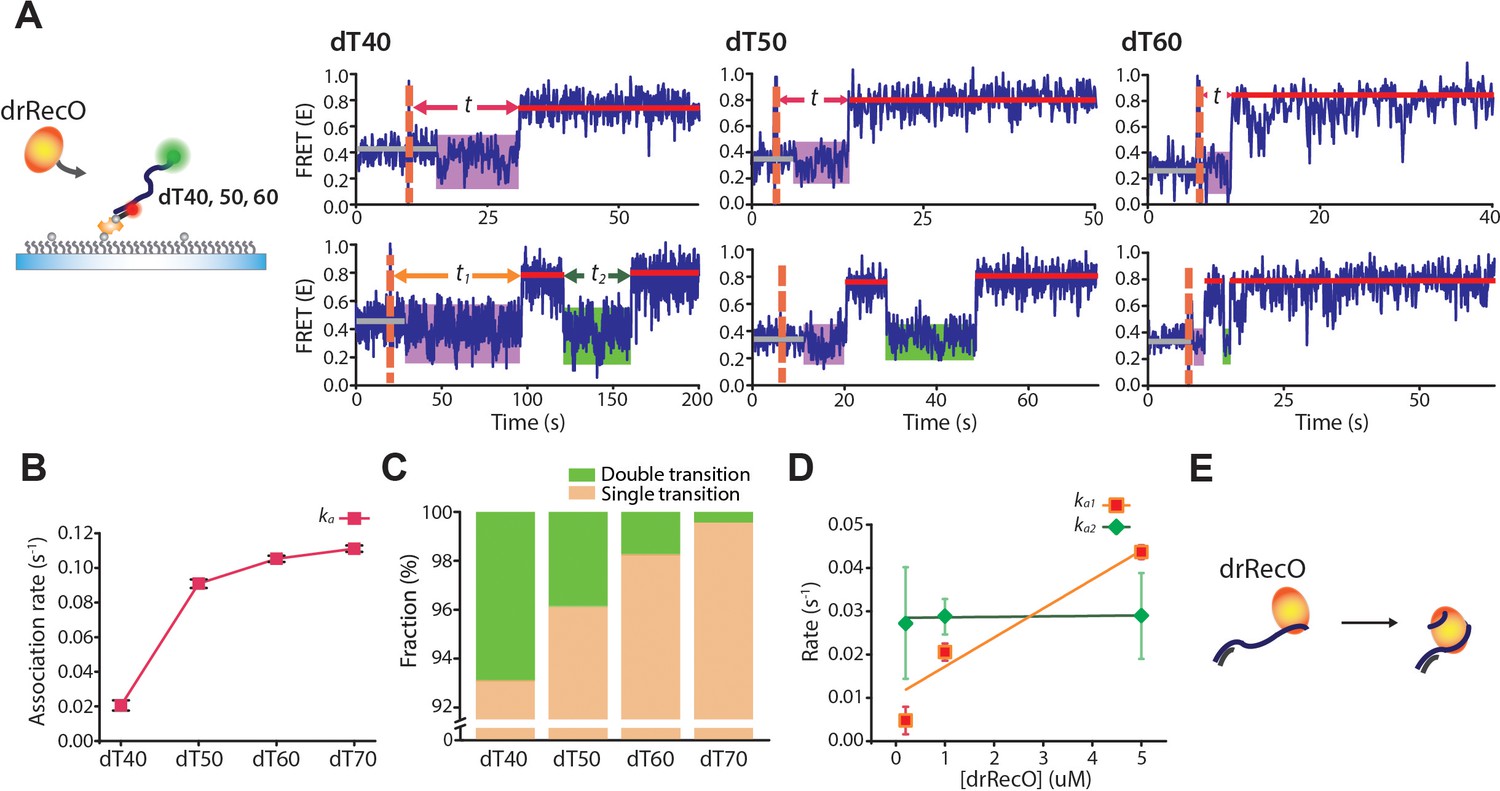
(A) Schematic illustration and representative FRET time trajectories for drRecO binding to dT40 (left), dT50 (middle), and dT60 (right). The orange dashed lines denote the time of drRecO injection. Average FRET values for ssDNA-only species and the fully bound drRecO–ssDNA complexes are indicated with gray and red solid lines. The substantial FRET fluctuations are indicated by the purple boxes. The time required to reach the fully bound state is indicated by t in the upper panels. The lower panels present FRET time traces with the second low FRET state after forming the fully bound drRecO–ssDNA complex (the green boxes). The dwell time of the second low FRET state is marked as t2. (B) The association rates between drRecO and ssDNA (ka) depending on the length of ssDNA. ka was obtained from the distribution of t in panel (A) (Figure 6—figure supplement 2B). (C) The fraction of time traces having multiple FRET transitions depending on the length of ssDNA. (D) The rates of the first and second transition to high FRET depending on drRecO concentration for drRecO binding to dT40. The distributions of the dwell times t1 and t2 were obtained from the single-molecule dwell time analysis. The transition rate was calculated as the reciprocal of the average life-time from a single-exponential fit for the dwell-time distribution. (E) Model of drRecO binding to ssDNA. drRecO binds to ssDNA by the sequential two-step binding mode.
-
Figure 6—source data 1
Data summary table for the results shown in Figure 6B.
- https://cdn.elifesciences.org/articles/50945/elife-50945-fig6-data1-v2.docx
-
Figure 6—source data 2
Data summary table for the results shown in Figure 6C.
- https://cdn.elifesciences.org/articles/50945/elife-50945-fig6-data2-v2.docx
-
Figure 6—source data 3
Data summary table for the results shown in Figure 6D.
- https://cdn.elifesciences.org/articles/50945/elife-50945-fig6-data3-v2.docx
Figure 6—figure supplement 1

FRET distributions of 40-nt ssDNA and the intermediate state of dT40-drRecO complex.
(A) Representative time trace of drRecO binding to dT40, showing the fluctuating dynamic of the FRET state for dT40 (gray box) and the intermediate state of dT40–drRecO (magenta box). (B) Cumulative FRET distributions of dT40 and the intermediate state. The histograms were normalized by the total data points and fitted by a Gaussian function. The average FRET values of the two distributions are very similar (0.401 ± 0.0001 for dT40 and 0.403 ± 0.002 for the intermediate state). However, the widths of the distributions (full-width at half-maximum [FWHM]) were clearly distinguishable: the FWHM of the intermediate state is 30% larger than that of dT40 (FWHM = 0.169 and 0.212 for dT40 and the intermediate state, respectively).
Figure 6—figure supplement 2
drRecO binding to various lengths of ssDNA by TIRF measurement.
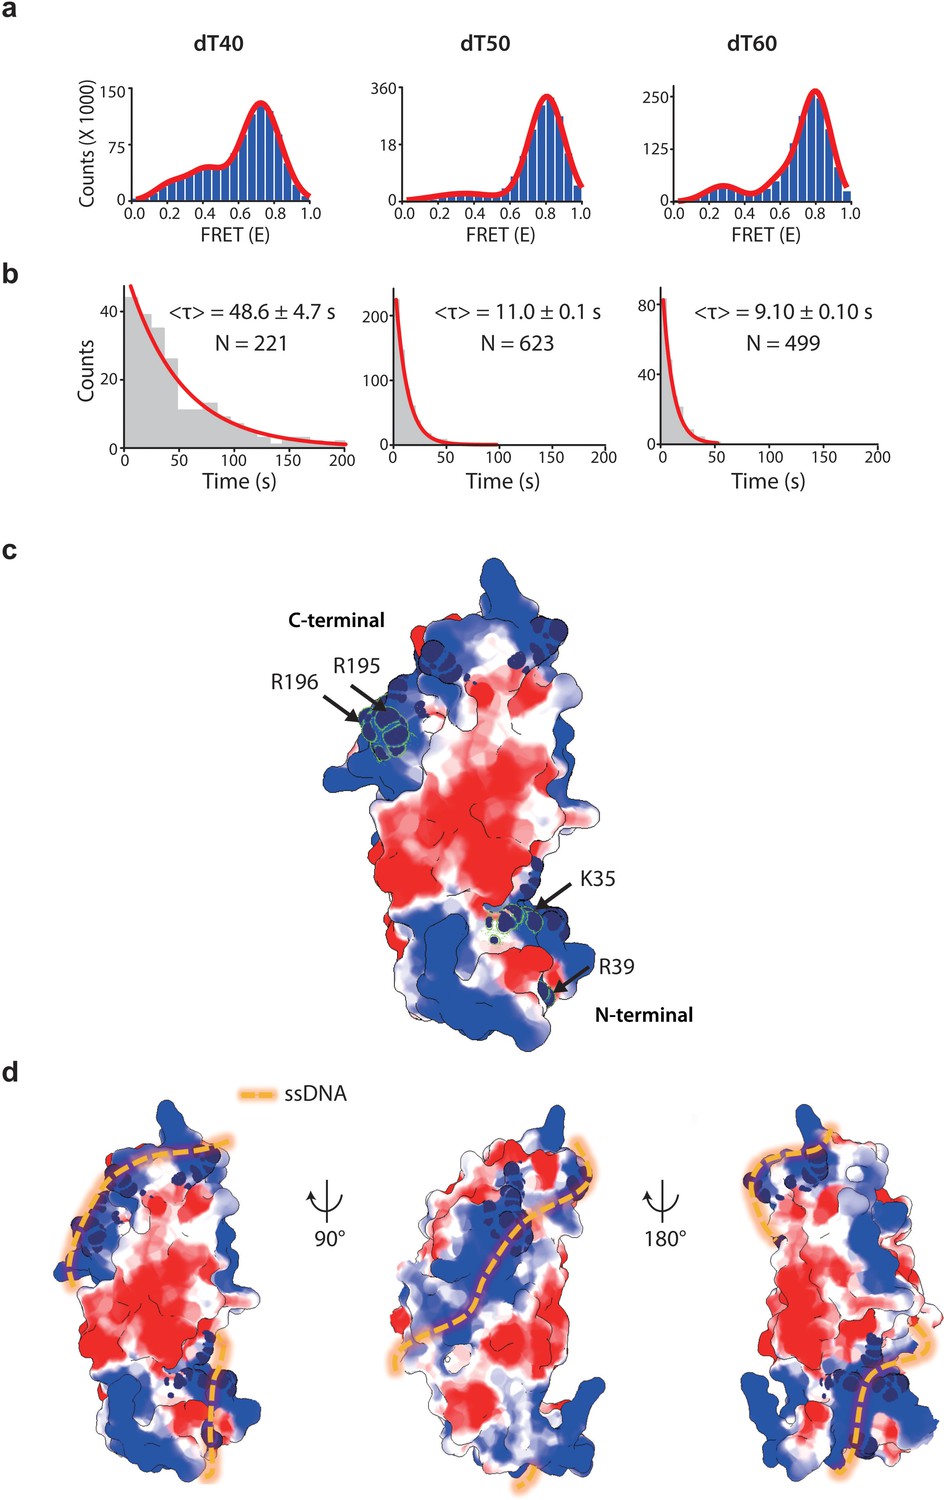
(A) The FRET histograms for drRecO binding to dT40, dT50 and dT60, obtained from the FRET time traces shown in Figure 6A. The numbers of time traces used for the histograms for dT40, dT50, and dT60 were of 221, 623, and 499, respectively. (B) The single-molecule dwell-time histograms for the first binding of drRecO to ssDNAs. The red solid lines represent the fitting using a single-exponential decay function. (C) Crystal structure of drRecO (PDB: 1W3S). The electrostatic surface potentials are contoured at ±3 kT/e, where the red and blue colors represent the negative and positive potentials, respectively. The residues essential for DNA binding were colored with navy. The mutation sites on the N-terminal OB fold and the C-terminal positive ridge are K35/R39 and R195/R196, respectively. (D) Helical binding model for ssDNA–drRecO complex. We proposed this model considering the structure of the dsDNA–drRecO complex (Leiros et al., 2005), the structure of the ssDNA–ecoSSB complex (PDB: 1EYG) (Raghunathan et al., 2000), and the geometrical similarity between the OB fold of drRecO and ecoSSB, as well as the two-step binding mode of drRecO discovered in this work.
Figure 7
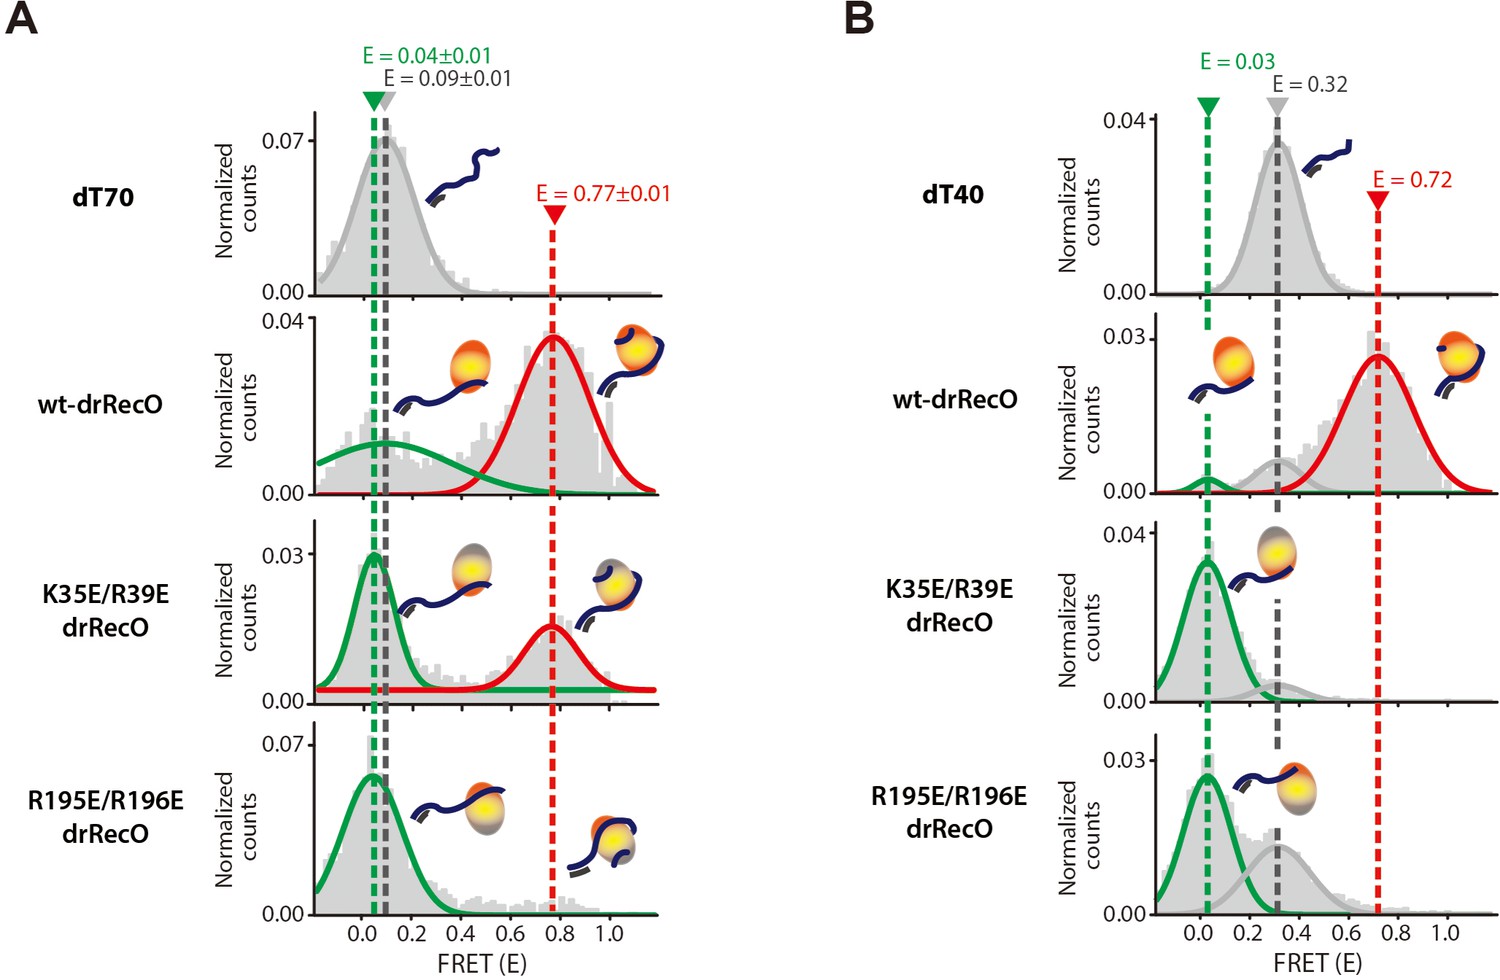
The binding modes of drRecO mutants to ssDNA.
(A) 1D FRET histograms for dT70 only, wt-drRecO–dT70, K35E/R39E drRecO (N-terminal mutation)–dT70, and R195E/R196E drRecO (C-terminal mutation)–dT70, obtained by ALEX-FRET. One of the ssDNA-binding sites was mutated in K35E/R39E drRecO and R195E/R196E drRecO. The gray, green, and red lines represent bare dT70 (E = 0.09), partially bound drRecO–dT70 (E = 0.04), and fully bound drRecO–dT70 (E = 0.77), respectively. (B) 1D FRET histograms for dT40 only, wt-drRecO–dT40, K35E/R39E drRecO–dT40, and R195E/R196E drRecO–dT40, obtained by ALEX-FRET. The gray, green, and red lines represent the bare dT40 (E = 0.32), the partially bound drRecO–dT40 (E = 0.03), and the fully bound drRecO–dT40 (E = 0.72), respectively. dT40 showed the partially bound state more clearly because its E value is significantly different from that of bare dT40.
Figure 8 with 1 supplement
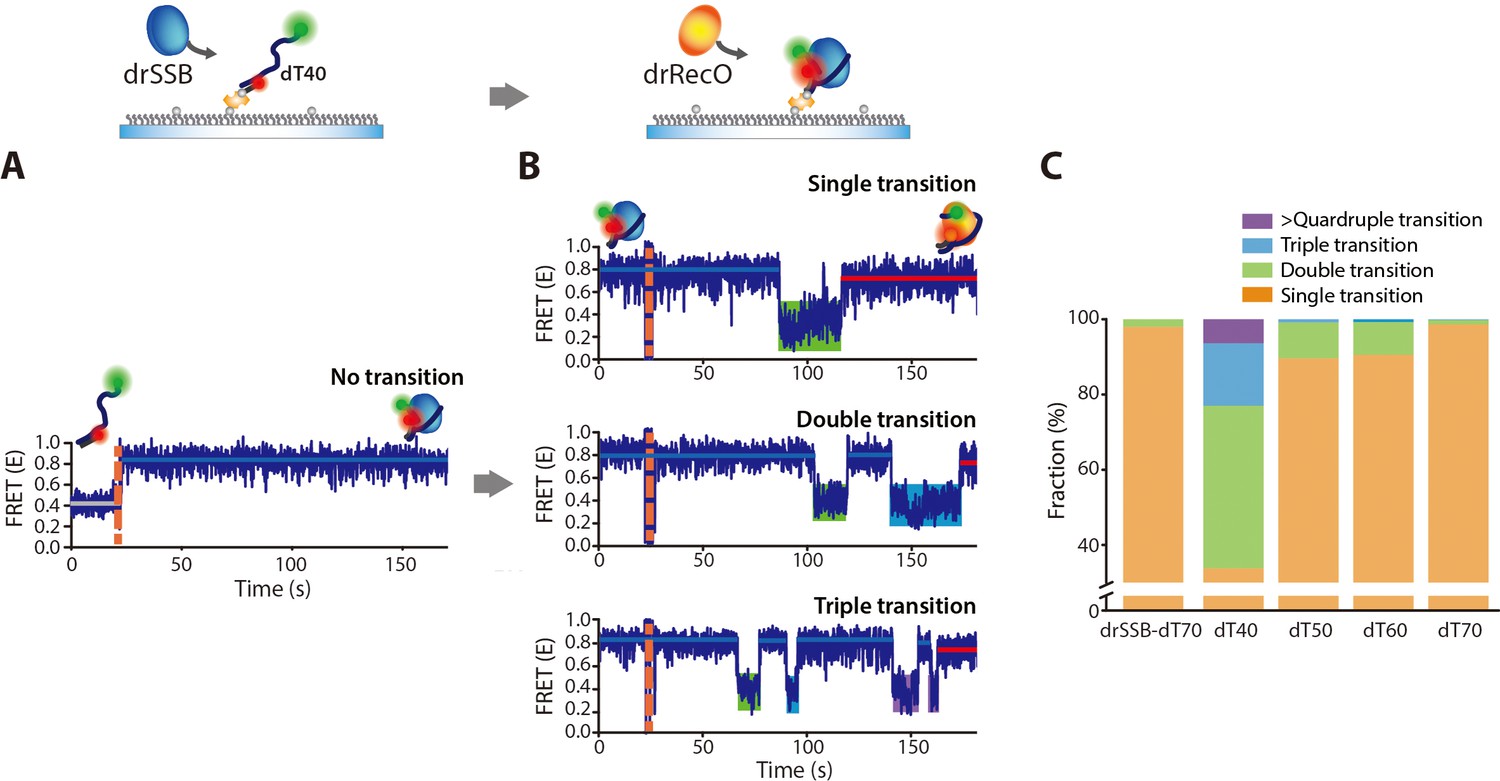
drRecO-mediated drSSB displacement depending on the length of ssDNAs.
(A, B) Representative time trajectories for (A) drSSB binding to dT40 and (B) drRecO-mediated drSSB displacement from dT40. The drSSB–dT40 complex was formed by adding 125 nM drSSB to surface-immobilized dT40. Immediate transition to high FRET was observed in panel (A). The FRET time trajectories of dT50 and dT60 are presented in Figure 8—figure supplement 1B. After the formation of the drSSB–dT40 complex, 1 µM drRecO was added as indicated by the orange dashed lines in panel (B). During the injection of drRecO, unbound drSSB was washed out. The transitions from the drSSB–dT40 complex (the blue lines) to the drRecO–dT40 (red lines) complex occur through the intermediate state of low E value (the green, cyan, and purple boxes). (C) The fraction of the time trajectories having transitions to the low-FRET state. As the length of ssDNA is shorter, multiple transitions to the low-FRET state appear more frequently.
-
Figure 8—source data 1
Data summary table for the results shown in Figure 8C.
- https://cdn.elifesciences.org/articles/50945/elife-50945-fig8-data1-v2.docx
Figure 8—figure supplement 1
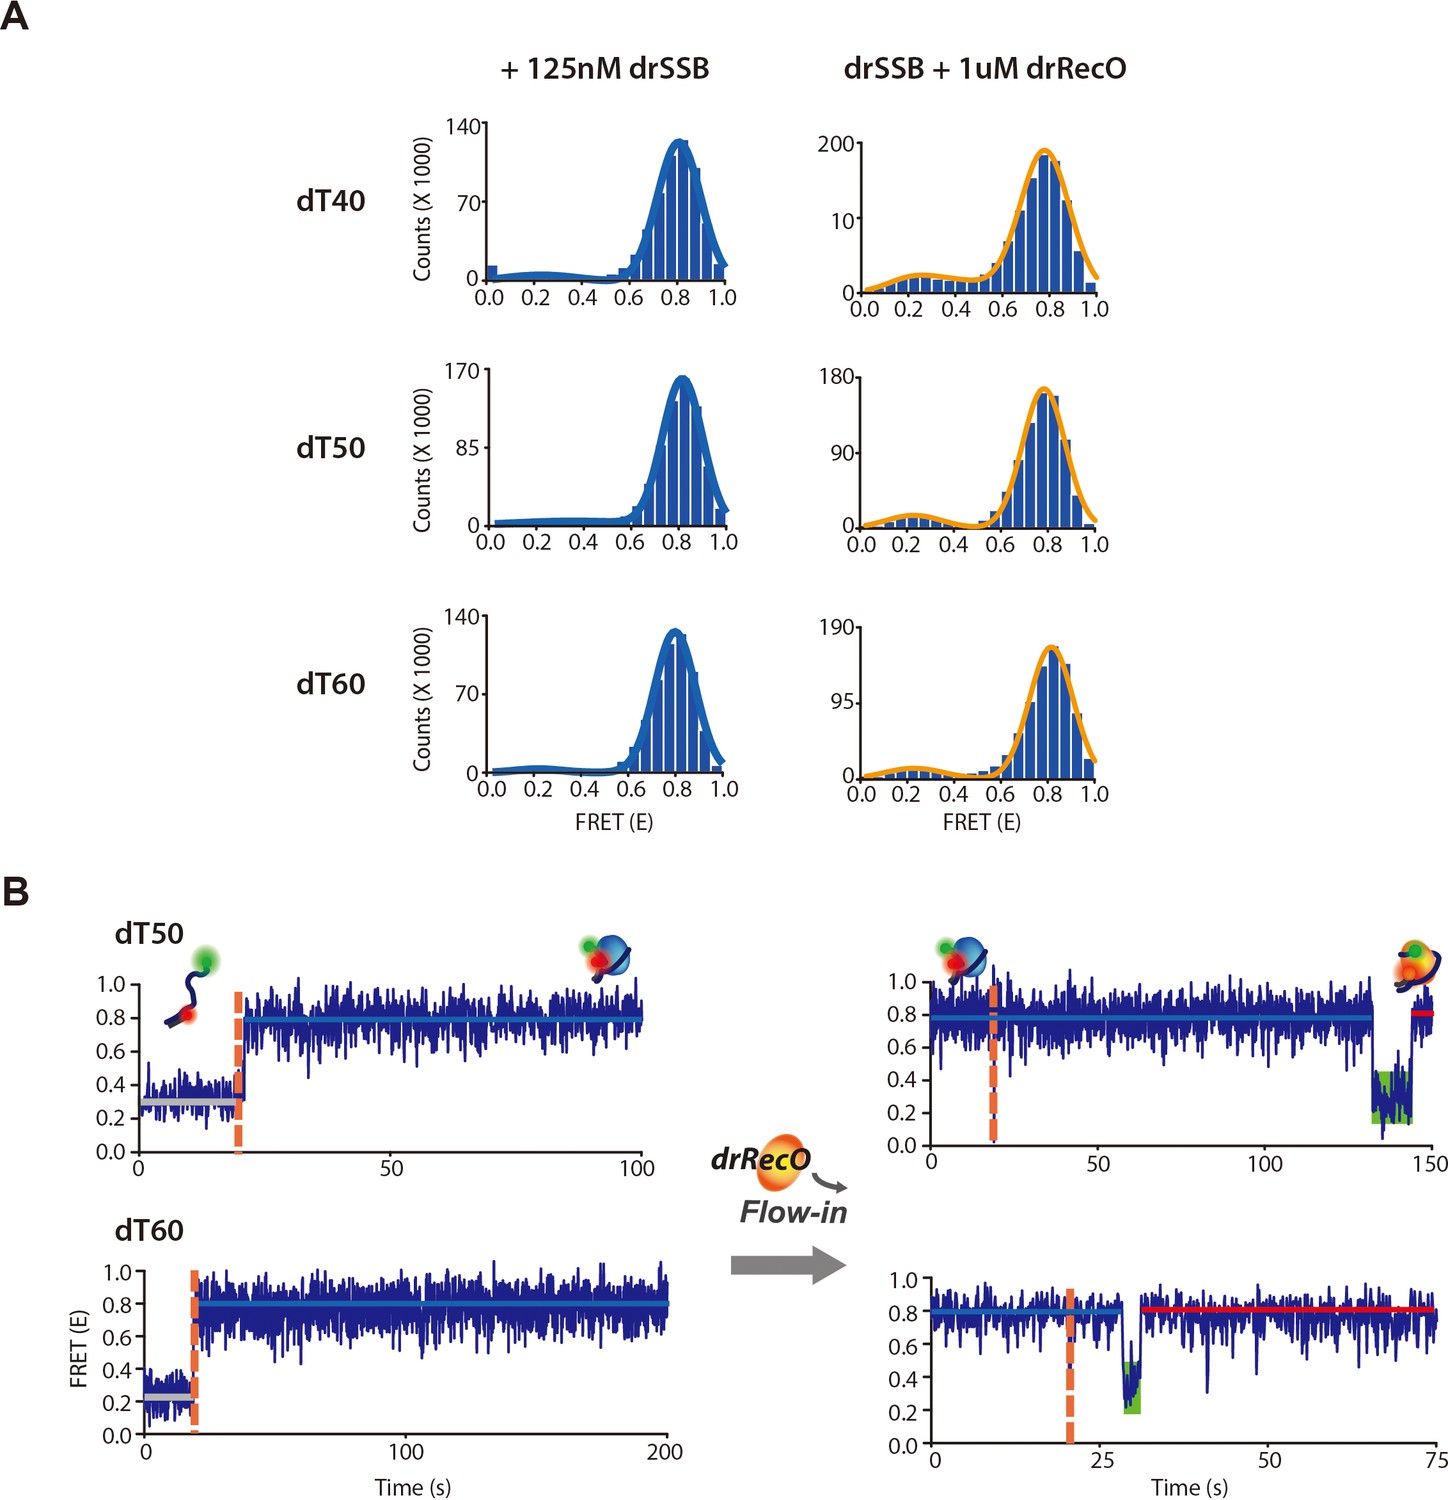
The observation of drSSB displacement by drRecO on various lengths of ssDNA.
(A) The cumulative FRET histograms and (B) the representative time trajectories for drSSB binding dynamics and drRecO-mediated drSSB displacement on 50-nt and 60-nt ssDNAs. The left panels in (A) present the cumulative FRET histograms obtained from the time trajectories of drSSB–ssDNA complex formation. The right panels in (A) present the cumulative FRET histograms obtained from the time trajectories by addition drRecO to preformed drSSB–ssDNA complex. The left panels in (A) present the time trajectories for drSSB binding to dT50 and dT60, respectively. The right panels in (B) present the time trajectories obtained by adding drRecO to preformed drSSB–ssDNA complex. The green boxes in (B) indicate the intermediate state of a low E value observed after adding drRecO. No intermediate state was observed without drRecO.
Figure 9 with 1 supplement
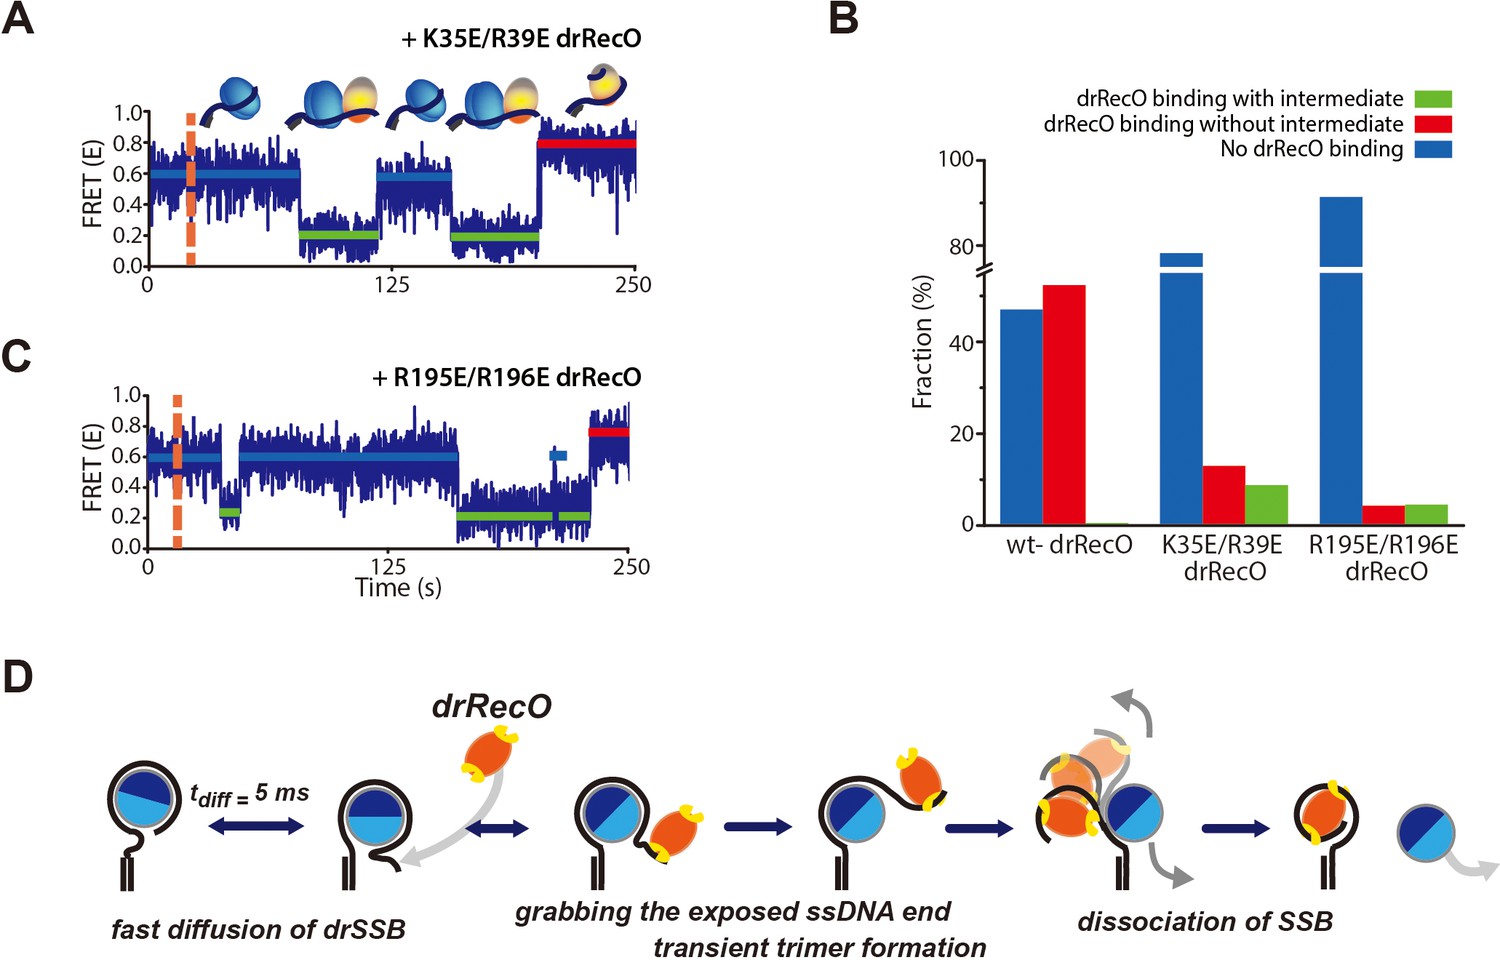
Real-time observation of drSSB displacement by drRecO mutants with lower ssDNA-binding affinity.
(A, B) Representative FRET time trajectories for the binding of K35E/R39E drRecO and R195E/R196E drRecO mutants to the preformed drSSB–dT70 complex. The injection time of the mutants is marked by the orange dashed lines. During the injection of drRecO, unbound drSSB was washed out. The blue, green, and red solid lines denote the average FRET values of drSSB–dT70, the heterotrimer of drSSB–dT70–drRecO, and drRecO–dT70, respectively. Because of the mutation on either end of drRecO, multiple transitions to the intermediate state were observed more frequently. (C) Fraction of drSSB displacement by drRecO and its mutants. For all measurements, 330 nM drRecO or drRecO mutants were applied to the preformed drSSB–dT70 complex. The blue, red, and green bars denote the time-trace populations with no drRecO binding (no drSSB displacement), drSSB displacement without the intermediate state, and drSSB displacement with the intermediate state, respectively. Mutation at either end of drRecO reduced the proportion of successful drSSB displacement from dT70 but increased the proportion of time traces showing multiple FRET transitions to the intermediate state. (D) A proposed model for the displacement of SSB from ssDNA by RecO in DR without consuming ATP.
-
Figure 9—source data 1
Data summary table for the results shown in Figure 9C.
- https://cdn.elifesciences.org/articles/50945/elife-50945-fig9-data1-v2.docx
Figure 9—figure supplement 1
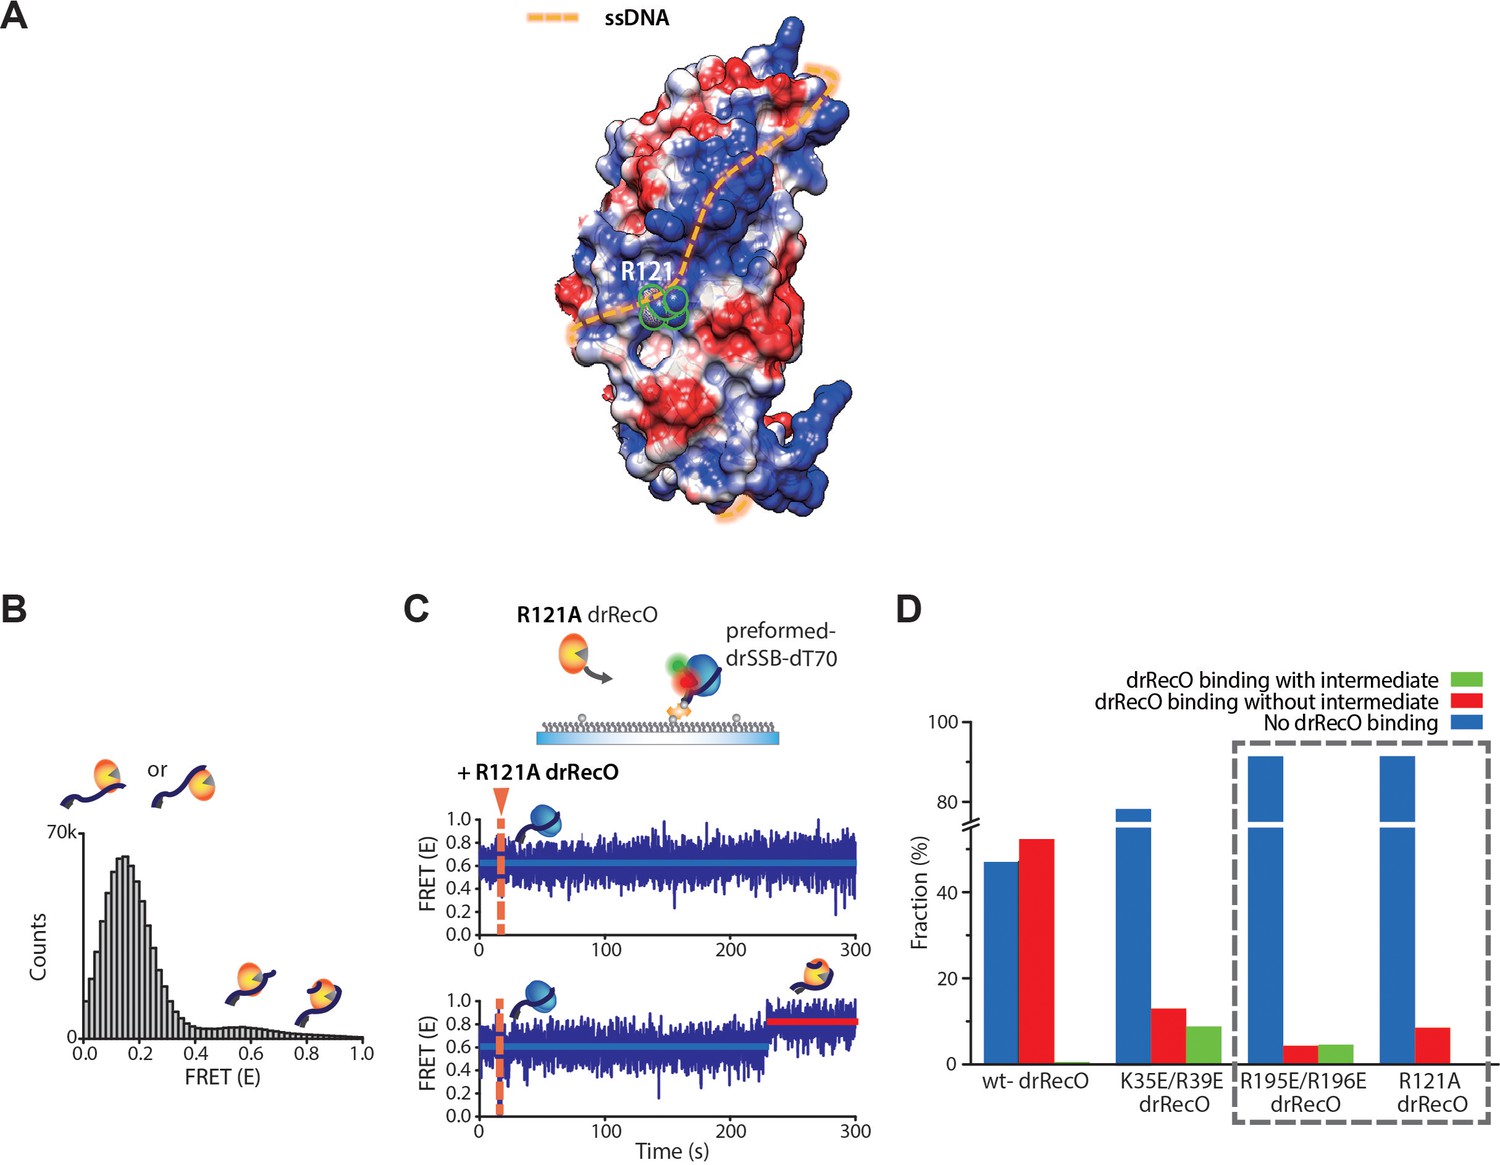
R121A drRecO mutation hinders both drRecO–ssDNA binding and formation of the intermediate state.
(A) Position of the 121-arginine residue that locates in the middle of the estimated ssDNA-binding site in drRecO. (B) FRET distribution of R121A drRecO–dT70 complex. R121A mutation showed a large portion of low-FRET state with a small portion of high- and new mid-FRET states. R121A drRecO showed weak ssDNA-binding ability in the cumulative FRET histogram, which is comparable to that of the C-/N-terminal mutants (Figure 7). It may be caused by the position of the 121-arginine, which is located at the middle of the expected ssDNA wrapping structure (Figure 6—figure supplement 2) and blocks the full helical binding of ssDNA. A new peak around E = 0.6 was observed for R121A drRecO, which was not observed for the K35E/R39E and R195E/R196E drRecO mutants. (C) Representative time traces obtained by the addition of R121A drRecO to the preformed drSSB–ssDNA complex. An important feature of R121A, unlike the other mutants, is the absence of the intermediate state during drSSB displacement. (D) Population analysis for various drRecO mutants. When R121A drRecO was added to the preformed drSSB–dT70 complex, R121A drRecO showed similar efficiency for drSSB displacement with R195E/R196E drRecO, which is consistent with the ssDNA-binding capability. We have shown that, when drSSB-displacement occurred by R195E/R196E drRecO, 51% of the time traces showed the intermediate state. However, when R121A drRecO was used, no intermediate state was observed for >200 time traces. It is highly possible that the hetero-trimer becomes unstable due to the weakened interaction between R121A drRecO and drSSB, which renders the intermediate state difficult to observe given our time resolution. These results suggest that the weak direct interaction between drRecO and drSSB contributes to the formation of the intermediate state, which thus further supports our interpretation that the intermediate state is the hetero-trimer of drSSB–drRecO–ssDNA. However, these interactions must be weak to dissociate drSSB from the drRecO–ssDNA complex completely.
Tables
Key resources table
| Reagent type (species) or resource | Designation | Source or reference | Identifiers | Additional information |
|---|---|---|---|---|
| Strain, strain background (Escherichia coli) | BL21(DE3) | Invitrogen | Competent cells | |
| Genetic reagent (D. radiodurans) | RecO | DOI:10.2210/pdb1U5K/pdb | ||
| Commercial assay kit | PrimeSTAR DNA polymerase | Takara, Japan | DNA polymerization for PCR | |
| Software, algorithm | MATLAB | Mathworks Matlab Version R2018 | The source code is distributed by T.J Ha group (http://bio.physics.Illinois.edu/) | |
| Sequence-based reagent | DNA oligos | DNA oligos were ordered from IDT |
Additional files
Download links
A two-part list of links to download the article, or parts of the article, in various formats.
Downloads (link to download the article as PDF)
Open citations (links to open the citations from this article in various online reference manager services)
Cite this article (links to download the citations from this article in formats compatible with various reference manager tools)
Single-molecule observation of ATP-independent SSB displacement by RecO in Deinococcus radiodurans
eLife 9:e50945.
https://doi.org/10.7554/eLife.50945


