Hidden long-range memories of growth and cycle speed correlate cell cycles in lineage trees
- German Cancer Research Center (DKFZ), Germany
- University of Heidelberg, Germany
Figures
Figure 1 with 4 supplements

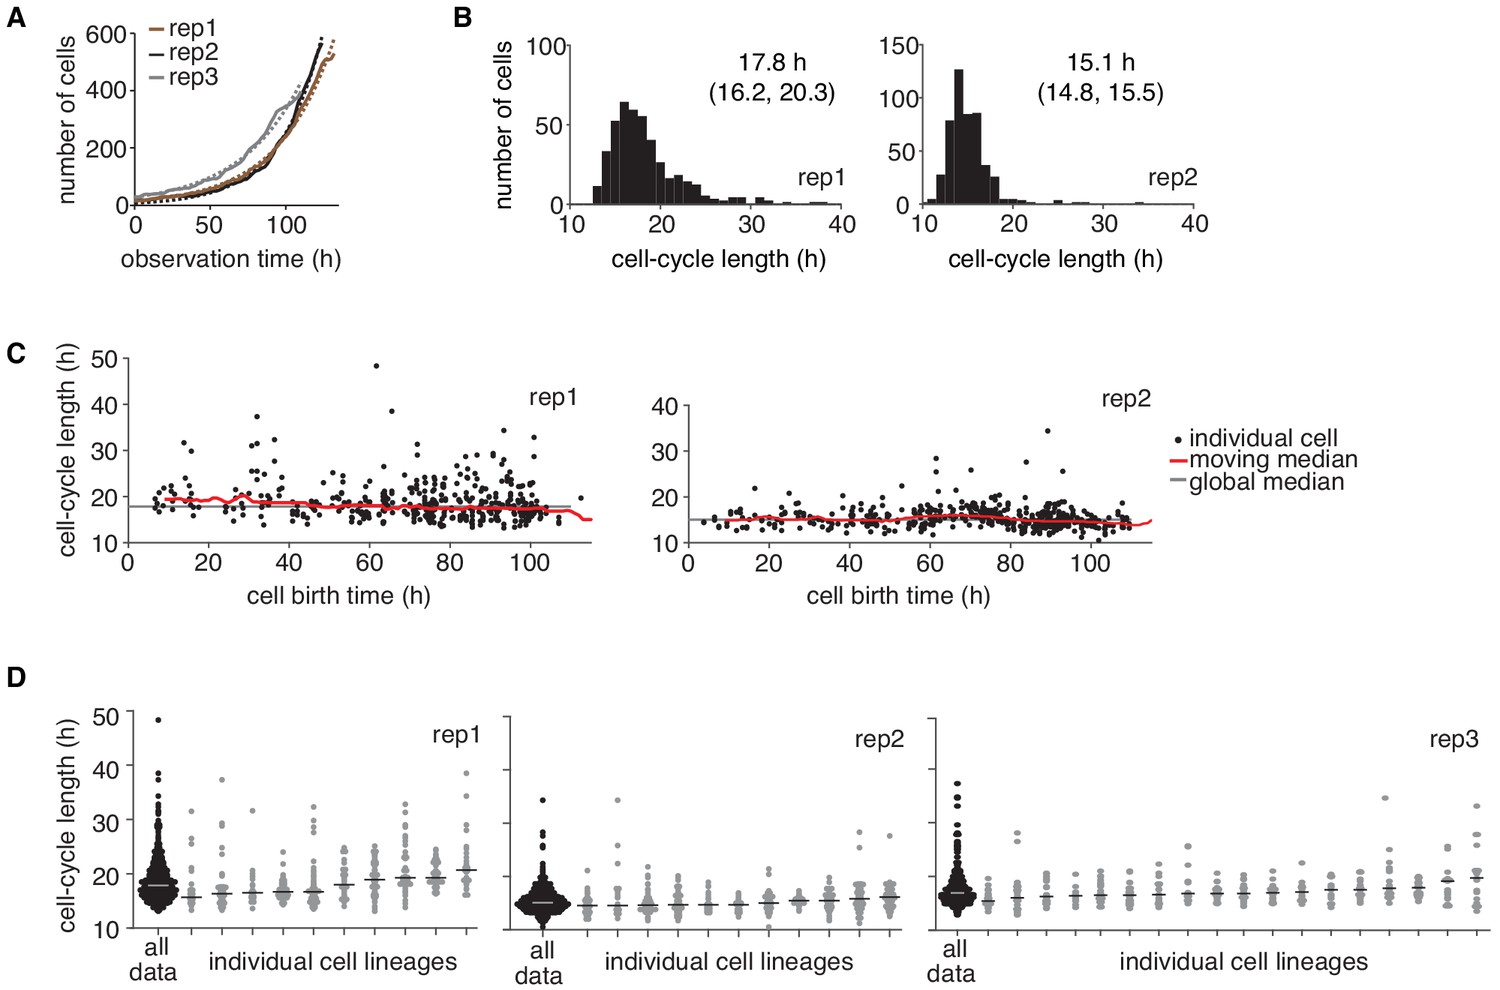
Cell-cycle lengths and their correlations captured by live-cell imaging.
(A) Live-cell microscopy of neuroblastoma TET21N cell lineages. Sample trees shown with cells marked that were lost from observation (dot) or died (cross). (B) Distribution of cycle lengths, showing median length (and interquartile range). (C) Cycle length over cell birth time shows no trend over the duration of the experiment. (D) Lineage tree showing the relation of cells with a reference cell (red); ancestral lineage (light blue), first side-branch (dark blue) and second side branch (green). (E) Spearman rank correlations of cycle lengths between relatives (with bootstrap 95%-confidence bounds) of three independent microscopy experiments. Color code as in D. B and C show replicate rep3.
-
Figure 1—source data 1
Overview of all time-lapse experiments displayed in the manuscript.
‘Corrected’ refers to the number of fully observed generations; only these were used, in order to correct for censoring bias. ‘Figures’ refers to main text figures and the respective supplements.
- https://cdn.elifesciences.org/articles/51002/elife-51002-fig1-data1-v2.pdf
-
Figure 1—source data 2
Raw cell cycle data for lineage trees in TET21N replicates rep1-3.
- https://cdn.elifesciences.org/articles/51002/elife-51002-fig1-data2-v2.xlsx
Figure 1—figure supplement 1
Temporal drift analysis of time-lapse imaging data.
(A) Change in cell number over time in the three independent time-lapse imaging experiments (rep, solid lines). An exponential growth model (dashed lines) was fitted to the count data. (B and C) Cycle length distributions of the two independent experiments not shown in Figure 1B,C, displaying (B) the median and interquartile range, and (C) cycle lengths with respect to cell birth time. (D) Cycle lengths of individual lineages for the three replicate experiments displaying individual cells and the lineage median. No cells were excluded from the analysis except for a very small number of cells that left the observation window early and hence did not allow reconstructing deep lineage trees. Trees shown consist of ≥ 10 cells.
Figure 1—figure supplement 2

Expression of the circadian clock module depends on MYCN level.
(A) Test for differential expression of circadian clock genes in TET21N cells with high versus low MYCN expression using edgeR (Robinson and Smyth, 2008), based on estimating dispersion for each gene using the negative binomial distribution. Differentially expressed genes are PER1, CRY2, NR1D1, and PER3, with p values < 0.05. The results remain the same when average dispersion is estimated for all genes together. (B) Comparison of expression of the entire circadian clock module (via averaged fold change) with 104 randomly drawn gene modules with comparable dispersion. The circadian clock module (black dot) is significantly downregulated (p value = 0.016). Experimental data taken from Ryl et al. (2017).
Figure 1—figure supplement 3

Censoring bias and spatial trend analysis.
(A) Simulation exemplifying censoring bias in correlations. Lineage trees of random Gaussian cycle lengths with mean 15 hr, standard deviation 3 hr and 10 generations were generated. Trees were truncated depending on the observation limit before calculating mother-daughter and sister cycle length correlations. Shaded areas show 95%-confidence bounds. Gray line shows the real correlation (of zero). (B) Experimentally measured Spearman rank cell-cycle length correlations of selected family members with bootstrap 95%-confidence bounds and N the number of cell pairs. (C–E) Confounding-factor analysis of the three independent replicate experiments. (C) Spearman rank correlations and bootstrap 95%-confidence bounds calculated as above (black), from randomly paired cells (gray) and by partial correlations with respect to the cycle length of the last common ancestor (red), the mean birth time of each cell pair (green), the birth time of the reference cell (blue) and the birth time of the other relative (brown). (D) Spatial position of cells at division colored by lineage (left) and cycle length (right). Shaded boxes show median cycle length within that square. White backgrounds indicate insufficient cell numbers (<5 cells). No significant differences in cycle length distributions were detected between the spatial regions at a 5% significance level using a Kolmogorov-Smirnov test and the Benjamini-Hochberg procedure to correct for multiple testing. (E) Correlation of the Euclidean distance between first cousins and their difference in cycle length showing Spearman rank correlation coefficient and bootstrap 95%-confidence bounds.
Figure 1—video 1
Time-lapse movie of dividing TET21N cells (replicate rep3).
Parameters: 75 hr total time, 6 min per frame, 1 pixel corresponds to 0.4 µm.
Figure 2 with 1 supplement
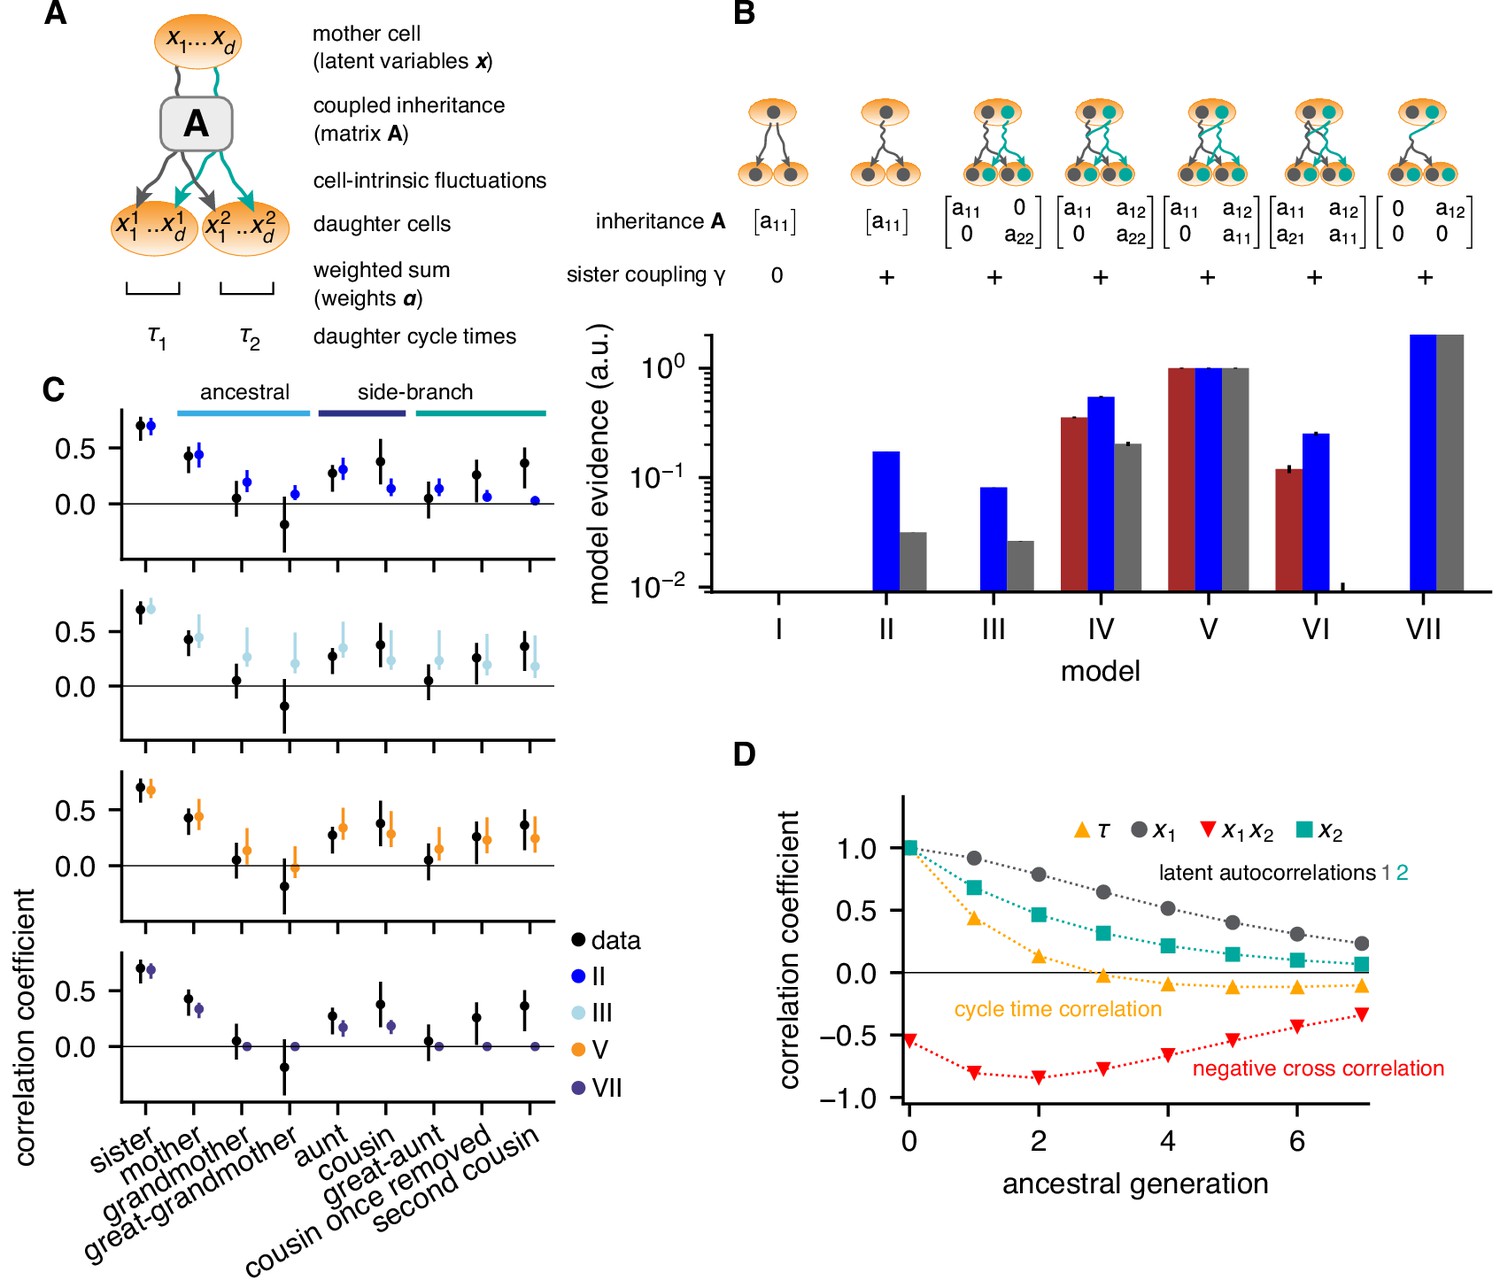
Bifurcating autoregressive inheritance models.
(A) Coupled inheritance of Gaussian latent variables and cell-intrinsic fluctuations generate cycle lengths. (B) Relative model evidences calculated for , for the indicated inheritance matrices and sister coupling . Although Model VII is the most parsimonious for replicates rep2 and rep3 (blue and gray bars), only Model V with unidirectionally coupled inheritance explains all data well, including rep1 (bordeaux bars). Error bars from Monte-Carlo integration. (C) Model fits for rep1. Single-variable inheritance (Model II) and pure cross-inheritance (VII) fails to generate strong intra-generational correlations; uncoupled inheritance (III) fails to generate low ancestral correlations; Model V fits the data best. Rank correlations of the data shown with bootstrap 95%-confidence bounds (black bars). Model prediction bands (colored bars) were generated from the range of the parameter sets with likelihood higher than 15% of the best fit, corresponding to a Gaussian 95% credible region. (D) Model V, best-fit ancestral autocorrelation functions, for cycle lengths and latent variables. Long-range memory in the latent variables is anticorrelated and masked in observed cycle times.
Figure 2—figure supplement 1
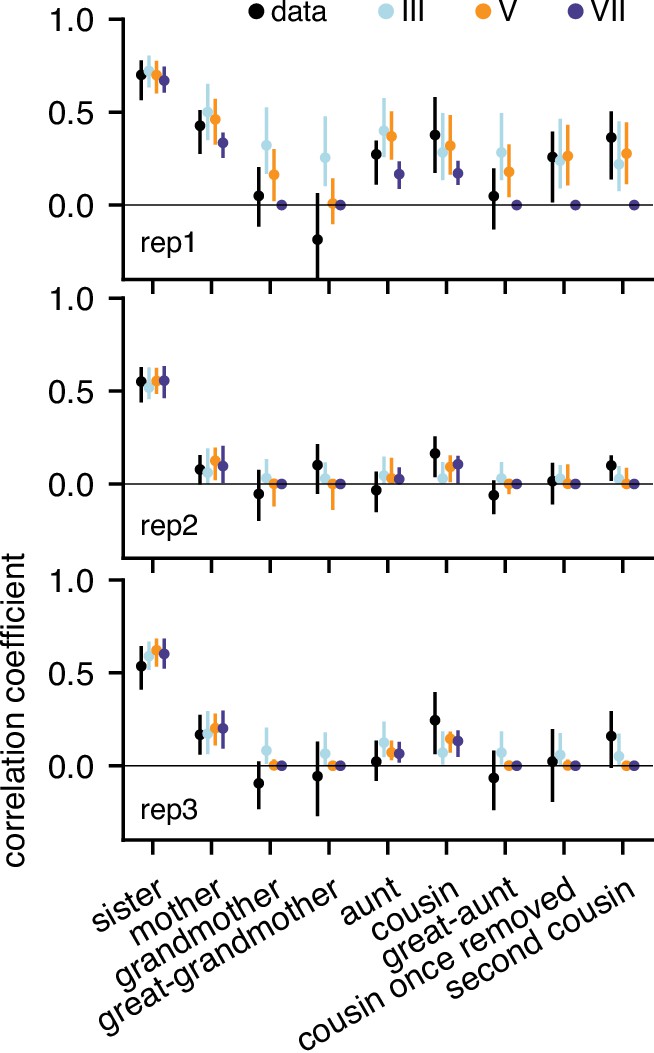
Gaussian model predictions of correlations for all three replicates.
Model VII generates intra-generational correlations only up to first cousins which is compatible with rep2 and rep3 but not rep1.
Figure 3 with 1 supplement
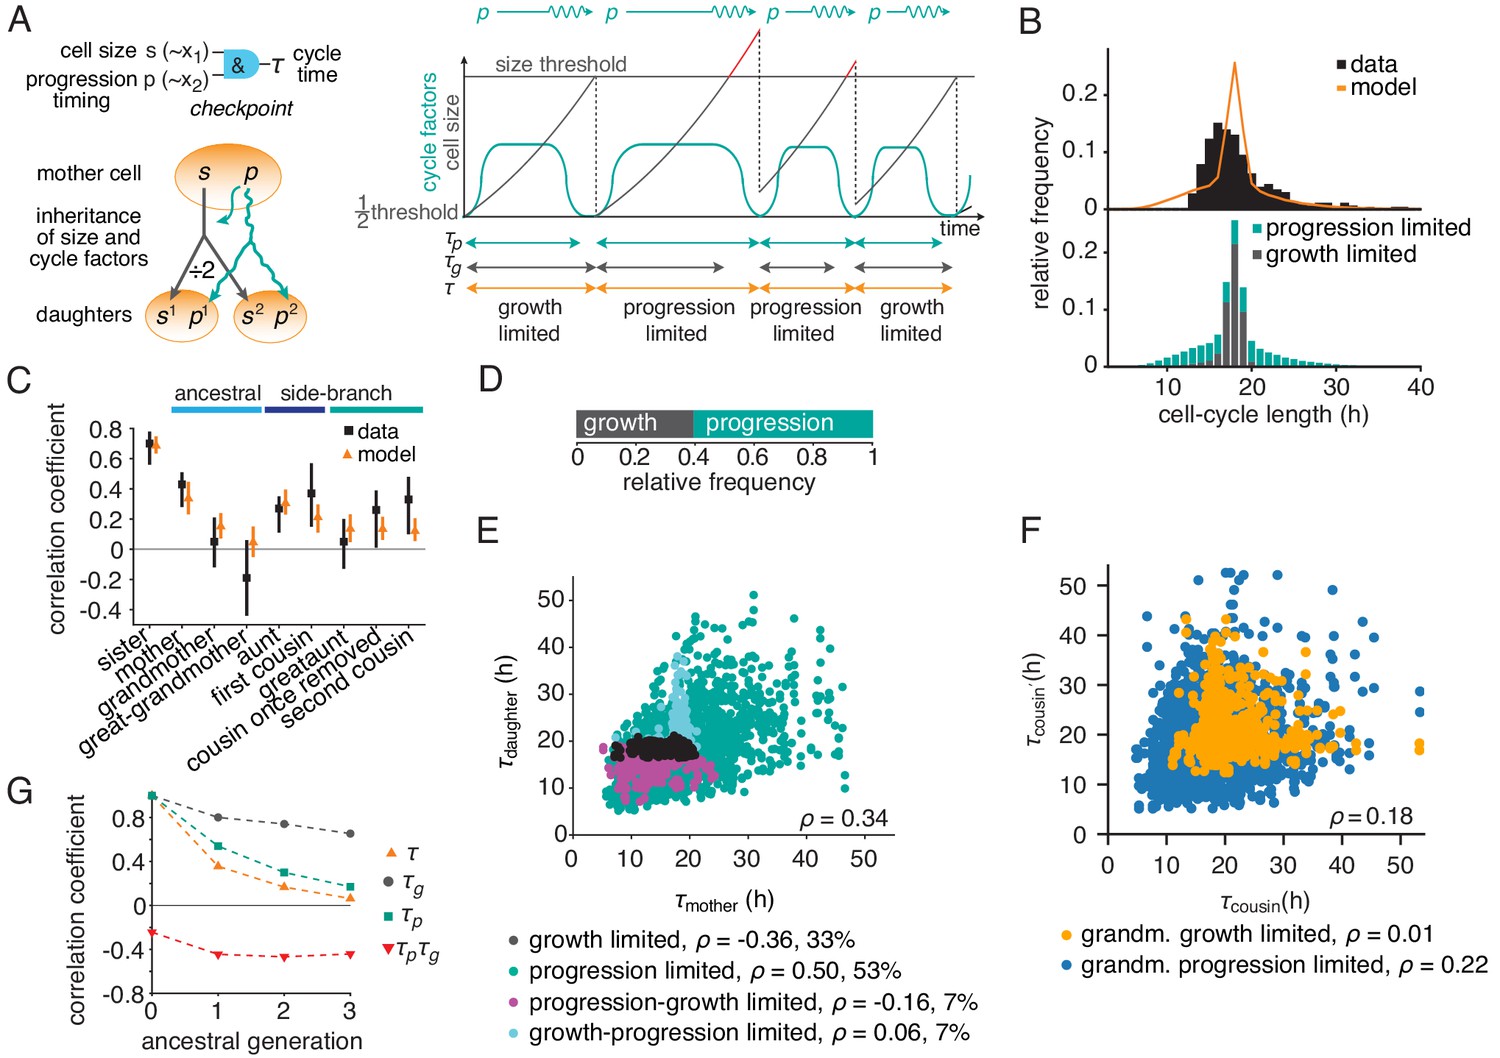
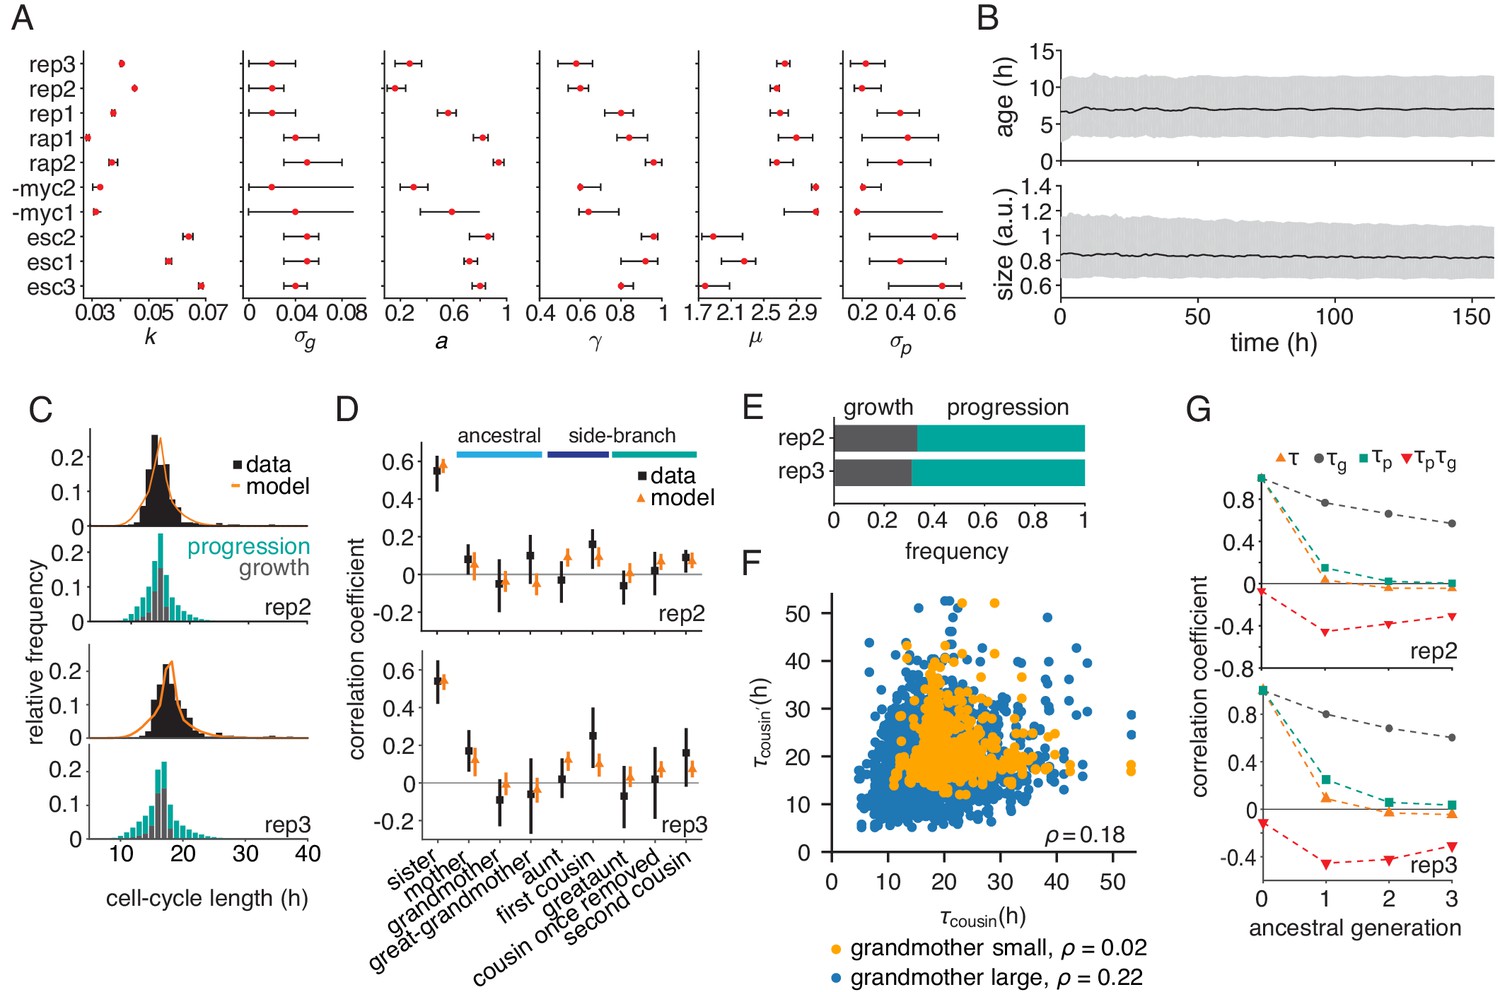
The growth-progression model.
(A) Scheme of the growth-progression model with heritable variables relating to cell size and cycle progression timing . (B) Measured and simulated cell-cycle length distributions (upper). Model distribution resolved by the division-limiting process (lower). (C) Measured and modeled correlation pattern with Spearman rank correlation coefficient and bootstrap 95%-confidence bounds. (D) Proportion of simulated cells limited by growth or progression. (E) Correlation of simulated mother-daughter cycle lengths colored by their division limitation: both by (black), both by (green), mother – daughter (magenta), mother – daughter (cyan). Percentage of cells in each subgroup and their correlation coefficients are shown. (F) Correlation of simulated cousin-cousin cycle length colored by the limitation of the common grandmother: by (orange) or (blue). (G) Autocorrelations along ancestral line of cycle length , growth time and the progression time , and the cross-correlation .
-
Figure 3—source data 1
Best-fit parameter values of the growth-progression model for all experiments shown, obtained from ABC-simulations.
Cell size was assumed to increase exponentially except for MYCN-inhibited cells, which were modelled by a logistic growth process with a fixed normalised maximum cell size equal to 20 times the threshold division size. The bottom two rows show the parameters used for simulated perturbations of growth cycle progression, respectively.
- https://cdn.elifesciences.org/articles/51002/elife-51002-fig3-data1-v2.pdf
Figure 3—figure supplement 1
Parameterized growth-progression model generates long-range memory.
(A) Best fit (red dot) and confidence bounds of the six model parameters fitted individually to each dataset by Approximate Bayesian Computation at a tolerance = 2. See Appendix 3 for details. (B) Simulated distributions of cell age and cell size over time showing median (black line) and interquartile range (gray). (C and D) Parameterized model fit to the experimental data, showing (C) the distribution of cycle length (upper) resolved by the division-limitation (lower) and (D) the correlation pattern with bootstrap 95%-confidence bounds. (E) Frequency of simulated cells limited by growth or progression showing the mean of 100 simulations using best-fit parameters. (F) Correlation of simulated cousin-cousin cycle length colored by the size common grandmother: smaller than the median value (orange) or larger (blue). (G) Best-fit predicted Spearman rank autocorrelations of the cycle length , the growth time and the progression time , and the cross-correlation .
Figure 4 with 2 supplements
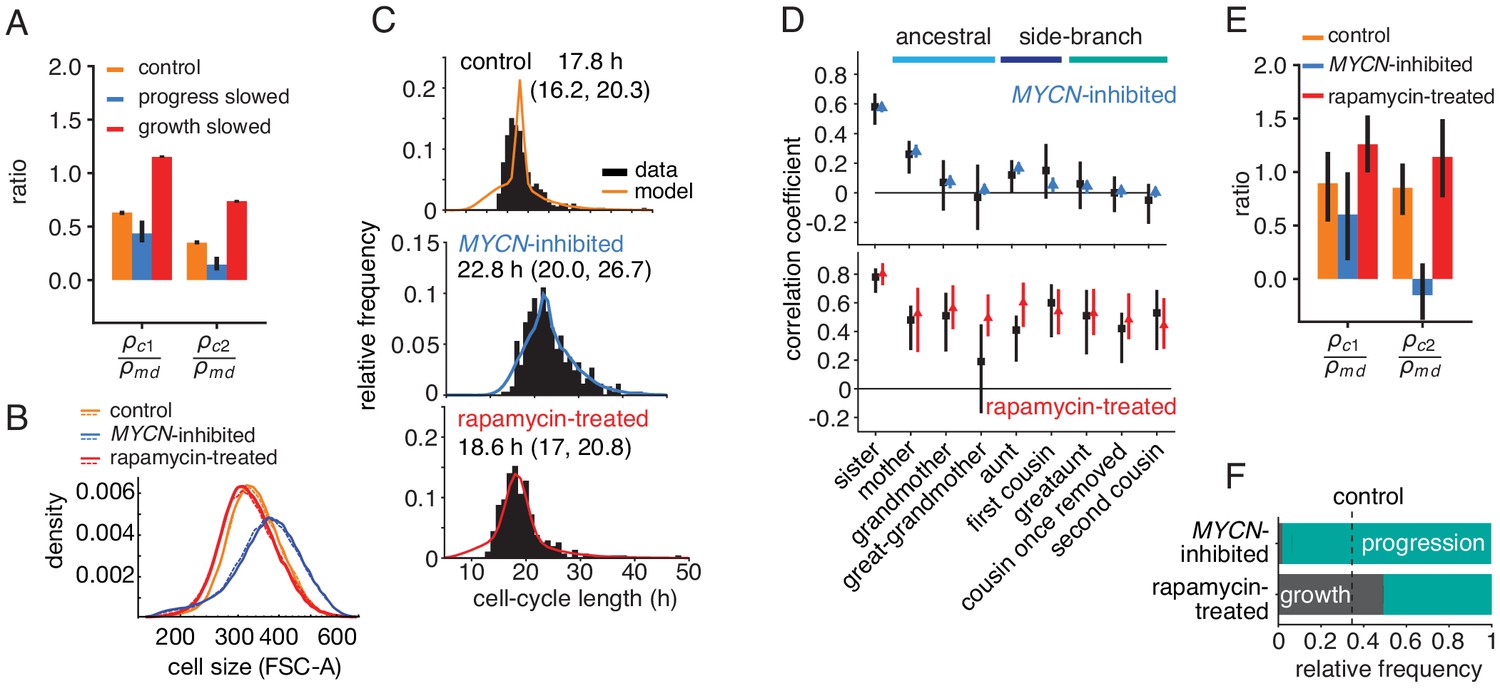
Targeted perturbation of growth and cell-cycle progression.
(A) Predictions for changes in the ratio of cousin to mother-daughter correlations, when slowing growth or cycle progress compared to the best-fit parameters (control). first cousins, second cousins. (B–F) Experimental perturbations of cycle progress and growth by MYCN inhibition and rapamycin treatment, respectively. (B) Cell size distribution. Areal forward scatter measured experimentally by flow cytometry for control high-MYCN, MYCN-inhibited and rapamycin-treated (40 nM) TET21N neuroblastoma cells; shown are two biological replicates, indicated by solid and dashed lines, that were measured with the same FACS settings. (C) Measured and best-fit model cycle length distributions. Median and interquartile range are indicated. (D) Measured (black) and best-fit correlation pattern of MYCN-inhibited and rapamycin-treated cells with Spearman rank correlation coefficient and 95%-confidence bounds. (E) Measured cousin/mother daughter correlation ratios. (F) Proportion of simulated cells limited by growth or progression, using best-fit parameters for MYCN inhibition or rapamycin-treatment.
-
Figure 4—source data 1
Raw cell cycle data for lineage trees in perturbed TET21N replicates -myc1-2 and rap1-2.
- https://cdn.elifesciences.org/articles/51002/elife-51002-fig4-data1-v2.xlsx
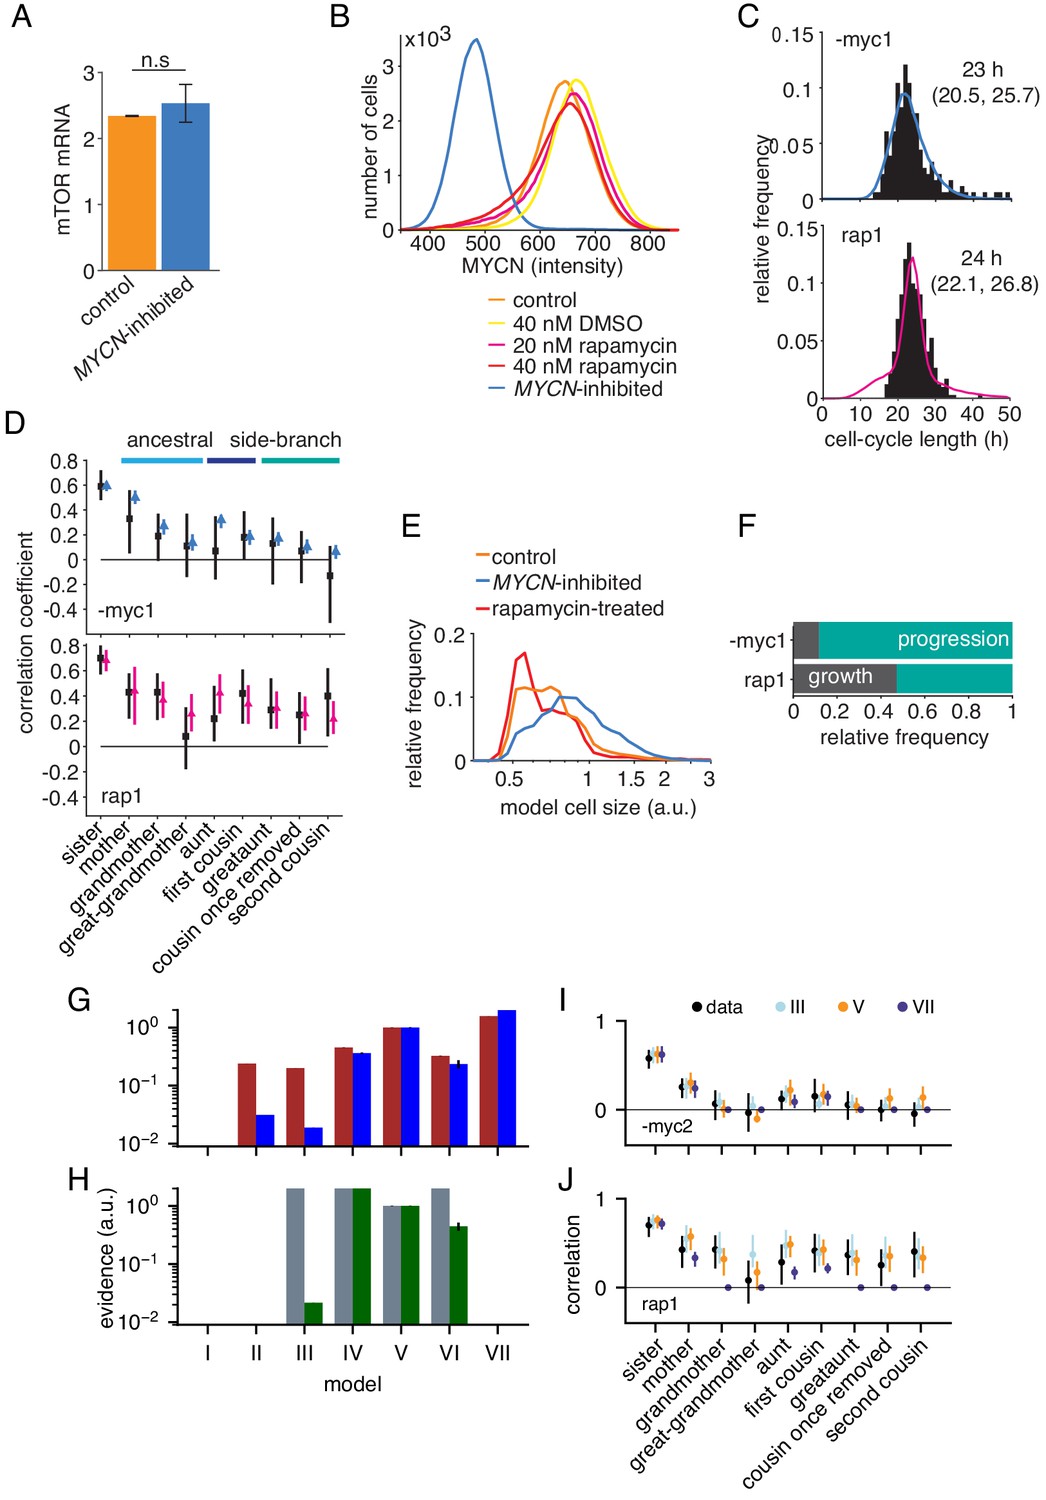
Figure 4—figure supplement 1
Growth-progression and BAR models fitted to perturbation data.
(A) mTOR mRNA expression in TET21N cells measured by RNA-Seq, , mean and SEM. No significant difference in mTOR expression between high-MYCN control and MYCN-inhibited cells with paired t-test, . (B) MYCN protein expression in TET21N neuroblastoma cells under various experimental conditions, measured by flow cytometry, , representative experiment shown. (C and D) Data and model fit of the two replicate experiments not shown in Figure 4C,D. Data shown in black and model fits in blue (MYCN-inhibited) and pink (rapamycin-treated). (C) Distribution of cycle lengths showing median and interquartile range (D) Correlation pattern with bootstrapp 95%-confidence bounds. (E) Model simulated cell size distribution of population at one point in time comparable to Figure 4B. (F) Proportion of simulated MYCN-inhibited and rapamycin-treated cells limited by growth or progression using the growth-progression model showing mean of 100 simulations. Data and model fit of the two replicates not shown in Figure 4F. (G) Evidences relative to model V (as in Figure 2—figure supplement 1A) but for MYCN-inhibited cells. (I) Corresponding correlations. The simpler correlation structure without long-range lateral correlation favors model VII for both replicates -myc1 and -myc2. (H, J) as (G, I) but for rapamycin-treated cells. Strong intra-generational correlations favor model IV and V and exclude model VII. Model III (independent processes) explains only the replicate rap1, shown leftmost in H and in J.
Figure 4—figure supplement 2
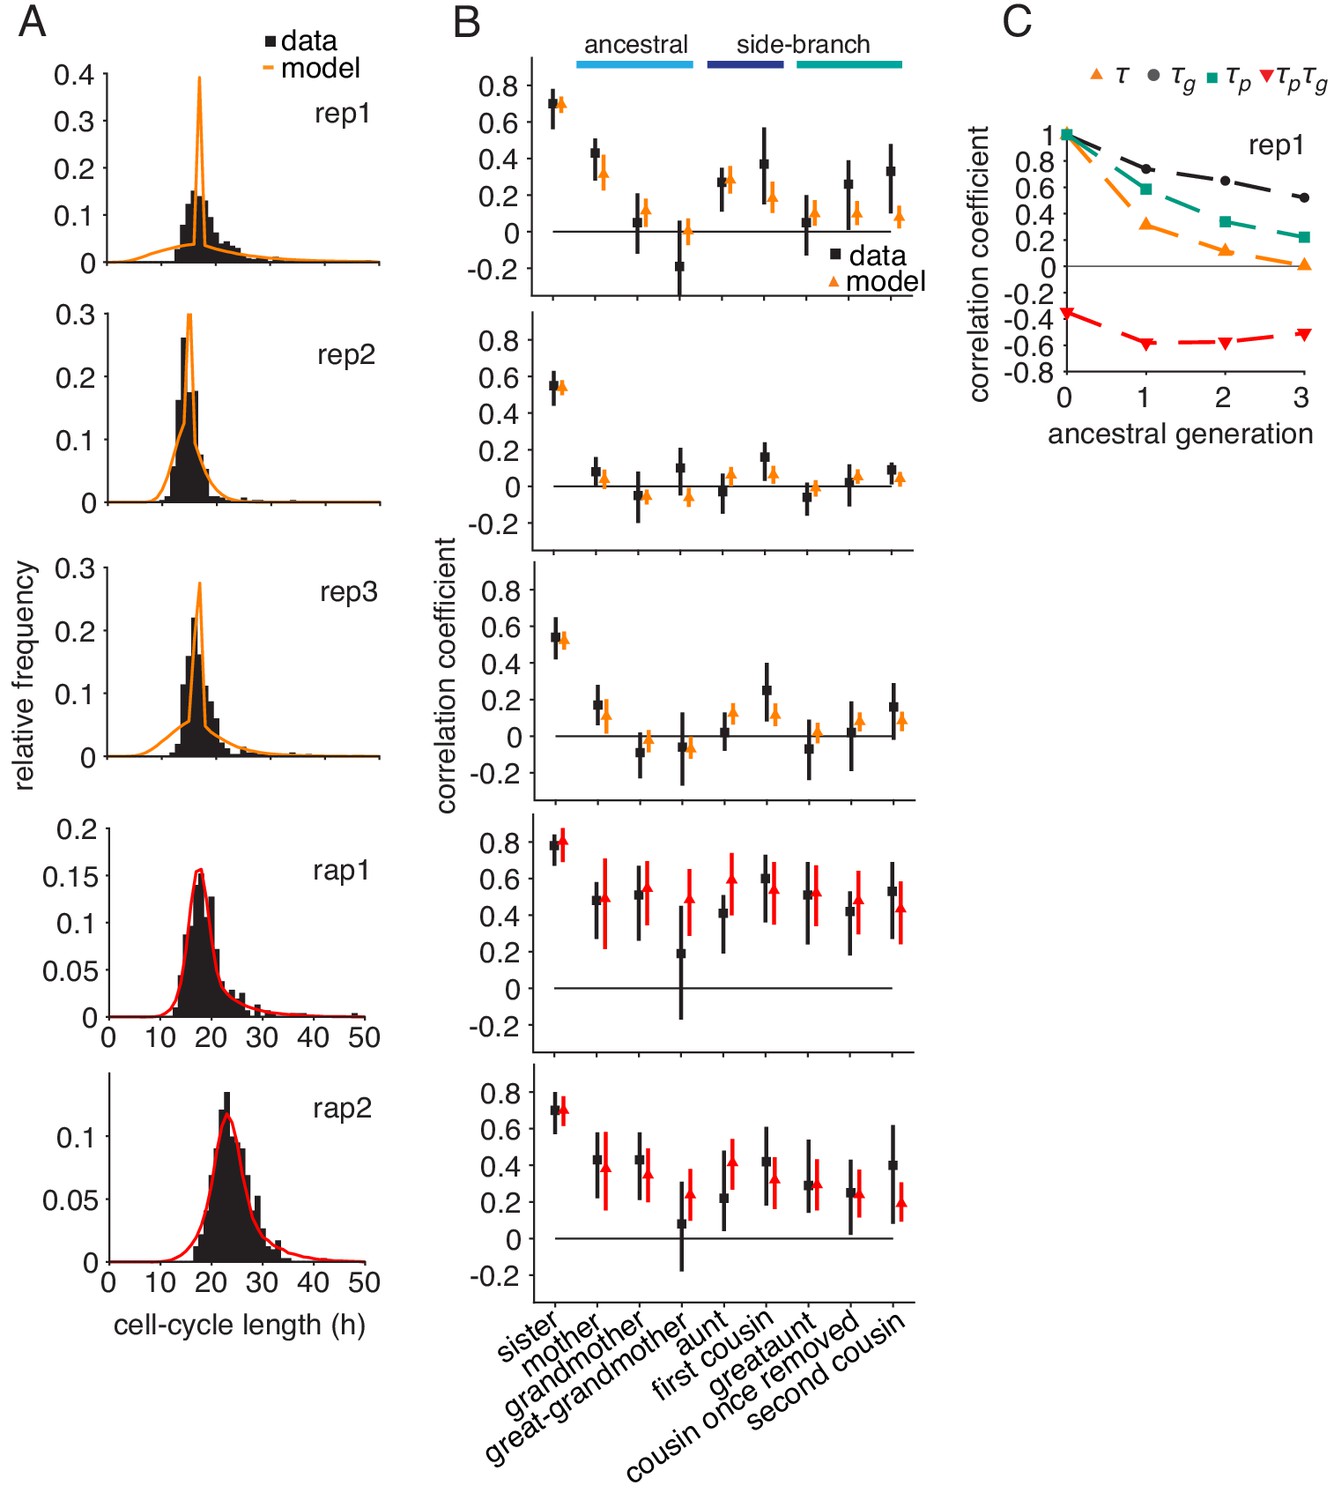
Logistic growth-progression model fitted to all control, rapamycin-treated and embryonic stem cell datasets.
Growth-progression model with logistic cell growth. Model (colors) fitted to the summary statistics of the perturbed time-lapse imaging datasets (black) including, (A) cell-cycle length distributions and (B) Spearman rank correlations with 95% bootstrap confidence bounds. (C) Autocorrelations and cross-correlations along the ancestral line of simulated lineage trees for fit to replicate rep1.
Figure 5 with 1 supplement

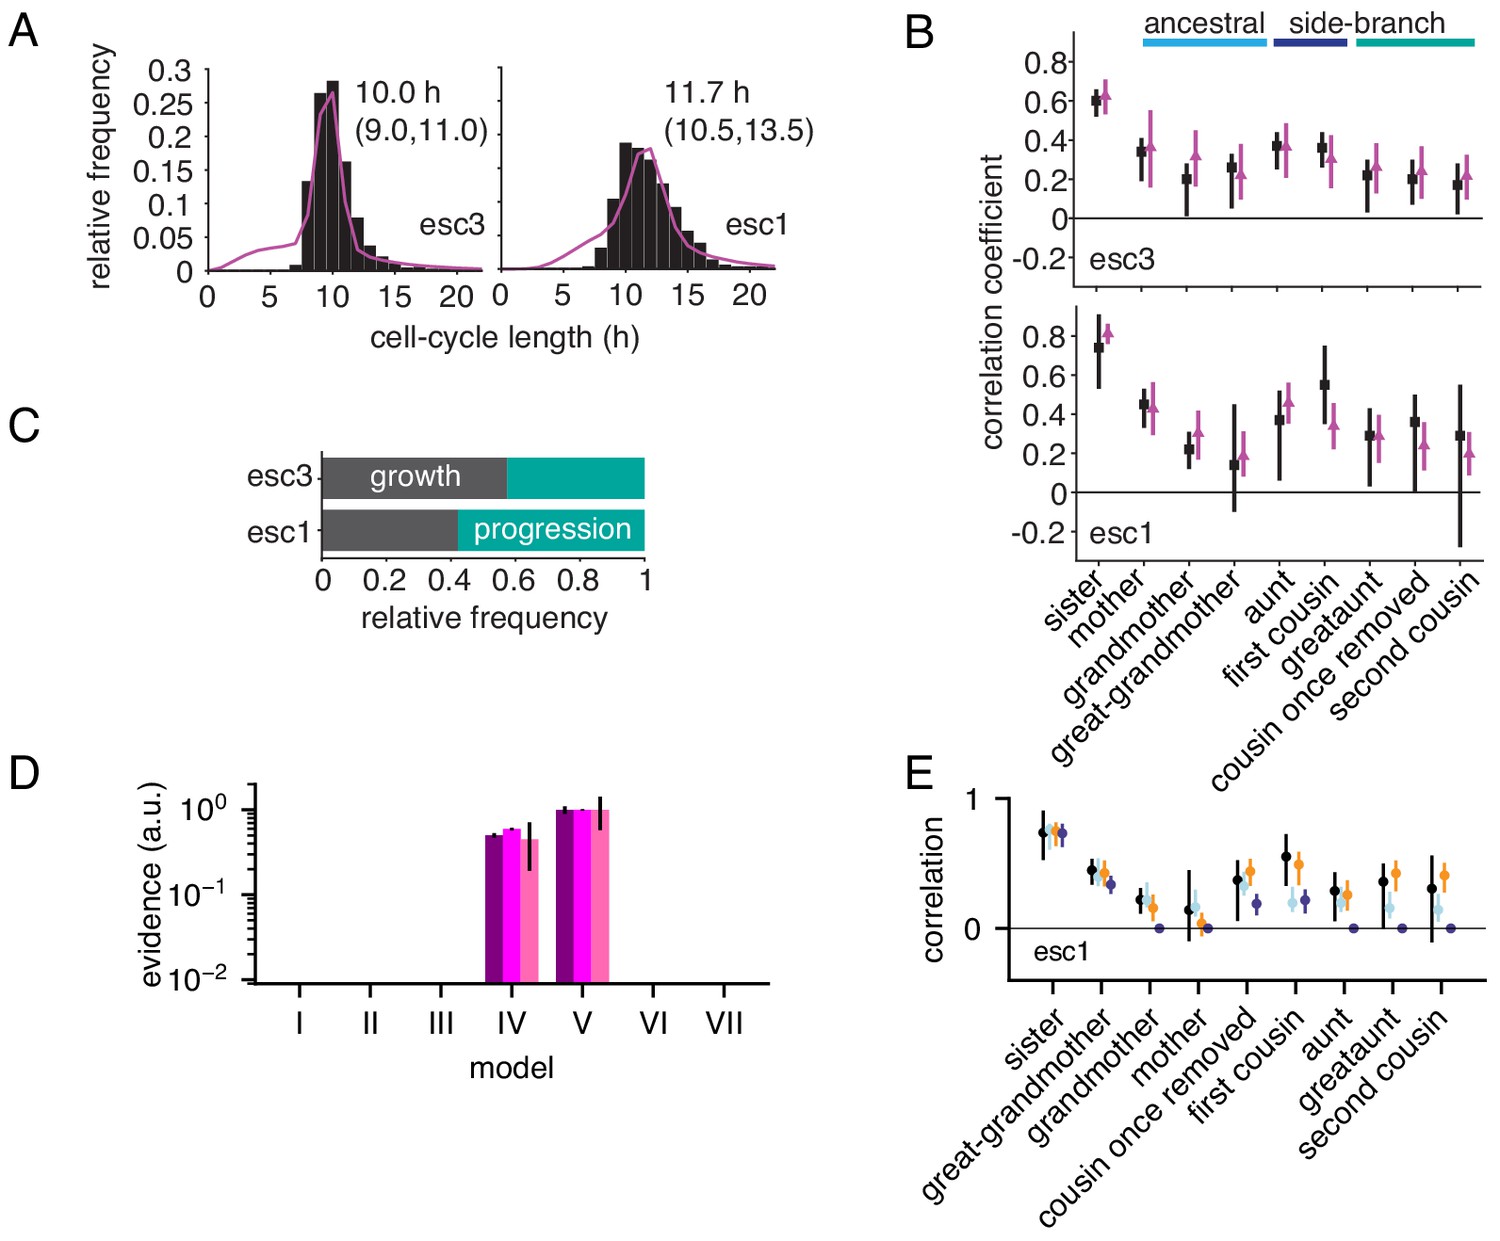
Rapid cell cycle of embryonic stem cells are frequently growth-limited.
(A) Cycle length distribution of data (black) and growth-progression model (purple). (B) Measured (black) and modeled (purple) correlation pattern using the growth-progression model. (C) Model evidences of the BAR model, version numbering as in Figure 2B. (D) Proportion of simulated cells limited by growth or progression. Data from Filipczyk et al. (2015) reanalyzed for cell-cycle duration.
Figure 5—figure supplement 1
Growth-progression and BAR models fitted to embryonic stem cell data.
(A,B) Embryonic stem cell data (black) provided by Filipczyk et al. (2015) and model fit (purple) of the two replicate experiments not shown in Figure 5A–C. showing (A) distribution of cycle lengths with median and interquartile range and (B) correlation pattern with bootstrap 95%-confidence bounds. (C) Proportion of simulated embryonic stem cells limited by growth or progression using the growth-progression model showing mean of 100 simulations. (D, E) As Figure 4—figure supplement 1G–J but for embryonic stem cells. Model V (orange dots) is favored by short-ranged ancestral and extended intra-generational correlations in all three replicates (for legend see Figure 4—figure supplement 1I, J).
Author response image 1
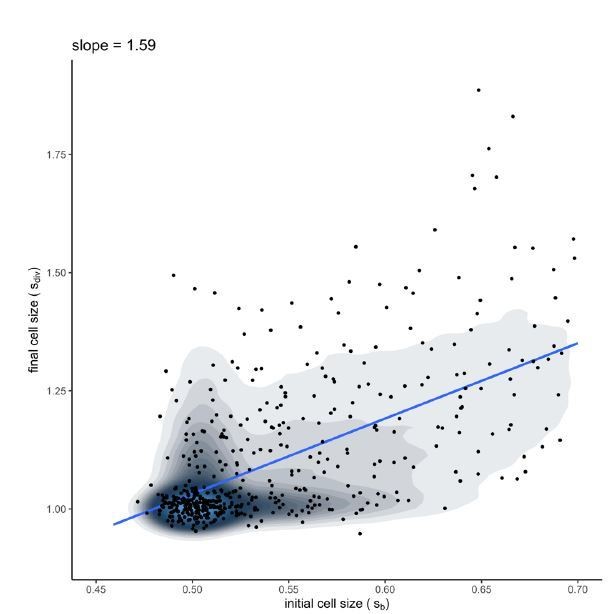
Simulation of the growth-progression model (with best-fit parameters for control rep1).
The linear regression of final cell size versus cell size at birth shows a slope between 1 (pure adder) and 2 (pure timer), falling in the range of experimental data measured for mammalian cell lines by Cadart et al., 2018.
Author response image 2

Sample traces of three TET21N cells with fluorescent reporters for the circadian clock (black lines) and the cell cycle (red lines).
Dual reporter TET21N cells were grown and imaged as described in the manuscript.
Additional files
-
Supplementary file 1
Key resources table.
- https://cdn.elifesciences.org/articles/51002/elife-51002-supp1-v2.doc
-
Transparent reporting form
- https://cdn.elifesciences.org/articles/51002/elife-51002-transrepform-v2.pdf
Download links
A two-part list of links to download the article, or parts of the article, in various formats.
Downloads (link to download the article as PDF)
Open citations (links to open the citations from this article in various online reference manager services)
Cite this article (links to download the citations from this article in formats compatible with various reference manager tools)
Hidden long-range memories of growth and cycle speed correlate cell cycles in lineage trees
eLife 9:e51002.
https://doi.org/10.7554/eLife.51002


