Estimates of the global burden of Japanese encephalitis and the impact of vaccination from 2000-2015
- Oxford University Clinical Research Unit, Wellcome Trust Asia Program, Viet Nam
- Biological Science Department, University of Notre Dame, United States
- Virology Department, Institute of Virology and Immunology, University of Bern, Switzerland
- Centre for Tropical Medicine and Global Health, Nuffield Department of Medicine, University of Oxford, United Kingdom
- Saw Swee Hock School of Public Health, National University of Singapore, Singapore
Figures
Figure 1

Flowchart describes two main stages in our analysis: Estimating FOI (force of infection) and generating burden.
In Stage I we estimate FOI (force of infection) of all studies’ catchment area. In Stage II we then used the FOI estimates to generate global burden. Abbreviation: WPP: World Population Prospects.
Figure 2 with 1 supplement
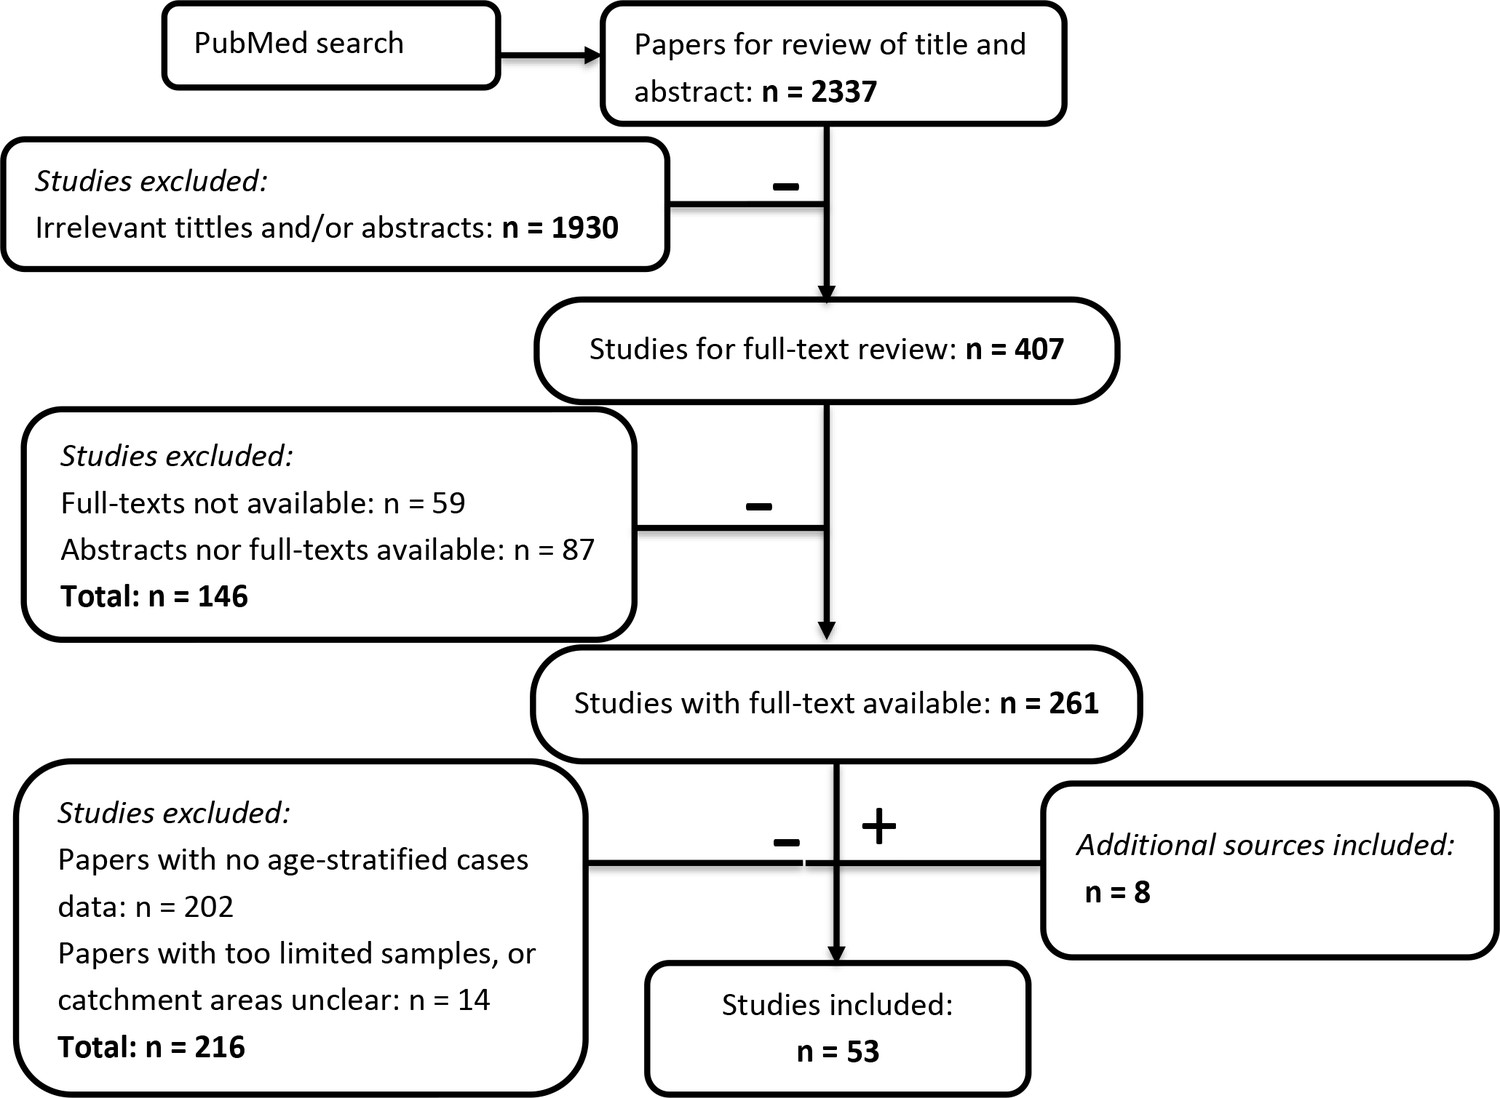
Flowchart describing the systematic review procedure searching for Japanese encephalitis age- stratified case data.
-
Figure 2—source data 1
Studies from the systematic review that contain age-stratified case data.
Abbreviation: AUS: Australia, BGD: Bangladesh, BRN: Brunei, BTN: Bhutan, CHN: China, IDN: Indonesia, IND: India, JPN: Japan, KHM: Cambodia, KOR: South Korea, LAO: Laos, LKA: Sri Lanka, MMR: Myanmar, MYS: Malaysia, NPL: Nepal, PAK: Pakistan, PHL: Philippines, PNG: Papua New Guinea, PRK: North Korea, RUS: Russia, SGP: Singapore, THA: Thailand, TLS: Timor-Leste, TWN: Taiwan, VNM: Vietnam.
- https://cdn.elifesciences.org/articles/51027/elife-51027-fig2-data1-v2.docx
-
Figure 2—source data 2
PRISMA Checklist.
- https://cdn.elifesciences.org/articles/51027/elife-51027-fig2-data2-v2.pdf
Figure 2—figure supplement 1
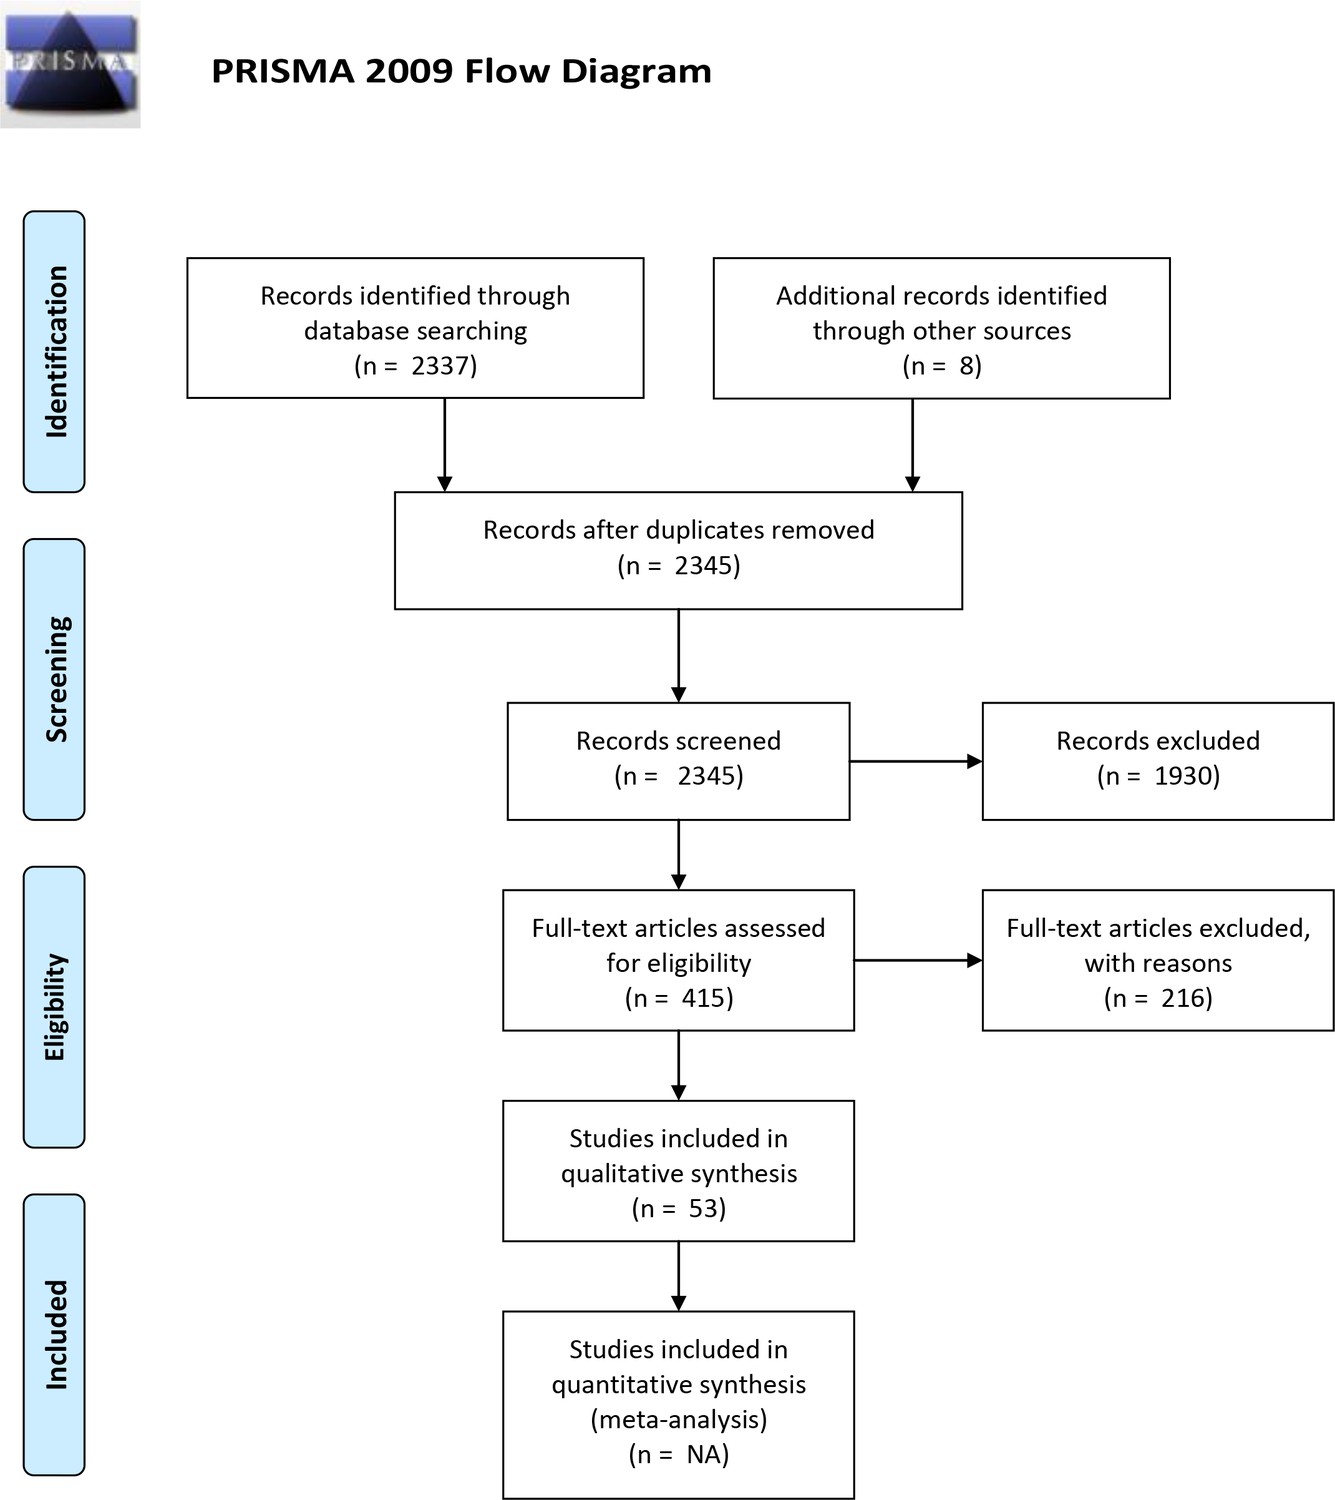
PRISMA 2009 flowchart.
Figure 3
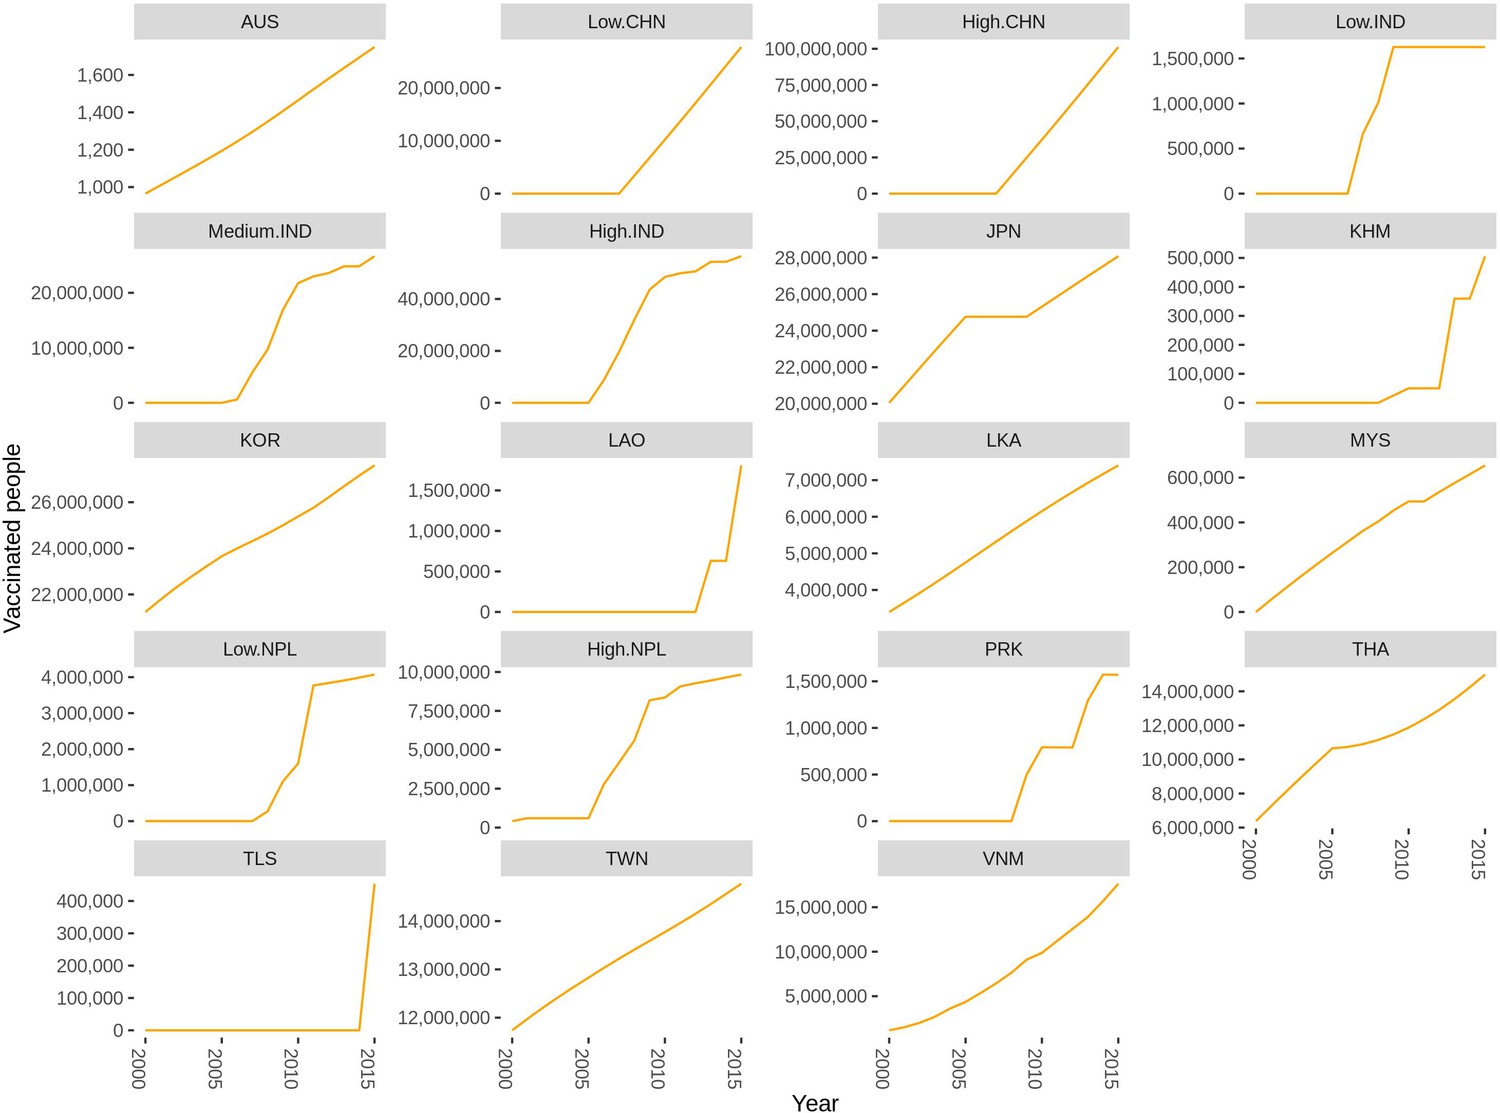
Reported number of individuals vaccinated in each region from multiple data sources by region from 2000 to 2015.
If the country is not listed there is no vaccination reported. Abbreviations: AUS: Australia, CHN: China, IND: India, JPN: Japan, KHM: Cambodia, KOR: South Korea, LAO: Laos, LKA: Sri Lanka, MYS: Malaysia, NPL: Nepal, PRK: People’s Republic of Korea, THA: Thailand, TLS: Timor-Leste, TWN: Taiwan, VNM: Vietnam. The supplementary file: Figure 3—source data 1 lists the vaccination data and the sources for each country.
-
Figure 3—source data 1
Vaccine information and how it was used in our model.
Abbreviation: AUS: Australia, BGD: Bangladesh, BRN: Brunei, BTN: Bhutan, CHN: China, IDN: Indonesia, IND: India, JPN: Japan, KHM: Cambodia, KOR: South Korea, LAO: Laos, LKA: Sri Lanka, MMR: Myanmar, MYS: Malaysia, NPL: Nepal, PAK: Pakistan, PHL: Philippines, PNG: Papua New Guinea, PRK: North Korea, RUS: Russia, SGP: Singapore, THA: Thailand, TLS: Timor-Leste, TWN: Taiwan, VNM: Vietnam.
- https://cdn.elifesciences.org/articles/51027/elife-51027-fig3-data1-v2.docx
Figure 4 with 2 supplements
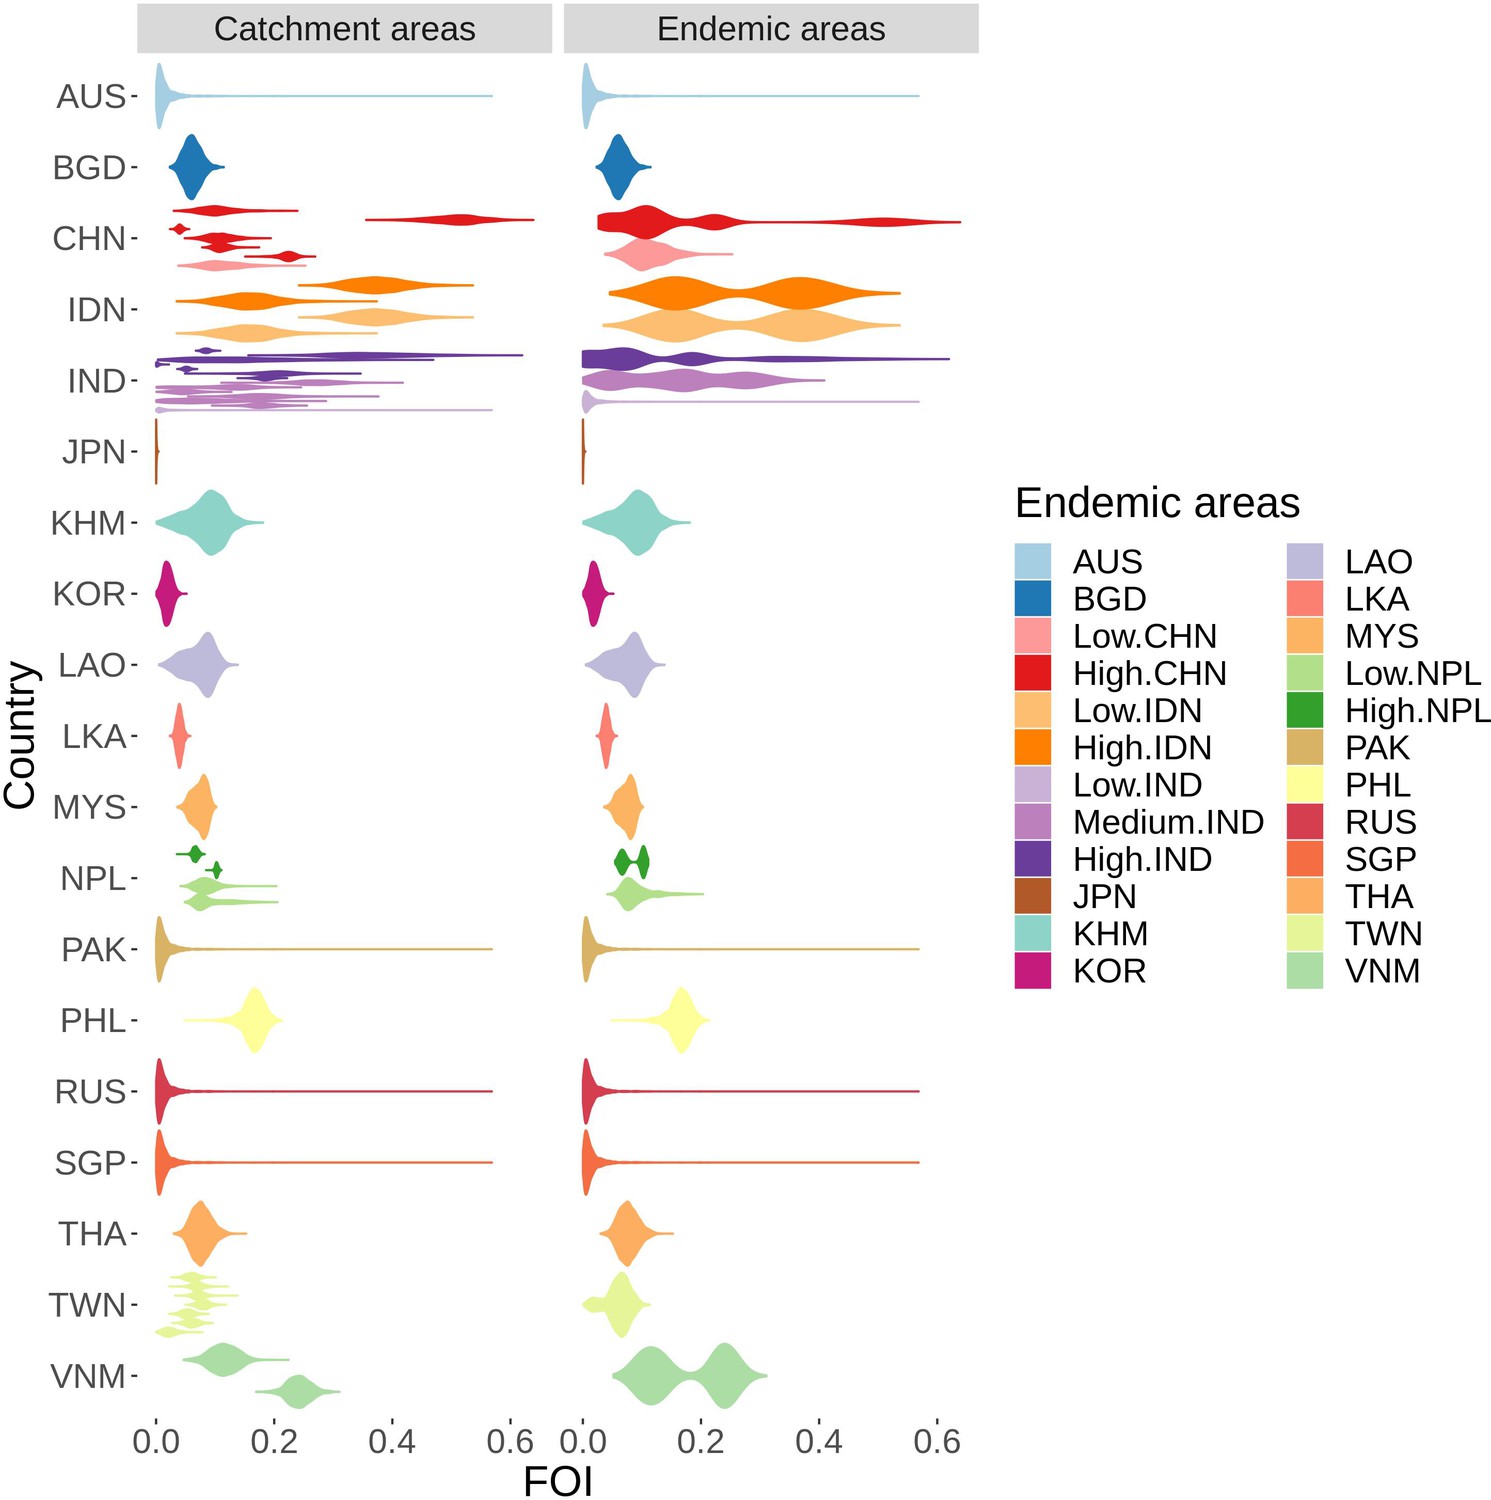
FOI distribution estimated from all studies’ catchment areas (on the left), each distribution represents FOI from one study, which were used to infer the FOI distribution in all endemic areas (on the right).
The colors are coded after the endemic areas as in the legend. Abbreviation: AUS: Australia, BGD: Bangladesh, CHN: China, IDN: Indonesia, IND: India, JPN: Japan, KHM: Cambodia, KOR: South Korea, LAO: Laos, LKA: Sri Lanka, MYS: Malaysia, NPL: Nepal, PHL: Philippines, RUS: Russia, SGP: Singapore, THA: Thailand, TWN: Taiwan, VNM: Vietnam. Countries have low, medium or high following the classification in Campbell et al., 2011.
-
Figure 4—source data 1
Estimated FOI and studies used/assumptions of 30 endemic areas.
- https://cdn.elifesciences.org/articles/51027/elife-51027-fig4-data1-v2.docx
-
Figure 4—source data 2
Model fit of all age-stratified case data.
For each study, the red dots with red vertical lines are the mean cases by age group estimated from the model with 95% credible interval. The blue dots are the cases by each age group.
- https://cdn.elifesciences.org/articles/51027/elife-51027-fig4-data2-v2.pdf
-
Figure 4—source data 3
Susceptible proportion after vaccination in study population.
For each study, the red dots with red vertical lines are the mean susceptible proportion after vaccination by age group estimated from the model with 95% credible interval. The blue dots with blue vertical lines are the mean susceptible proportion after vaccination by age group calculated from vaccination information with generated 95% credible interval from the beta distributions.
- https://cdn.elifesciences.org/articles/51027/elife-51027-fig4-data3-v2.pdf
-
Figure 4—source data 4
Trace plots for all models fits.
- https://cdn.elifesciences.org/articles/51027/elife-51027-fig4-data4-v2.pdf
-
Figure 4—source data 5
Acf plots for all model fits.
- https://cdn.elifesciences.org/articles/51027/elife-51027-fig4-data5-v2.pdf
Figure 4—figure supplement 1
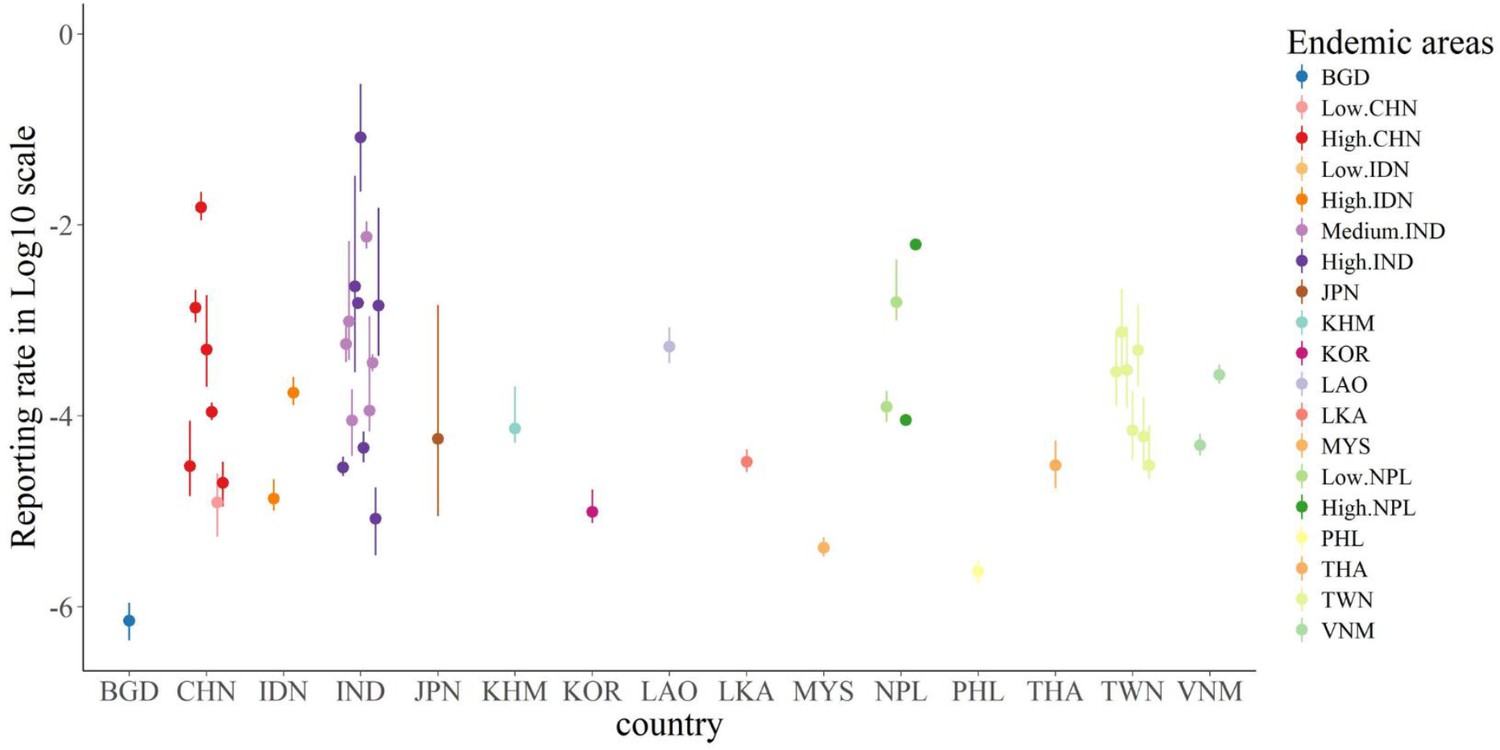
Estimated reporting rate from all studies.
For each study, the dots with vertical lines are the mean reporting rate estimated from the model with 95% credible interval. The colors represent the endemic areas as seen in the legend.
Figure 4—figure supplement 2
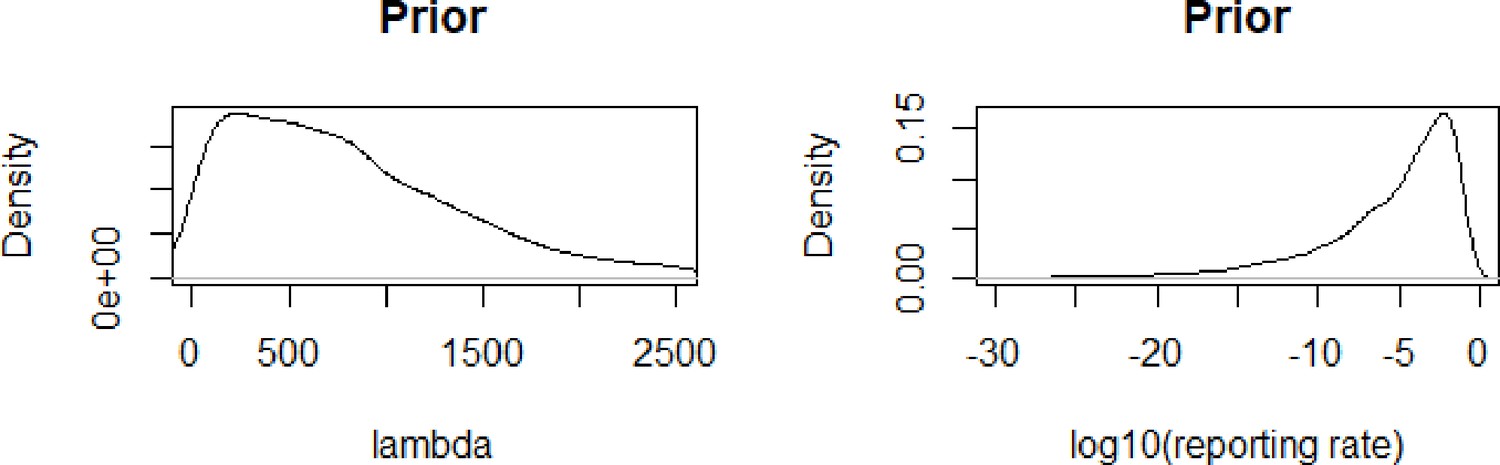
prior distributions for lambda and rho.
Figure 5
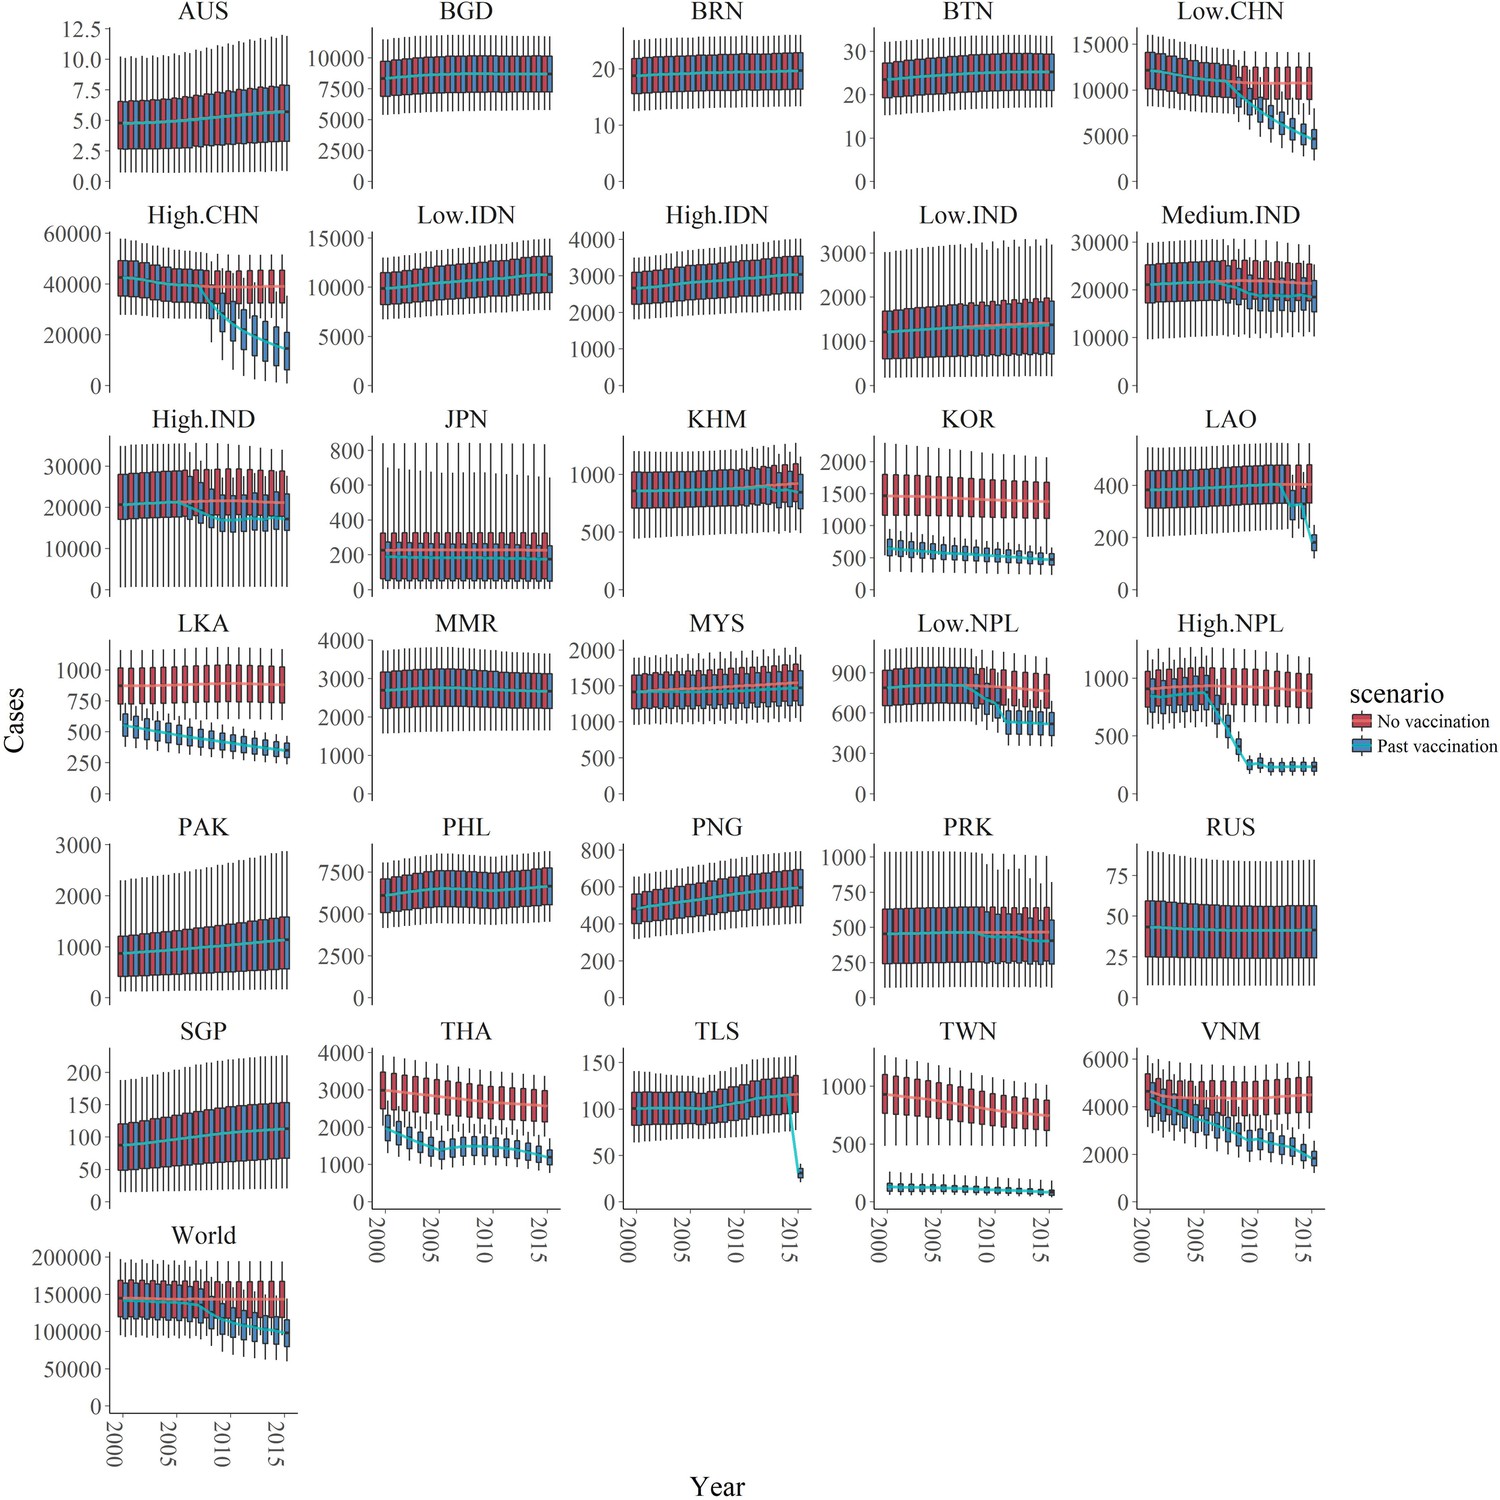
Number of estimated cases with and without vaccination of the 30 endemic areas and of the world from 2000 to 2015.
The two scenarios, with or without vaccination, are also shown in blue and red respectively. In all areas, the boxplots represent the estimated cases with 95% credible intervals (also shown 1 st quartile, 3rd quartile) with the solid lines showing the mean value of each interval. Abbreviation: AUS: Australia, BGD: Bangladesh, BRN: Brunei, BTN: Bhutan, CHN: China, IDN: Indonesia, IND: India, JPN: Japan, KHM: Cambodia, KOR: South Korea, LAO: Laos, LKA: Sri Lanka, MMR: Myanmar, MYS: Malaysia, NPL: Nepal, PAK: Pakistan, PHL: Philippines, PNG: Papua New Guinea, PRK: North Korea, RUS: Russia, SGP: Singapore, THA: Thailand, TLS: Timor-Leste, TWN: Taiwan, VNM: Vietnam.
-
Figure 5—source data 1
Results of sensitivity analyses.
- https://cdn.elifesciences.org/articles/51027/elife-51027-fig5-data1-v2.pdf
Figure 6
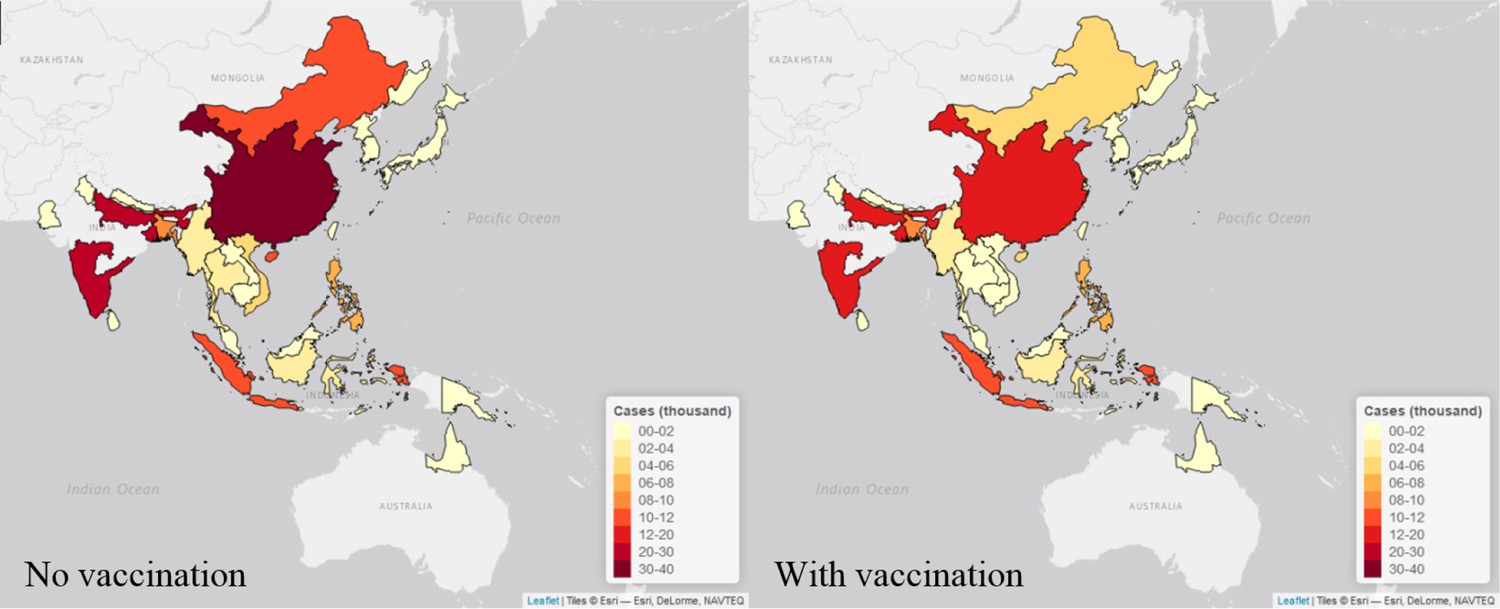
Maps of estimated cases (in thousand) in 30 endemic areas for two scenarios in 2015.
Each endemic area is shaded in proportion to the area’s estimated cases in thousand as seen in the legend, with yellow shade is the lowest value and red shade is the highest value. The map on the left is the estimates from no vaccination scenario, and the right is from the vaccination scenario. The maps were made by leaflet package in R (Joe et al., 2017).
Tables
Table 1
Comparing annual case estimates from Campbell et al. to our estimates for the year 2015 (as this was the year of estimation of the previous estimates).
Group A: Taiwan, Japan, South Korea; Group B: Australia, low endemic area in India, Pakistan, Russia, Singapore; Group C1: high endemic area in China; Group C2: low endemic area in China; Group D: Cambodia, high endemic area in Indonesia, Laos, Sabah and Labuan in Malaysia, Myanmar, Philippines, Timor-Leste; Group E: low endemic area in Indonesia, Peninsular Malaysia, Papua New Guinea; Group F: high endemic area in India, high endemic area in Nepal; Group G: Bangladesh, Bhutan, Brunei, low endemic area in Nepal; Group H: Medium endemic area in India, Sarawak in Malaysia, Sri Lanka, Thailand, Vietnam; Group I: North Korea.
| Incidence Group | Case numbers: Previous estimates | Case numbers: Our no vaccination scenario Mean estimates (and 95% Cis) | Case numbers: Our vaccination scenario Mean estimates (and 95% Cis) |
|---|---|---|---|
| A | 6 | 2,307 (1,175–3,497) | 863 (453–1,469) |
| B | 2 | 2595 (388-6,243) | 2540 (381-6,071) |
| C1 | 33,849 | 38,789 (26,128–51,482)* | 22,013 (3,778–42,375)* |
| C2 | 28 | 10,752 (7,297–14,152) | 7,094 (4,230–10,579) |
| D | 7917 | 13,710 (9,333–18,135) | 13,700 (9,325–18,125) |
| E | 3645 | 12,932 (8,804–17,059) | 12,932 (8,804–17,059) |
| F | 12,350 | 22,514 (1,503–36,423)* | 17,304 (846-27,930)* |
| G | 1358 | 9,538 (6,322–12,881) | 9,277 (6,133–12,548) |
| H | 8072 | 29,942 (17,431–40,933) | 23,201 (13,647–31,542) |
| I | 670 | 465 (77–1,022)* | 433 (74–912)* |
| Total | 67,897 | 143,545 (94,469 – 194,940) | 109,358 (65,968–156,669) |
-
*Our estimates are comparable to the previous estimates.
Additional files
Download links
A two-part list of links to download the article, or parts of the article, in various formats.
Downloads (link to download the article as PDF)
Open citations (links to open the citations from this article in various online reference manager services)
Cite this article (links to download the citations from this article in formats compatible with various reference manager tools)
Estimates of the global burden of Japanese encephalitis and the impact of vaccination from 2000-2015
eLife 9:e51027.
https://doi.org/10.7554/eLife.51027


