Mannose receptor is an HIV restriction factor counteracted by Vpr in macrophages
- Department of Microbiology and Immunology, University of Michigan, United States
- Cellular and Molecular Biology Program, University of Michigan, United States
- Department of Internal Medicine, University of Michigan, United States
- Graduate Program in Immunology, University of Michigan, United States
- University of Michigan, United States
Figures
Figure 1 with 1 supplement
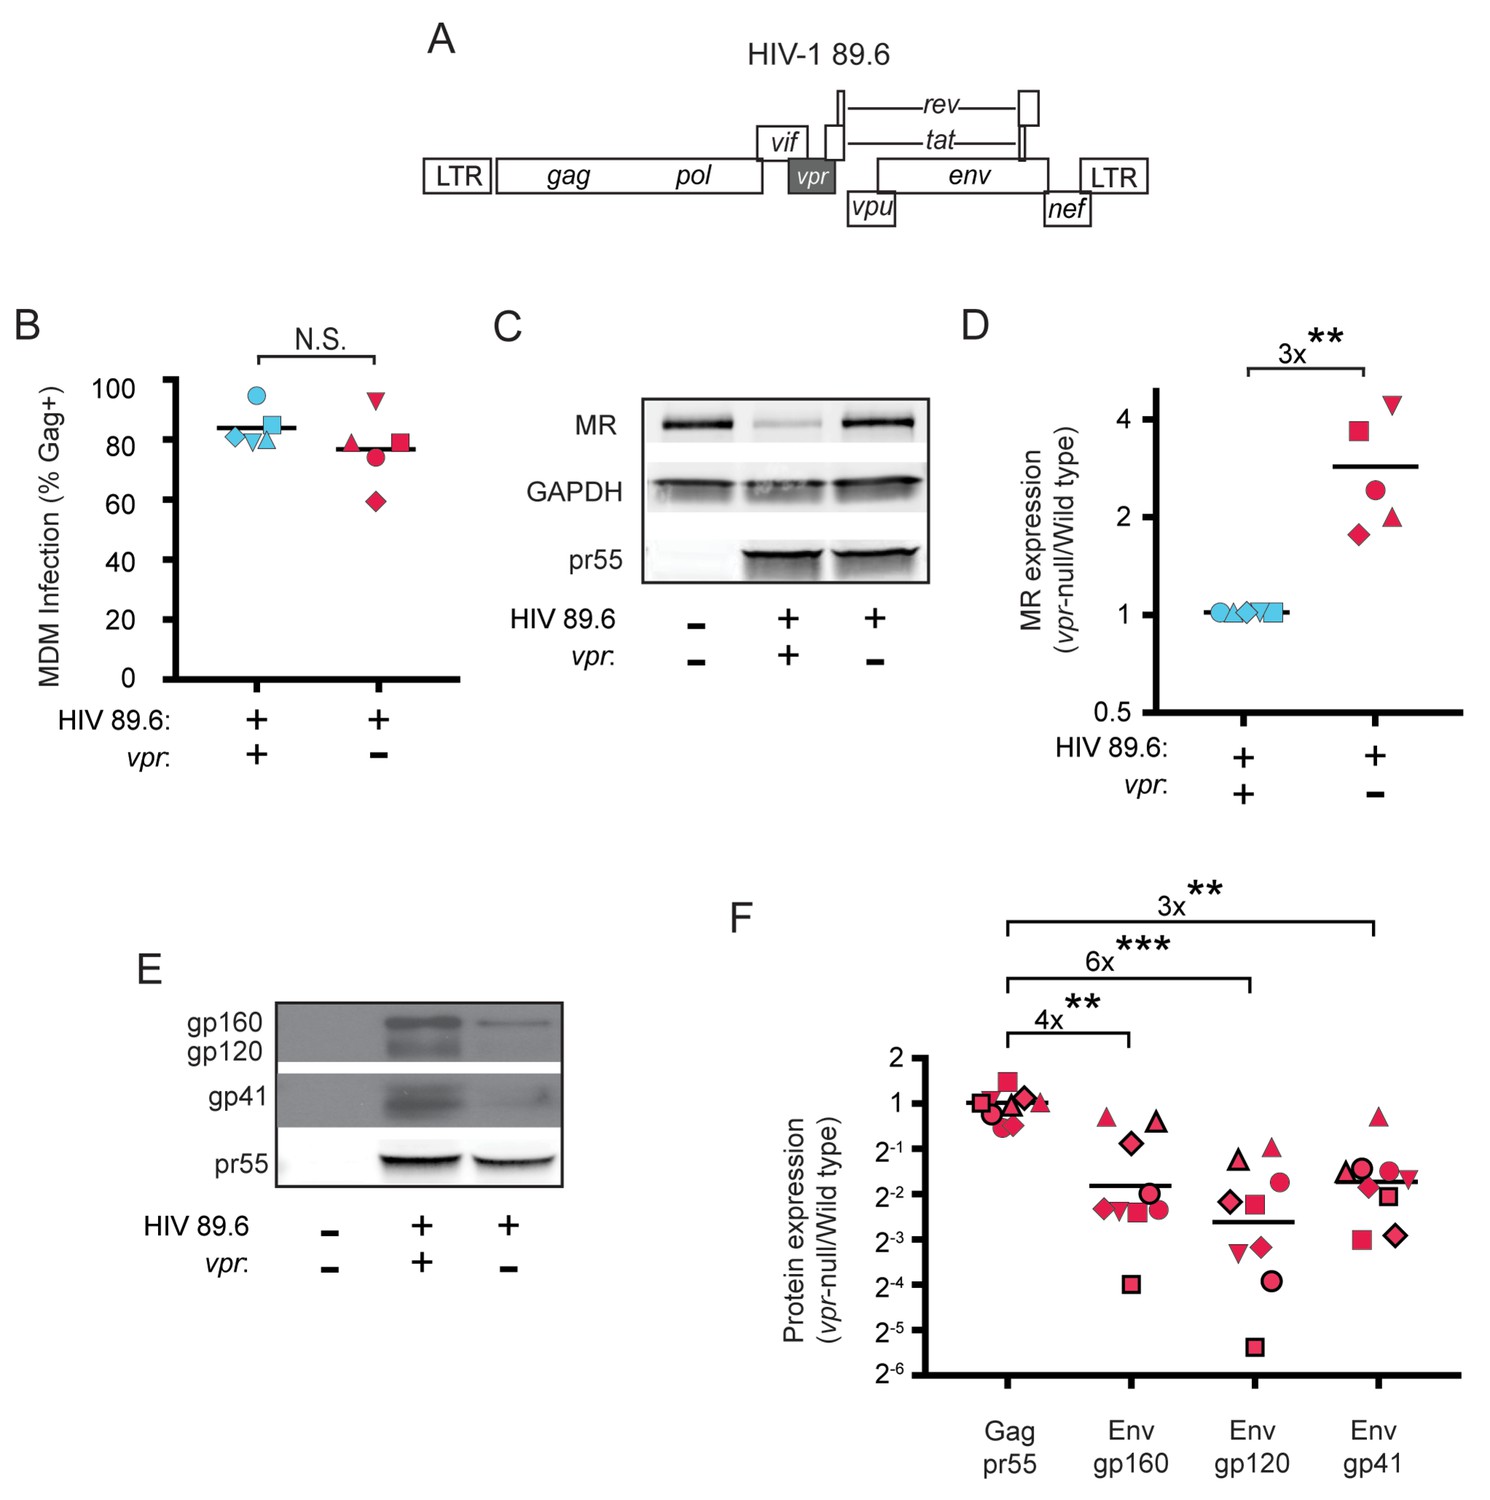
HIV Vpr reduces steady state levels of host mannose receptor in MDM and increases steady state levels of viral Env protein.
(A) Diagram of the HIV 89.6 proviral genome. The shaded box shows the location of vpr, which was disrupted by a frame shift mutation to create the Vpr-null version (Mashiba et al., 2014). HIV-1 89.6 is a dual CXCR4/CCR5-tropic HIV molecular clone isolated from the peripheral blood of an AIDS patient (Collman et al., 1992). (B) Summary graph depicting MDM infected by HIV 89.6 wild-type and vpr-null with matched infection frequencies of at least 50% 10 days post infection as measured flow cytometrically by intracellular Gag p24 staining. This subset with high frequencies of infection was selected to examine potential effects on host factors. (C) Western blot analysis of whole cell lysates from MDM prepared as in B. (D) Summary graph displaying relative expression of MR in wild-type and mutant 89.6 from blots as shown in C. Western blot protein bands were quantified using a Typhoon scanner. Values for MR expression in MDM infected with Vpr-null HIV were normalized to GAPDH and then to wild-type for each donor. Statistical significance was determined using a two-tailed, ratio t-test. **p=0.005 (E) Western blot analysis of HIV protein expression in MDM infected as in B. (F) Summary graph of HIV protein expression from western blot analysis as in E and quantified as described in methods. The ratio of expression in wild-type to vpr-null infection is shown. Data from 9 independent donors with similar frequencies of infection (within 2-fold) following ten days of infection are shown. Statistical significance was determined using a two-tailed, ratio t-test, N.S. – not significant, p=0.31, **p<0.01, ***p<0.001. Data from each donor is represented by the same symbol in all charts. Mean values are indicated.
Figure 1—figure supplement 1

HIV Vpr reduces steady state levels of MR but not GBP5, STING or IFITM3.
(A) Western blot analysis of whole cell lysates from MDM infected with wild-type or vpr-null HIV-1 89.6 for 10 days. (B) Western blot analysis of whole cell lysates from MDM infected with wild-type or vpr-null HIV-1 89.6 and YU2-pseudotyped NL4-3 for 10 days. n = 3 independent donors.
Figure 2 with 1 supplement
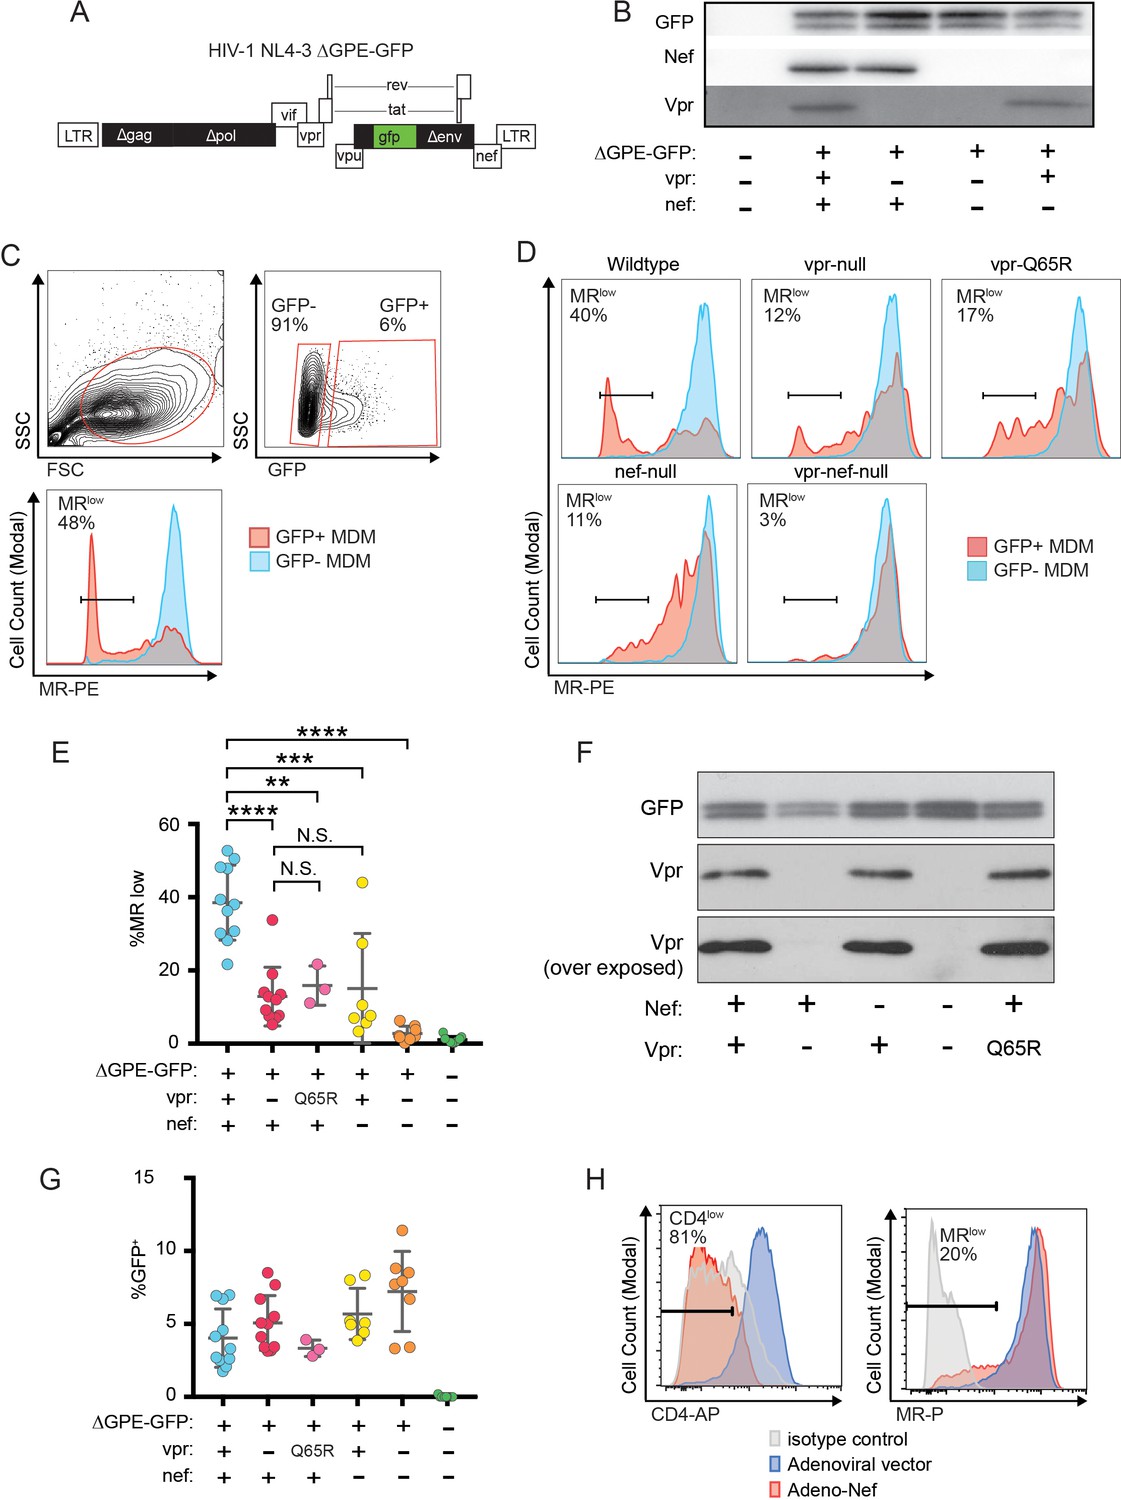
Combined effects of Nef and Vpr completely remove MR from a significant proportion of infected cells at early time points.
(A) Diagram of HIV NL4-3 ∆GPE-GFP. (B) Western blot analysis of whole cell lysates from 293T cells transfected with the indicated viral expression construct. (C) Flow cytometry plots indicating the gating strategy used to identify live GFP+ vs GFP- cells and the fraction of cells that are MRlow. (D) Representative flow cytometric analysis of MDM at five days post transduction by the indicated virus. The percentage of GFP+ cells that fell into the MRlow gate is indicated in each panel. (E) Summary graph depicting the percentage of GFP+ cells that fell into the MRlow gate in transduced MDM. For the uninfected column the results from GFP- cells are displayed. (Each dot indicates an independent donor, range 3–11). (F) Western blot analysis of whole cell lysates from 293T cells transfected with the indicated viral expression construct. (G) Summary graph depicting the frequency of transduced (GFP+) MDM at the time of harvest. (H) Representative flow cytometric plots of MDM transduced with the indicated adenoviral vector (n = 3 independent donors). For parts E and F mean +/- standard deviation is shown. Statistical significance was determined by a two-tailed, paired t-test. N.S. not significant, **p<0.01, ***p<0.001, ****p<0.0001.
Figure 2—figure supplement 1
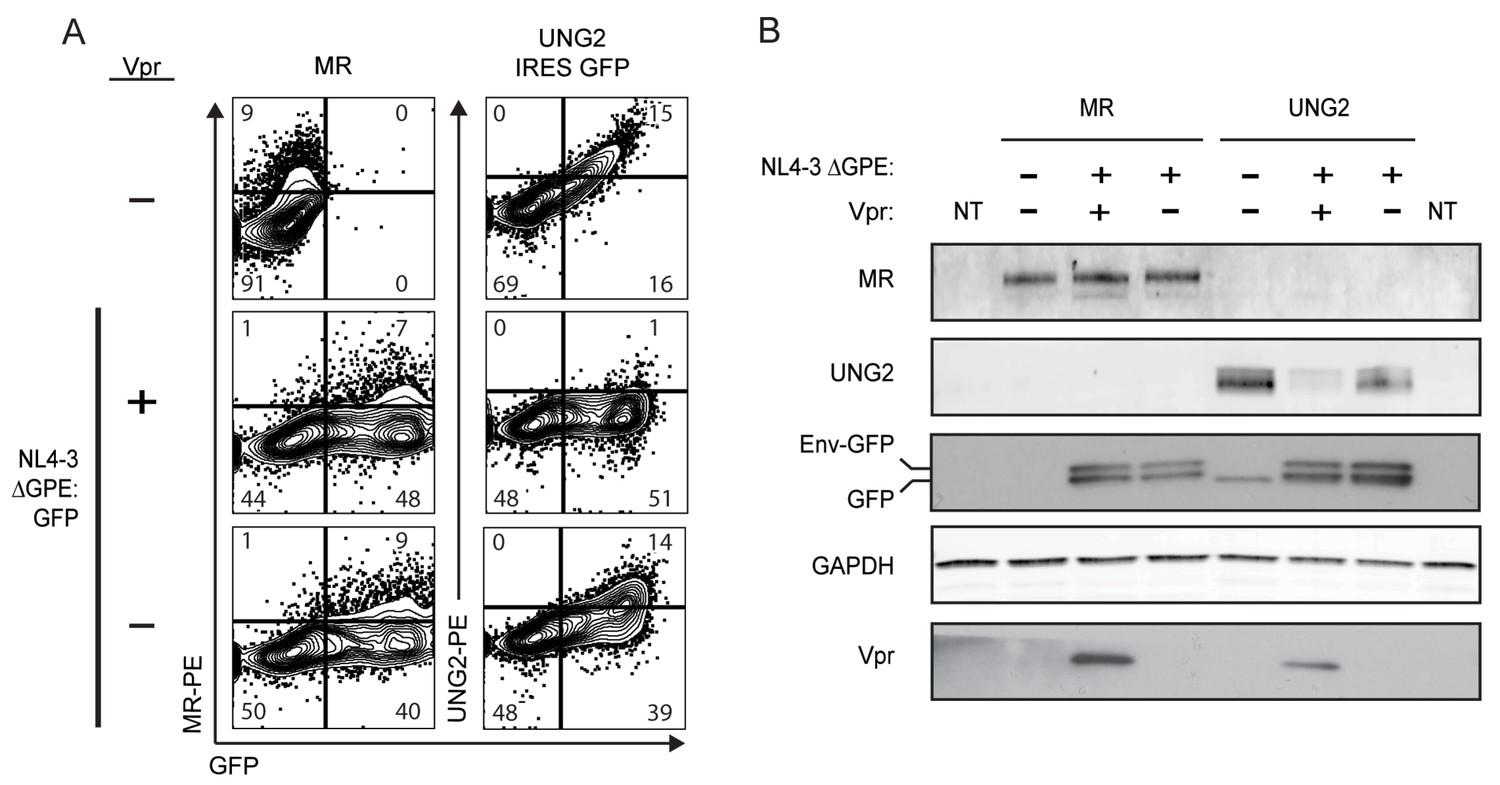
HIV Vpr reduces steady state levels of UNG2 but not MR in co-transfected 293T cells.
(A) Flow cytometric plots of 293T cells co-transfected with NL4-3 ∆GPE-GFP, pCDNA3.1-hMR, and pMSCV 3x FLAG UNG2 IRES-GFP as indicated. (B) Western blot analysis of 293T cells co-transfected exactly as in A. Env-GFP indicates the location of the fusion protein containing the N terminus of Env followed by GFP as described in Methods.
Figure 3 with 1 supplement
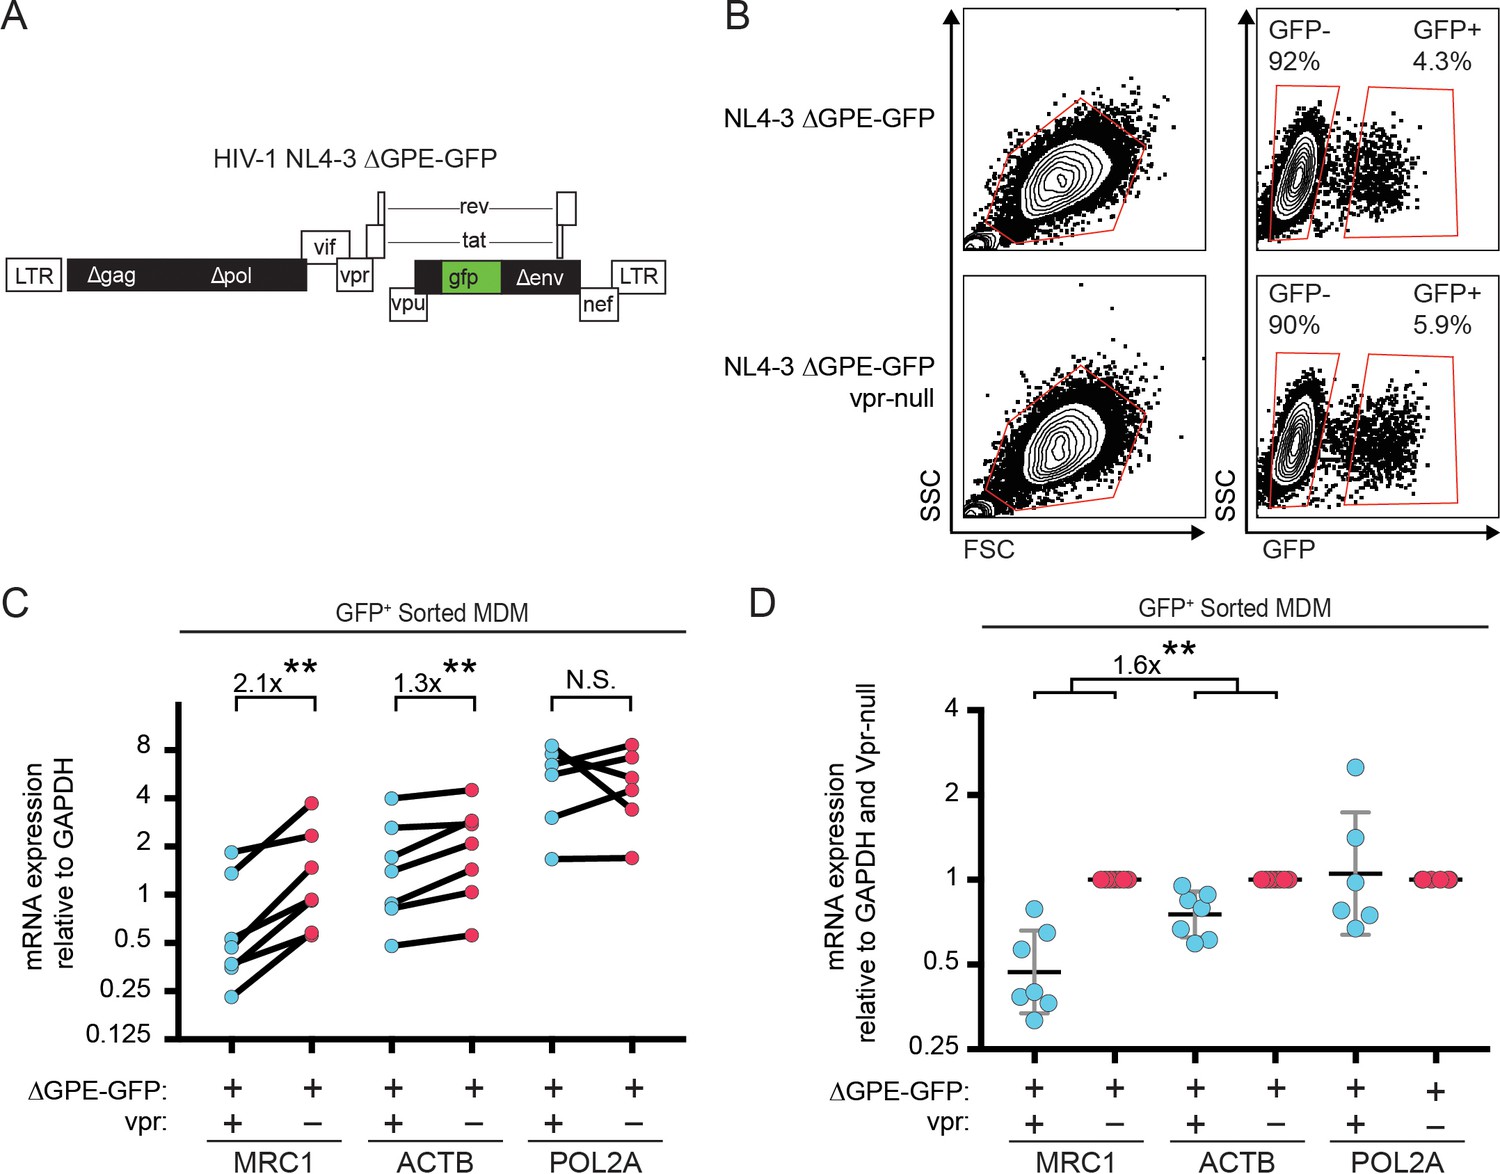
Vpr reduces transcription of MRC1.
(A) Diagram of HIV NL4-3 ∆GPE-GFP. (B) Flow cytometry plots indicating the gating strategy used to sort live GFP+ vs GFP- cells for subsequent qPCR analysis. (C) Summary graph of mannose receptor (MRC1), β-actin (ACTB) and RNA Polymerase 2A (POL2A) mRNA expression in MDM transduced with the indicated HIV reporter and sorted for GFP expression by FACS. All data are normalized to GAPDH mRNA expression. (D) Summary graph of MRC1, ACTB and POL2A expression normalized to the Vpr-null condition in each donor. (n = 7 independent donors). Geometric mean +/- geometric standard deviation is shown. Statistical significance was determined by a two-tailed, ratio t-test. N.S. = not significant p=0.81, **p<0.01.
Figure 3—figure supplement 1

Vpr reduces transcription of MRC1.
(A) Summary graph of mannose receptor (MRC1), RNA Polymerase 2A (POL2A) and GAPDH mRNA expression in MDM transduced with Vpr-competent or Vpr-null HIV NL4-3 ∆GPE-GFP and sorted for GFP expression by FACS. All data are normalized to ACTB mRNA expression. (B) Summary graph of same data as A normalized to the Vpr+ condition in each donor. (n = 8 independent donors). Geometric mean is indicated by the line. (C) Summary graph of MRC1, ACTB and POL2A mRNA expression in untransduced MDM and MDM transduced with Vpr-competent HIV NL4-3 ∆GPE-GFP. All data are normalized to GAPDH. (D) Summary graph of MRC1, POL2A and GAPDH mRNA expression in untransduced MDM and MDM transduced with Vpr-competent HIV NL4-3 ∆GPE-GFP. All data are normalized to ACTB. (E) Summary graph of MRC1, ACTB and POL2A mRNA expression in untransduced MDM and MDM transduced with Vpr-null HIV NL4-3 ∆GPE-GFP. All data are normalized to GAPDH. (F) Summary graph of MRC1, POL2A and GAPDH mRNA expression in untransduced MDM and MDM transduced with Vpr-null HIV NL4-3 ∆GPE-GFP. All data are normalized to ACTB. Statistical significance was determined by a two-tailed, ratio t-test. N.S. = not significant, **p<0.01, ****p<0.0001.
Figure 4
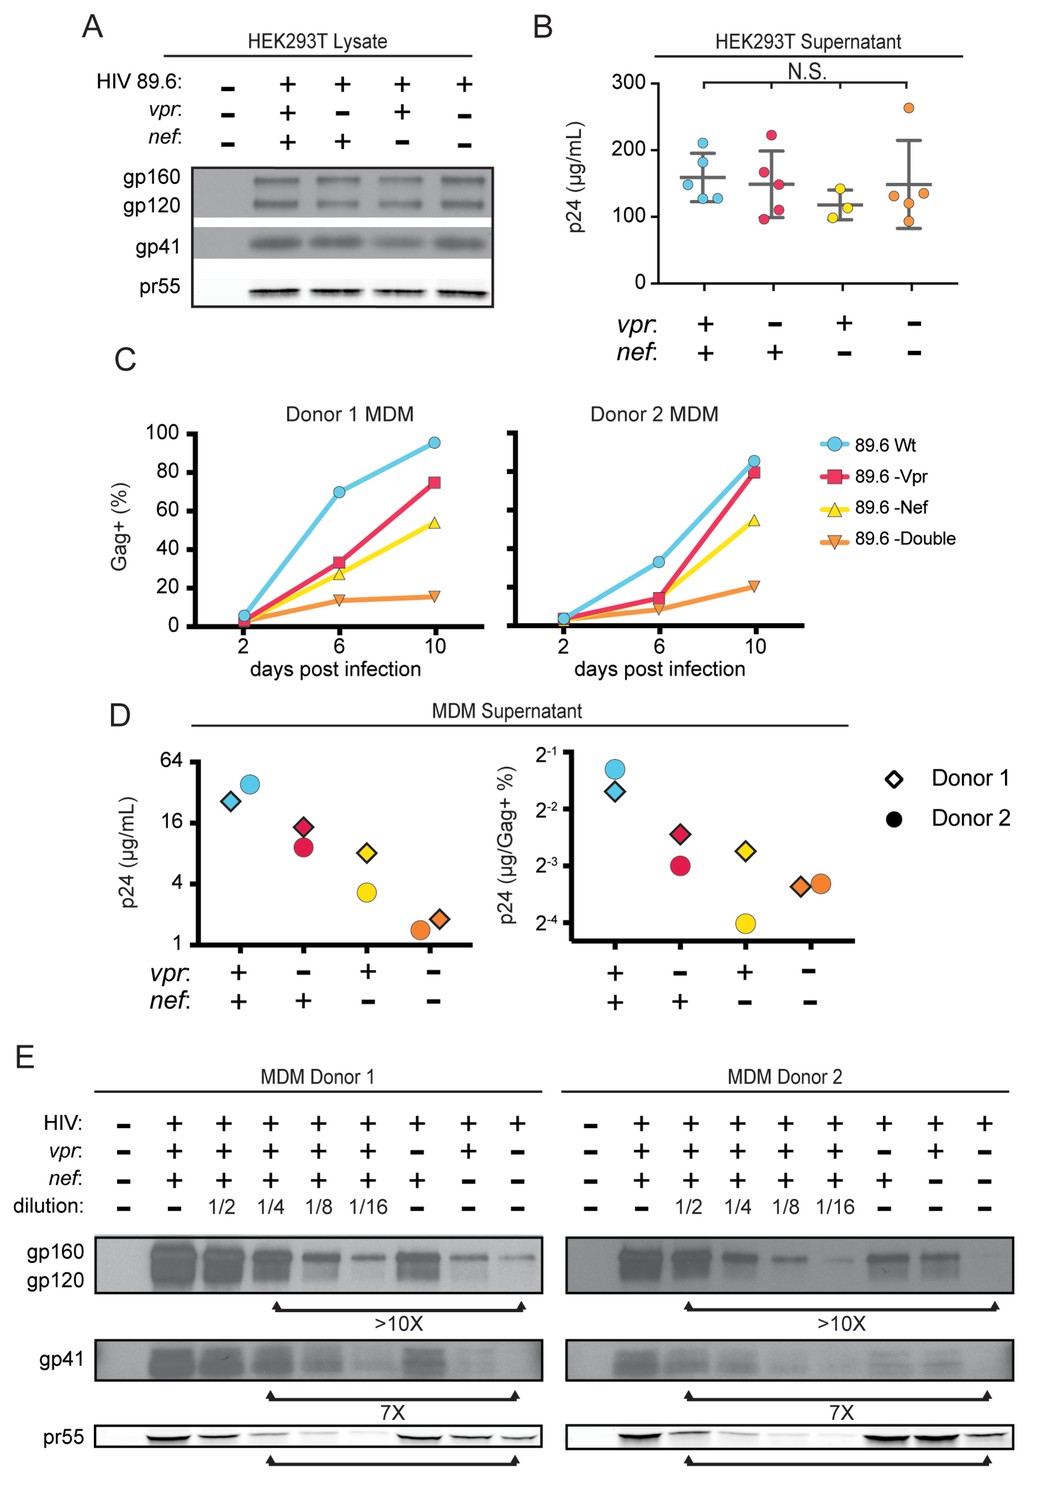
Combined effect of Vpr and Nef dramatically enhances Env levels in primary human MDM.
(A) Western blot analysis of whole cell lysate from 293T transfected with the indicated HIV construct. (B) Summary graph of virion release from 293T cells transfected as in A and measured by Gag p24 ELISA. (n = 5 independent transfections). The mean +/- standard deviation is shown. Statistical significance was determined by one-way ANOVA. (N.S. – not significant) (C) Frequency of infected primary human MDM infected with the indicated HIV and analyzed over time by flow cytometric analysis of intracellular Gag. (For parts C-E, n = 2 independent donors). (D) Virion release by primary human MDM infected with the indicated HIV and analyzed by Gag p24 ELISA 10 days post infection. In the right panel, virion release was adjusted for frequency of infected cells as measured in part C. (E) Western blot analysis of whole cell lysate from primary human MDM infected with the indicated HIV. Within each donor, lanes 2–6 are a serial dilution series of the wild-type sample. The arrows below the Gag pr55 bands indicate the dilution of wild-type that has approximately the same amount of Gag pr55 as the vpr-nef-null double mutant.
Figure 5 with 1 supplement
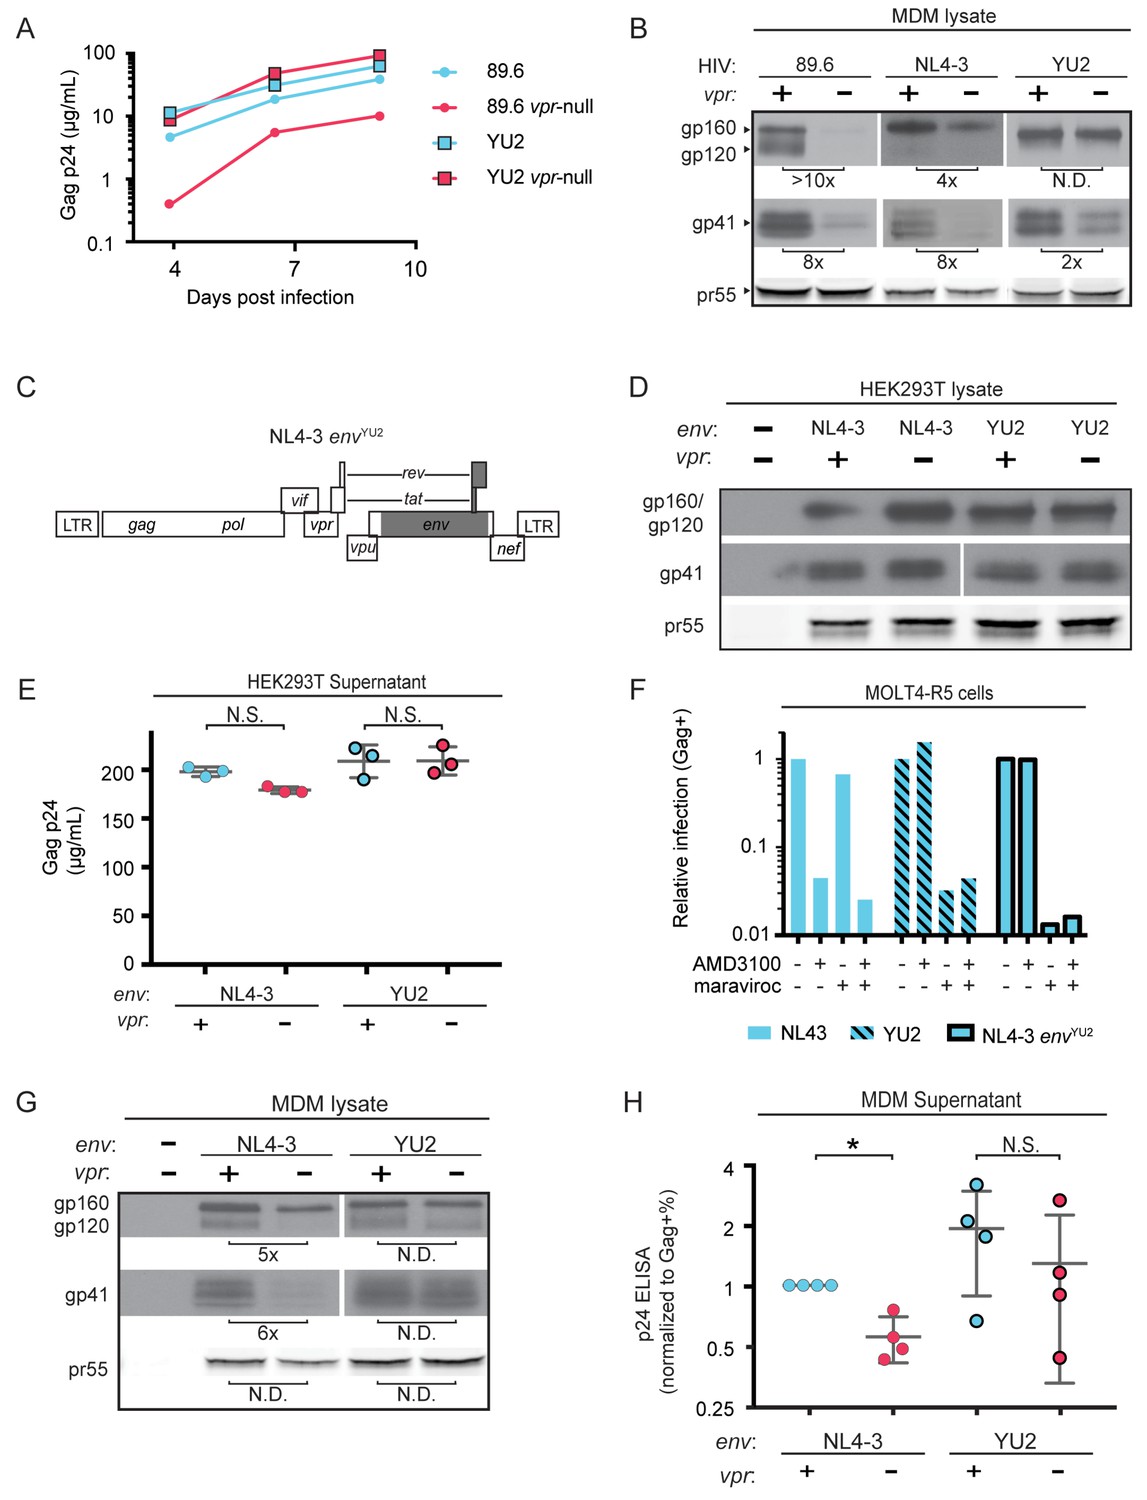
HIV YU2, which lacks a mannose-rich patch, does not require Vpr for robust Env protein expression and spread in MDM.
(A) Virion release over time by primary human MDM infected with the indicated HIV as measured by ELISA (n = 2 independent donors). (B) Western blot analysis of whole cell lysates from MDM infected for 10 days with the indicated HIV. Because NL4-3 infects MDM poorly, NL4-3 was pseudotyped with a YU-2 Env expression plasmid co-transfected in the producer cells as described in Methods. Subsequent spread was blocked in all samples by the addition of entry inhibitors AMD3100 and maraviroc initially added 48 hr post-infection and maintained throughout the culture period. (C) Diagram of the HIV NL4-3 genome. The shaded portion represents the sequence that was replaced with sequence from HIV YU2 to create the NL4-3 envYU-2 chimera. (D) Western blot analysis of 293T cells transfected with the indicated HIV constructs. YU-2 gp41 is detected by the monoclonal antibody z13e1 and NL4-3 gp41 is detected by the monoclonal antibody CHESSIE-8. (E) Virion release from 293T transfected as in D as measured by p24 ELISA. (n = 3 experimental replicates). (F) Relative infection of MOLT4-R5 cells 48 hr after inoculation with the indicated viruses and treatment with entry inhibitors as indicated. The frequency of infected cells was measured by intracellular Gag stain and normalized to the untreated condition for each infection. (G) Western blot analysis of primary human MDM infected for 10 days with the indicated virus as in B. (n = 2 independent donors). (H) Summary graph showing virion release as measured by p24 ELISA from primary human MDM infected as in G. Virus production was adjusted for infection frequency as determined flow cytometrically using an intracellular Gag stain. The mean +/- standard deviation is shown. (n = 4 independent donors). N.D. – no difference. Statistical significance was determined using a two-tailed, ratio t-test. N.S. – not significant, *p<0.05.
Figure 5—figure supplement 1
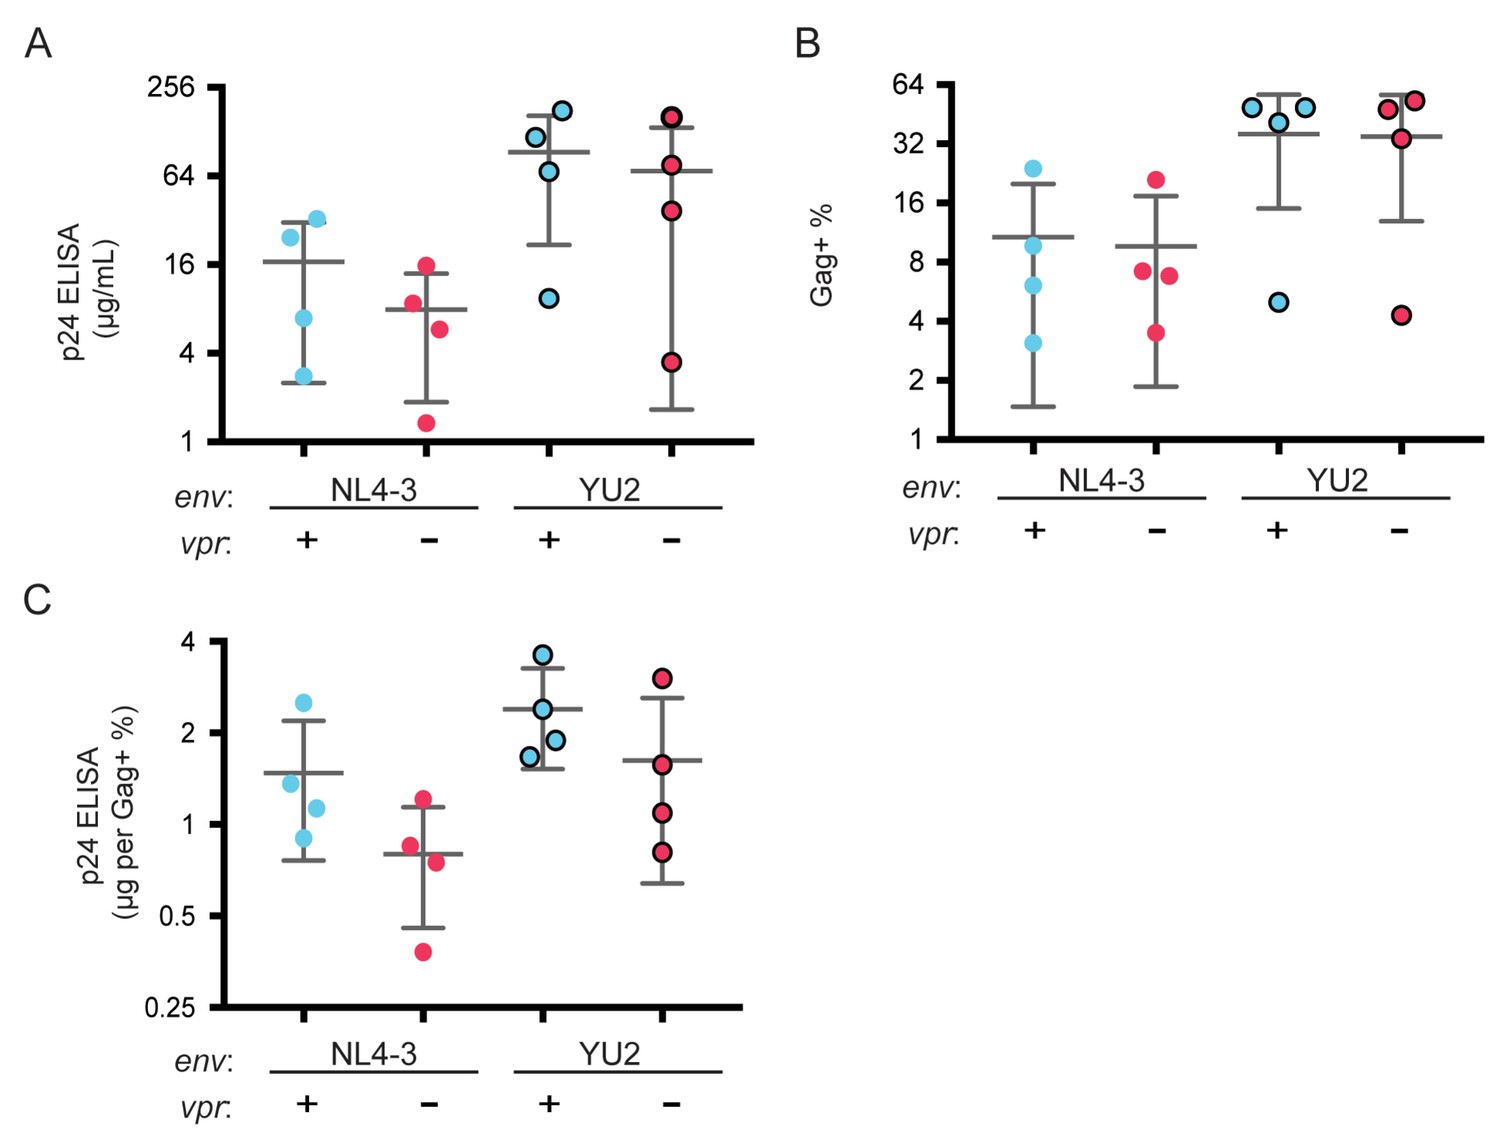
Raw p24 ELISA and intracellular Gag stain data following infection by NL4-3 envYU2.
(A) Summary graph shoing Gag p24 concentration of supernatant from MDM cultures 10 days post infection with the indicated virus. (B) Summary graph showing the fraction of MDM that are Gag+ 10 days post infection with the indicated virus. (C) Summary graph showing the p24 concentration normalized to the fraction of cells that are Gag+ for each donor. n = 4 independent donors.
Figure 6 with 1 supplement
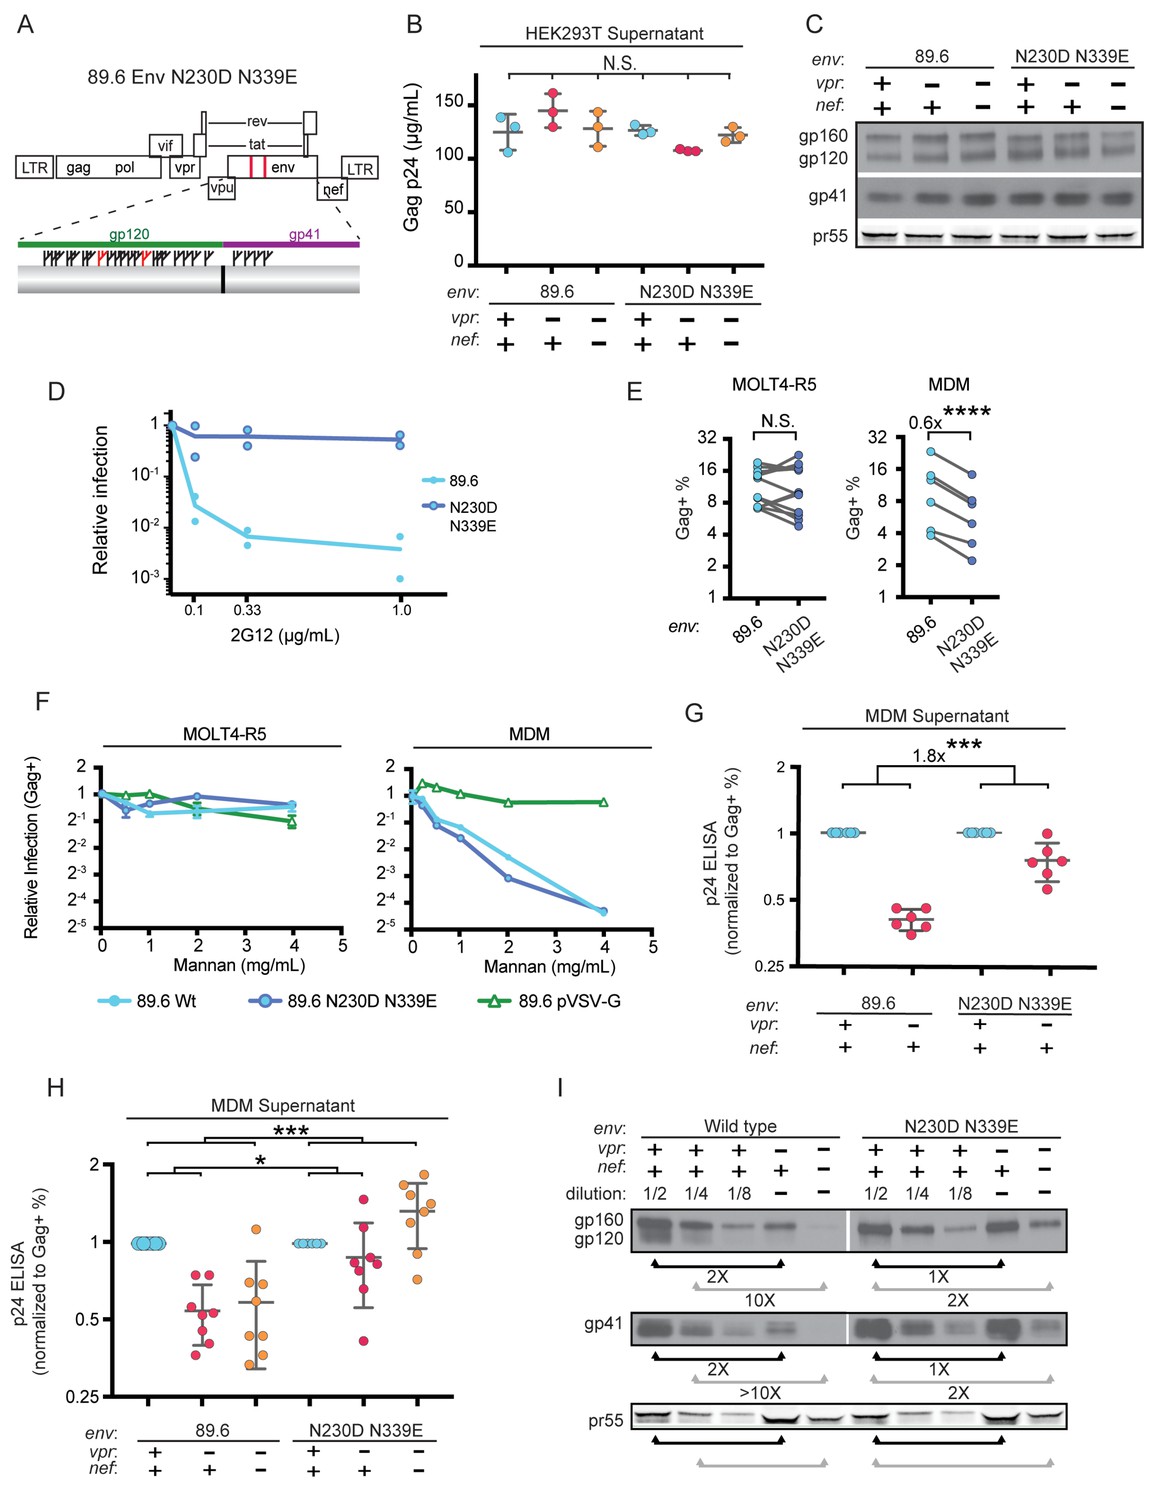
Deletion of N-linked glycosylation sites in env reduces the requirement for Vpr and Nef for virion release and Env expression in HIV-1 infected primary human MDM.
(A) Upper panel, diagram of HIV genome encoding the mutations N230D and N339E (indicated in red) to prevent N-linked glycosylation at those sites. Lower panel, diagram of HIV 89.6 N230D N339E mutant Env protein. Branched symbols represent N-linked glycans. (B) Summary graph showing virion release from 293Ts transfected with the indicated HIV construct as measured by p24 ELISA. (n = 3 experimental replicates). Statistical significance was determined by one-way ANOVA. (C) Western blot analysis of 293T transfected as in B. (D) Summary graph showing relative infection frequency of MOLT4-R5 T cells by the indicated HIV following treatment as indicated with the neutralizing antibody 2G12. The percentage of infected cells was measured by intracellular Gag stain and normalized to the untreated condition for each virus. (n = 2 independent experiments, both are plotted) (E) Summary graphs of relative infection of the indicated cell type by mutant or parental wild-type HIV. The frequency of infected cells was measured flow cytometrically by intracellular Gag stain and normalized to the wild-type virus. (n = 5 experimental replicates for MOLT4-R5; n = 2 experimental replicates for MDM from four independent donors). (F) Summary graph depicting relative infection of the indicated cell type by each virus plus or minus increasing concentrations of mannan as indicated. The frequency of infected cells was measured by intracellular Gag stain and normalized to the uninhibited (0 mg/mL mannan) condition for each virus. 89.6 pVSV-G indicates 89.6 ∆env pseudotyped with VSV-G protein. (n = 2 independent donors for 89.6 wild-type and 89.6 ∆env pVSV-G; n = 1 donor for 89.6 env N230D N339E) (G) Summary graph of virion release from primary human MDM following 10 days of infection by the indicated HIV as measured by p24 ELISA. Virion release was normalized to the infection frequency assessed flow cytometrically by intracellular Gag stain. The result for each vpr-null mutant was normalized to the vpr-competent virus encoding the same env. (n = 6 independent donors) (H) Summary graph of virion release from primary human MDM following 10 days of infection by the indicated HIV as measured by p24 ELISA. Virion release was normalized to the infection frequency assessed flow cytometrically by intracellular Gag stain. For this single round infection assay, all viruses were pseudotyped with YU2 Env and viral spread was blocked 48 hr later by addition of AMD3100 and maraviroc. (n = 8 independent donors) The result for each vpr-null or vpr-nef-null mutant was normalized to the vpr- and nef-competent virus encoding the same env. (I) Western blot analysis of MDM infected as in G. The lysates from the vpr-competent and nef-competent infections were diluted to facilitate comparisons to vpr- and nef-null mutants. (n = 2 independent donors) For summary graphs, the mean +/- standard deviation is shown. In panels E, G and H statistical significance was determined by a two-tailed, paired t-test *p=0.01, **p<0.01, ***p<0.001.
Figure 6—figure supplement 1
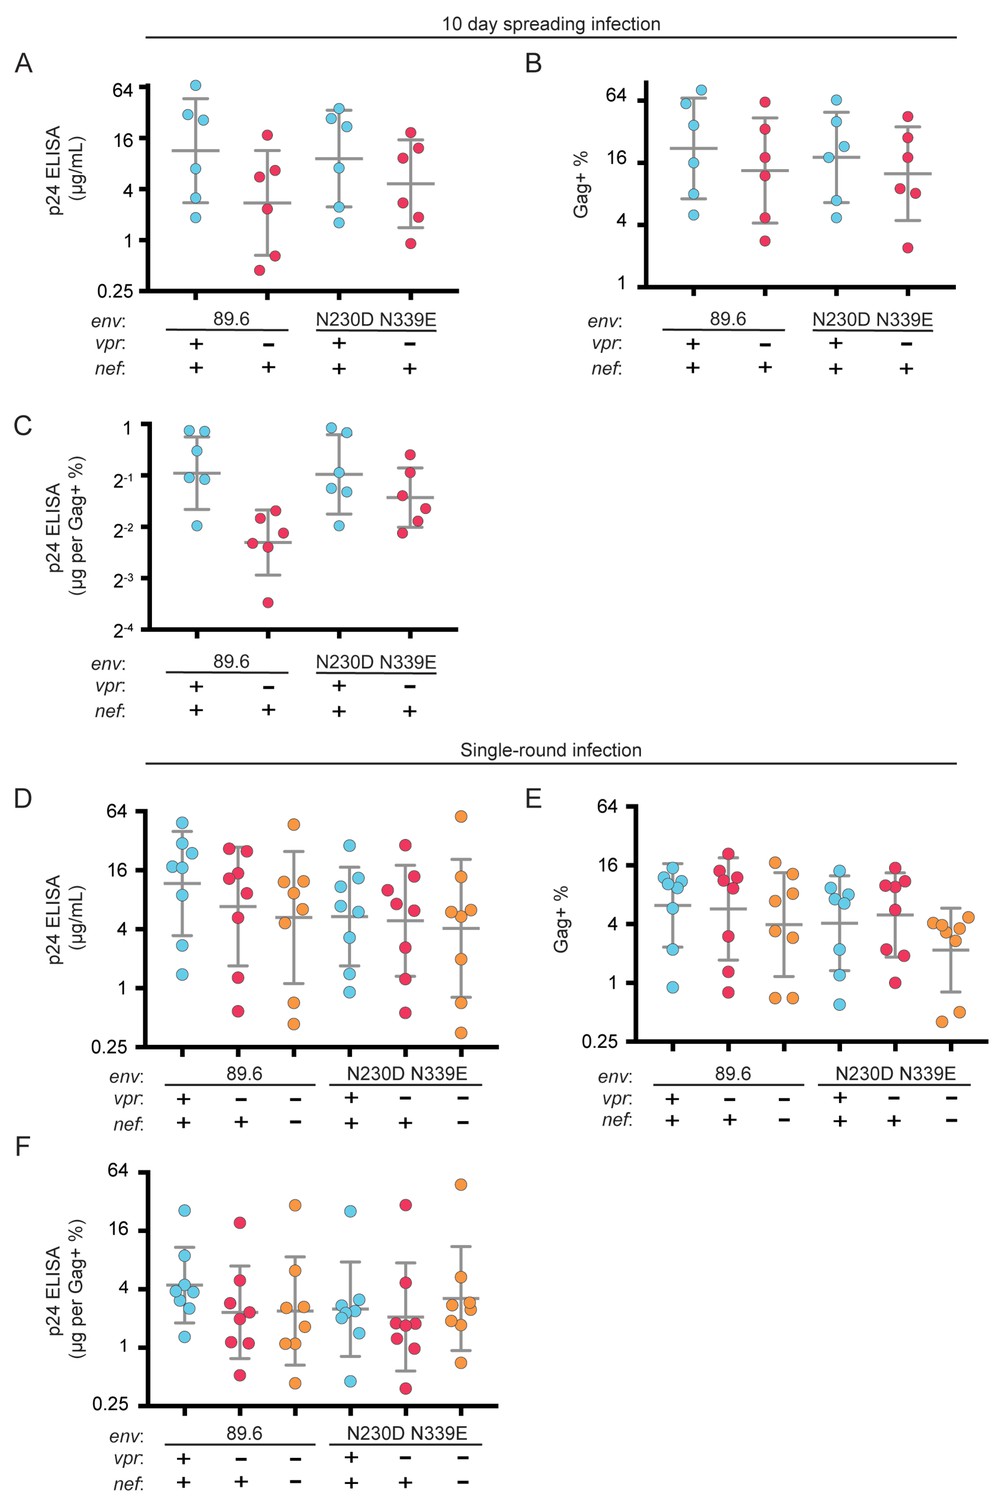
Raw p24 ELISA and intracellular Gag stain data following infection by 89.6 N230D N339E.
(A) Summary graph showing Gag p24 concentration of supernatant from MDM cultures 10 days post infection with the indicated virus, which were allowed to spread in culture. Data correspond to Figure 6G. (B) Summary graph showing the fraction of MDM that are Gag+ 10 days post infection with the indicated virus. (C) Summary graph showing the p24 concentration normalized to the fraction of cells that are Gag+ for each donor. A-C n = 6 independent donors. (D) Summary graph showing Gag p24 concentration of supernatant from MDM cultures 10 days post infection with the indicated virus. Viral replication was blocked by AMD3100 and maraviroc 48 hr post infection. Data correspond to Figure 6H. (E) Summary graph showing the fraction of MDM that are Gag+ 10 days post infection with the indicated virus. (F) Summary graph showing the p24 concentration normalized to the fraction of cells that are Gag+ for each donor. D-F n = 8 independent donors.
Figure 7 with 1 supplement
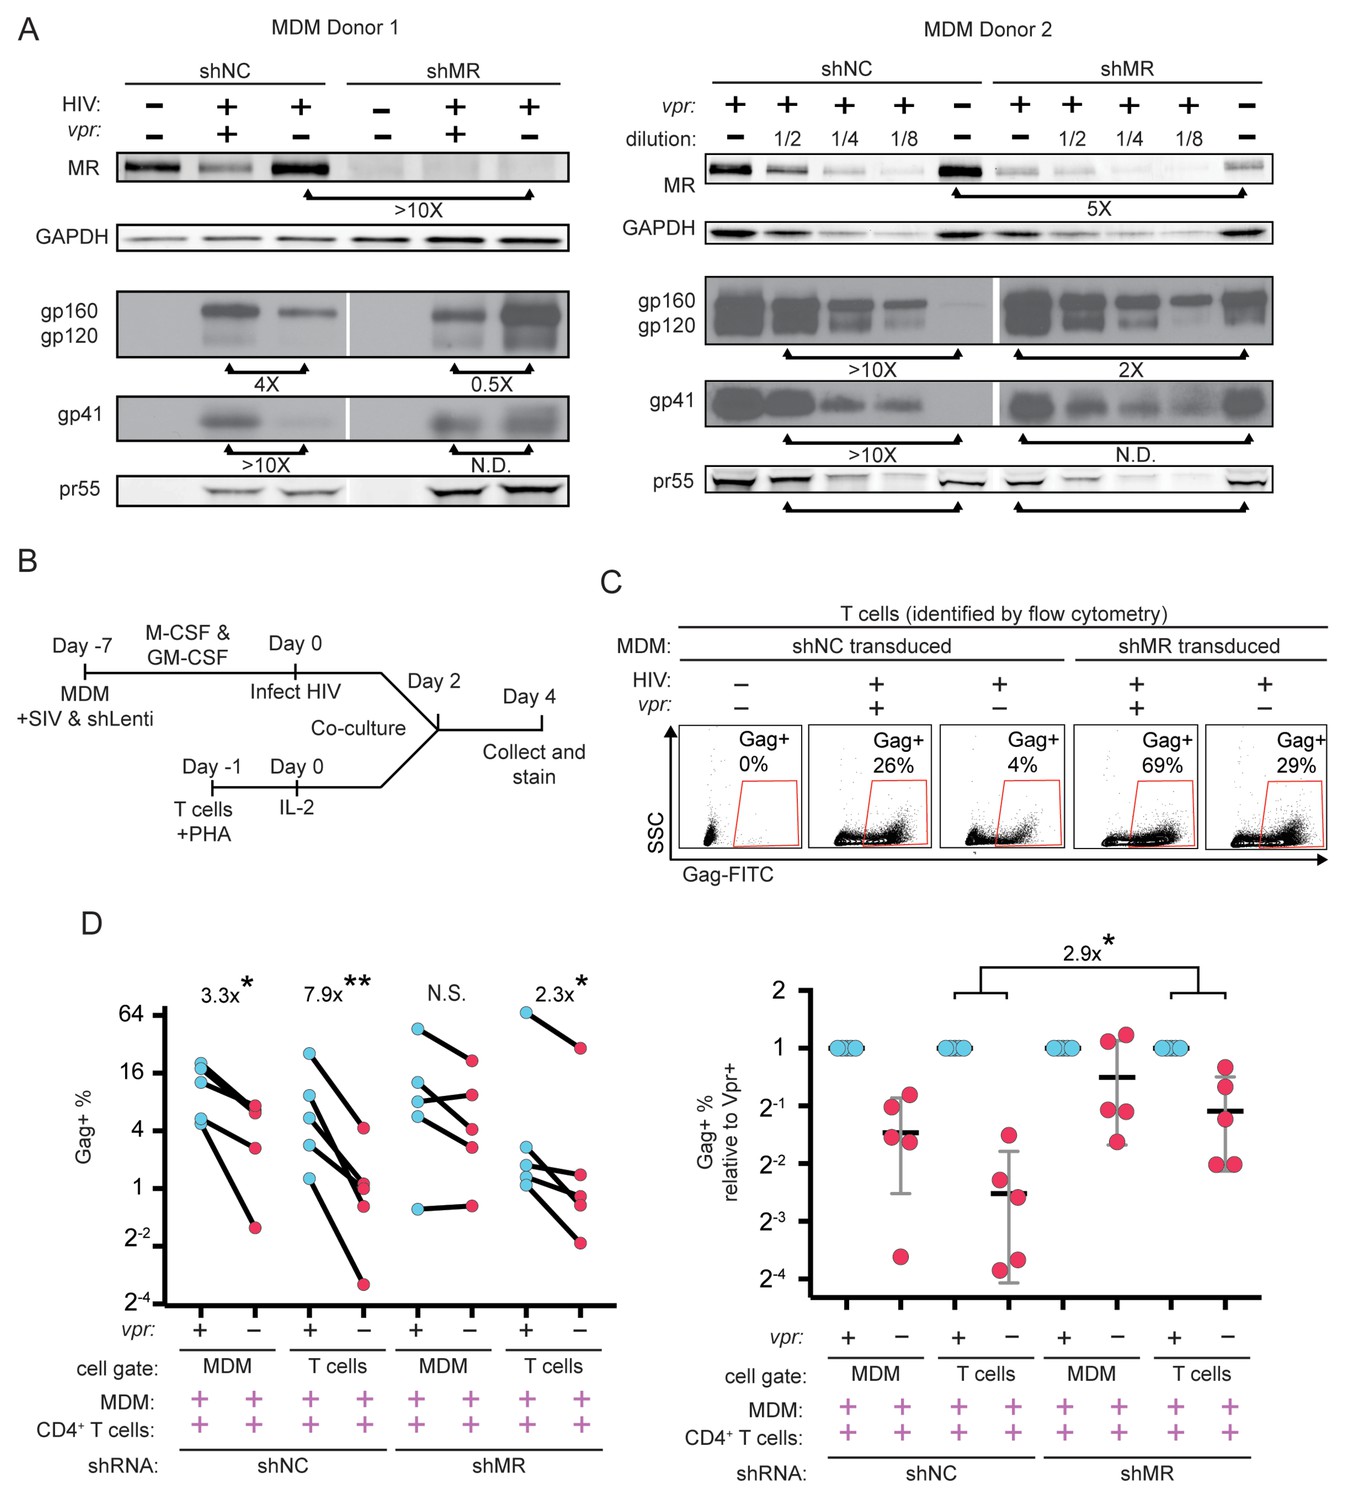
Knockdown of MR enhances Env expression and spread to T cells in vpr-null infection of MDM.
(A) Western blot analysis of MDM from two independent donors treated with the indicated silencing vector and infected with the indicated HIV for 10 days. The shRNA sequences encoded by the negative control vector (shNC) and the MR silencing vector (shMR) are described in Methods. (B) Schematic diagram of experimental protocol used for silencing experiments. (C) Representative flow cytometric plots showing frequency of infected (Gag+) primary T cells following two days of co-culture with autologous, HIV 89.6 infected primary MDM. T cells were identified in co-culture by gating on CD3+ CD14- cells as shown in Figure 7—figure supplement 1B. (D) Summary graph displaying relative infection of MDM and T cells as measured in C (n = 5 independent donors). Data in the left panel are unnormalized. In the right panel the data have been normalized to the wild-type condition for each donor and shRNA.
Figure 7—figure supplement 1
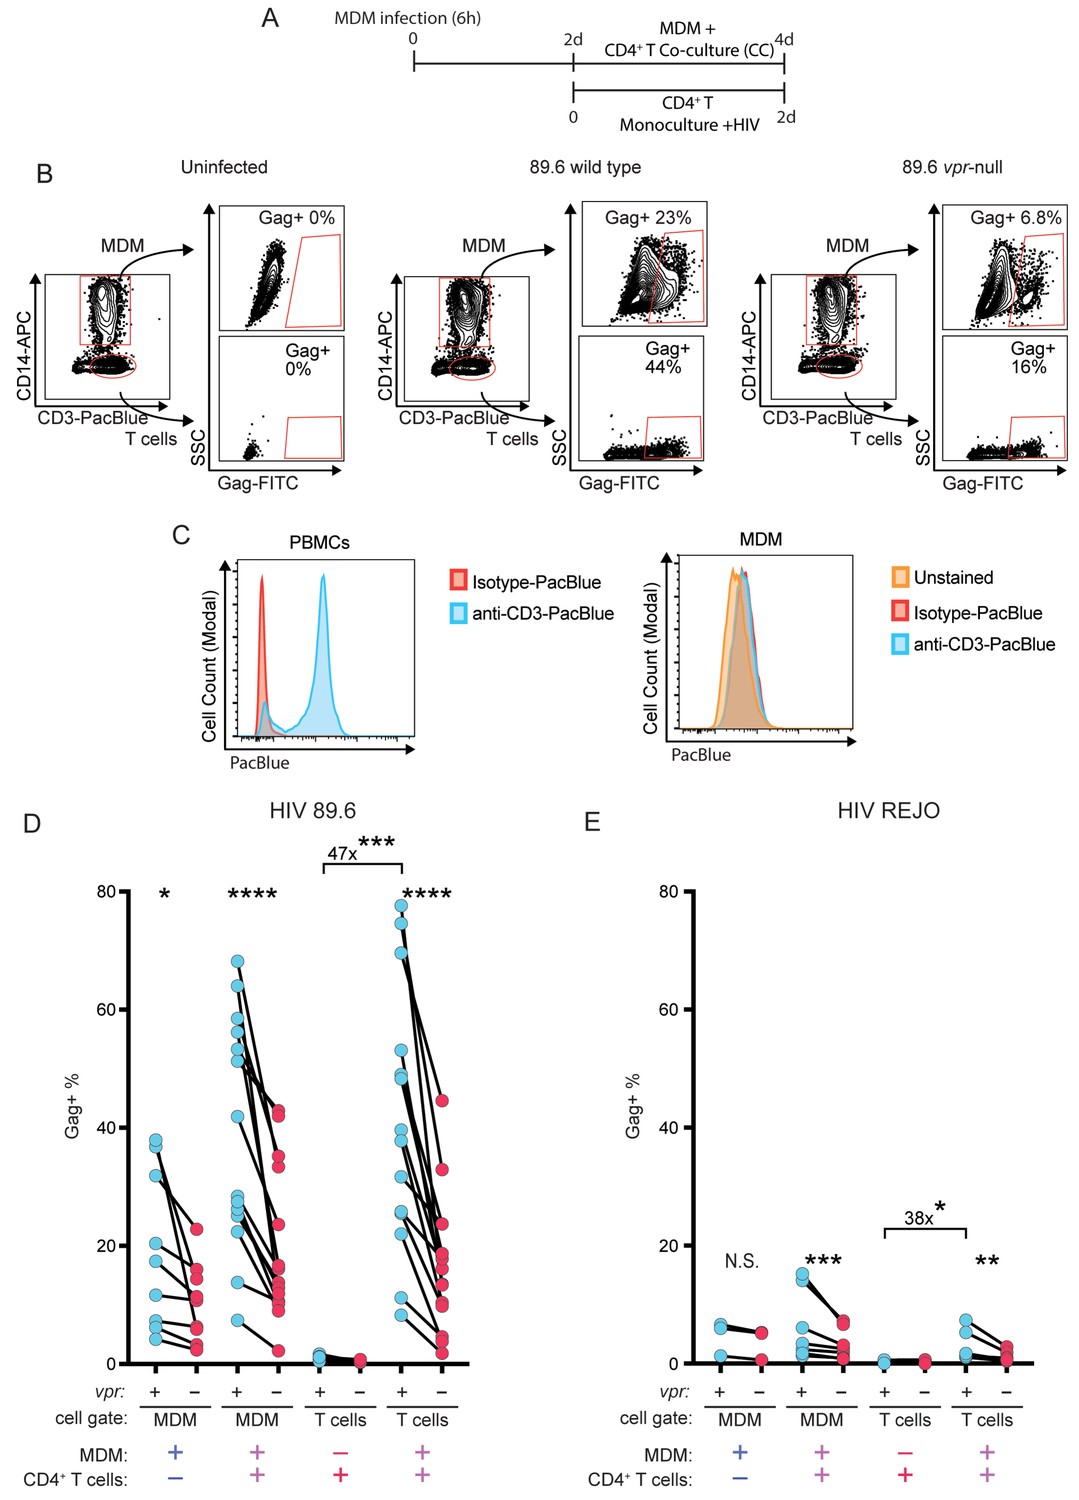
Cell-to-cell infection from macrophages to autologous CD4+ T cells is highly efficient and enhanced by Vpr.
(A) Diagram of the MDM and T cell co-culture experiments depicted in parts B, D, and E. (B) Representative flow cytometric plots and gating strategy used to identify MDM and T cells in co-culture and the fraction of Gag+ cells of both types. (C) Flow cytometric histograms illustrating the PacBlue signal detected in the indicated cell type following treatment with the indicated antibody. (D) Summary graph of the percentage of cells of the indicated type that are Gag+ following infection by HIV-1 89.6. (E) Summary graph of the percentage of cells of the indicated type that are Gag+ following infection by HIV-1 T/F clone REJO.
Tables
Key resources table
| Reagent type (species) | Designation | Source or reference | Identifiers | Additional Information |
|---|---|---|---|---|
| Recombinant DNA reagent | p89.6 | Collman et al. (1992) PMID: 1433527 | NIH AIDS Reagent Program 3552 | |
| Recombinant DNA reagent | p89.6 vpr-null | Mashiba et al. (2014); PMID 25464830 | ||
| Recombinant DNA reagent | p89.6 nef-null | Carter et al. (2010); PMID 20208541 | ||
| Recombinant DNA reagent | p89.6 vpr-nef-null | this paper | Produces HIV 89.6 vpr-nef-null double mutant | |
| Recombinant DNA reagent | p89.6 env N230D N339E | this paper | Produces HIV 89.6 env N230D N339E mutant | |
| Recombinant DNA reagent | p89.6 env N230D N339E vpr-null | this paper | Produces HIV 89.6 env N230D N339E vpr-null mutant | |
| Recombinant DNA reagent | p89.6 env N230D N339E vpr-nef-null | this paper | Produces HIV 89.6 env N230D N339E vpr-nef-null mutant | |
| Recombinant DNA reagent | pNL4-3 | Adachi et al. (1986); PMID 3016298 | NIH AIDS Reagent Program 114 | |
| Recombinant DNA reagent | pNL4-3 envYU2 | this paper | Produces HIV NL4-3 envYU2 chimera | |
| Recombinant DNA reagent | pNL4-3 envYU2vpr-null | this paper | Produces HIV NL4-3 envYU2vpr-null chimera | |
| Recombinant DNA reagent | pHCMV-G | ATCC | 75497 | Expresses VSV-G |
| Recombinant DNA reagent | pCMV-HIV-1 | Gasmi et al., 1999; PMID 9971760 | Expresses HIV structural proteins | |
| Recombinant DNA reagent | pNL4-3 ∆GPE-GFP | McNamara et al. (2012); PMID 22718820 | ||
| Recombinant DNA reagent | pNL4-3 ∆GPE-GFP vpr-null | this paper | Produces NL4-3 ∆GPE vpr-null | |
| Recombinant DNA reagent | pNL4-3 ∆GPE-GFP vpr-Q65R | this paper | Produces NL4-3 ∆GPE vpr-Q65R | |
| Recombinant DNA reagent | pNL4-3 ∆GPE-GFP nef-null | this paper | Produces NL4-3 ∆GPE nef-null | |
| Recombinant DNA reagent | pNL4-3 ∆GPE-GFP vpr-nef-null | this paper | Produces NL4-3 ∆GPE vpr-nef-null | |
| Recombinant DNA reagent | pYU2 | Li et al. (1991); PMID 1830110 | NIH AIDS Reagent Program 1350 | |
| Recombinant DNA reagent | pYU2 vpr-null | this paper | Produces YU-2 vpr-null | |
| Recombinant DNA reagent | pREJO.c/2864 | Ochsenbauer et al. (2012); PMID 22190722 | NIH AIDS Reagent Program 11746 | |
| Recombinant DNA reagent | pREJO.c/2864 vpr-null | this paper | Produces REJO vpr-null | |
| Recombinant DNA reagent | pSIV3+ | Pertel et al. (2011); PMID 21696578 | ||
| Recombinant DNA reagent | pSIV3+ vpr-null | this paper | Produces SIV3+ vpr-null | |
| Recombinant DNA reagent | pSPAX2 | Pertel et al. (2011); PMID 21696578 | ||
| Recombinant DNA reagent | pAPM-1221 | Pertel et al. (2011); PMID 21696578 | Silences luciferase mRNA | |
| Recombinant DNA reagent | pAPM-MRC1-C | this paper | Silences MR mRNA | |
| Recombinant DNA reagent | pMD2.G | Pertel et al. (2011); PMID 21696578 | Expresses VSV-G | |
| Recombinant DNA reagent | pYU2 env | Sullivan et al. (1995); PMID 7769703 | ||
| Recombinant DNA reagent | pCDNA3.hMR | Liu et al. (2004); PMID 15047828 | Expresses MR | |
| Recombinant DNA reagent | pPROA-3FLAG-UNG2-EYFP | Akbari et al. (2010); PMID 20466601 | ||
| Recombinant DNA reagent | pMSCV IRES-GFP | Van Parijs et al., 1999; PMID 10514006 | ||
| Recombinant DNA reagent | pMSCV 3xFLAG UNG2 IRES-GFP | this paper | Expresses 3x FLAG-tagged UNG2 | |
| Recombinant DNA reagent | pUC19 | Norrander et al. (1983); PMID 6323249 | ||
| Chemical compound, drug | Ficoll-Paque Plus | GE Healthcare | 17-1440-02 | |
| Chemical compound, drug | rhM-CSF | R and D Systems | 216-MC-025/CF | |
| Chemical compound, drug | rhGM-CSF | R&D Systems | 215 GM-050 | |
| Chemical compound, drug | IL-2 | R&D Systems | 202-IL-010 | |
| Chemical compound, drug | phytohaemagglutinin-L | Calbiohem | 431784 | |
| Chemical compound, drug | Enzyme-free cell dissociation buffer, HBSS-based | ThermoFisher | 13150016 | |
| Chemical compound, drug | Blue loading buffer | Cell Signaling Technology | 7722 | |
| Chemical compound, drug | AMD3100 | Hendrix et al., 2000; PMID 10817726 | NIH AIDS Reagent Program 8128 | |
| Chemical compound, drug | Maraviroc | Emmelkamp and Rockstroh, 2007; PMID 17933722 | NIH AIDS Reagent Program 11580 | |
| Chemical compound, drug | streptavidin-HRP | Fitzgerald | 65R-S104PHRP | |
| Chemical compound, drug | 3,3',5,5'-tetramethylbenzidine | Sigma | T8665-IL | |
| Chemical compound, drug | Gag p24 standard | ViroGen | 00177 V | |
| Chemical compound, drug | Protein G Column | GE Healthcare | 45-000-054 | |
| Commercial assay, kit | Q5 site-directed mutagenesis kit | New England Biolabs | E0554S | |
| Commercial assay, kit | EasySep Human CD14 Positive Selection Kit II | Stemcell Technologies | 17858 | |
| Commercial assay, kit | CD8 Dynabeads | ThermoFisher | 11147D | |
| Commercial assay, kit | RNeasy micro RNA isolation kit | Qiagen | 74004 | |
| Commercial assay, kit | qScript cDNA Supermix | Quantabio | 95048 | |
| Commercial assay, kit | TaqMan Gene Expression Master Mix | ThermoFisher | 4369016 | |
| Commercial assay, kit | EZ-link Micro Sulfo-NHS-Biotinylation kit | ThermoFisher | PI-21925 | |
| Sequence-based reagent | 896 dNef-F | this paper | PCR primer | CACCATTATCGTTTCAGACCCT |
| Sequence-based reagent | 896 dNef-R | this paper | PCR primer | TCTCGAGTTTAAACTTAT AGCAAAGCCCTTTCCA |
| Sequence-based reagent | NL43 vprQ65R-Forward | this paper | PCR primer | AGAATTCTGCGACAACTGCTG |
| Sequence-based reagent | NL43 vprQ65R-Reverse | this paper | PCR primer | TATTATGGCTTCCACTCC |
| Sequence-based reagent | 3xFLAG UNG2 F | this paper | PCR primer | CTAGCTCGAGACCATGGACT ACAAAGACCATGAC |
| Sequence-based reagent | 3xFLAG UNG2 R | this paper | PCR primer | GTTAACTCACAGCTCCTTC CAGTCAATGGGCTT |
| Sequence-based reagent | GeneExpression assay for ACTB | ThermoFisher | Hs99999903 | |
| Sequence-based reagent | GeneExpression assay for MRC1 | ThermoFisher | Hs00267207 | |
| Sequence-based reagent | GeneExpression assay for POL2A | ThermoFisher | Hs02786624 | |
| Sequence-based reagent | GeneExpression assay for GAPDH | ThermoFisher | Hs00172187 | |
| Sequence-based reagent | APM-MRC1-C Forward oligo | Sigma | DNA oligo | TCGAGAAGGTATATTGCT GTTGACAGTGAGCGAGTA ACTTGACTGATAATCAATT AGTGAAGCCACAGATGTA ATTGATTATCAGTCAAGTT ACTTGCCTACTGCCTCGG |
| Sequence-based reagent | APM-MRC1-C Reverse oligo | Sigma | DNA oligo | AATTCCGAGGCAGTAGGC AAGTAACTTGACTGATAA TCAATTACATCTGTGGCT TCACTAATTGATTATCAG TCAAGTTACTCGCTCACT GTCAACAGCAATATACCTTC |
| Biological sample (Homo sapiens) | Buffy coats/LeukoPaks | New York Blood Center | Buffy coats made from whole blood | |
| Biological sample (adenovirus) | Adeno-nef | Leonard et al. (2011); PMID 21543478 | ||
| Cell line (Homo sapiens) | HEK293T | ATCC | CRL-3216 | |
| Cell line (Mus musculus) | anti-gp41 hybridoma CHESSIE-8 | Abacioglu et al. (1994); PMID 8068416 | NIH AIDS Reagent Program 526 | Purified ab used for WB (2 µg/mL) |
| Cell line (Mus musculus) | anti-p24 hybridoma 183-H12-5C | NIH AIDS Reagent Program | 1513 | Purified ab used for ELISA (1 µg/mL) |
| Cell line (Mus musculus) | anti-p24 hybridoma 31-90-25 | ATCC (discontinued) | HB-9725 | Purified ab used for ELISA (0.5 µg/mL) |
| Antibody | anti-mannose receptor-PE (mouse monoclonal) | Becton Dickinson | clone 19.2 cat# 555954 | FC (1 µL per test) |
| Antibody | anti-Gag CA p24-PE (mouse monoclonal) | Beckman Coulter | clone KC57 cat# 6604667 | FC (0.25 µL per test) |
| Antibody | anti-Gag CA p24-FITC (mouse monoclonal) | Beckman Coulter | clone KC57 cat# 6604665 | FC (0.25 µL per test) |
| Antibody | anti-FLAG (mouse monoclonal) | Sigma | clone M2 cat# F3165 | FC (1 µL per test), WB (1:1000) |
| Antibody | anti-CD4-APC (mouse monoclonal) | ThermoFisher | clone OKT4 cat# 17-0048-42 | FC (1 µL per test) |
| Antibody | anti-CD3-PacBlue (mouse monoclonal) | BioLegend | clone OKT3 cat# 317313 | FC (1 µL per test) |
| Antibody | anti-CD14-APC (mouse monoclonal) | BioLegend | clone HCD14 cat# 325608 | FC (1 µL per test) |
| Antibody | anti-mannose receptor (rabbit polyclonal) | Abcam | ab64693 | WB (1:1000) |
| Antibody | anti-rabbit-AF647 (goat polyclonal) | ThermoFisher | A21244 | WB (1:4000) |
| Antibody | anti-GAPDH (mouse monoclonal) | Abnova | clone 3C2 cat# H00002597-M01 | WB (1:2000) |
| Antibody | anti-mouse IgG1-AF647 (goat polyclonal) | ThermoFisher | A21240 | FC (1 µL per test), WB (1:4000) |
| Antibody | HIV-Ig (human polyclonal) | Cummins et al. (1991); PMID 1995097 | NIH AIDS Reagent Program 3957 | WB (1:2000) |
| Antibody | anti-human-AF647 (goat polyclonal) | ThermoFisher | A21445 | WB (1:4000) |
| Antibody | anti-gp120 (sheep polyclonal) | Hatch et al., 1992; PMID 1374448 | NIH AIDS Reagent Program 288 | WB (1:1000) |
| Antibody | anti-sheep-HRP (rabbit polyclonal) | Dako | P0163 | WB (1:20,000) |
| Antibody | anti-gp41 (human monoclonal) | Zwick et al. (2001); PMID 11602729 | NIH AIDS Reagent Program 11557 | WB (1:1000) |
| Antibody | anti-human (goat polyclonal) | ThermoFisher | 62–8420 | WB (1:10,000) |
| Antibody | anti-Nef (rabbit polyclonal) | Shugars et al. (1993); PMID 8043040 | NIH AIDS Reagent Program 2949 | WB (1:1000) |
| Antibody | anti-Vpr (rabbit polyclonal) | Dr. Jeffrey Kopp | NIH AIDS Reagent Program 11836 | WB (1:1000) |
| Antibody | anti-rabbit (goat polyclonal) | ThermoFisher | 65–6120 | WB (1:10,000) |
| Antibody | anti-GFP (chicken polyclonal) | Abcam | ab13970 | WB (1:1000) |
| Antibody | anti-chicken-HRP (goat polyclonal) | ThermoFisher | A16054 | WB (1:10,000) |
| Antibody | anti-STING (rabbit monoclonal) | Cell Signaling Technology | clone D2P2F cat# 13647 | WB (1:500) |
| Antibody | anti-GBP5 (goat polyclonal) | Dr. Frank Kicrhhoff | sc-160353 | WB (1:500) |
| Antibody | anti-IFITM3 (rabbit polyclonal) | Proteintech | 11714–1-AP | WB (1:1000) |
| Antibody | anti-Env 2G12 (human monoclonal) | Buchacher et al. (1994); PMID 7520721 | NIH AIDS Reagent Program 1476 | neutralization (1 µg/mL) |
| Software, algorithm | FlowJo 10 | BD | 10.6.1 | |
| Software, algorithm | ABI Sequence Detection Software | ThermoFisher | 1.4 | |
| Software, algorithm | ImageQuant TL | GE | 8.2.0 | |
| Software, algorithm | Photoshop CC | Adobe | 20.0.6 | |
| Software, algorithm | shRNA retriever | http://katahdin.mssm.edu/siRNA/RNAi.cgi?type=shRNA |
Additional files
-
Supplementary file 1
Key resources table.
- https://cdn.elifesciences.org/articles/51035/elife-51035-supp1-v1.docx
-
Transparent reporting form
- https://cdn.elifesciences.org/articles/51035/elife-51035-transrepform-v1.docx
Download links
A two-part list of links to download the article, or parts of the article, in various formats.
Downloads (link to download the article as PDF)
Open citations (links to open the citations from this article in various online reference manager services)
Cite this article (links to download the citations from this article in formats compatible with various reference manager tools)
Mannose receptor is an HIV restriction factor counteracted by Vpr in macrophages
eLife 9:e51035.
https://doi.org/10.7554/eLife.51035


