Aberrant calcium channel splicing drives defects in cortical differentiation in Timothy syndrome
- Stanford University School of Medicine, United States
- University of California, San Francisco, United States
Figures
Figure 1 with 1 supplement
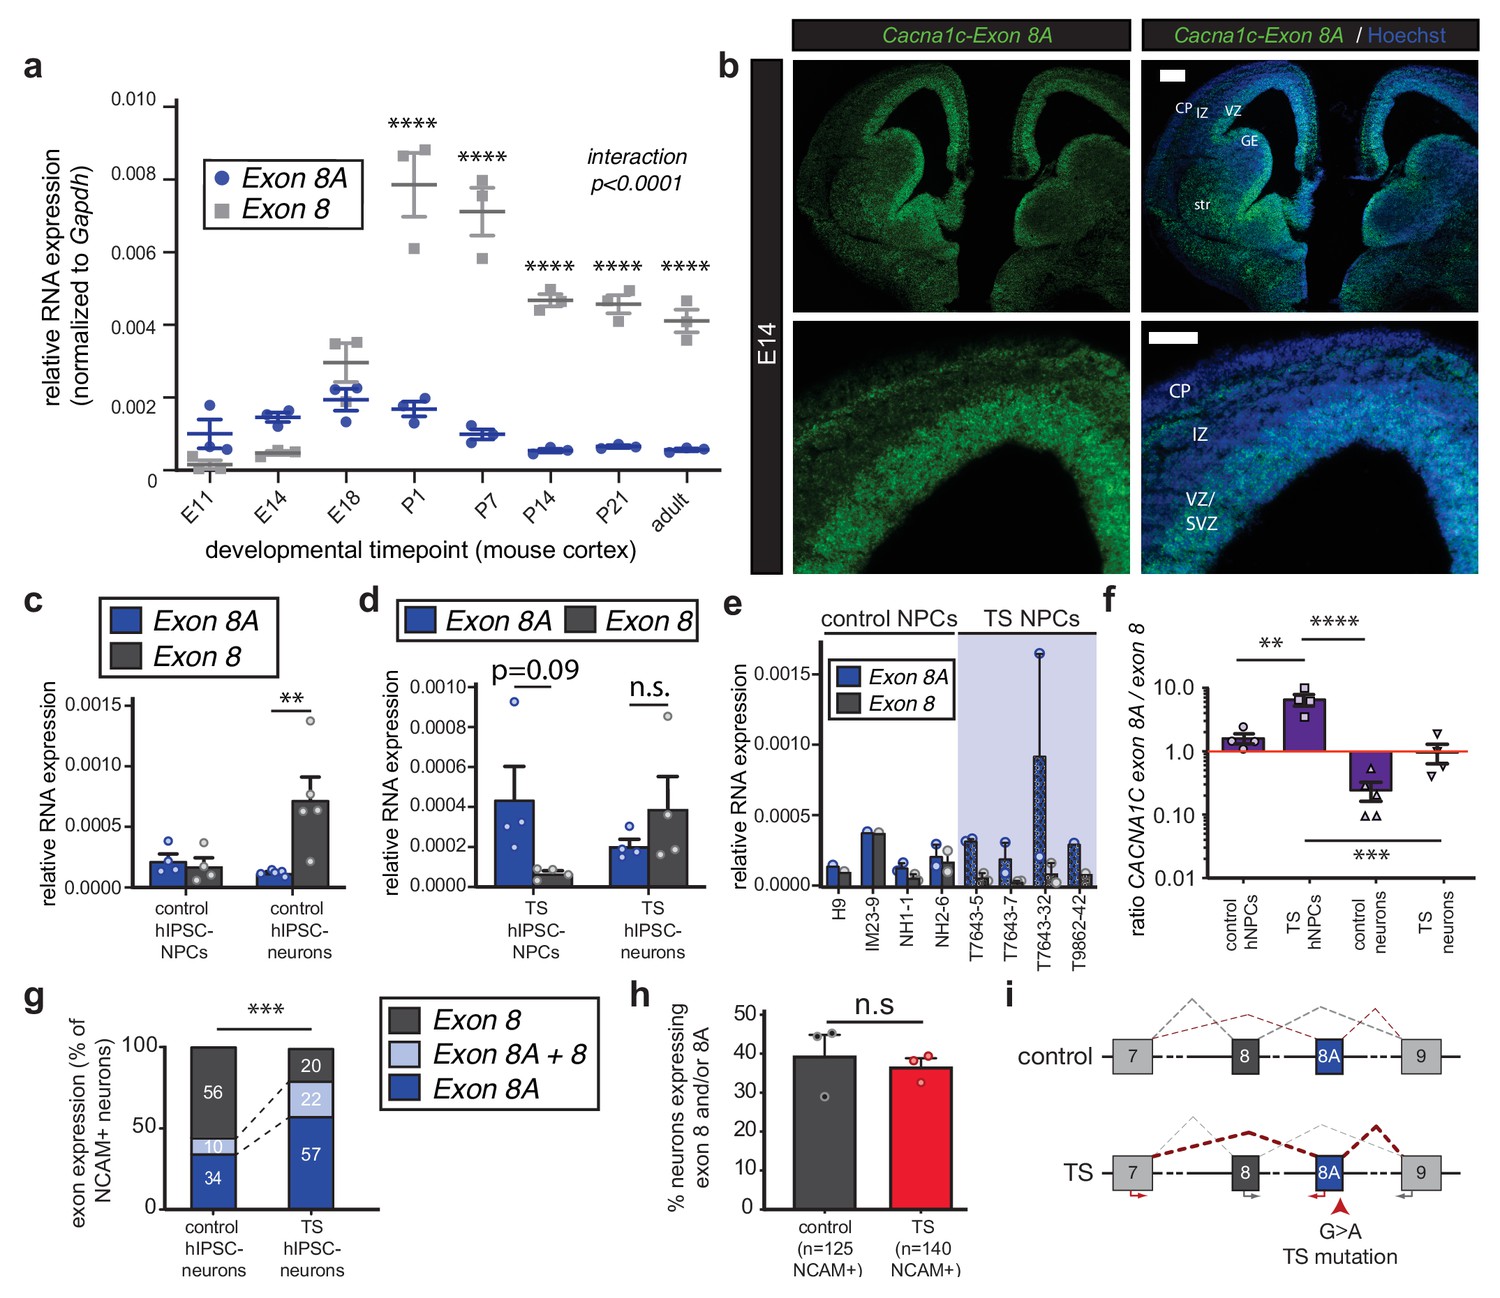
The TS mutation alters CACNA1C mRNA splicing and induces persistent expression of mutant channels in differentiating human neurons.
(a) qRT-PCR quantifying relative abundance of Cacna1c exons 8 and 8A in developing mouse cortex (n = 3 mice per timepoint from two different litters; data presented as mean ± s.e.m.; ****p<0.0001, two-way ANOVA and post-hoc Bonferroni). (b) Representative fluorescence ISH images of coronal sections through developing mouse brain at E14 depict strong expression of Cacna1c-8A transcripts in neurogenic zones lining the ventricles, in newborn neurons of the CP, and in the developing striatum. VZ, ventricular zone; SVZ, subventricular zone; IZ, intermediate zone; CP, cortical plate; GE, ganglionic eminence; and str, striatum. Scale bars, 200 μm (upper), 100 μm (lower). (c) qRT-PCR on RNA from differentiating human iPSC-derived NPCs. CACNA1C-8 transcripts are upregulated during neuronal differentiation in control cultures (NPCs: two subjects and H9 ES line, four lines total; neurons: two subjects and H9 ES line, five lines total; normalized data (to GAPDH) presented as mean across lines ± s.e.m.; **p<0.005, two-way ANOVA and post-hoc Bonferroni). (d) qRT-PCR on RNA from differentiating human TS iPSC-derived NPCs or neurons demonstrates that upregulation of exon 8 is abrogated during neuronal differentiation of TS patient-derived neurons (TS NPCs and neurons: two patients, four lines; T7643-5, T7643-7, T7643-32, and T9862-42; normalized data (to GAPDH) presented as mean across lines ± s.e.m.; n.s., not significant, two-way ANOVA). (e) The relative abundance of CACNA1C exons 8 and 8A in NPC cultures is shown separately for H9 ES line, three lines from two healthy individuals (IM23-9, NH1-1 and NH2-6), and four TS lines from two individuals (T7643-5, T7643-7, T7643-32, and T9862-42). Data points indicate individual differentiations. In all TS lines examined, exon 8A is more highly expressed than exon 8 in NPCs. (f) The ratio of exon 8A to exon 8 decreases in differentiating control neurons, while TS NPCs show an increased exon 8A/exon 8 ratio (data presented as mean ± s.e.m.; **p<0.005, ***p<0.001, ****p<0.0001, one-way ANOVA and post-hoc Bonferroni). (g, h) Single-cell qRT-PCR using Fluidigm arrays of neuronal cultures at day 45 of differentiation reveals a greater proportion of neurons expressing CACNA1C-8A in TS patients compared to controls (g), (n = 125 control neurons, n = 140 TS neurons from three control and three patient lines; ***p<0.001, χ2 = 27.36, Chi-square test). (h) The percentage of neurons in patients and controls remains the same, as assessed by NCAM expression (Fluidigm arrays; data presented as mean ± s.e.m., p=0.66, n.s., not significant, unpaired t-test). (i) A working model depicting the splicing shift caused by the TS mutation in a schematized version of the CACNA1C genomic locus spanning exons 7 to 9.
-
Figure 1—source data 1
Expression of exons 8 and 8A in the mouse cortex and differentiating human IPSCs.
- https://cdn.elifesciences.org/articles/51037/elife-51037-fig1-data1-v2.xlsx
Figure 1—figure supplement 1

Cacna1c exon 8 and 8A expression in mouse and human.
(a) Quantitative RT-PCR quality controls on microdissected rostral cortex across embryonic and postnatal brain development. qRT-PCR was performed on RNA extracted from the developing cerebral wall at seven embryonic and postnatal time points (n = 3 mice per time point from two different litters). Depicted here are quality controls demonstrating progressive decline of the progenitor markers Nestin and Pax6 across cortical development (data presented as mean ± s.e.m; *p<0.05, ***p<0.001, ****p<0.0001, significantly different by one-way ANOVA and post-hoc Bonferroni test; for simplicity, we only indicate significance with asterisks for comparisons with immediately preceding time point), while the GABAergic neuron-specific enzyme Gad67 progressively increases as GABAergic interneurons migrate into the cortex (data presented as mean ± s.e.m; *p<0.05, **p<0.01, significantly different by Kruskal-Wallis test and post-hoc Dunn’s correction, mean rank of each time point compared to E11.) (b) qRT-PCR specificity control for Cacna1c exon-specific primers enabling direct comparison of exon 8- and exon 8A-containing transcripts. Depicted here are serial dilutions of exon 8A-containing template. Note the linear amplification using an exon 8A-specific primer and the flat trace for the exon 8-specific primer. (c) Conversely, the specificity control using an exon 8-containing template depicts a flat trace for the exon 8A-specific primer and linear amplification using the exon 8-specific primer. (d) The ratio of Cacna1c exon 8A to exon 8 progressively decreases in the developing mouse cortex over the course of embryonic development. (n = 3 mice per time point; data presented as mean ± s.e.m.; ***p<0.001, **p<0.005, significantly different by one-way ANOVA and post-hoc Bonferroni test). (e, f) The abundance of exon 8A in Cacna1c transcripts declines at the single-cell level between E18 and P14. (e) Single-cell qRT-PCR using Fluidigm dynamic arrays reveals elevated levels of exon 8A at the single-cell level at embryonic day 18 (E18) as compared to exon 8. (n = 91 cells; individual data points correspond to single cells, bar reflects the median; ****p<0.0001, significantly different by Mann-Whitney). (f) By P14, the abundance of exon 8A in Cacna1c transcripts at the single cell level is dramatically reduced. (n = 91 cells; individual data points correspond to single cells, bar reflects the median; ****p<0.0001, significantly different by Mann-Whitney). (g, h) Cacna1c transcripts containing exon 8A are enriched in neurogenic zones in the developing cerebral wall. (g) Representative images of raw data imaged at the same exposure from fluorescence ISH experiments performed on coronal sections through the mouse brain at embryonic day 14 (E14) depict strong expression of exon 8A (top), particularly in the ventricular and subventricular zones. Exon 8 (bottom) is more broadly expressed. Scale bar, 200 μm. (h) Representative fluorescence ISH image of a coronal section through the mouse brain at E18 demonstrates strong expression of transcripts containing exon 8A in neurogenic zones of the dorsal and ventral telencephalon and in newborn neurons of the cortical plate. VZ, ventricular zone; SVZ, subventricular zone; IZ, intermediate zone; CP, cortical plate; 3V, third ventricle; and LV, lateral ventricle. Scale bar, 200 μm. (i) CACNA1C transcripts containing exon 8 are upregulated in human fetal cortex as development progresses. qRT-PCR on RNA from fetal cortex at two different embryonic time points and in adult frontal cortex shows that exon 8 is upregulated as fetal cortical development progresses. (n = 2, GW12-14; n = 2, GW22-26; n = 1 adult; for fetal time points, data presented as mean ± s.e.m). (j) The ratio of CACNA1C exon 8A to exon 8 in differentiating human NPCs is depicted in this plot. Purple bars represent merged control and TS lines at the NPC and neuron stages. Blue circles indicate TS lines, whereas yellow squares reflect controls. (As in Figure 2, control lines: H9 ES line and two subjects, four lines total for NPCs and five lines total for neurons; TS lines: two individuals with TS, four lines total for both NPCs and neurons; data presented as mean ratio across lines ± s.e.m.; ***p<0.001, significantly different by Mann-Whitney).
-
Figure 1—figure supplement 1—source data 1
qRT-PCR and single cell qRT-PCR quality controls and raw data.
- https://cdn.elifesciences.org/articles/51037/elife-51037-fig1-figsupp1-data1-v2.xlsx
Figure 2 with 1 supplement

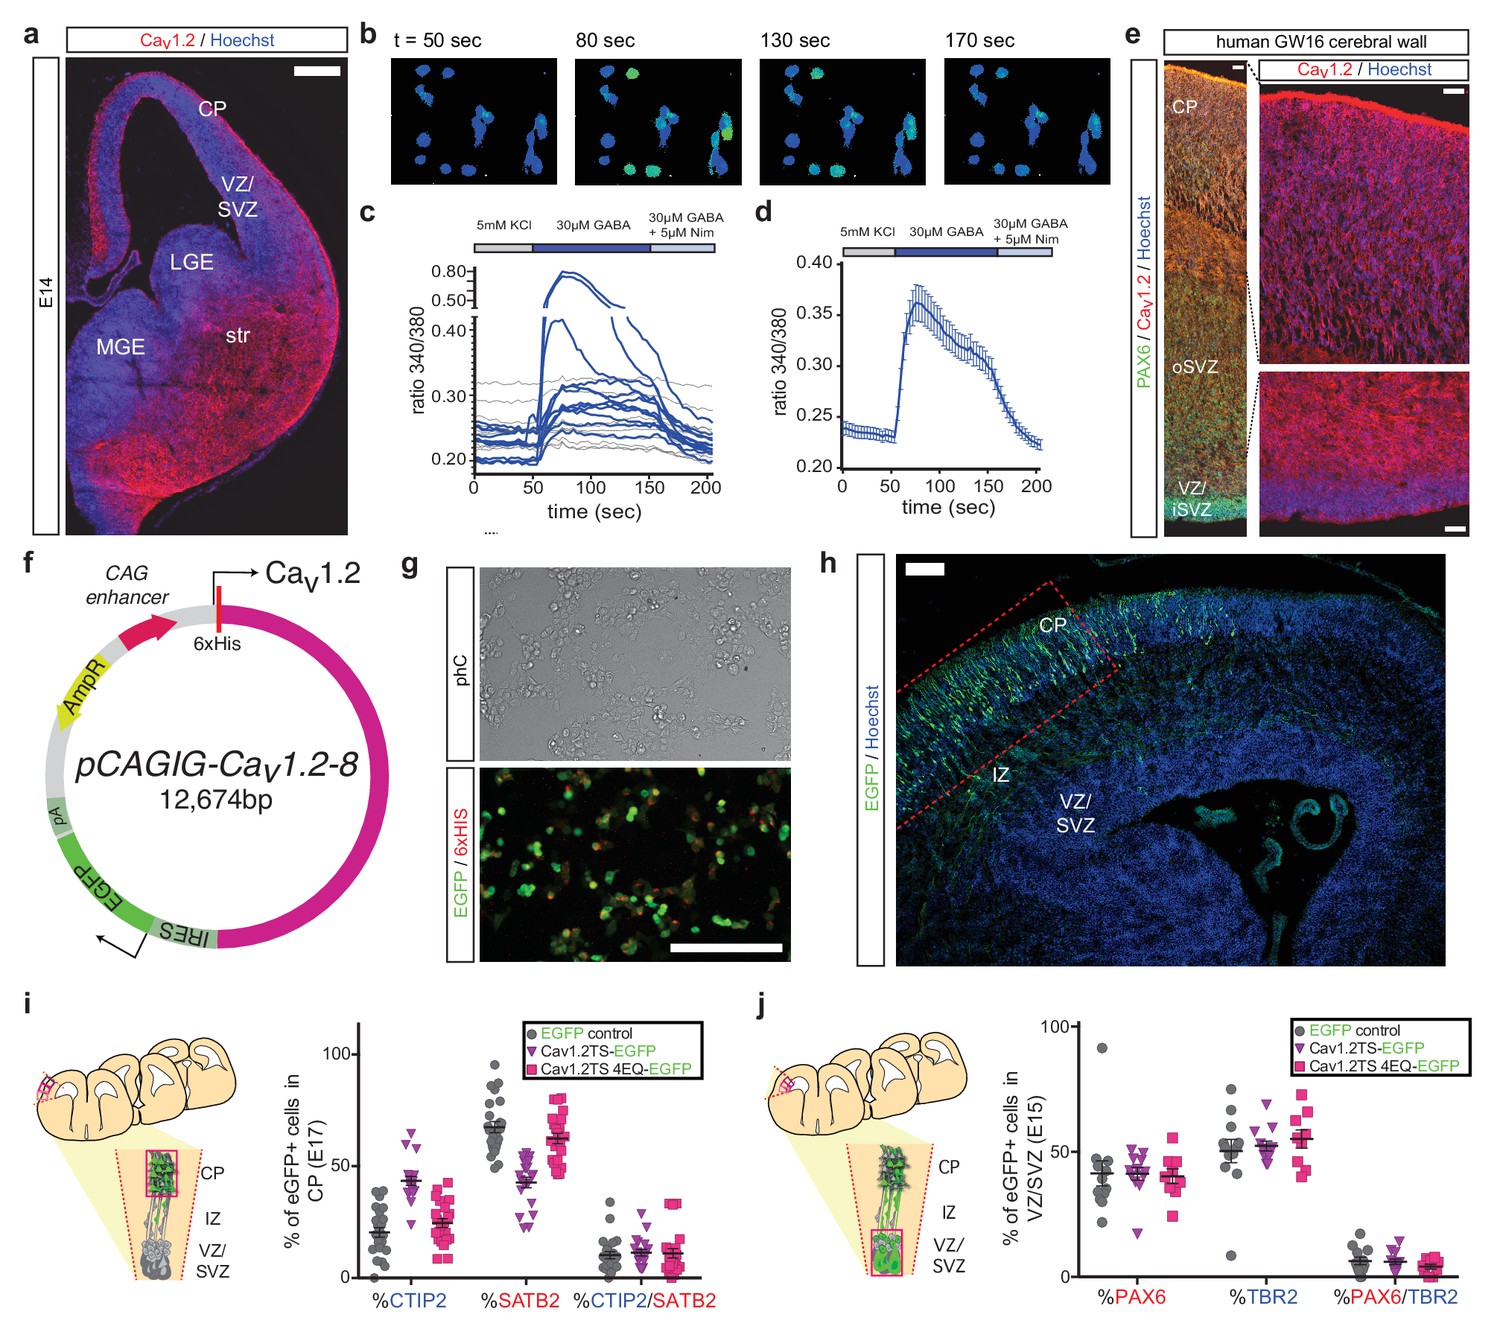
In utero overexpression of Cav1.2-TS channels reduces SATB2-expressing cells and increases CTIP2+ cells in the CP in a calcium-dependent manner.
(a) Representative immunostained coronal sections through the mouse cortex at E11, E14, E16, and P1 depict robust expression of Cav1.2 (red). Dashed white line delineates border between VZ/SVZ and IZ. VZ, ventricular zone; SVZ, subventricular zone; IZ, intermediate zone; and CP, cortical plate. Scale bar, 50 μm. (b) (left) High magnification image through mouse VZ depicts Cav1.2 immunostaining in gray. (right) Cav1.2 (red) is expressed in Pax6 (green)-positive NPCs. Scale bar, 20 μm. (c) Western blot of embryonic mouse cortical lysates probed with Cav1.2 and GAPDH-specific antibodies at E14 and E18 depicts increasing Cav1.2 levels during corticogenesis. (d) Ratiometric calcium imaging of Fura-2-loaded Neuro2A neuroblastoma cells transfected with in utero expression constructs. Average calcium response traces are shown for wild-type, TS, and pore mutant channels upon depolarization with 67 mM KCl. Note that pore mutant channels result in a completely abrogated calcium response and, consistent with loss of voltage-dependent inactivation, the TS channel causes a persistent elevated calcium rise. (e) Schematic depicting time course, expression vectors, and mediolateral placement of counter windows for in utero Cav1.2-TS gain-of-function experiments in f–i). (f–h) Representative cropped coronal sections through the CP of electroporated embryos immunostained for EGFP (green), SATB2 (red) and CTIP2 (blue) at E17.5. Scale bar, 50 μm. (i) Introducing Cav1.2-TS in utero results in calcium-dependent alterations in the proportion of SATB2- and CTIP2-expressing EGFP+ cells. (IRES-GFP, n = 6 mice, 1587 cells; Cav1.2-TS, n = 6 mice, 1287 cells; Cav1.2-TS-4EQ, n = 3 mice, 708 cells; data presented as box and whisker plot, box bounds the interquartile range (IQR) divided by the mean and whiskers extend to the minimum and maximum value; *p<0.05, **p<0.005, ****p<0.0001, two-way ANOVA and post-hoc Bonferroni.) (j) Schematic illustration depicting time course, expression vectors, and mediolateral placement of counter windows for in utero Cav1.2-TS gain-of-function experiments in k–n). (k–m) Representative coronal sections through the VZ/SVZ of electroporated embryos immunostained for EGFP (green), PAX6 (red) and TBR2 (blue) at E15.5. Scale bar, 50 μm. (n) Introducing Cav1.2-TS in utero does not alter the distribution of NPC subtypes in the VZ/SVZ (IRES-GFP, n = 4 mice, 722 cells; Cav1.2-TS, n = 4 mice, 830 cells; Cav1.2-TS-4EQ, n = 3 mice, 479 cells; as above, data presented as box and whisker plot; n.s., not significant, two-way ANOVA and post-hoc Bonferroni.).
-
Figure 2—source data 1
Cav1.2-TS in utero electroporation experiments.
- https://cdn.elifesciences.org/articles/51037/elife-51037-fig2-data1-v2.xlsx
Figure 2—figure supplement 1
Cav1.2-TS in utero electroporation experiments.
(a) Representative immunostained coronal section through the developing mouse brain at E14 depicting robust expression of Cav1.2 (red) early in embryonic development. VZ, ventricular zone; SVZ, subventricular zone; IZ, intermediate zone; CP, cortical plate; str, striatum; LGE, lateral ganglionic eminence; and MGE, medial ganglionic eminence. Scale bar, 200 μm. (b–d) Representative fluorescence images of a field of Fura-2-loaded primary mouse NPCs (b) throughout the ratiometric calcium imaging experiment shown in (d). Individual traces from a representative field are shown in (c). Note the presence of cells that do not respond to GABA application with a calcium rise (dotted black lines) and that rises in responding cells (dark blue lines) are abrogated by application of nimodipine. (d) Average calcium response trace (n = 38 responding cells) evoked by 30 μM GABA-induced depolarization (bright blue bar) is blocked by application of the LTC inhibitor nimodipine (light blue bar). (e) Composite representative coronal section through GW16 human cortex immunostained for Cav1.2 (red) and PAX6 (green). Robust expression of Cav1.2 is seen throughout the CP, subplate, and oSVZ with lower expression in the VZ/inner SVZ. Scale bars, 50 μm. (f) Plasmids encoding 6xHis-tagged exon 8-containing wild-type or TS Cav1.2-IRES-EGFP under the control of the CAG promoter were constructed for in utero experiments. (g) Channel constructs were transfected into human embryonic kidney (HEK293) cell lines to confirm co-expression of 6xHis-tagged Cav1.2 channels and EGFP. Scale bar, 100 μm. (h) EGFP+ electroporated cells can be seen at E17.5 having migrated into the CP. The expression of the fate determinants CTIP2 and SATB2 was quantified in EGFP+ cells within the CP in the region delineated by the dotted red box. Scale bar, 100 μm. (i) (left) Schematic illustration of possible mediolateral placement of counting windows across different brains at E17.5. GFP+ cells were quantified in the CP within the region delineated by the dashed red lines. CP, cortical plate; IZ, intermediate zone; VZ/SVZ, ventricular and subventricular zones. (right) Quantification of SATB2- and CTIP2-expressing electroporated EGFP+ cells in the CP by section for Cav1.2-TS over-expression experiments. Over-expressing a TS Cav1.2 channel, but not a TS pore mutant channel, phenocopies TS differentiation defects observed in patient cells in a calcium-dependent manner. (IRES-GFP, n = 6 mice; Cav1.2-TS, n = 6 mice; Cav1.2-TS-4EQ, n = 3 mice). (j) (left) Schematic illustration of possible mediolateral placement of counting windows across different brains at E15.5. All GFP+ cells were quantified in the VZ/SVZ within the region delineated by the dashed red lines. CP, cortical plate; IZ, intermediate zone; VZ/SVZ, ventricular and subventricular zones. (right) Quantification of PAX6- and TBR2-expressing electroporated EGFP+ cells in the VZ/SVZ by section for Cav1.2-TS over-expression experiments. Over-expressing a TS Cav1.2 channel had no effect on the abundance of progenitor types that later give rise to CPNs and SCPNs. (IRES-GFP, n = 4 mice; Cav1.2-TS, n = 4 mice; Cav1.2-TS-4EQ, n = 3 mice).
Figure 3 with 1 supplement
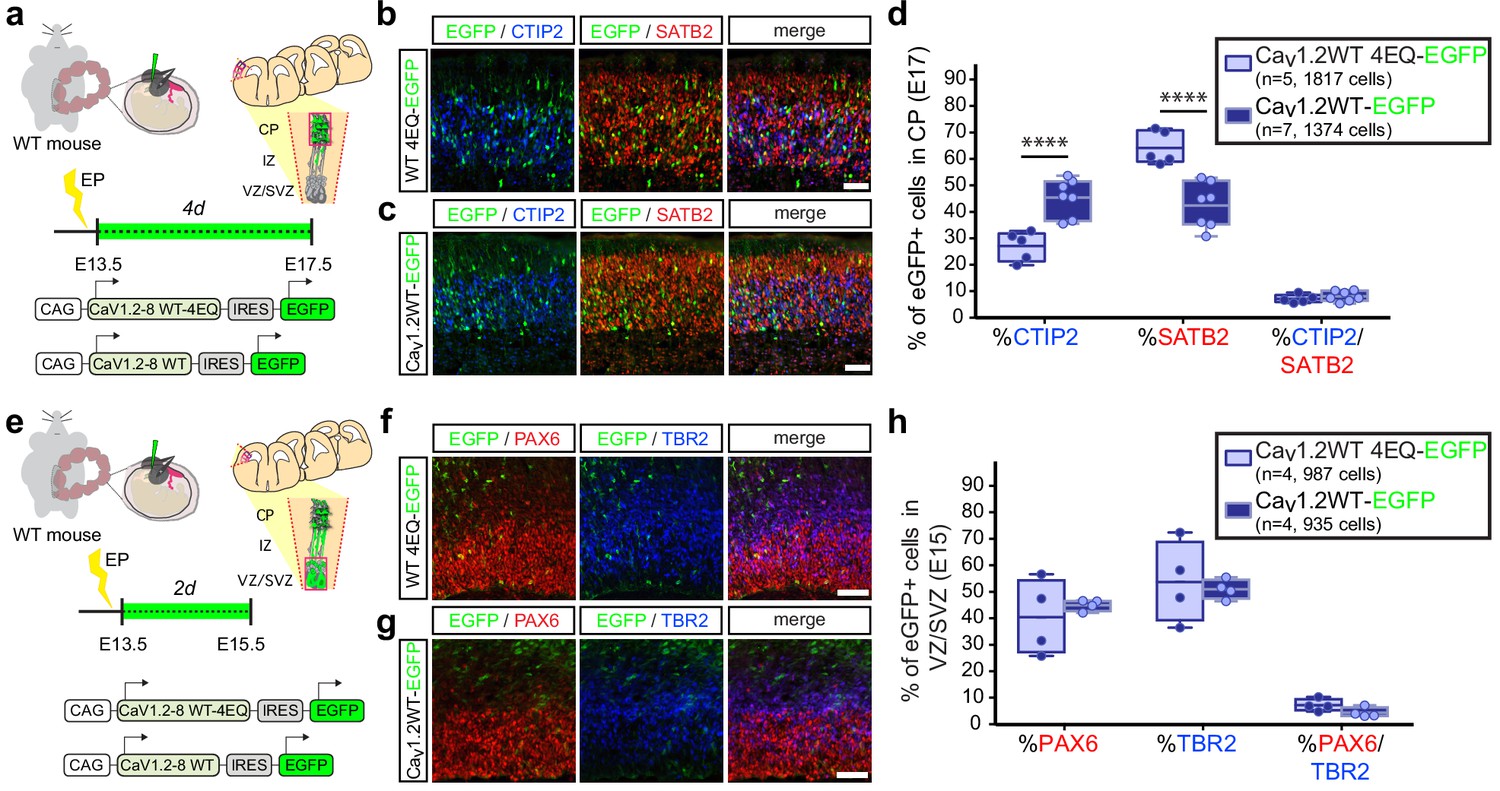
In utero over expression of wild-type Cav1.2 alters the relative abundance of early-born projection neuron subtypes similar to TS channels.
(a) Schematic illustration depicting time course, expression vectors, and mediolateral placement of counter windows for in utero Cav1.2-WT gain-of-function experiments in b–d). (b, c) Representative coronal sections through the CP of electroporated embryos immunostained for EGFP (green), SATB2 (red) and CTIP2 (blue) at E17.5. Scale bar, 50 μm. (d) Introducing Cav1.2-WT in utero results in a calcium-dependent increase in the relative abundance of SATB2-expressing EGFP+ cells and a commensurate reduction in CTIP2+ cells (Cav1.2-WT-4EQ, n = 5 mice, 1817 cells; Cav1.2-WT, n = 7 mice, 1374 cells; data presented as box and whisker plot, box bounds the interquartile range (IQR) divided by the mean and whiskers extend to the minimum and maximum value; ****p<0.0001, two-way ANOVA and post-hoc Bonferroni.) (e) Schematic illustration depicting time course, expression vectors, and mediolateral placement of counter windows for in utero Cav1.2-WT gain-of-function experiments in f–h). (f,g) Representative coronal sections through the VZ/SVZ of electroporated embryos immunostained for EGFP (green), PAX6 (red) and TBR2 (blue) at E15.5. Scale bar, 50 μm. (h) In utero expression of Cav1.2-WT does not alter the relative abundance of NPC subtypes in the VZ/SVZ (Cav1.2-WT-4EQ, n = 4 mice, 987 cells; Cav1.2-WT, n = 4 mice, 935 cells; as above, data presented as box and whisker plot; n.s., not significant, two-way ANOVA and post-hoc Bonferroni.).
-
Figure 3—source data 1
Cav1.2-WT in utero gain-of-function experiments.
- https://cdn.elifesciences.org/articles/51037/elife-51037-fig3-data1-v2.xlsx
Figure 3—figure supplement 1
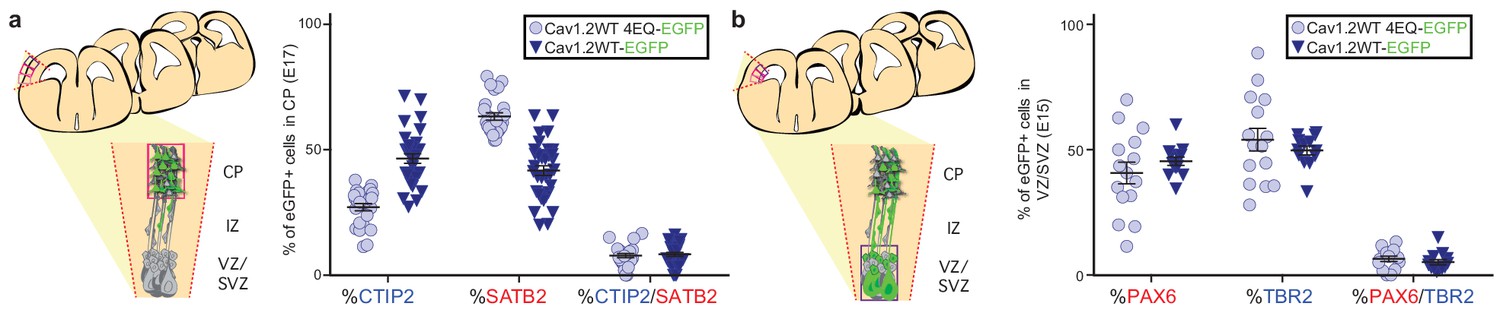
Cav1.2 gain-of-function in utero electroporation experiments.
(a) (left) Schematic illustration of possible mediolateral placement of counting windows across different brains for gain of function experiments at E17.5. All GFP+ cells were quantified in the CP within the region delineated by the dashed red lines. CP, cortical plate; IZ, intermediate zone; VZ/SVZ, ventricular and subventricular zones. (right) Quantification of SATB2- and CTIP2-expressing electroporated EGFP+ cells in the CP by section for Cav1.2-WT and WT-pore mutant Cav1.2 over-expression experiments. Expressing a WT Cav1.2 channel phenocopies TS differentiation defects. (Cav1.2-WT, n = 7 mice; Cav1.2-WT-4EQ, n = 5 mice). (b) (left) Schematic illustration of possible mediolateral placement of counting windows across different brains for gain of function experiments at E15.5. All GFP+ cells were quantified in the VZ/SVZ within the region delineated by the dashed red lines. CP, cortical plate; IZ, intermediate zone; VZ/SVZ, ventricular and subventricular zones. (right) Quantification of PAX6- and TBR2-expressing electroporated EGFP+ cells in the VZ/SVZ by section for Cav1.2-WT and WT-pore mutant Cav1.2 over-expression experiments. Similar to TS channels, over-expressing a WT Cav1.2 channel had no effect on abundance of progenitor types. (Cav1.2-WT, n = 4 mice; Cav1.2-WT-4EQ, n = 4 mice).
Figure 4 with 1 supplement
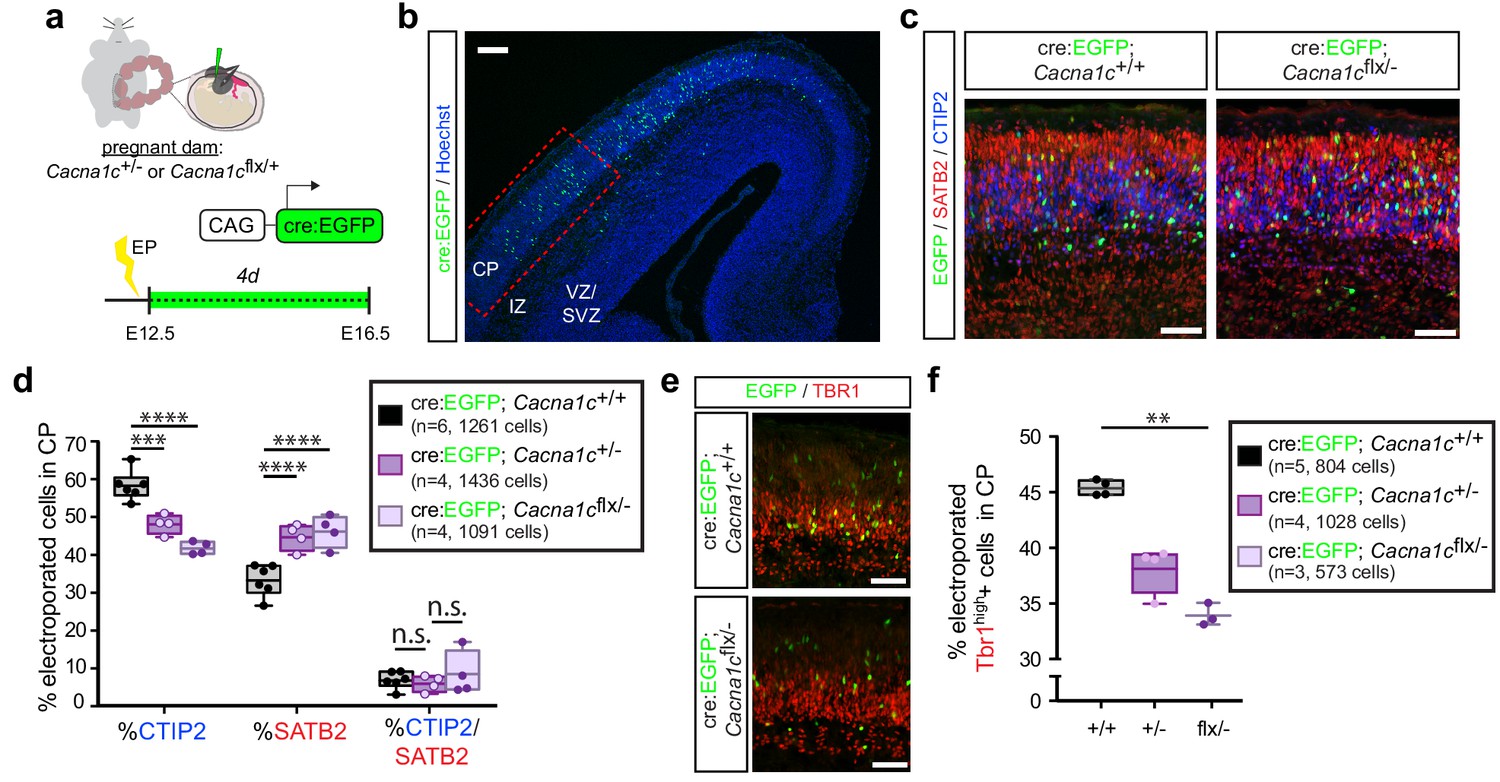
Cav1.2 loss of function results in increased SATB2+ cells and decreased CTIP2+ cells in the CP.
(a) Schematic depicting the time course of in utero loss-of-function experiments. (b) Expression of cell-type-specific transcription factors was quantified in EGFP+ cells in the CP of E16.5 embryos electroporated with Cre:EGFP at E12.5, in the region marked by the dotted red box. VZ, ventricular zone; SVZ, subventricular zone; IZ, intermediate zone; and CP, cortical plate. Scale bar, 100 μm. (c) Representative coronal sections immunostained for EGFP (green), SATB2 (red) and CTIP2 (blue) through the CP of WT and Cacna1cflx/- -electroporated embryos at E16.5. Scale bar, 50 μm. (d) Cav1.2 loss of function results in reduced CTIP2-expressing EGFP+ cells with a concomitant increase in SATB2+ cells. (Cacna1c+/+, n = 6 mice, 1261 cells; Cacna1c+/-, n = 4 mice, 1436 cells; Cacna1cflx/-, n = 4 mice, 1091 cells; data presented as box and whisker plot, box bounds the IQR divided by the mean and whiskers extend to the minimum and maximum value; ****p<0.0001, two-way ANOVA and post-hoc Bonferroni.) (e) Representative coronal sections immunostained for EGFP (green) and TBR1 (red). Scale bar, 50 μm. (f) Cav1.2 loss of function results in a modest reduction in TBR1+ electroporated cells. (Cacna1c+/+, n = 5 mice, 804 cells; Cacna1c+/-, n = 4 mice, 1028 cells; Cacna1cflx/-, n = 3 mice, 573 cells; data presented as box and whisker plot as in (d); **p<0.01, Kruskal-Wallis test and post-hoc Dunn’s correction, mean rank compared to Cav+/+.).
-
Figure 4—source data 1
Cav1.2 loss-of-function experiments.
- https://cdn.elifesciences.org/articles/51037/elife-51037-fig4-data1-v2.xlsx
Figure 4—figure supplement 1
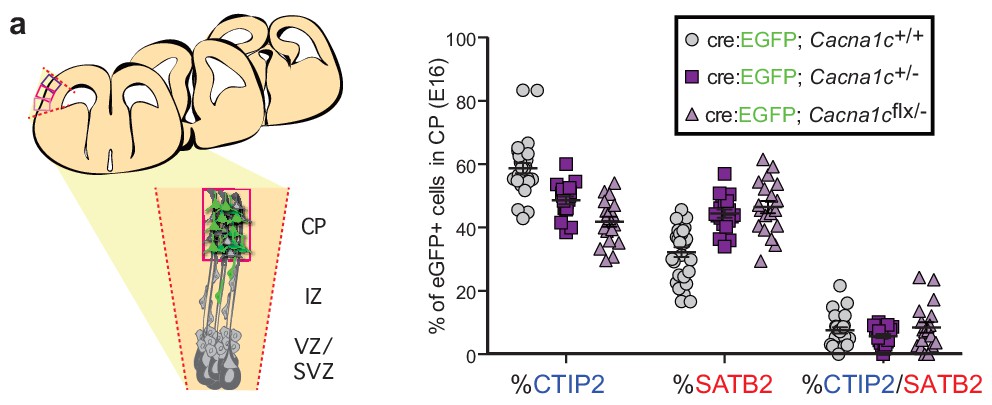
Cav1.2 loss-of-function in utero electroporation experiments.
(a) (left) Schematic illustration of possible mediolateral placement of counting windows across different brains for loss-of-function experiments at E16.5. All Cre:EGFP+ cells were quantified in the CP within the region delineated by the dashed red lines. CP, cortical plate; IZ, intermediate zone; VZ/SVZ, ventricular and subventricular zones. (right) Quantification of SATB2- and CTIP2-expressing EGFP+ cells in the CP by section for Cav1.2 loss-of-function experiments. (Cacna1c+/+, n = 6 mice; Cacna1c+/-+, n = 4 mice; Cacna1cflx/-, n = 4 mice).
Additional files
-
Supplementary file 1
Key Resources Table.
- https://cdn.elifesciences.org/articles/51037/elife-51037-supp1-v2.docx
-
Transparent reporting form
- https://cdn.elifesciences.org/articles/51037/elife-51037-transrepform-v2.docx
Download links
A two-part list of links to download the article, or parts of the article, in various formats.
Downloads (link to download the article as PDF)
Open citations (links to open the citations from this article in various online reference manager services)
Cite this article (links to download the citations from this article in formats compatible with various reference manager tools)
Aberrant calcium channel splicing drives defects in cortical differentiation in Timothy syndrome
eLife 8:e51037.
https://doi.org/10.7554/eLife.51037


