A novel role for lipoxin A4 in driving a lymph node–eye axis that controls autoimmunity to the neuroretina
- Vision Science Program, University of California, Berkeley, United States
- Laboratory of Immunology, National Eye Institute, National Institutes of Health, United States
- School of Optometry, University of California, Berkeley, United States
- Infectious Disease and Immunity Program, University of California, Berkeley, United States
Figures
Figure 1 with 1 supplement
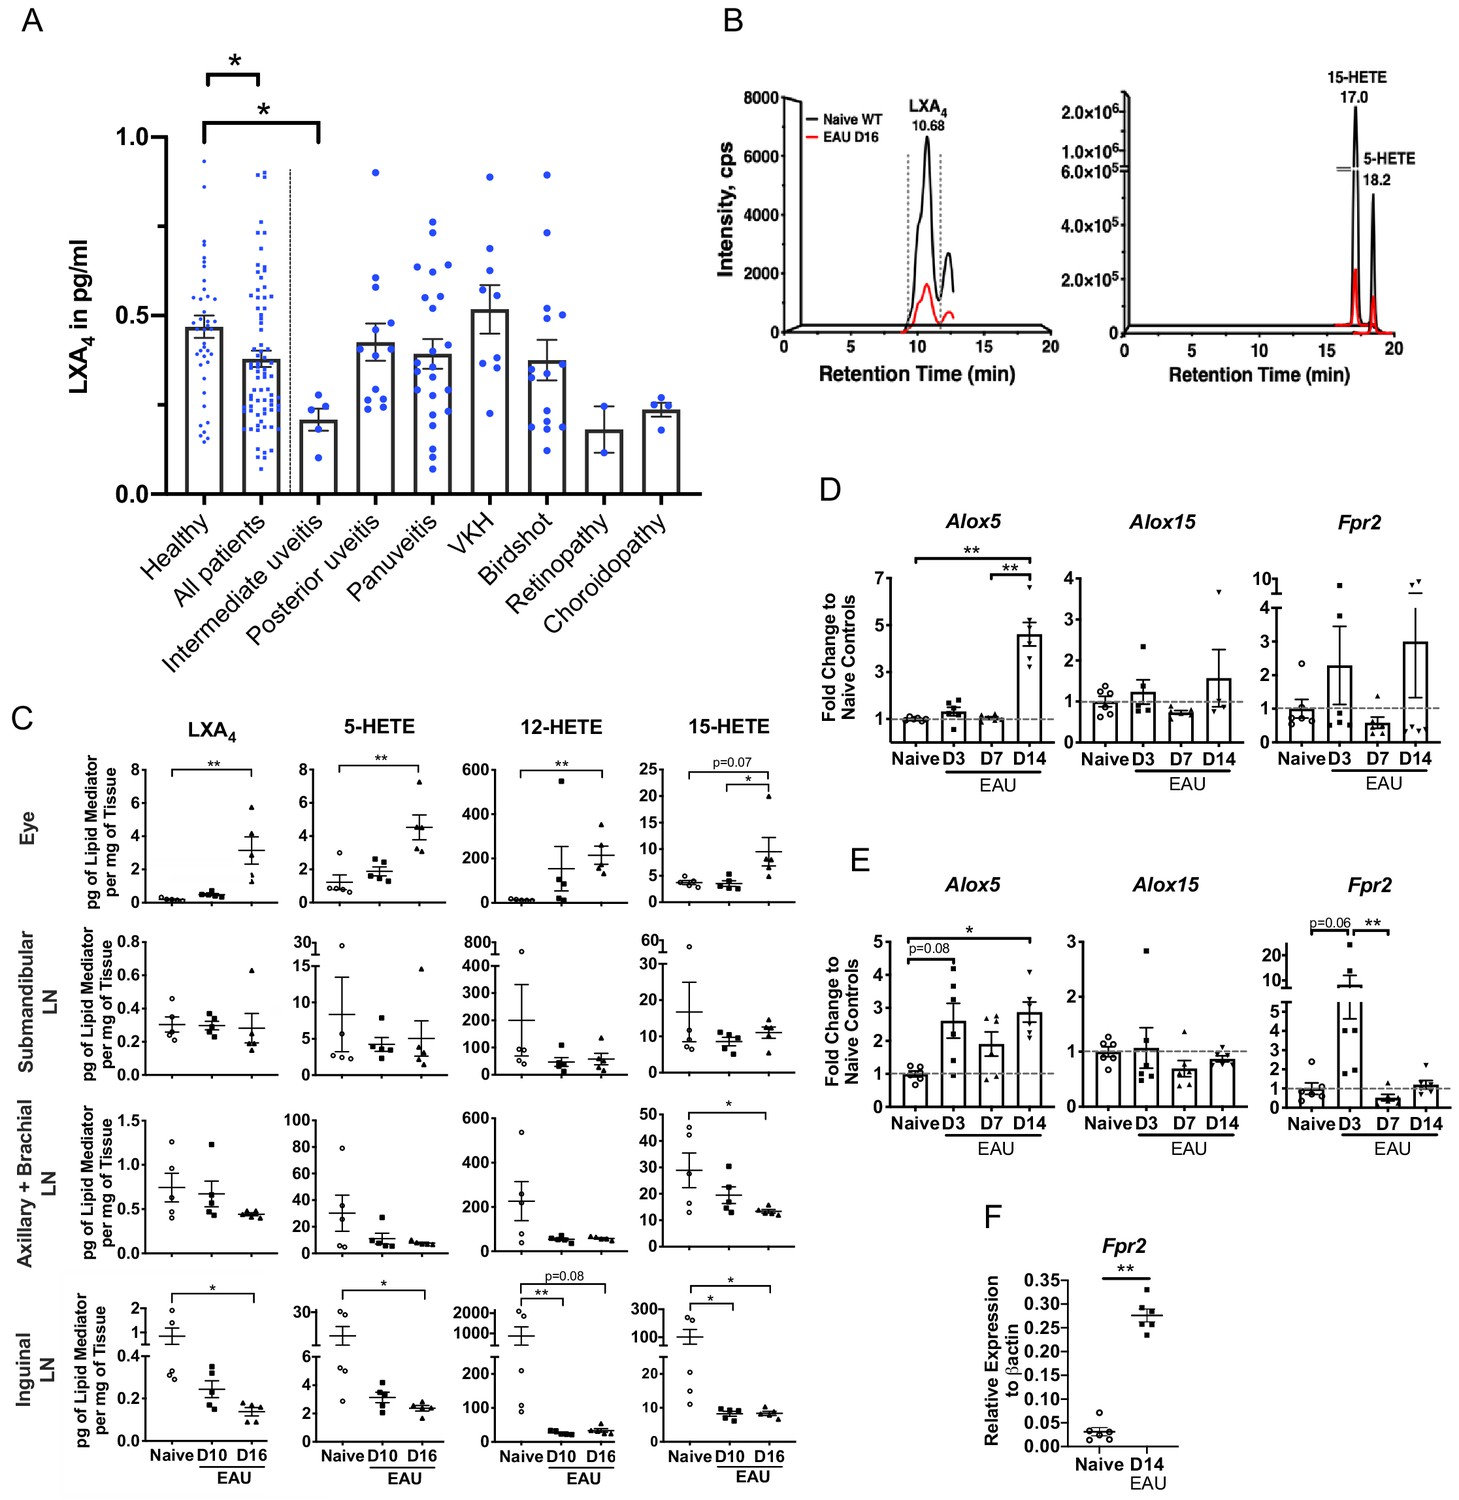
LXA4 is generated during autoimmune uveitis in a disease- and tissue- dependent manner.
(A) Bar graph of LXA4 concentration in pg/ml measured in human serum by ELISA. Healthy subjects, n = 41; all uveitis patients, n = 78; and breakdown of uveitis diagnoses within all patient samples, n = 2 to 23 per diagnosis. C57BL/6J mice were immunized with 300 μg IRBP651-670 and tissues collected for analyses on days 10 and 16 post-immunization for panels B-I. (B) Lipidomic analysis of inguinal lymph nodes from naïve and EAU-challenged mice on day 16. Peaks are representative multiple reaction monitoring LC-MS/MS chromatograms for specific ion transitions: LXA4 (m/z 351 > 115), 5-HETE (m/z 319 > 115), 15-HETE (m/z 319 > 175). (C) LXA4 and its pathway markers in pg per mg of tissue in whole eye globes, submandibular lymph nodes, distal (axillary + brachial) lymph nodes, and inguinal lymph nodes quantified by LC-MS/MS from unimmunized naïve and EAU-challenged mice (days 10 and 16). n = 5 per group. (D–E) Temporal expression of Alox5, Alox15 and Fpr2 in (D) retinas, and (E) inguinal lymph nodes during EAU (days 3, 7, 14) in comparison to the respective tissue from naïve mice quantified by RT-PCR. n = 6 per group. (F) Fpr2 expression on CD4+ T cells isolated from inguinal lymph nodes of naive and immunized mice, n = 6 per group. *p<0.05, **p<0.01, One-way ANOVA and Mann-Whitney test.
Figure 1—figure supplement 1
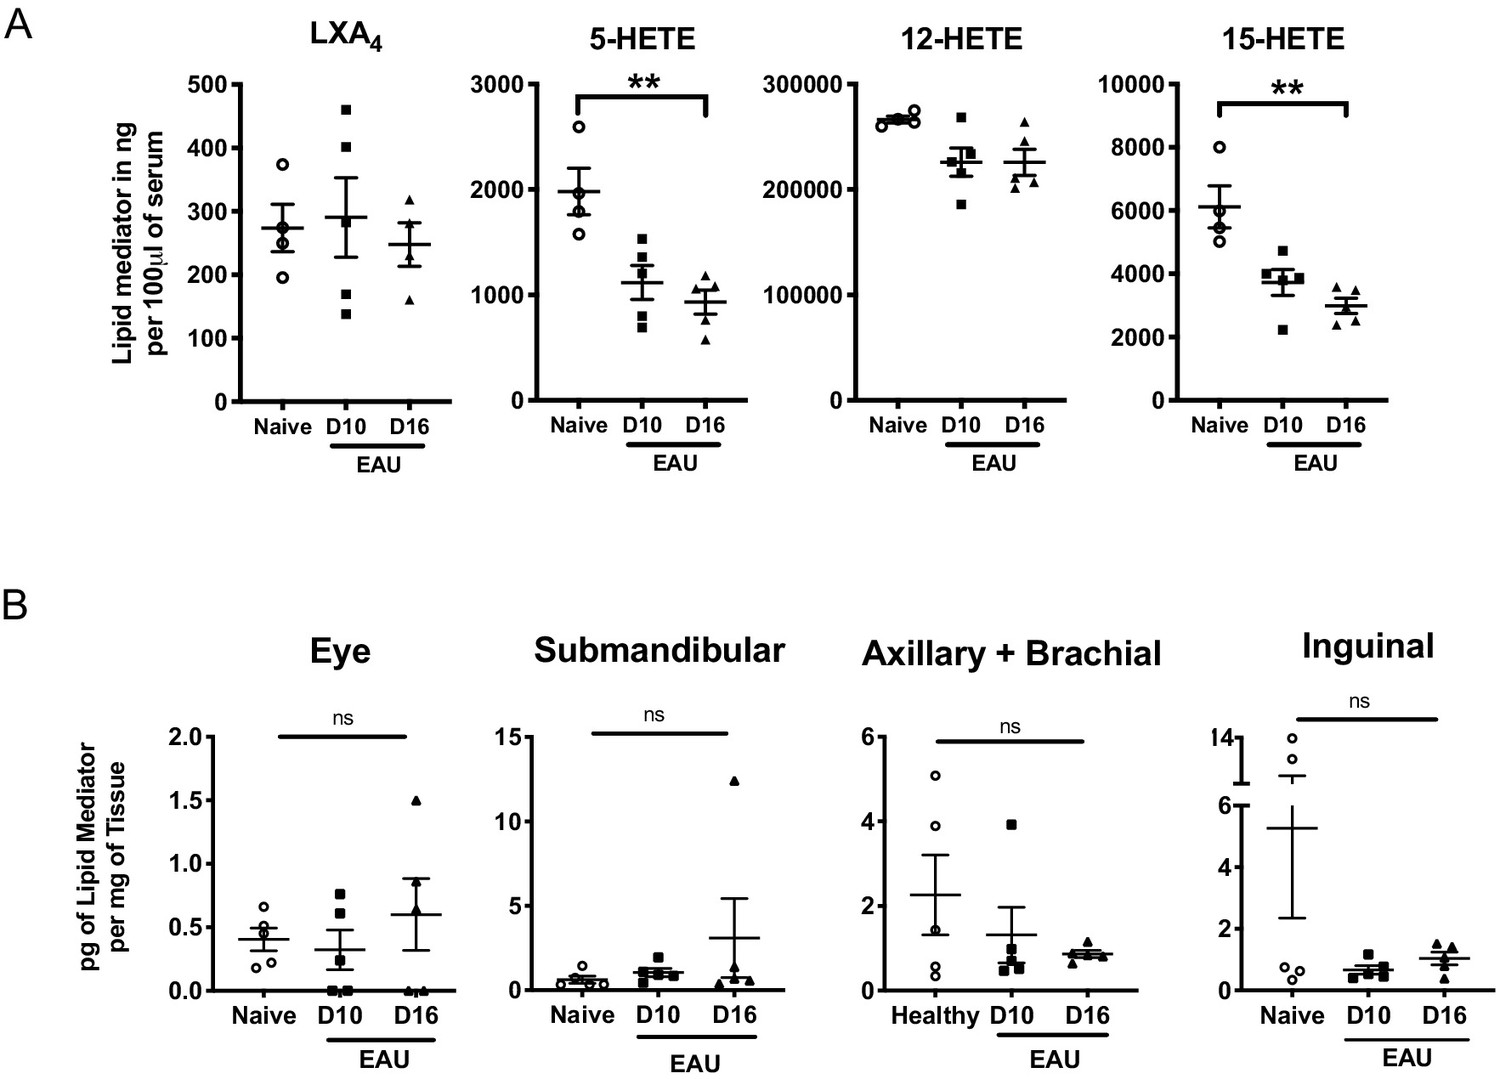
Murine serum LXA4 level and in vivo LTB4 formation during EAU pathogenesis.
(A) LXA4 and its pathway markers 5-HETE and 15-HETE of unimmunized naïve and EAU-challenged mice (days 10 and 16) were quantified in serum by LC-MS/MS. n = 4–5 per group. (B) LTB4 in pg per mg of tissue in whole eye globes, submandibular lymph nodes, distal (axillary + brachial) lymph nodes, and inguinal lymph nodes quantified by LC-MS/MS on unimmunized naïve and EAU-challenged mice (days 10 and 16). n = 5 per group. **p<0.002, One-Way ANOVA.
Figure 2 with 1 supplement
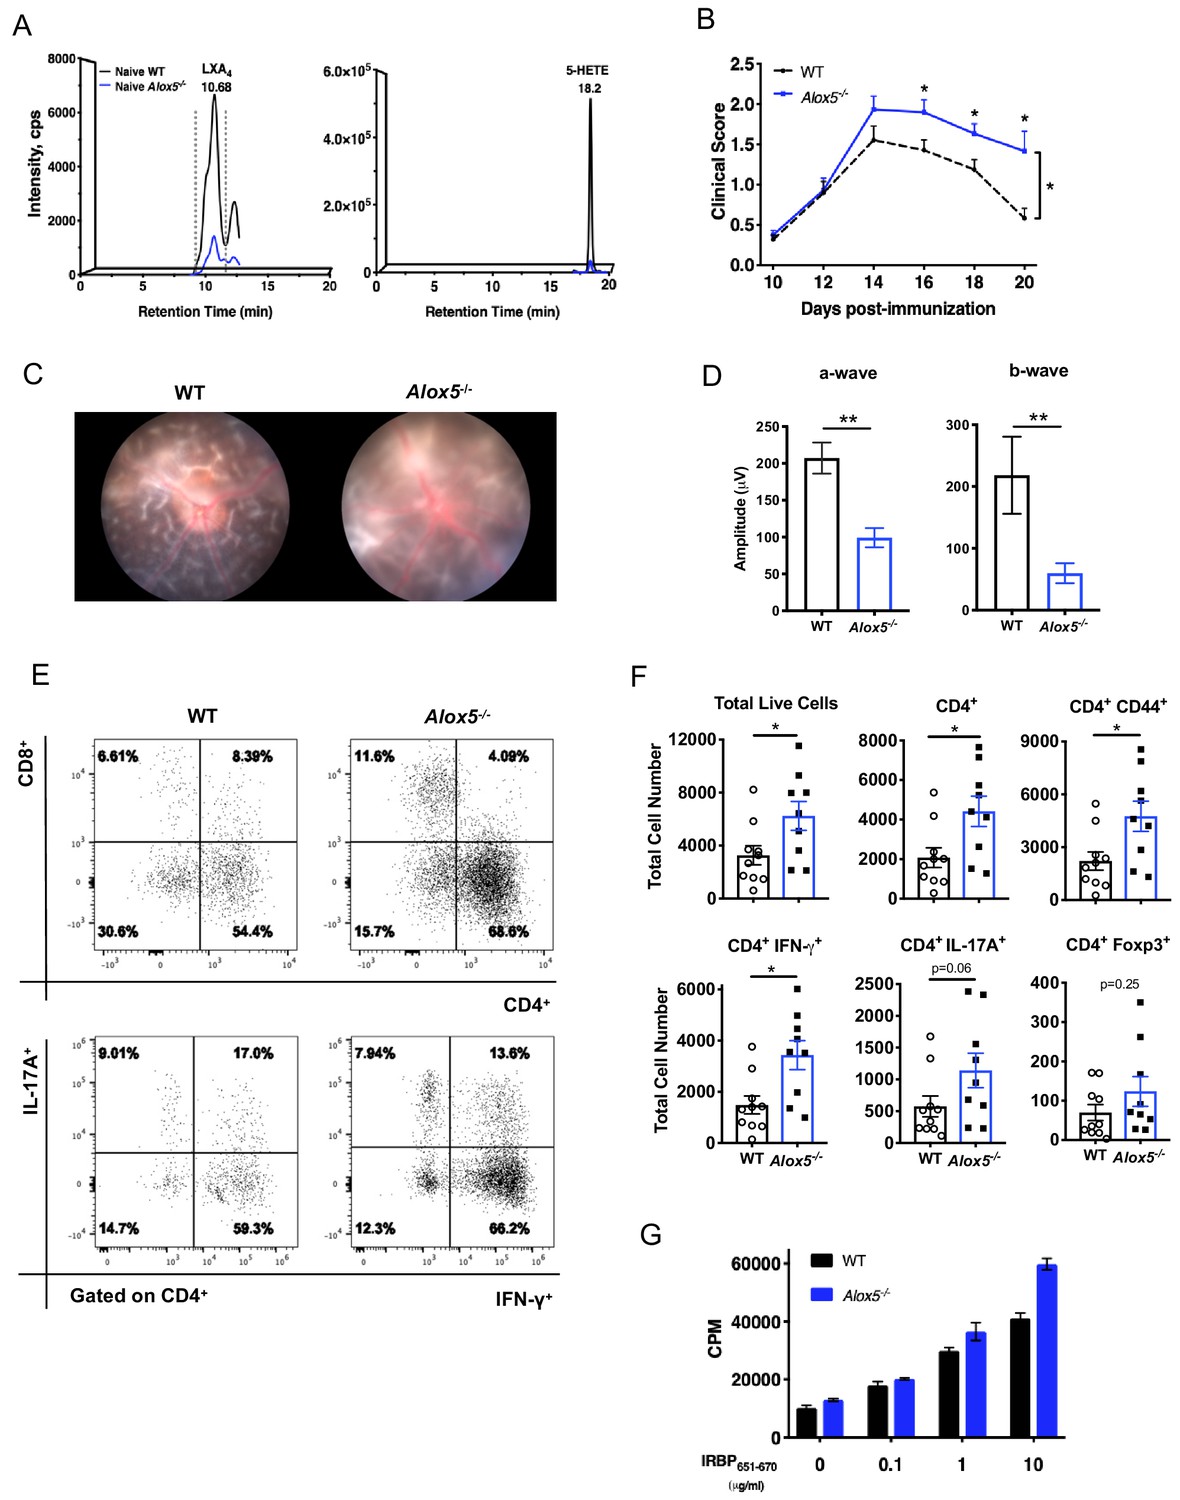
LXA4 deficiency exacerbates disease progression.
(A) Chromatograms from LC-MS/MS analyses showing LXA4 and 5-HETE formation in naïve WT and Alox5-/- mice. (B) Fundoscopy scores of WT and Alox5-/- mice immunized with 150 µg of IRBP651-670. n = 15 per group through day 18, n = 6–9 per group on day 20. Combined from two experiments. (C) Representative Micron III fundus images of immunized WT and Alox5-/- mice taken on day 14 post-immunization. (D) Electroretinography of EAU-challenged WT and Alox5-/- mice measured on day 13 post-immunization following dark adaptation, n = 10 eyes per group. (E) Representative flow plots of CD4+ vs. CD8+ and IFN-γ vs. IL-17A producing CD4+ cells in the eyes of WT and Alox5-/- mice. (F) Flow cytometry analyses of total numbers of ocular infiltrates in EAU-challenged WT and Alox5-/- gated on live cells, CD4+, CD4+ CD44+, CD4+ IFN-γ+, CD4+ IL-17A+ populations, n = 9–10 mice per group. (G) Representative bar graphs of antigen-specific cell proliferation performed on inguinal lymph nodes harvested on day 18 post-immunization from WT and Alox5-/- mice, pooled n = 6–9 mice per group. Showing one representative from three experiments with the same trend. *p<0.05, **p<0.01, Wilcoxon matched-pairs signed rank test and unpaired t test.
Figure 2—figure supplement 1
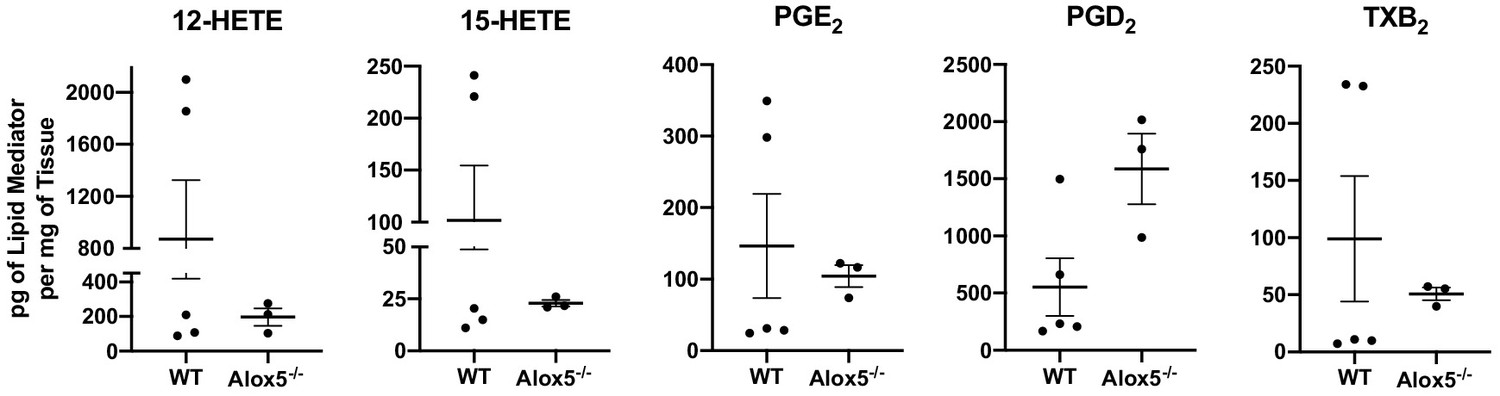
In vivo generation of other eicosanoids in WT and Alox5-/- mice.
12-HETE, 15-HETE, PGE2, PGD2 and TXB2 in pg per mg of tissue in inguinal lymph nodes quantified by LC-MS/MS of naïve WT and Alox5-/- mice. n = 3–5 per group, two pooled mice per sample.
Figure 3
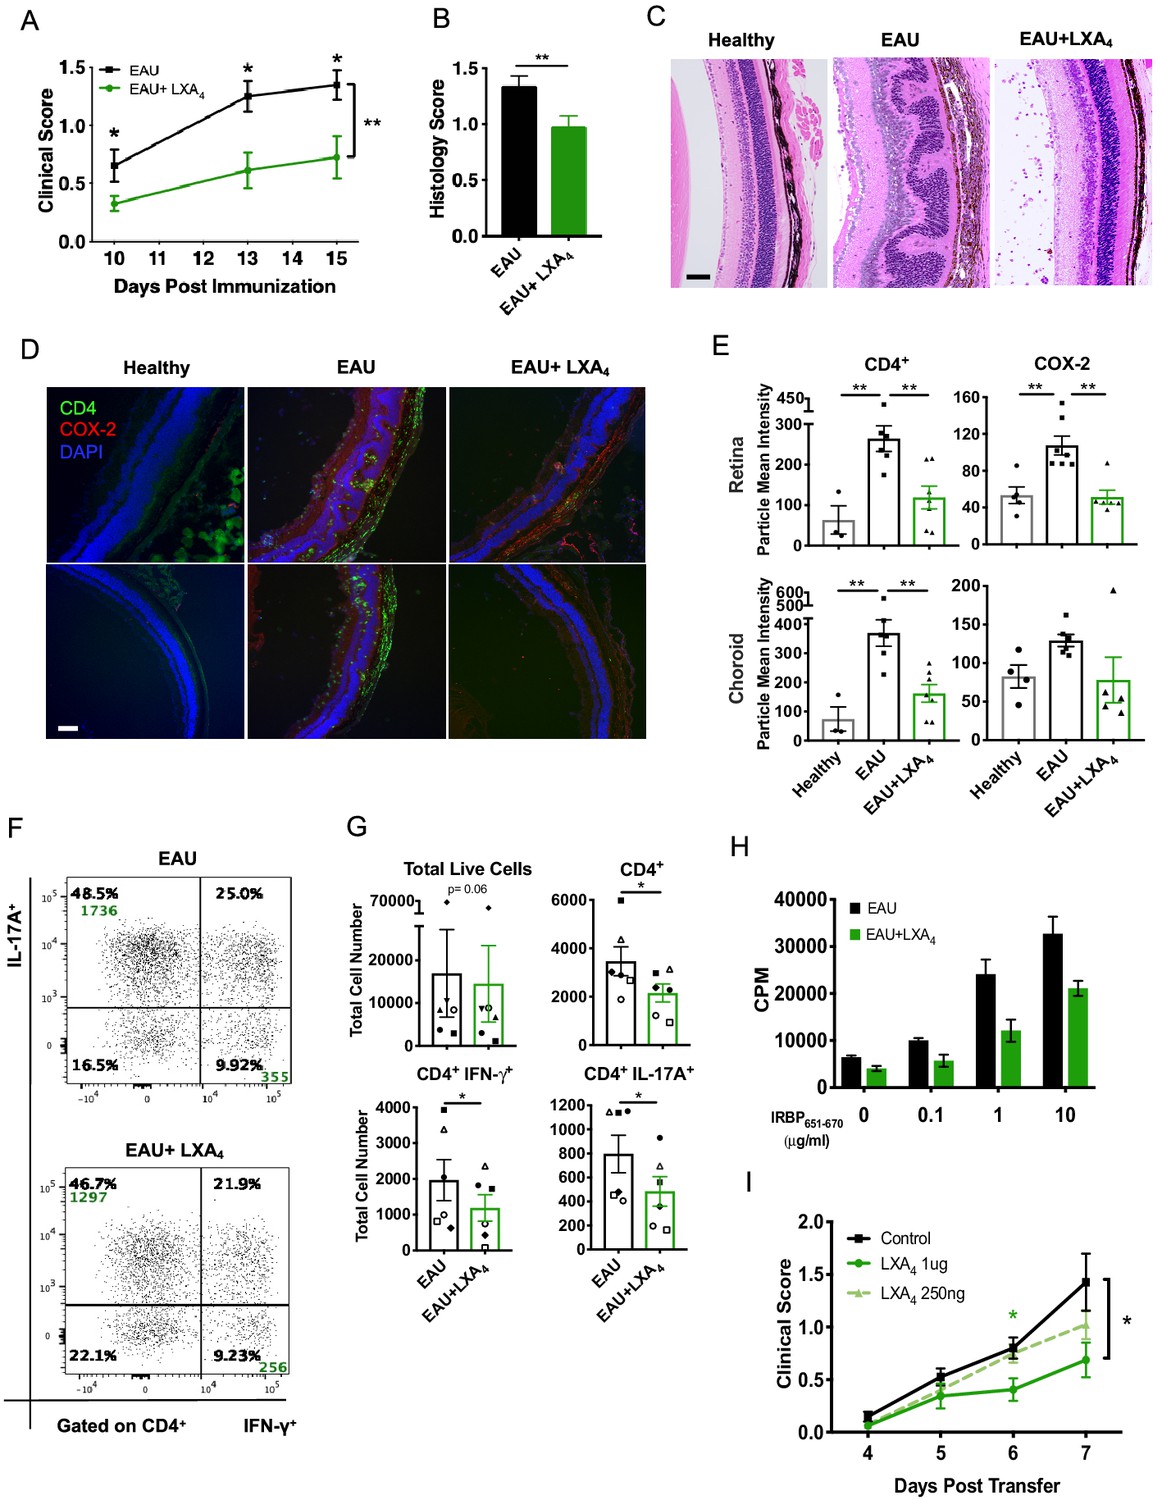
LXA4 treatment attenuates the development of uveitis.
Mice were immunized with 300 μg of IRBP651-670 to induce EAU and treated with LXA4 or vehicle control starting on the day of immunization. (A) Clinical scores of retinal inflammation assessed by fundoscopy, n = 10 per group. (B) Histology scores of eyes at peak inflammation, n = 24 per group combined from three experiments. (C) Representative H and E staining of the posterior segment of the eye. 20X, scale bar = 50 µm. (D) Representative immunohistochemistry images of eyes harvested at peak inflammation. Top row: central retina, bottom row: peripheral retina. 10X, scale bar = 100 µm. (E) Fiji quantification of CD4 and COX-2 fluorescence particle intensity of immunohistochemistry images, n = 3–7 per group. (F) Representative flow plots of eyes harvested at peak inflammation. Numbers in green are the total cell counts in the gated population. (G) Total number of ocular infiltrates at peak inflammation, n = 6 experiments (pooled 4–6 mice per group). (H) Bar graphs of proliferation assay performed on lymph nodes harvested at peak inflammation, pooled n = 6 mice per group. Representative assay of 3 separate experiments. (I) Fundoscopy scores of a representative adoptive transfer experiment out of 3. 5 × 10⁶ R161H CD90.1 lymphocytes were activated with antigen IRBP161-180 in vitro for 3 days and transferred into WT CD90.2 recipients. Recipients were treated with indicated doses of LXA4 starting on the day of cell transfer. *p<0.05, **p<0.01, Mann-Whitney test and One-way ANOVA.
Figure 4
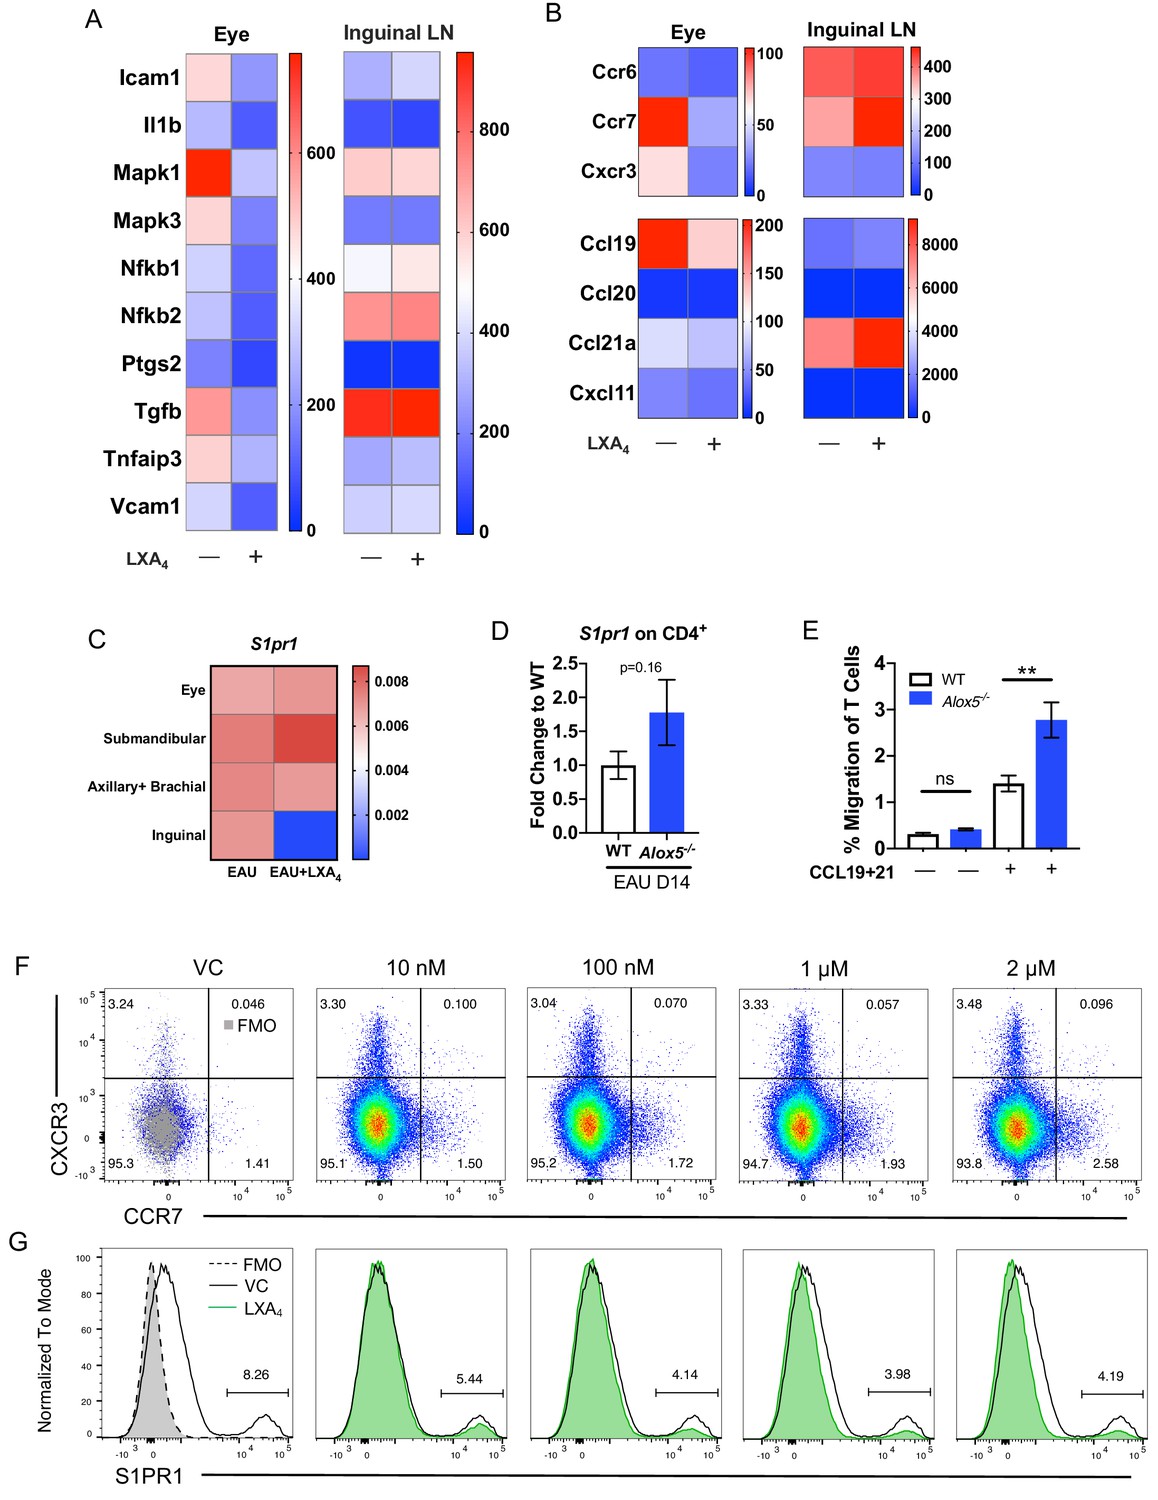
LXA4 modulates T cell trafficking in inguinal lymph nodes that drain the immunization site.
All tissues were collected from mice immunized with 150 μg of IRBP651-670. (A–B) Heat maps showing gene expression of inflammation and cell trafficking markers in the eyes and inguinal lymph nodes harvested from EAU-challenged mice treated with vehicle or LXA4. (A) Inflammation markers and (B) migration markers analyzed by nanoString. Each sample was pooled from 3 to 4 mice on day 16 post-immunization. (C) S1pr1 expression relative to β-actin from eyes and various lymph nodes of mice treated with vehicle or LXA4 harvested on day 16 post-immunization, same samples as panels A and B. (D) Fold change in S1pr1 expression of CD4+ T cells isolated from WT and Alox5-/- on day 14 post-immunization, n = 11 from three experiments combined. (E) Transwell migration assay of CD4+ T cells isolated from immunized WT and Alox5-/- on day 13 post-immunization. CD4+ T cells were pre-stimulated with anti-CD3 and anti-CD28 antibodies for 18 hr and transferred to transwell culture plates and incubated for 4 hr in the absence or presence of CCL19 and CCL21, n = 12 per group. One representative experiment of 4 showing the same trend. **p<0.01, unpaired Welch’s t test. (F–G) Representative flow plots of CCR7 and S1PR1 expression on in vitro anti-CD3 and anti-CD28 stimulated CD4+ T cells treated with vehicle control or 10 nM, 100 nM, 1 μM, and 2 μM of LXA4. Cells were gated on live single cells then CD4+ cells. Gray overlays indicate fluorescence minus one controls. Showing one representative experiment out of three.
Figure 5 with 1 supplement
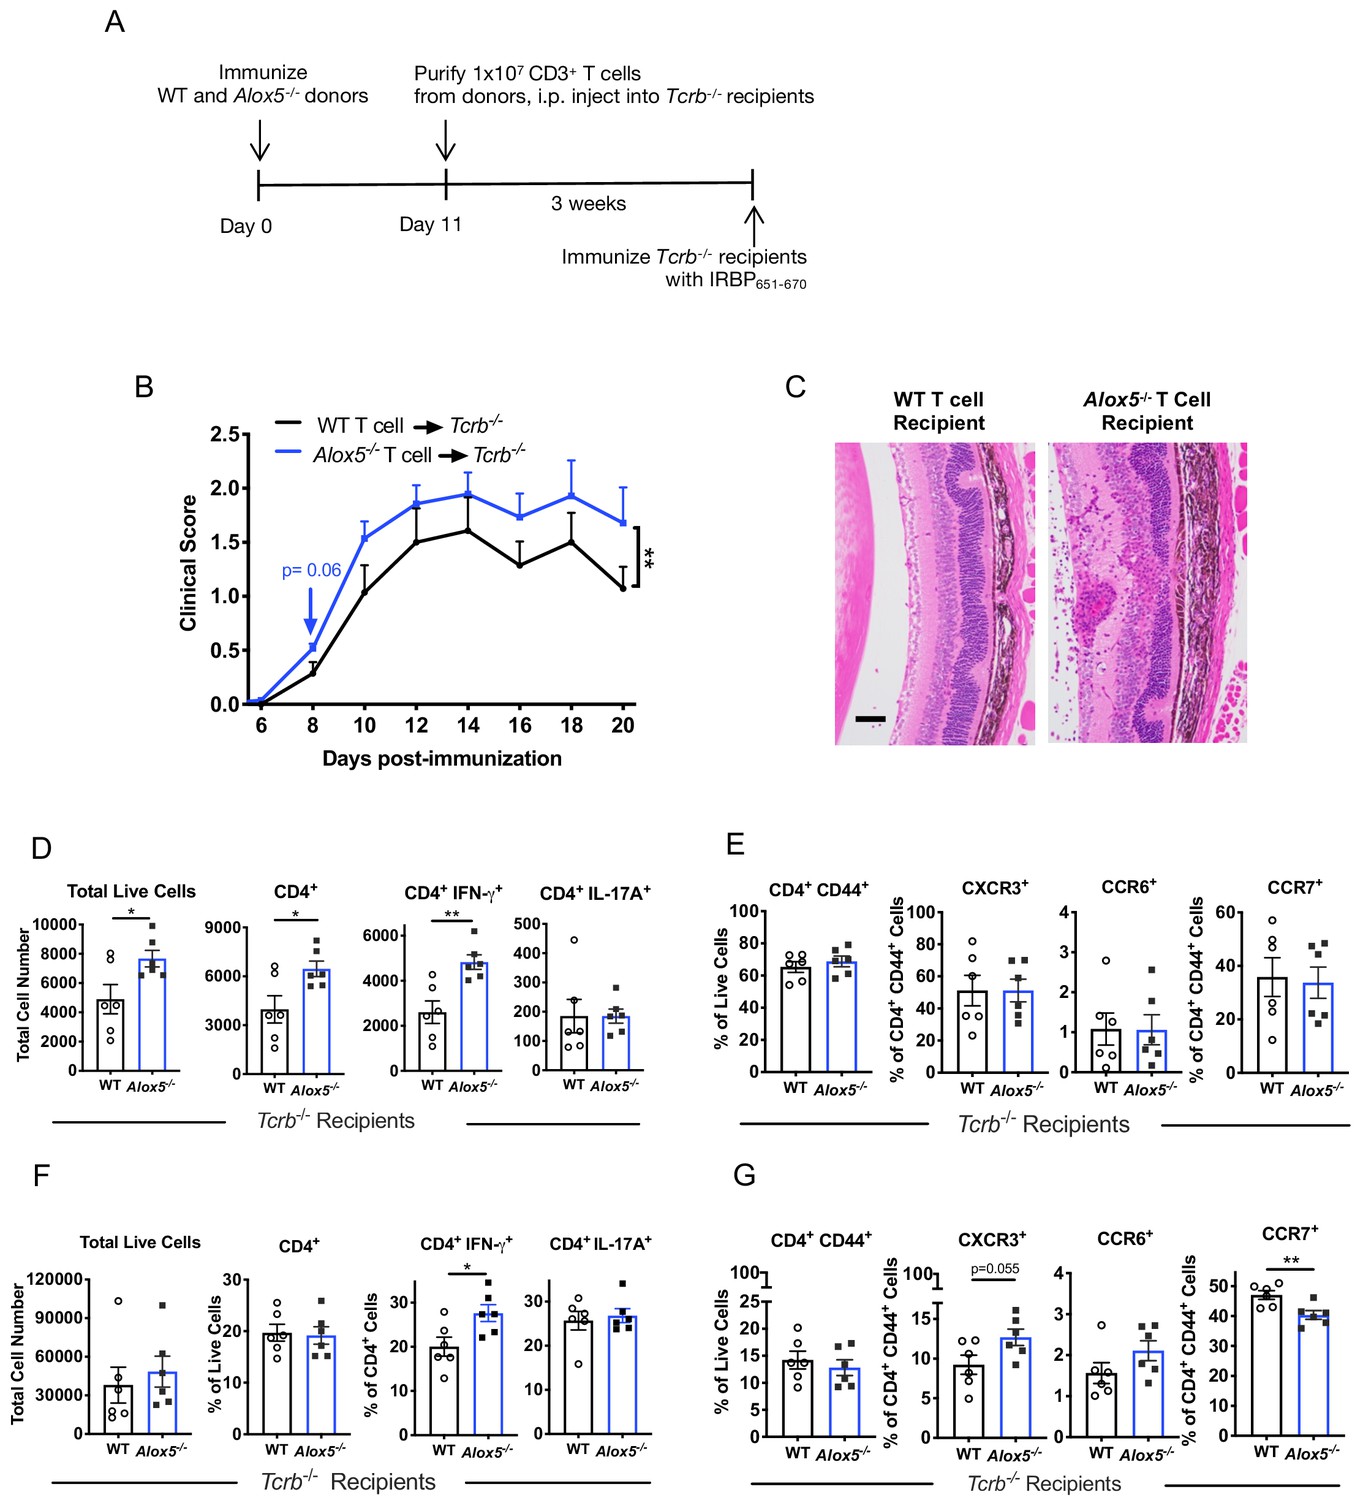
Disease limiting effect of LXA4 is T cell-mediated.
(A) Scheme of T cell transfer. Following EAU induction, 1 × 10⁷ CD3+ T cells were enriched from inguinal lymph nodes and spleens of WT or Alox5-/- mice and injected i.p. into TCRb-/- mice. (B) Fundoscopy scores of WT or Alox5-/- T cell-transferred TCRb-/- recipients immunized with EAU, n = 6 mice per group. (C) Representative H and E histology of the posterior segment of the eye from TCRb-/- recipients of WT or Alox5-/- T cells, scale bar = 50 µm. (D, F) Flow cytometry analysis of total numbers of live cells and frequencies of CD4+ T cell populations producing IFN-γ or IL-17A in (D) eyes and (F) inguinal lymph nodes of WT and Alox5-/- T cell recipients, n = 6 per group. (E, G) Flow cytometry analysis of chemokine receptor expression on activated CD4+ T cells in (E) eyes and (G) inguinal lymph nodes of TCRb-/- recipients of WT and Alox5-/- T cells, n = 6 per group. *p<0.05, **p<0.01, Wilcoxon matched-pairs signed rank test and unpaired Welch’s t test.
Figure 5—figure supplement 1
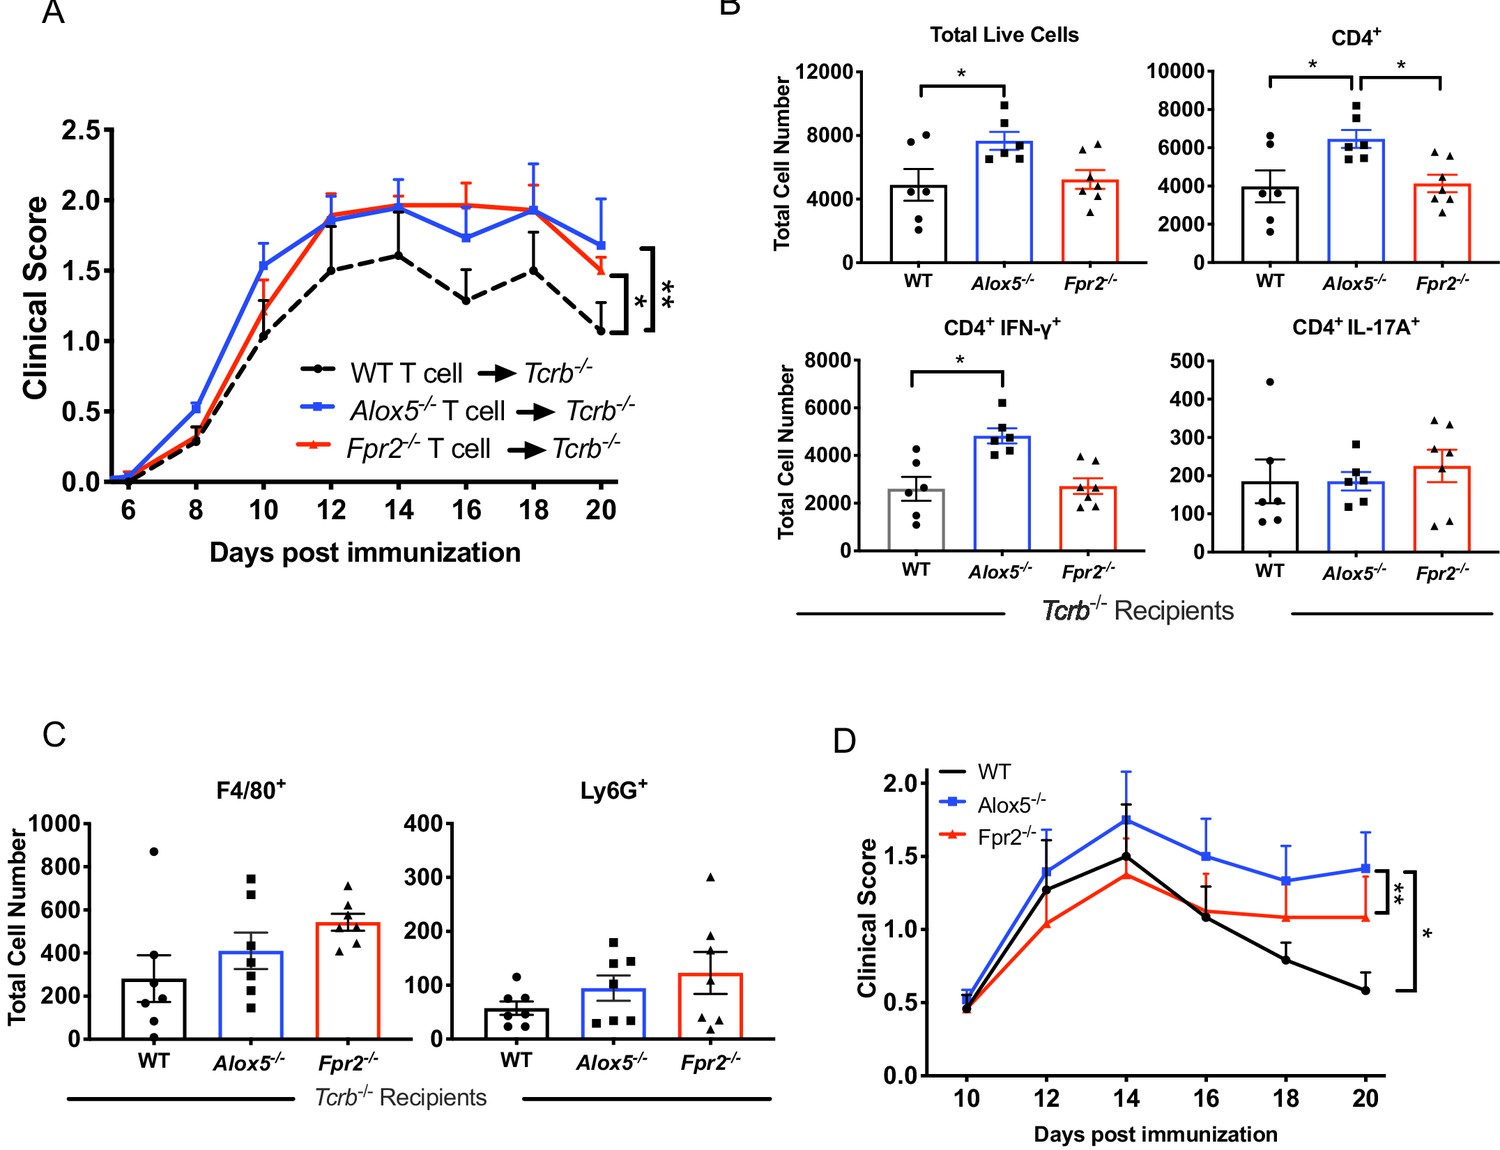
Fpr2-/- T cells amplify EAU pathogenesis.
(A) Fundoscopy scores of WT, Alox5-/- or Fpr2-/- T cell-transferred TCRb-/- recipients immunized for EAU, n = 6 mice per group. (B) Flow cytometry analysis of total number of live cells and frequencies of CD4+ T cell populations producing IFN-γ or IL-17A in the eyes of WT, Alox5-/- and Fpr2-/- T cell recipients, n = 6 per group. (C) Flow cytometry analysis of macrophage (F4/80+) or neutrophil (Ly6G+) populations in the eyes of WT, Alox5-/- and Fpr2-/- T cell recipients, n = 6 per group. *p=0.05, **p<0.01, Wilcoxon matched-pairs signed rank test and One-way ANOVA. (D) Fundoscopy scores of WT, Fpr2-/-, and Alox5-/- mice immunized with 150 μg of IRBP651-670. n = 6 per group, one representative experiment out of three.
Figure 6
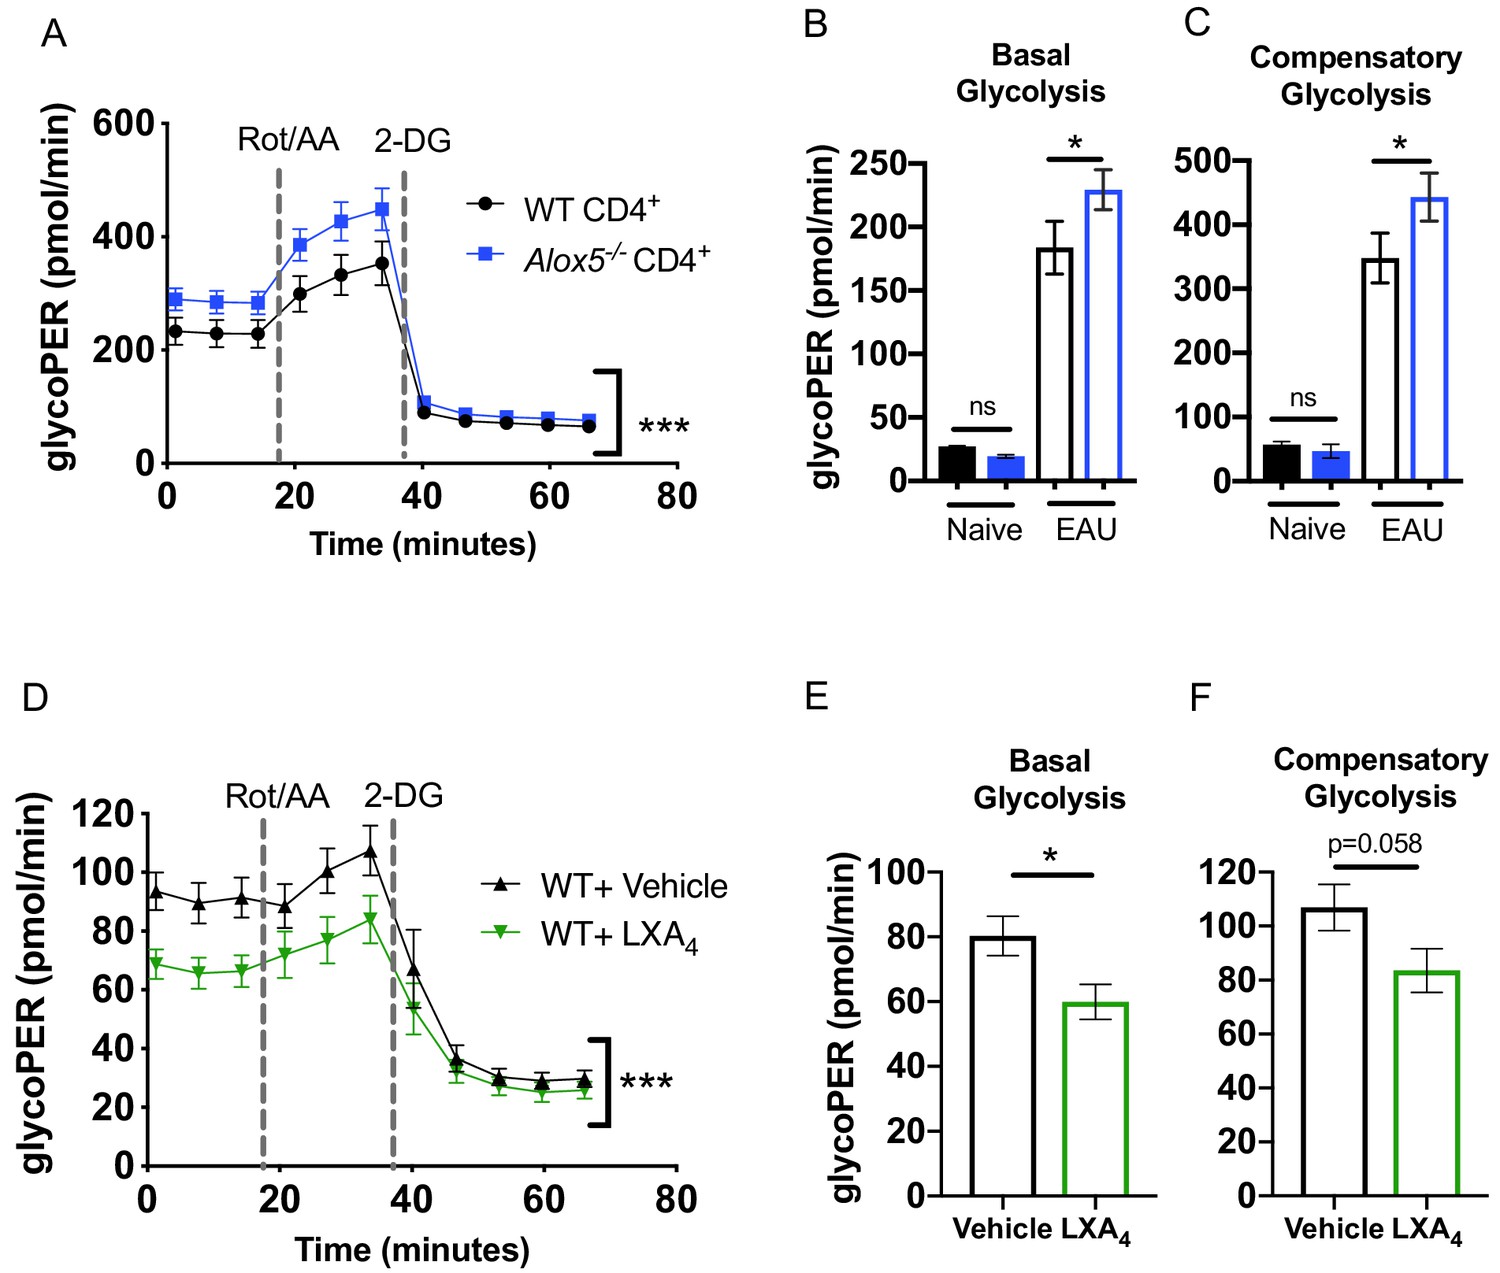
The LXA4 pathway regulates effector function and metabolism of CD4+ T cells.
Inguinal lymph nodes and spleens were harvested from EAU-challenged WT and Alox5-/- mice on day 13 post-immunization. (A) CD4+ T cells isolated from immunized WT and Alox5-/- mice were stimulated with anti-CD3 and anti-CD28 antibodies for 18 hr then subjected to glycolytic rate assay by Seahorse analyzer, n = 12 mice per group. (B–C) Bar graphs of (B) basal glycolysis and (C) compensatory glycolysis from the glycolytic rate assay in (A). (D) WT CD4+ T cells isolated from immunized WT and Alox5-/- mice were pretreated with vehicle or LXA4 in vitro and stimulated with anti-CD3 and anti-CD28 antibodies for 18 hr then subjected to glycolytic rate assay by Seahorse analyzer, n = 11 mice per group. (E–F) Bar graphs of (E) basal glycolysis and (F) compensatory glycolysis from the glycolytic rate assay in (D). *p<0.05, ***p<0.001, Wilcoxon matched-pairs signed rank test and Mann-Whitney test.
Author response image 1

Stimulation index of proliferation assays from A) vehicle vs LXA4 treated EAU-challenged mice, p= 0.0154 and B) WT vs Alox5-/- EAU-challenged mice, p= 0.0248.
Two-way ANOVA.
Author response image 2
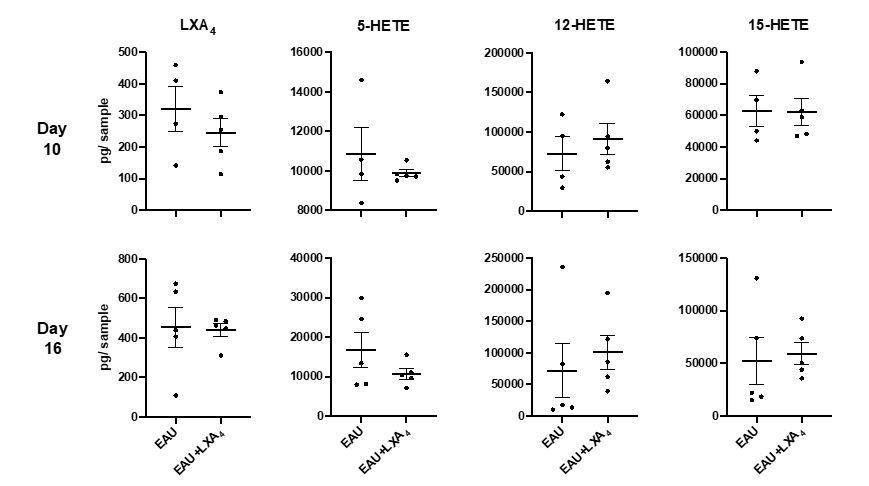
Quantification of LXA4 in EAU-challenged mice treated with LXA4 or vehicle control.
LXA4, 5-HETE, 12-HETE, 15-HETE in pg per sample in inguinal lymph nodes of EAU-challenged mice harvested on day 10 and day 16 post-immunization, quantified by LC-MS/MS. n=4-5 per group.
Additional files
-
Supplementary file 1
Key Resources Table.
- https://cdn.elifesciences.org/articles/51102/elife-51102-supp1-v2.docx
-
Transparent reporting form
- https://cdn.elifesciences.org/articles/51102/elife-51102-transrepform-v2.pdf
Download links
A two-part list of links to download the article, or parts of the article, in various formats.
Downloads (link to download the article as PDF)
Open citations (links to open the citations from this article in various online reference manager services)
Cite this article (links to download the citations from this article in formats compatible with various reference manager tools)
A novel role for lipoxin A4 in driving a lymph node–eye axis that controls autoimmunity to the neuroretina
eLife 9:e51102.
https://doi.org/10.7554/eLife.51102


