Selectivity to approaching motion in retinal inputs to the dorsal visual pathway
- Graduate Program in Neuroscience, University of Washington, United States
- Department of Ophthalmology, University of Washington, United States
- Vision Science Center, University of Washington, United States
Figures
Figure 1
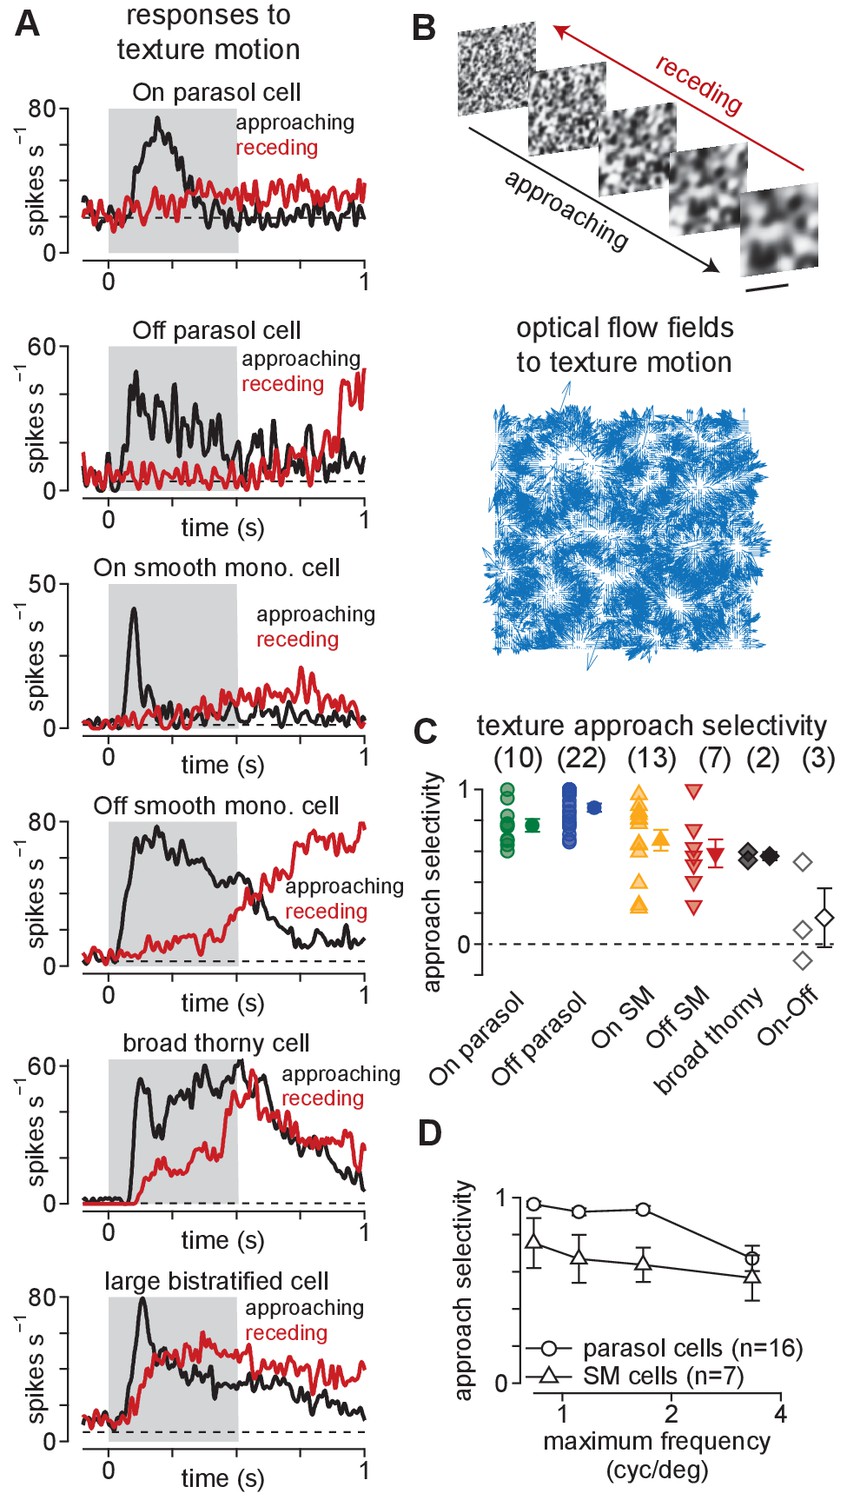
Ganglion cells exhibit a preference for approaching textures.
(A) Responses of several ganglion cell types to receding (red) and approaching (black) Gaussian textures. Average spike rate is shown across 50–200 distinct randomly generated textures. The gray region indicates the period of motion. (B) Example of receding and approaching texture stimuli used in the experiments (top). Scale bar indicates 0.5 mm. Bottom, Optical flow fields computed from an example approaching texture movie. White areas show regions from which the texture expanded during the stimulus sequence. (C) Approach selectivity index values for cell types in (A) to the texture stimuli. Transparent shapes indicate individual cells. Opaque shapes and error bars indicate mean ± SEM. (D) Approach selectivity (y-axis) as a function of the initial spatial frequency (x-axis) in parasol (n = 16) and smooth monostratified ganglion cells (n = 7). Approach selectivity persisted at all spatial frequencies tested.
-
Figure 1—source data 1
Included is a data file containing a structure for the approach selectivity data in Figure 1.
- https://cdn.elifesciences.org/articles/51144/elife-51144-fig1-data1-v2.mat
Figure 2
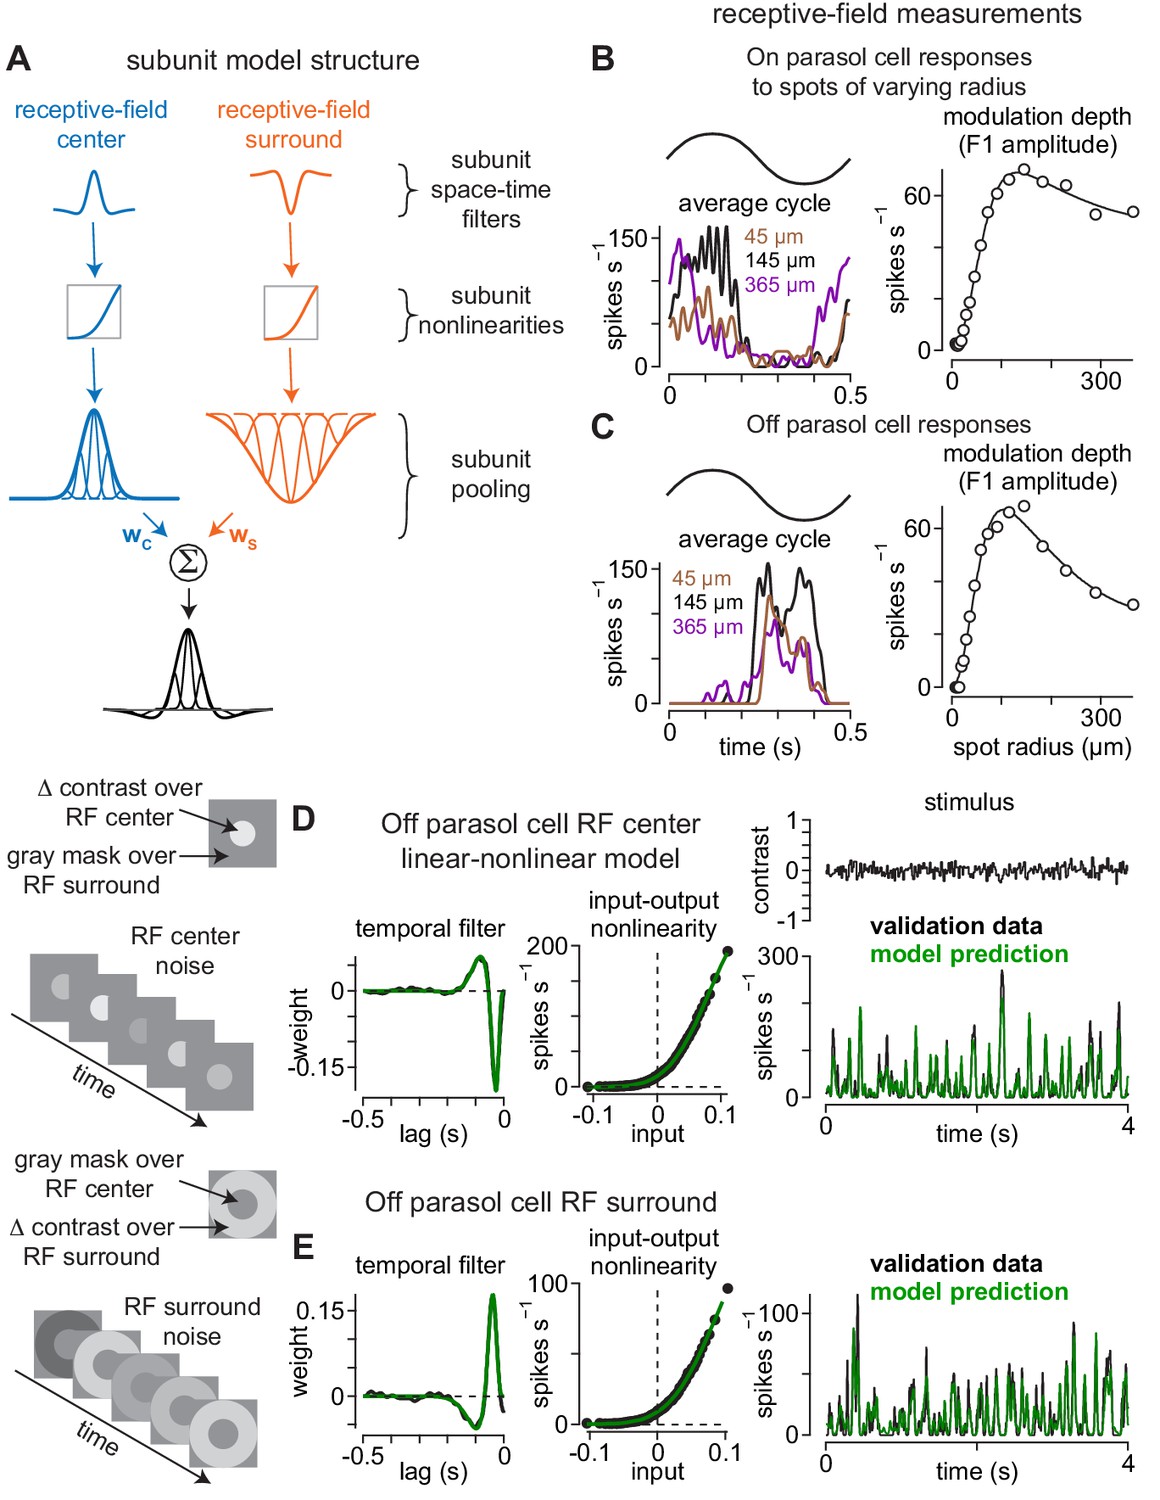
Direct measurement of spatiotemporal receptive-field model parameters.
(A) Model architecture. Center (left) and surround (right) regions of the receptive field were comprised of subunits. Subunits also exhibited center-surround receptive field structures based on published measurements. Following spatiotemporal filtering, signals were passed through a static input-output nonlinearity after which they were normalized and integrated at the level of model ganglion cells. (B) The sizes and weightings of center (wC) and surround (wS) inputs to the model ganglion cells in (A) were calculated by recording spike responses to spots presented over an On parasol ganglion cell’s receptive field. Spot contrast (0.5) was modulated sinusiodally at 2 Hz and spot radius varied on each trial. The modulation depth (F1 amplitude) of the average cycle was largest at 145 μm (left) and fell off at smaller and larger radii (right). Solid line shows difference-of-Gaussians fit to the data (right). (C) Same as (B) for an Off parasol cell. (D–E) The temporal lag between center (D) and surround (E) regions of the receptive field was measured using a Gaussian flicker stimulus. On each frame, the contrast of either a spot (center condition) or annulus (surround condition) was drawn randomly from a Gaussian distribution with a mean of 0.0 and a standard deviation of 0.1. Temporal filters were determined by cross-correlating the cell’s spike output with the stimulus sequence (left) and the temporal lag between center and surround was determined from the time-to-peak of these filters. Middle, Input-output nonlinearities were determined for the center and surround noise. Right, Unique contrast sequences were interleaved with repeated sequences. The repeated sequences were not used in computing the temporal filters, but were used to cross-validate the model. The average response to the repeated sequences (black) showed high correspondence to the model prediction (green).
Figure 3

Approach selectivity to moving textures predicted from nonlinear receptive-field subunits.
(A) Normalized outputs of linear subunit models to 500 textures that either approached or receded at five different rates. Approaching and receding motion was not distinguishable at any rate for either the On or the Off subunit models. (B) Outputs of models containing nonlinear subunits. Adding a nonlinearity at the model bipolar cell output produced selectivity for approaching textures at all expansion rates. Error bars indicate mean ± SEM.
Figure 4
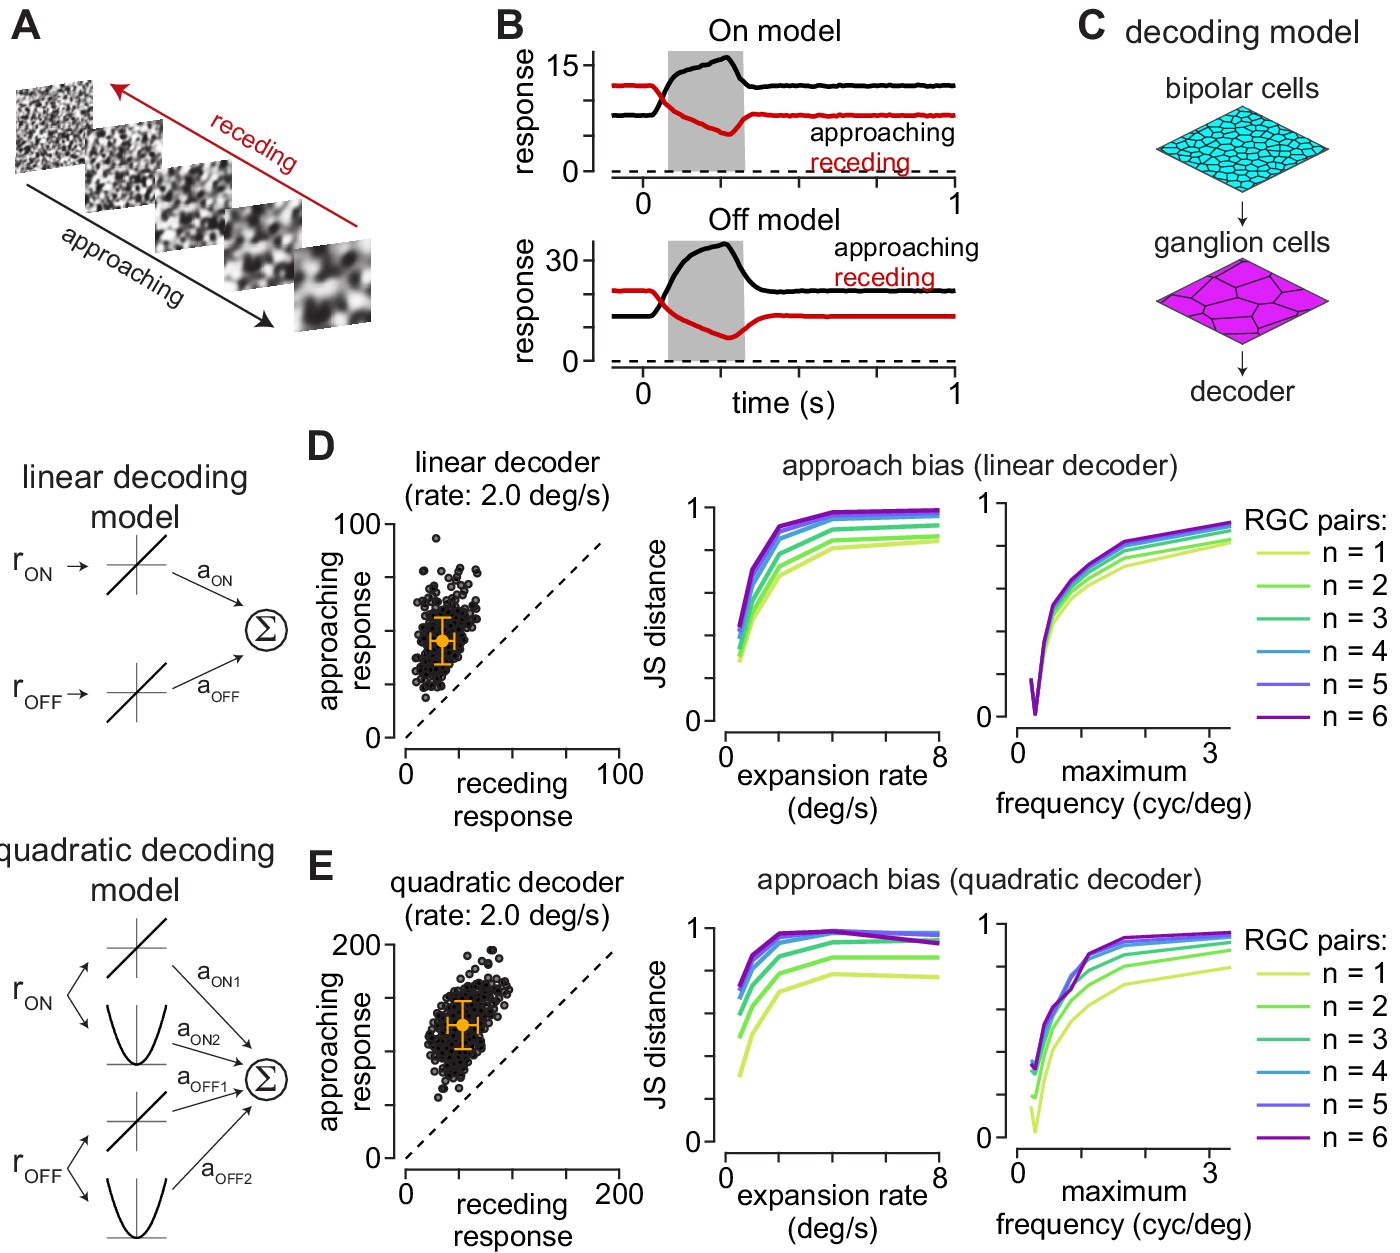
Computational model predicts selectivity for approaching textures.
(A) Example approaching and receding textures. The same texture sequence was presented from highest-to-lowest spatial frequency (approaching) or lowest-to-highest spatial frequency (receding). Models were run on 500 unique texture sequences at five different expansion rates. (B) Average responses of On (top) and Off models (bottom) to 500 textures that approached or receded at 2.0 degree s–1. (C) Basic organization of decoding models. Model bipolar cells provided input to ganglion cell mosaic which, in turn, provided input to the decoder. (D) The output of the linear decoding model was the weighted sum of the outputs from the On and Off models. The model produced larger outputs for approaching than receding motion for each of the textures, shown as individual circles (left). Jensen-Shannon distance values computed between the distributions for approaching and receding textures at five expansion rates (middle). This approach bias persisted across a range of expansion rates and was highest at higher rates. Lines are color coded for the number of ganglion cells combined by the decoder. Right, Jensen-Shannon distance (y-axis as function of the maximum spatial frequency in the moving textures (x-axis). Discriminability of the approaching textures persisted across a broad range of spatial frequencies and fell off when spatial frequency content was very low (<0.3 cycles degree–1). (E) Same as (D) for the quadratic decoding model.
Figure 5 with 2 supplements
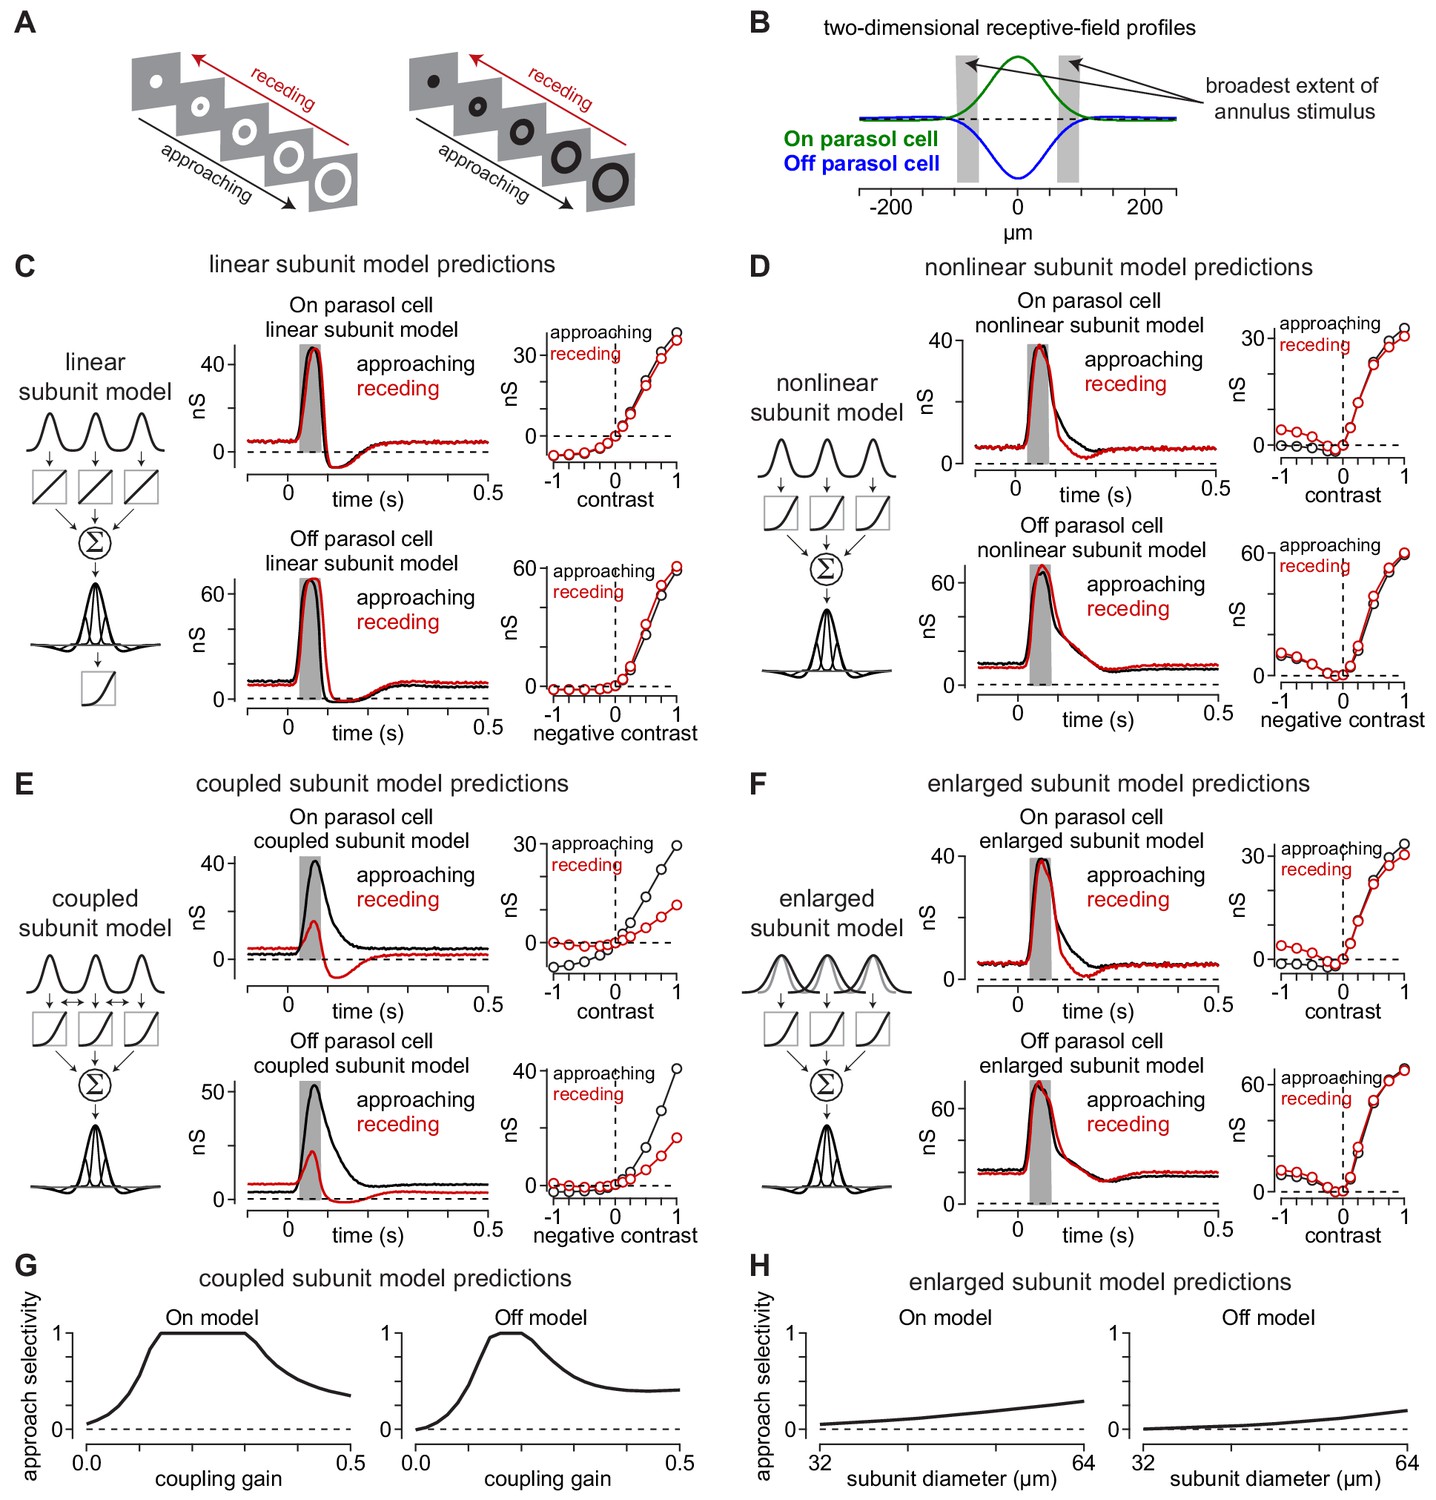
Canonical receptive-field models predict a lack of approach selectivity.
(A) Stimulus paradigm for approaching and receding annuli. Annuli either rapidly increased in radius (approaching) or decreased in radius (receding). (B) Two-dimensional spatial receptive-field profiles used in the model. Values were determined directly from parasol cell recordings as shown in Figure 2. Gray regions indicate the widest extent of the moving annuli. (C) The linear subunit model was created in which subunit input was integrated linearly prior to a single nonlinearity at the ganglion cell output. Model parameters came directly from measurements of spatiotemporal receptive field properties. On and Off models predicted similar responses for both approaching and receding annuli. (D) A model in which the output of each subunit was passed through the output nonlinearity prior to integration at the level of the ganglion cell also predicted similar responses to approaching and receding annuli. The nonlinear subunit model also predicted similar responses in Off parasol cells to approaching and receding annuli of a given contrast. (E) Output of On and Off models with electrical coupling between bipolar cells. This models produced excitatory conductances that were biased toward approaching motion. (F) A model in which coupling between subunits was absent, but the subunit receptive-field sizes were enlarged to simulate lateral spread through gap junctions. Approach selectivity was absent from this model, indicating that the increase in subunit receptive-field size alone could not account for the approach selectivity observed in (E). (G) Approach selectivity index calculated for the On and Off cell coupled subunit models at a series of coupling gains. Approach selectivity was highest for gains of ∼0.1–0.4. (H) Approach selectivity for the enlarged subunit models calculated for a series of subunit diameters. Selectivity was relatively low even at large diameters.
-
Figure 5—source code 1
Included is a MATLAB file containing code used to generate a simplified coupling model.
- https://cdn.elifesciences.org/articles/51144/elife-51144-fig5-code1-v2.m
Figure 5—figure supplement 1
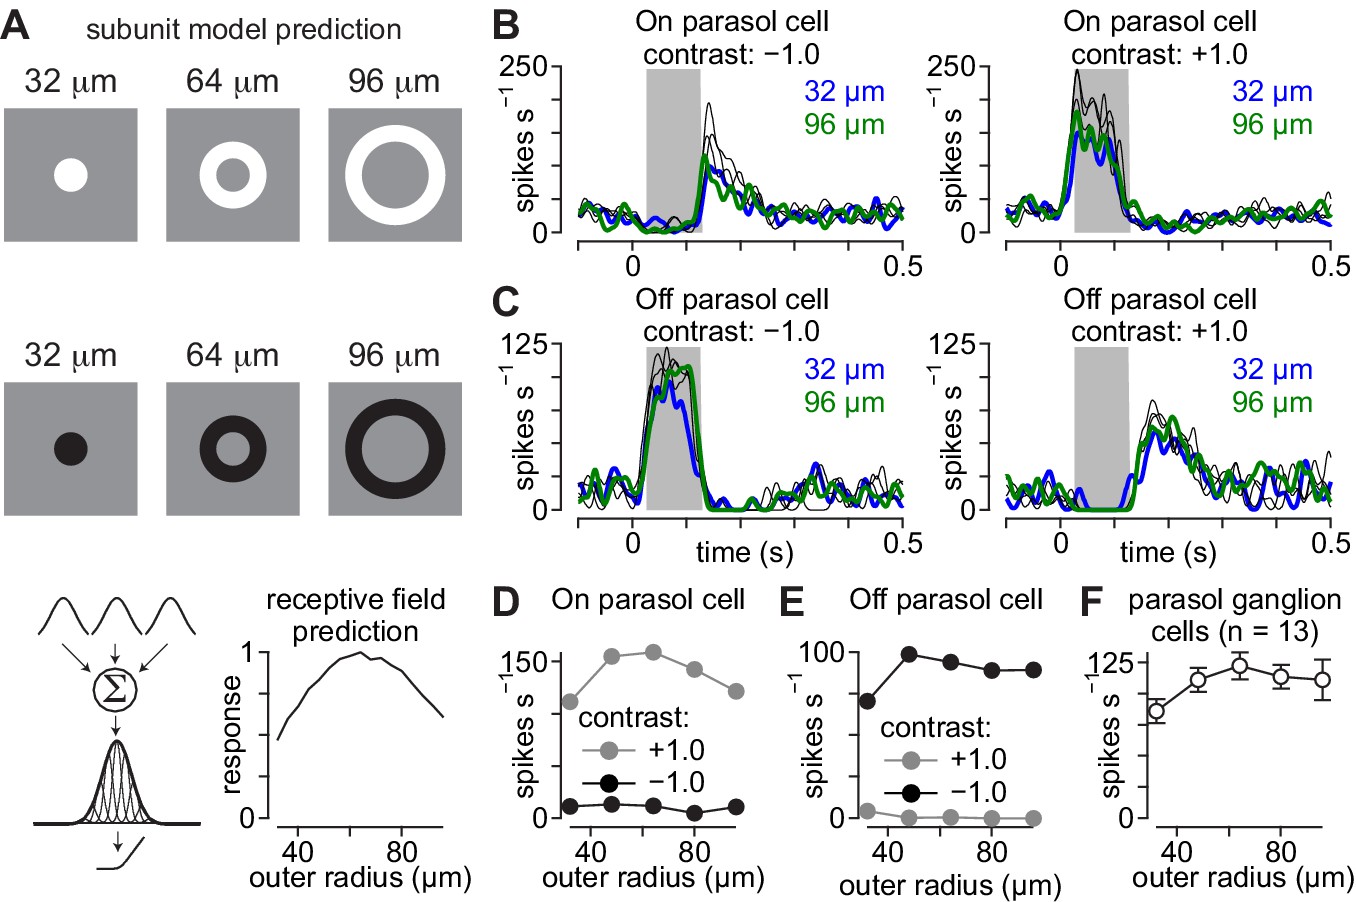
Parasol cell responses to briefly flashed annuli.
Receptive-field models predict symmetrical responses to briefly presented annuli. (A) Average spike rate of an On parasol cell across a single cycle of a 2 Hz sinusoidally modulated spot at different spot radii (left). The spike rate modulation as a function of spot radius was well fit with a difference-of-Gaussians model (right). (B) Same as (A) for an Off parasol cell. (C) Example flash stimuli presented to On and Off parasol cells. Annuli were presented with five different outer diameters between 32–96 µm (duration, 0.1 s). The difference between the inner and outer radius was fixed at 32 μm for all annuli. Example annuli are shown for bright (+1.0; top) and dark contrasts (–1.0; middle). Predicted output is shown for a Gaussian receptive field with linear spatial integration (bottom). (D) Spike responses recorded to annuli of varying outer radii in an On parasol ganglion cell. (E) Same as (D) for an Off parasol ganglion cell. (F) Average spike rate elicited as a function annulus outer radius for the On parasol cell in (A). (G) Same as (F) for the Off parasol cell in (E). (H) Average spike rate as a function of annulus outer radius for eight parasol cells. Responses are shown for preferred contrast annuli. Error bars indicate mean ± SEM.
Figure 5—video 1
Movie illustrating model subunit activations during the annulus stimulus paradigm.
Figure 6 with 1 supplement
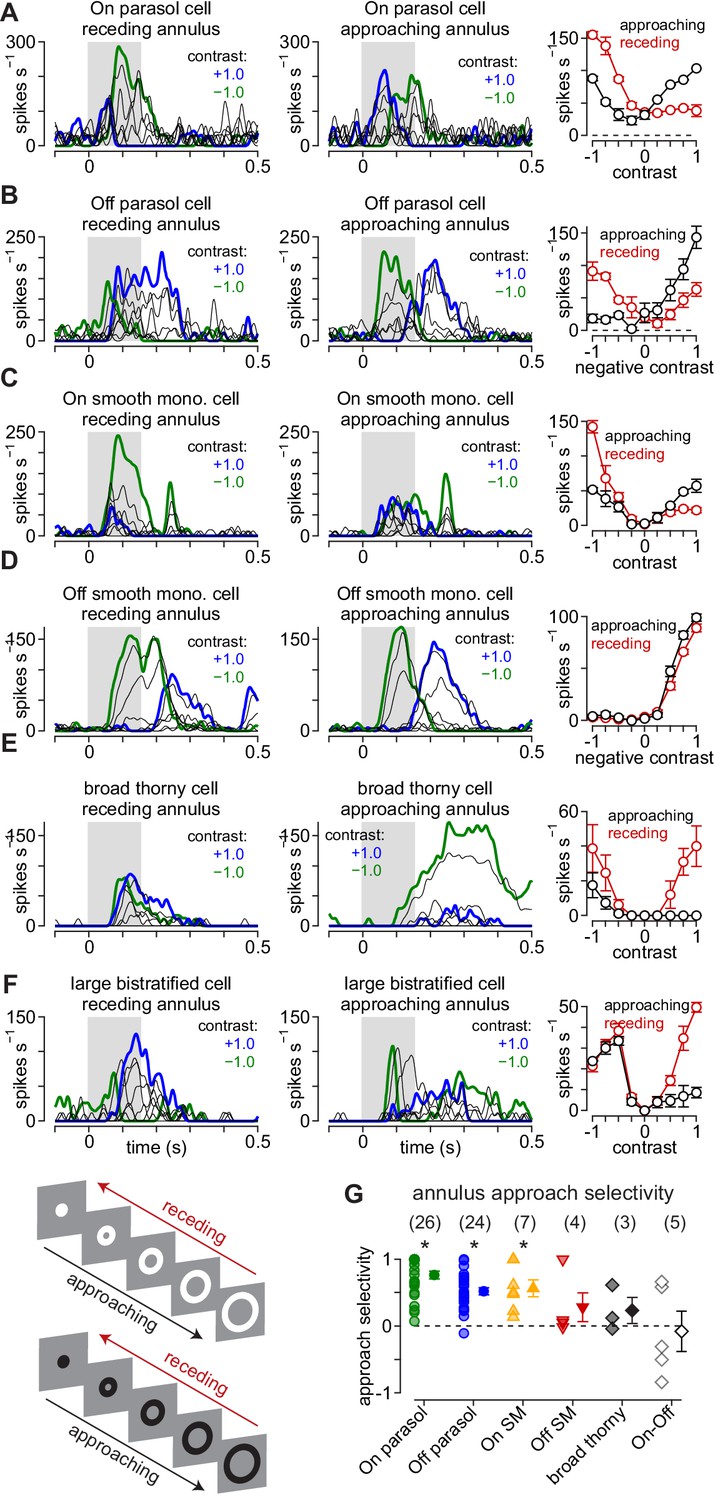
Approach motion selectivity for moving annuli.
(A) Spike responses in an On parasol ganglion cell to receding (left) and approaching (middle) annuli presented at a series of contrasts. Right, Average spike rate during movement of receding (red) and approaching (black) annuli as a function of stimulus contrast. (B–F) Same as (A) for Off parasol (B), On smooth monostratified (C), Off smooth monostratified (D), broad thorny (E), and large bistratified ganglion cells (F). (G) Approach sensitivity index values for the stimulus paradigm. Transparent shapes indicate individual cells. Opaque shapes and error bars indicate mean ± SEM. Asterisks indicate statistically significant values, determined using the Wilcoxon signed rank test.
-
Figure 6—source data 1
Included is a data file containing a structure for the approach selectivity data in annulusspikes.
- https://cdn.elifesciences.org/articles/51144/elife-51144-fig6-data1-v2.mat
Figure 6—figure supplement 1

Ganglion cell responses to moving spots.
Asymmetric response patterns to approaching and receding spots. (A) Spike responses in an On parasol ganglion cell to receding (left) and approaching (middle) spots presented at a series of contrasts. Right, Average spike rate during movement of receding (red) and approaching (black) spots as a function of stimulus contrast. (B–F) Same as (A) for Off parasol (B), On smooth monostratified (C), Off smooth monostratified (D), broad thorny (E), and large bistratified ganglion cells (F). (G) Stimulus paradigm for approaching and receding spots. (H) Approach sensitivity index values for the spot stimulus paradigm. The x-axis and y-axis show approach sensitivity values for bright and dark spot contrasts, respectively. Transparent shapes indicate individual cells. Opaque shapes and error bars indicate mean ± SEM.
Figure 7 with 1 supplement
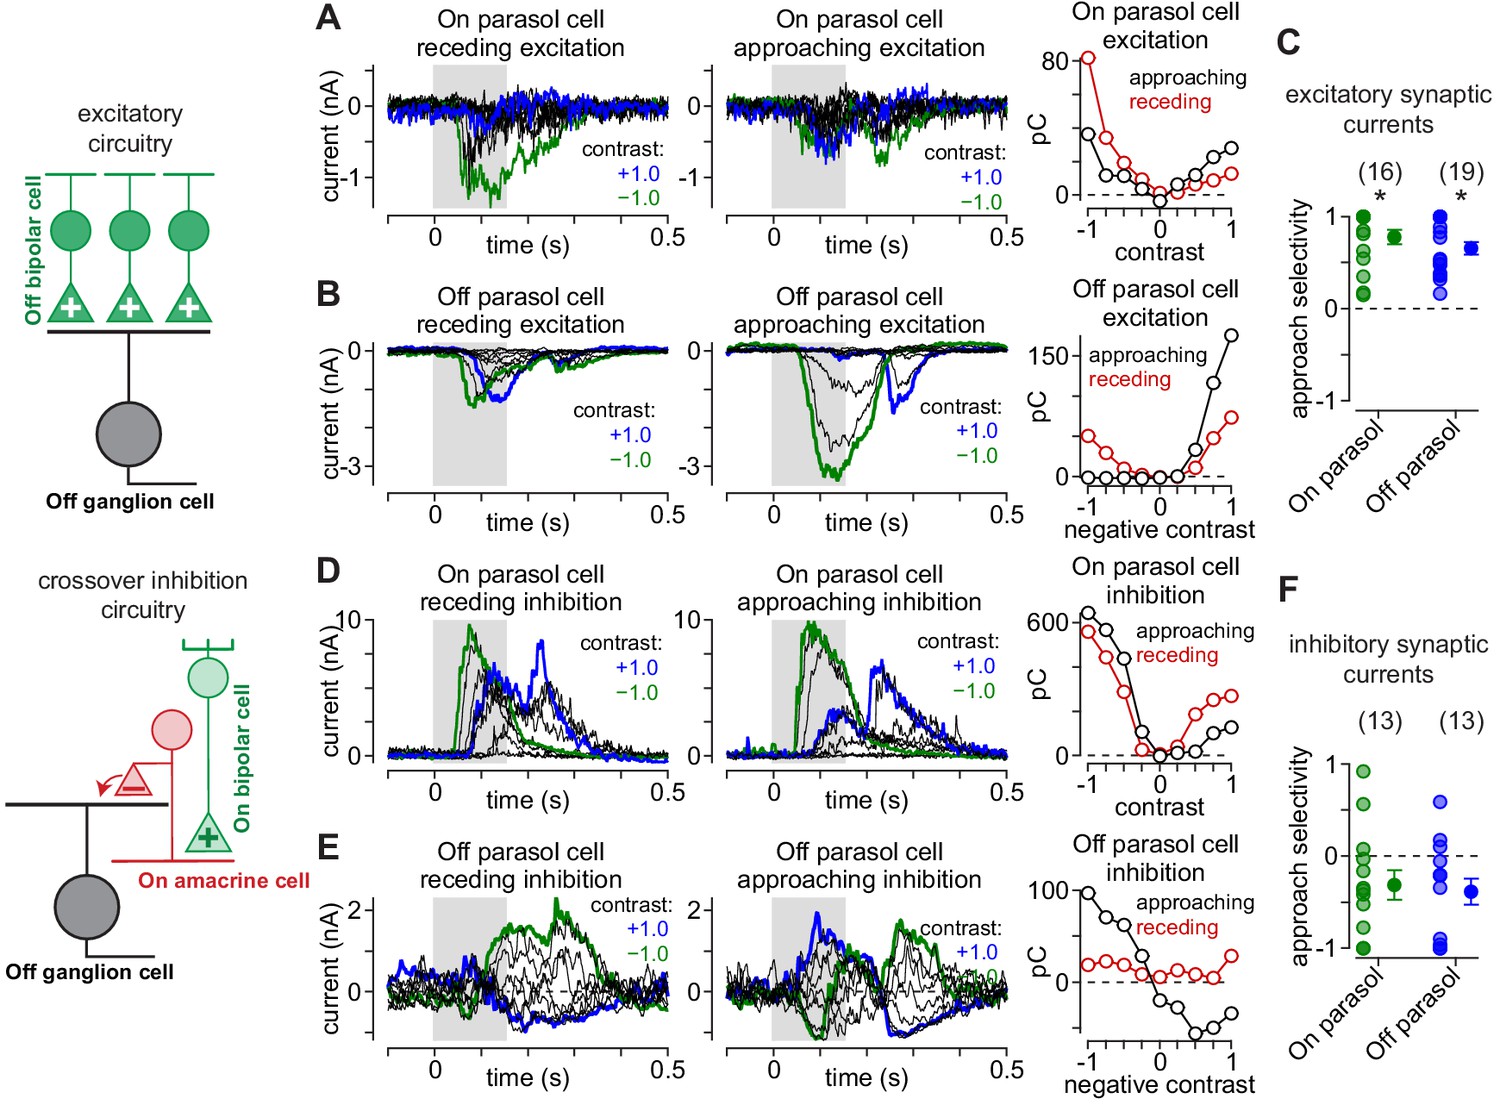
Asymmetrical synaptic input patterns underlie approach motion selectivity.
(A) Excitatory synaptic currents measured in an On parasol ganglion cell to receding (left) and approaching (middle) annuli presented at a series of contrasts. Right, Excitatory charge during movement of receding (red) and approaching (black) spots as a function of stimulus contrast. (B) Same as (A) for an Off parasol cell. (C) Approach selectivity index for excitatory synaptic currents for On (green) and Off parasol cells (blue). Individual cells are shaded; solid circles indicate mean ± SEM. (D) Inhibitory synaptic currents measured in an On parasol ganglion cell to receding (left) and approaching (middle) annuli presented at a series of contrasts. Right, Inhibitory charge as a function of contrast in the On cell. (E) Same as (D) for the Off parasol cell. (F) Approach selectivity index for inhibitory synaptic currents for On (green) and Off parasol cells (blue). Individual cells are shaded; solid circles indicate mean ± SEM. Statistical significance is indicated with an asterisk and was determined using the Wilcoxon signed rank test.
-
Figure 7—source data 1
Included is a data file containing a structure for the approach selectivity data in currents.
- https://cdn.elifesciences.org/articles/51144/elife-51144-fig7-data1-v2.mat
Figure 7—figure supplement 1
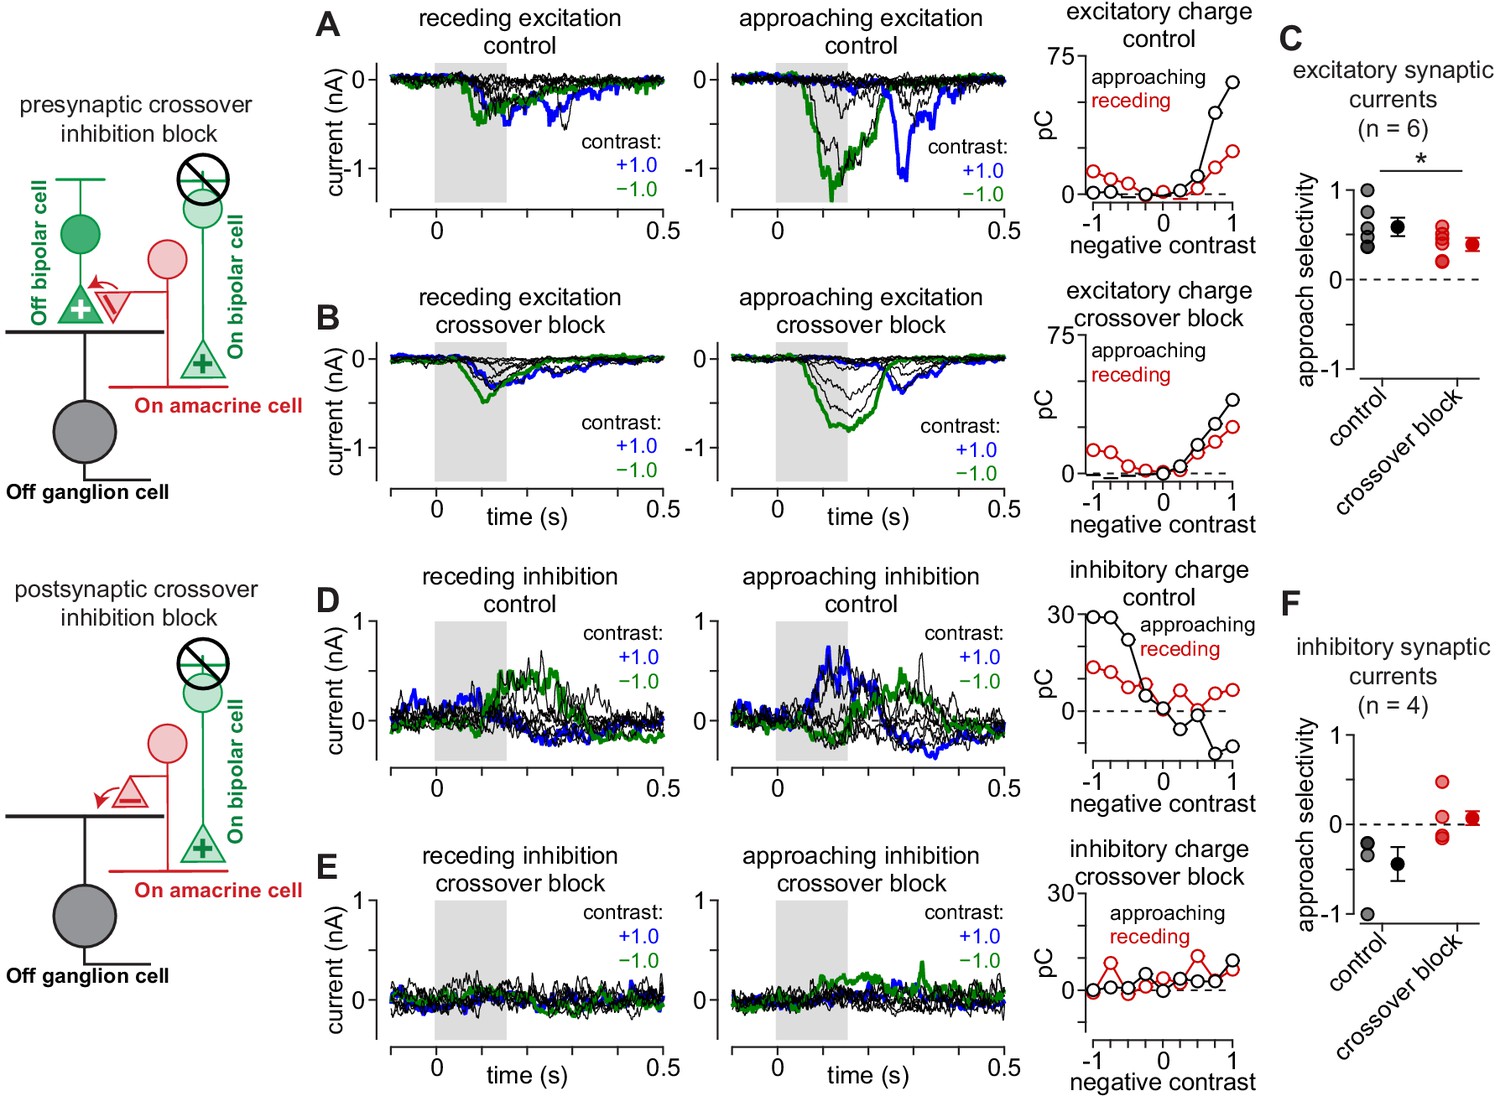
Crossover inhibition contributes to selectivity for approaching motion.
Crossover inhibition contributes to approach motion selectivity in Off parasol cells. (A) Excitatory synaptic currents to receding (left) and approaching (middle) annuli at a series of contrasts. Recordings were performed under control conditions. Right, Excitatory charge (in pC) measured to the receding (red) and approaching (black) annuli for the shaded regions of the Off parasol cell recordings. (B) Excitatory currents recorded for cell in (A) following blockade of crossover inhibition. (C) Approach selectivity index for excitatory synaptic currents under control conditions (black) and with crossover inhibition blocked (red). Individual cells are shaded (n = 6 cells); solid circles indicate mean ± SEM. (D) Inhibitory synaptic currents recorded under control conditions for the cell in (A). Right, Inhibitory charge for the shaded regions. (E) Inhibitory synaptic currents from the cell in (A) recorded with crossover inhibition blocked. Blocking crossover strongly suppressed direct inhibitory input to the cell. Right, Inhibitory charge measured during the shaded regions. (F) Approach selectivity index for inhibitory synaptic currents under control conditions (black) and with crossover inhibition blocked (red).
Appendix 1—figure 1
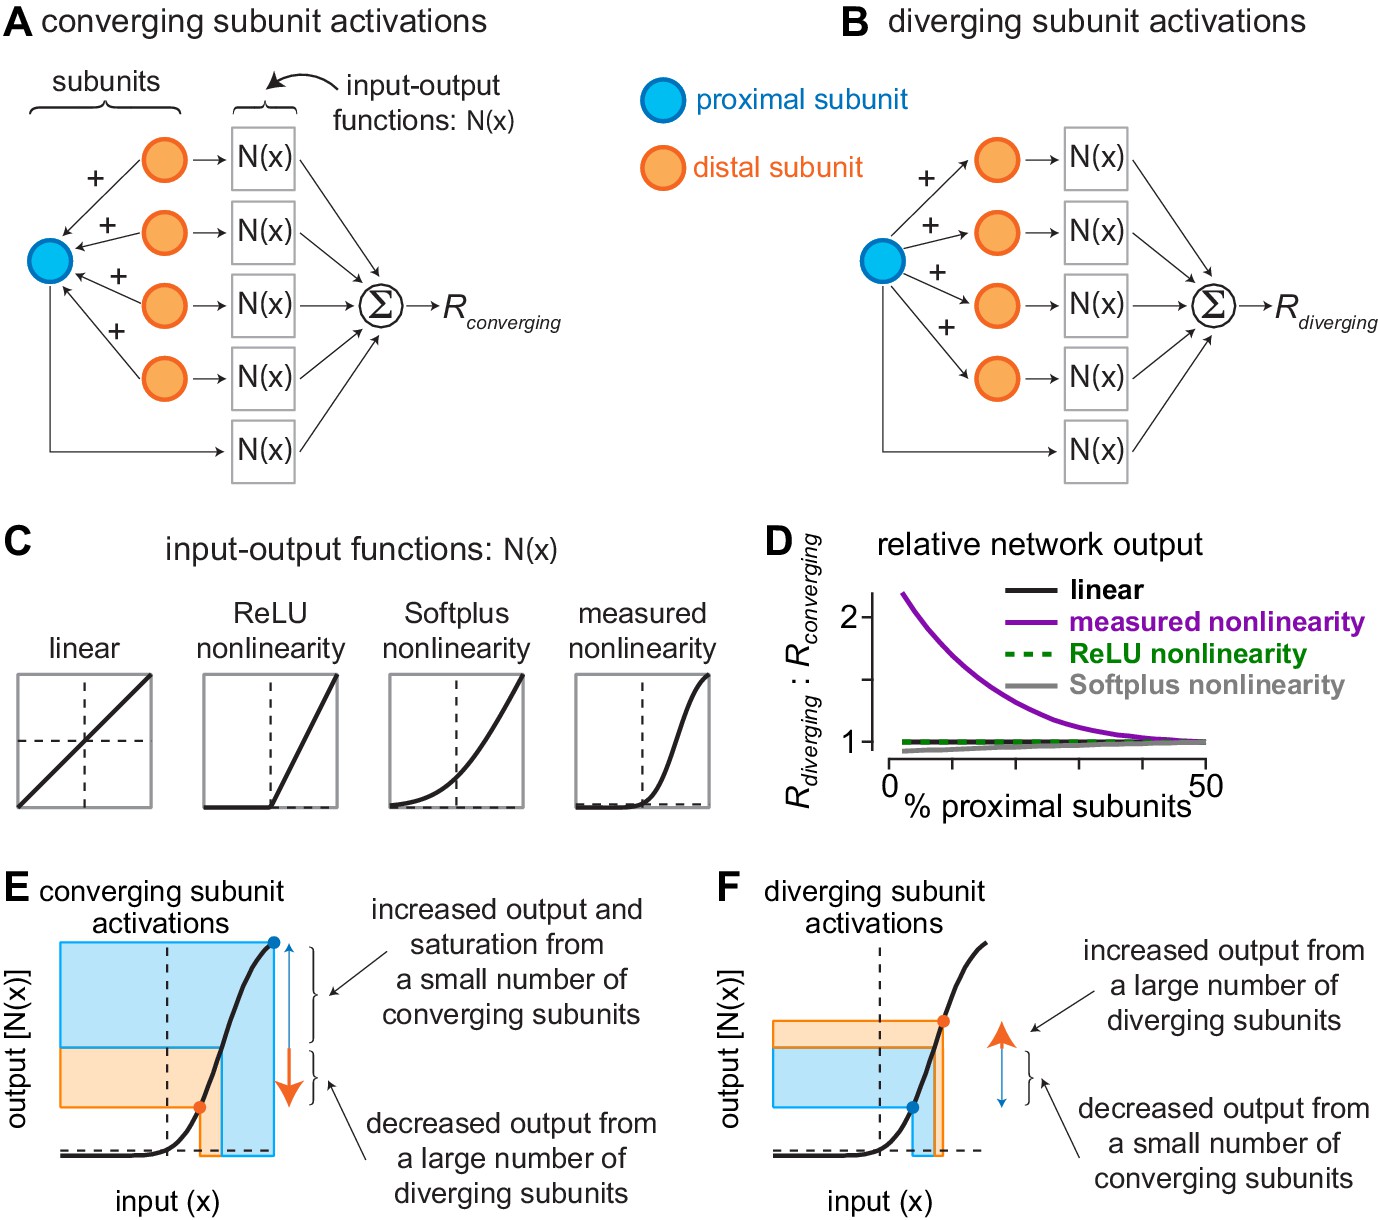
Current redistribution and nonlinearity shape determine network bias.
(A) Activation pattern for converging subunit network. Distal subunits (orange) imparted a portion of their input to proximal subunits (blue). Subunit inputs then pass through input-output functions prior to being summed as the converging response (). (B) Activation pattern for diverging subunit network in which proximal subunits impart a portion of their current to distal subunits. (C) Shapes of different input-output functions evaluated with the network model. (D) Ratio of outputs from diverging () and converging () activations (y-axis) as a function of the percentage of proximal subunits in the network (x-axis). The nonlinearity measured directly from excitatory synaptic inputs to parasol cells produced a large bias for diverging network activation when distal subunits outnumbered proximal subunits by 3:1. (E–F) Contributions of nonlinearity shape to output bias of subunit networks. (E) During convergent activation, the numerical mismatch between proximal and distal subunits and the shape of the input-output nonlinearity drives the small number of proximal subunits to saturating regions of the output curve, whereas the large number of distal subunits decrease their outputs. This results in a relatively small network output (). (F) During divergent activation, a small number of distal subunits are suppressed while a large number of distal subunits are potentiated, causing the network output to increase ().
Additional files
Download links
A two-part list of links to download the article, or parts of the article, in various formats.
Downloads (link to download the article as PDF)
Open citations (links to open the citations from this article in various online reference manager services)
Cite this article (links to download the citations from this article in formats compatible with various reference manager tools)
Selectivity to approaching motion in retinal inputs to the dorsal visual pathway
eLife 9:e51144.
https://doi.org/10.7554/eLife.51144


