Eya2 promotes cell cycle progression by regulating DNA damage response during vertebrate limb regeneration
- Department of Stem Cell and Regenerative Biology, Harvard University, United States
- The Allen Discovery Center at Tufts University, United States
- Department of Orthopedic Surgery, United States
- Department of Molecular and Cellular Biology, Harvard University, United States
- Department of Biology, Tufts University, United States
- The Harvard Stem Cell Institute, United States
- The Broad Institute of MIT and Harvard, United States
Figures
Figure 1 with 3 supplements
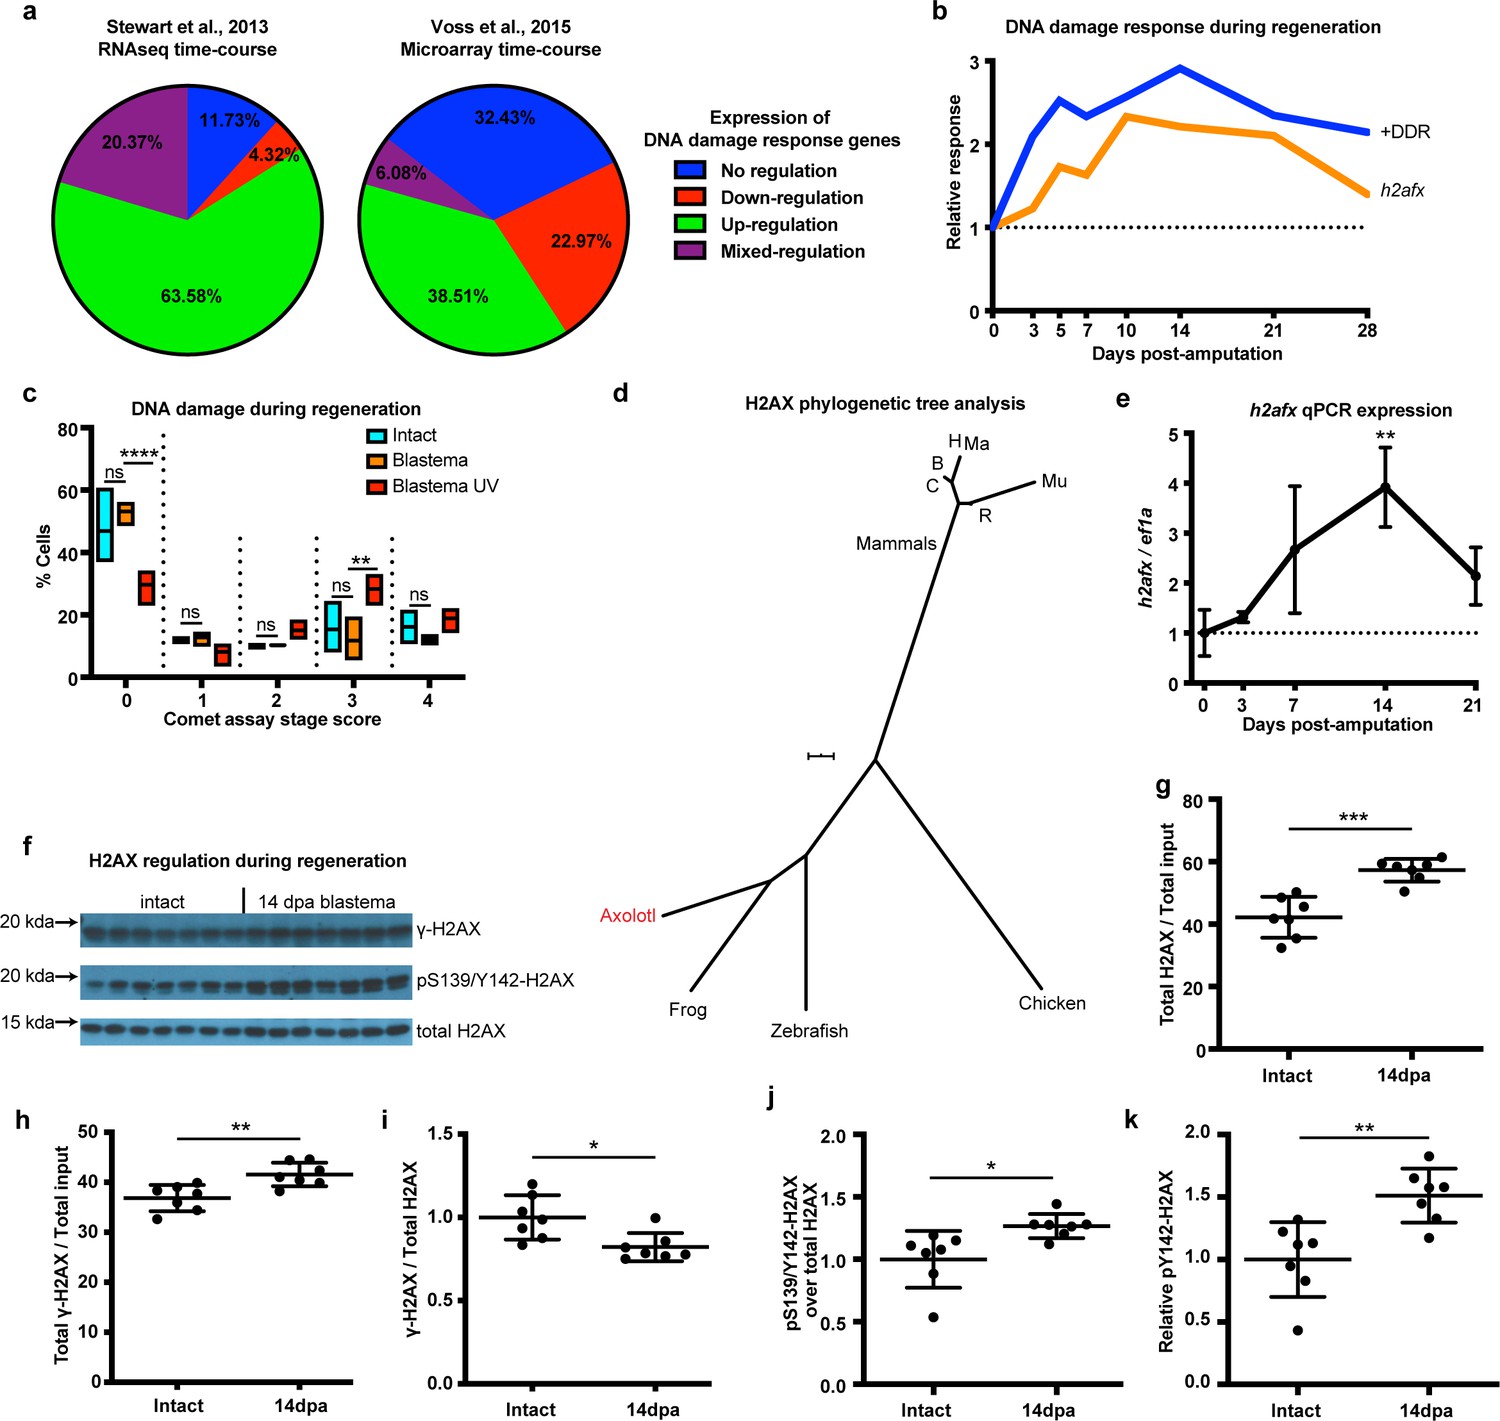
DNA damage response is elevated during limb regeneration and is associated with regulation of H2AX phosphorylation status.
(a) Regulation of DNA damage response (DDR) genes in two high-throughput gene expression datasets. The majority of these genes appeared up-regulated during limb regeneration (green area). See Materials and methods for regulation categories. (b) Relative gene expression changes of DNA damage response genes (+DDR) and h2afx during regeneration compared to intact. (c) Categories represent percent of cells in each comet assay stage score with stage 0 cells having no detectable DNA damage and stage four having the most. There is no statistical difference between intact (cyan) and blastema (orange) cells for the presence of DNA damage. Blastema cells treated with UV prior to comet assay were used as control and depict statistical significance compared to untreated blastema cells at stage 0 with less percent of cells (Two-way ANOVA with Bonferroni’s multiple comparisons test: p-value<0.0001) and at stage three with more percent of cells (p-value<0.01). The data indicates that there is no DNA damage accumulation during regeneration. (d) Phylogenetic tree analysis of axolotl H2AX sequence with other vertebrates. C: Canis, B: Bos, H: Human, Mu: Mus, Ma: Macaca, R: Rattus. Scale Bar: 0.01. (e) Validation of axolotl h2afx expression during limb regeneration using qPCR. (f) Western blot for H2AX and its phosphorylation status during regeneration. Quantification on (g, h, i, j, k). (g) Total H2AX levels in intact and 14 dpa blastema tissue normalized by the total protein input. There is up-regulation of H2AX total protein during regeneration (Unpaired t test, p-value<0.001). (h) Total γ-H2AX levels in intact and 14 dpa blastema tissue normalized by the total protein input. There is up-regulation of γ-H2AX total protein during regeneration (Unpaired t test, p-value<0.01). (i) Relative γ-H2AX levels in intact and 14 dpa blastema tissue normalized by the respective H2AX levels. There is down-regulation of relative γ-H2AX levels during regeneration (Unpaired t test, p-value<0.05). (j) Relative pS139/Y142-H2AX levels in intact and 14 dpa blastema tissue normalized by the respective H2AX levels. There is up-regulation of relative pS139/Y142-H2AX levels during regeneration (Unpaired t test, p-value<0.05). (k) Relative pY142-H2AX levels in intact and 14 dpa blastema tissue normalized by the respective H2AX levels. There is up-regulation of relative pY142-H2AX levels during regeneration (Unpaired t test, p-value<0.01). These data indicate that there is dynamic regulation of H2AX phosphorylation status during regeneration. ns denotes p-value>0.05, * denotes p-value<0.05, ** denotes p-value<0.01, *** denotes p-value<0.001, **** denotes p-value<0.0001. Vertical bars on plots represent standard error of the mean (SEM).
Figure 1—figure supplement 1
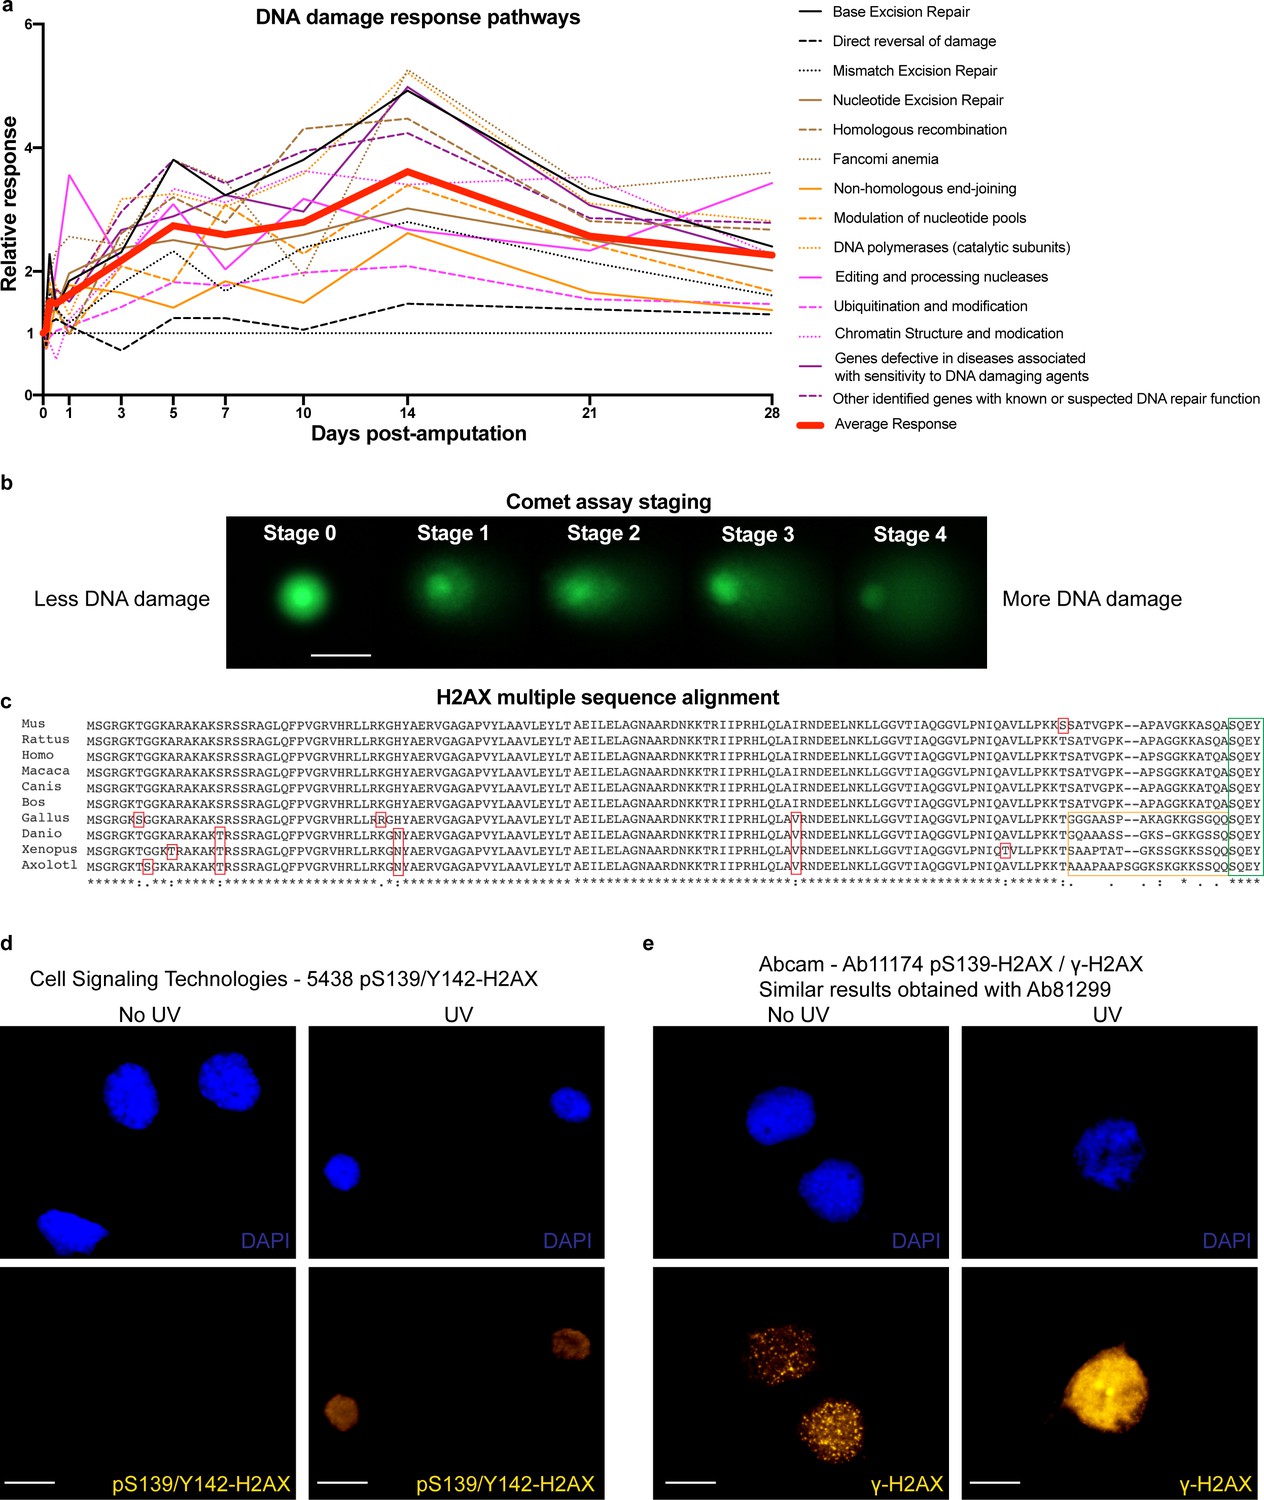
DDR pathways, comet assay staging, H2AX multiple sequence alignment and validation of H2AX antibodies.
(a) Relative expression of genes related to DDR separated by function. Data are related to Supplementary file 1. On average, genes related to DDR are up-regulated during regeneration. (b) Representative images of comets at different stages from the comet assay. Scale Bar: 25 μm. At stage 0, there is no DNA damage present in the cells hence electrophoresis did not pull the DNA from the nuclear matrix and it appears as a compact round ball. As cells acquire more DNA damage, more DNA is getting pulled from the nuclear matrix, generating a ‘comet’ where the more DNA appears at the tail, the more DNA damage these cells have acquired. At stage 4, most of the DNA is in the tail. (c) H2AX sequence alignment from multiple organisms. Red boxes indicate minor differences between organisms mainly found in non-mammals. Yellow box indicates differences at the C-terminus of the H2AX. Green box indicates similarities in the last four amino acids, which are critical for regulating H2AX function through the phosphorylation of the serine (S139) and tyrosine (Y142). (d) In vitro culture of axolotl AL1 cells treated with UV and stained for CST-5438 antibody that detects mono or dual phosphorylated H2AX at S139 and Y142. Scale Bars: 23 μm. Note that the signal intensifies after UV treatment, indicating that the antibody recognizes the axolotl H2AX forms. (e) In vitro culture of axolotl AL1 cells treated with UV and stained for Ab11174 (similar results obtained with Ab81299) antibody that detects γ-H2AX (mono S139-H2AX phosphorylation). Scale Bars: 23 μm. Note that the signal intensifies following UV treatment, indicating that the antibody is able to recognize the axolotl γ-H2AX.
Figure 1—figure supplement 2

Validation of DDR gene expression profiles using qPCR.
Graphs show expression of ercc8, brcc3, ogg1, rif1, ung, xpc, xrcc6, msh2, rnf169, brca1, parp1, xrc, mms19, rad51, fanca, foxm1, and dhx9 relative to ef1a control at 0. 3. 7. 14 and 21 dpa. Red boxes indicate that expression values have a significant ANOVA p value (p-value<0.05). Comparisons shown on graphs represent significance between 0 dpa and the respective timepoint. Data showed that the majority of the DDR genes tested were significantly up-regulated during regeneration. * denotes p-value<0.05, ** denotes p-value<0.01, *** denotes p-value<0.001, **** denotes p-value<0.0001. Vertical bars on plots represent SEM.
Figure 1—figure supplement 3
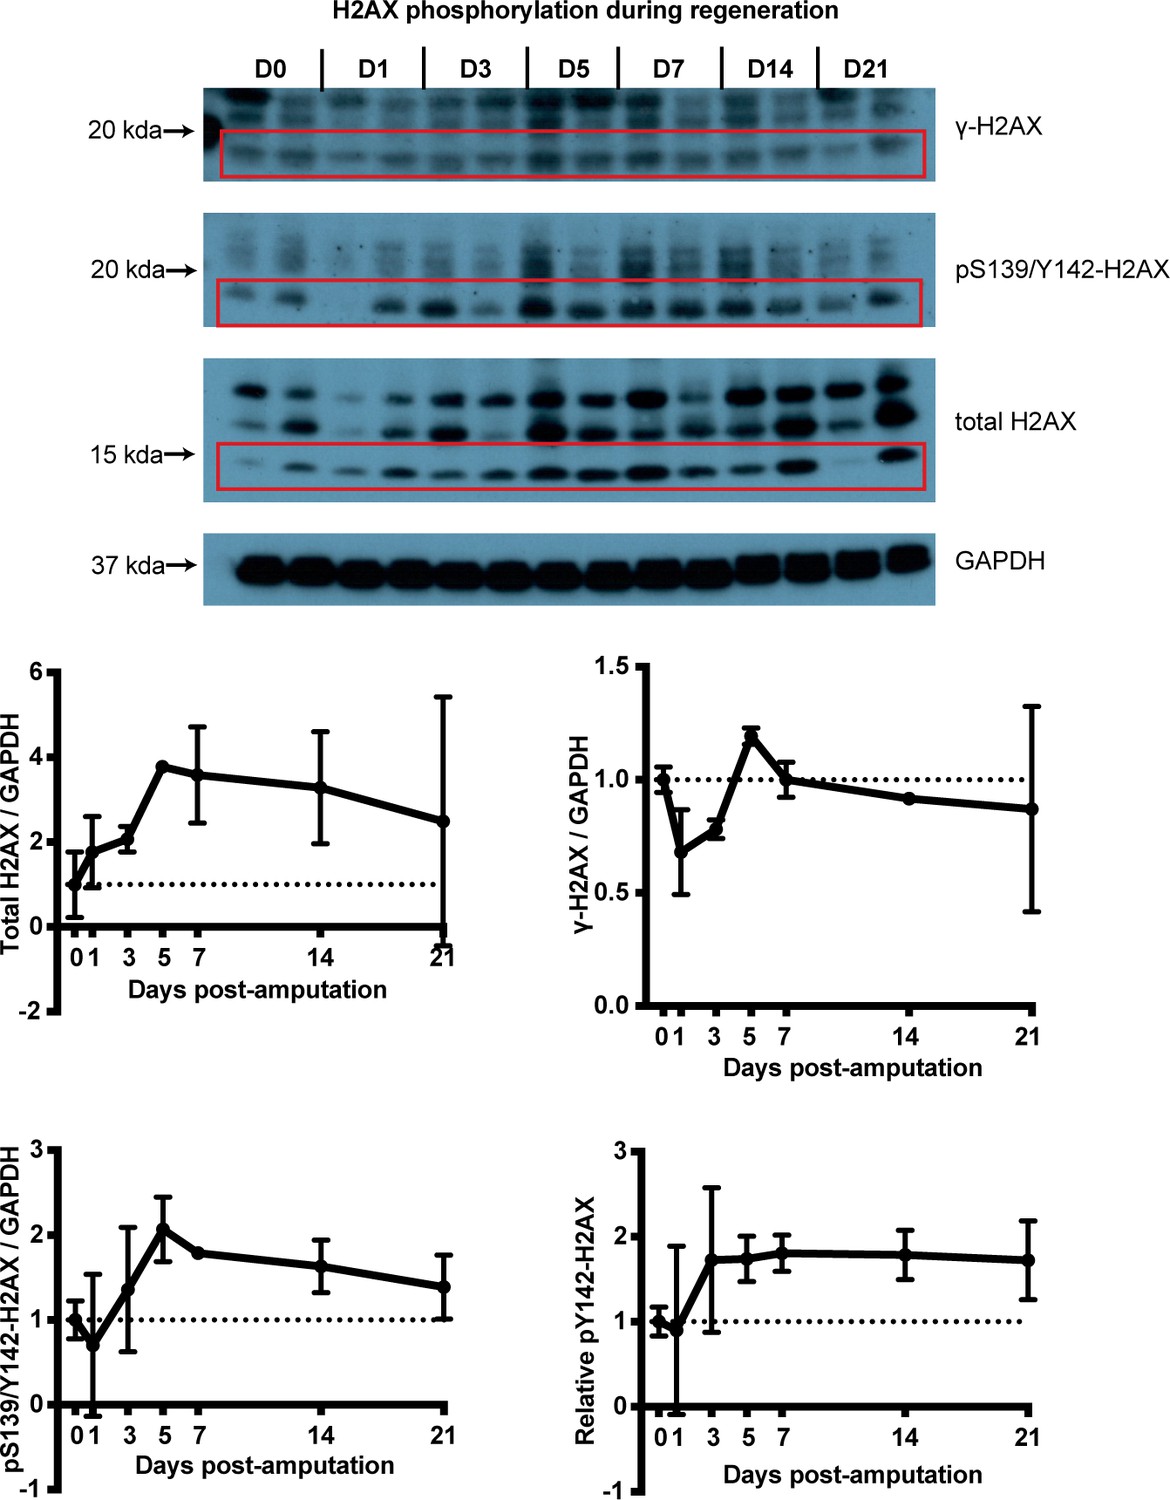
H2AX phosphorylation status at different timepoints during limb regeneration.
Samples are derived from intact or blastema tissue following protein extraction. Lanes represent separate biological replicates. This experiment allowed us to assess differences in H2AX protein amounts across timepoints using a non-histone control (here, GAPDH). However, the method has increased the unintended bands of higher molecular weight which may represent histone complexes of different sizes. In red boxes the bands used for the quantification are indicated. The size of those bands were the same as what was derived using a histone extraction protocol (see Figures 1f and 4a) which overall generated more specific bands with our antibodies but without the ability to blot for non-histone controls. The data showed that the total H2AX and pY142-H2AX proteins were up-regulated during regeneration which validated the western blot experiment with samples acquired using the histone extraction protocol (Figure 1f).
Figure 2 with 2 supplements
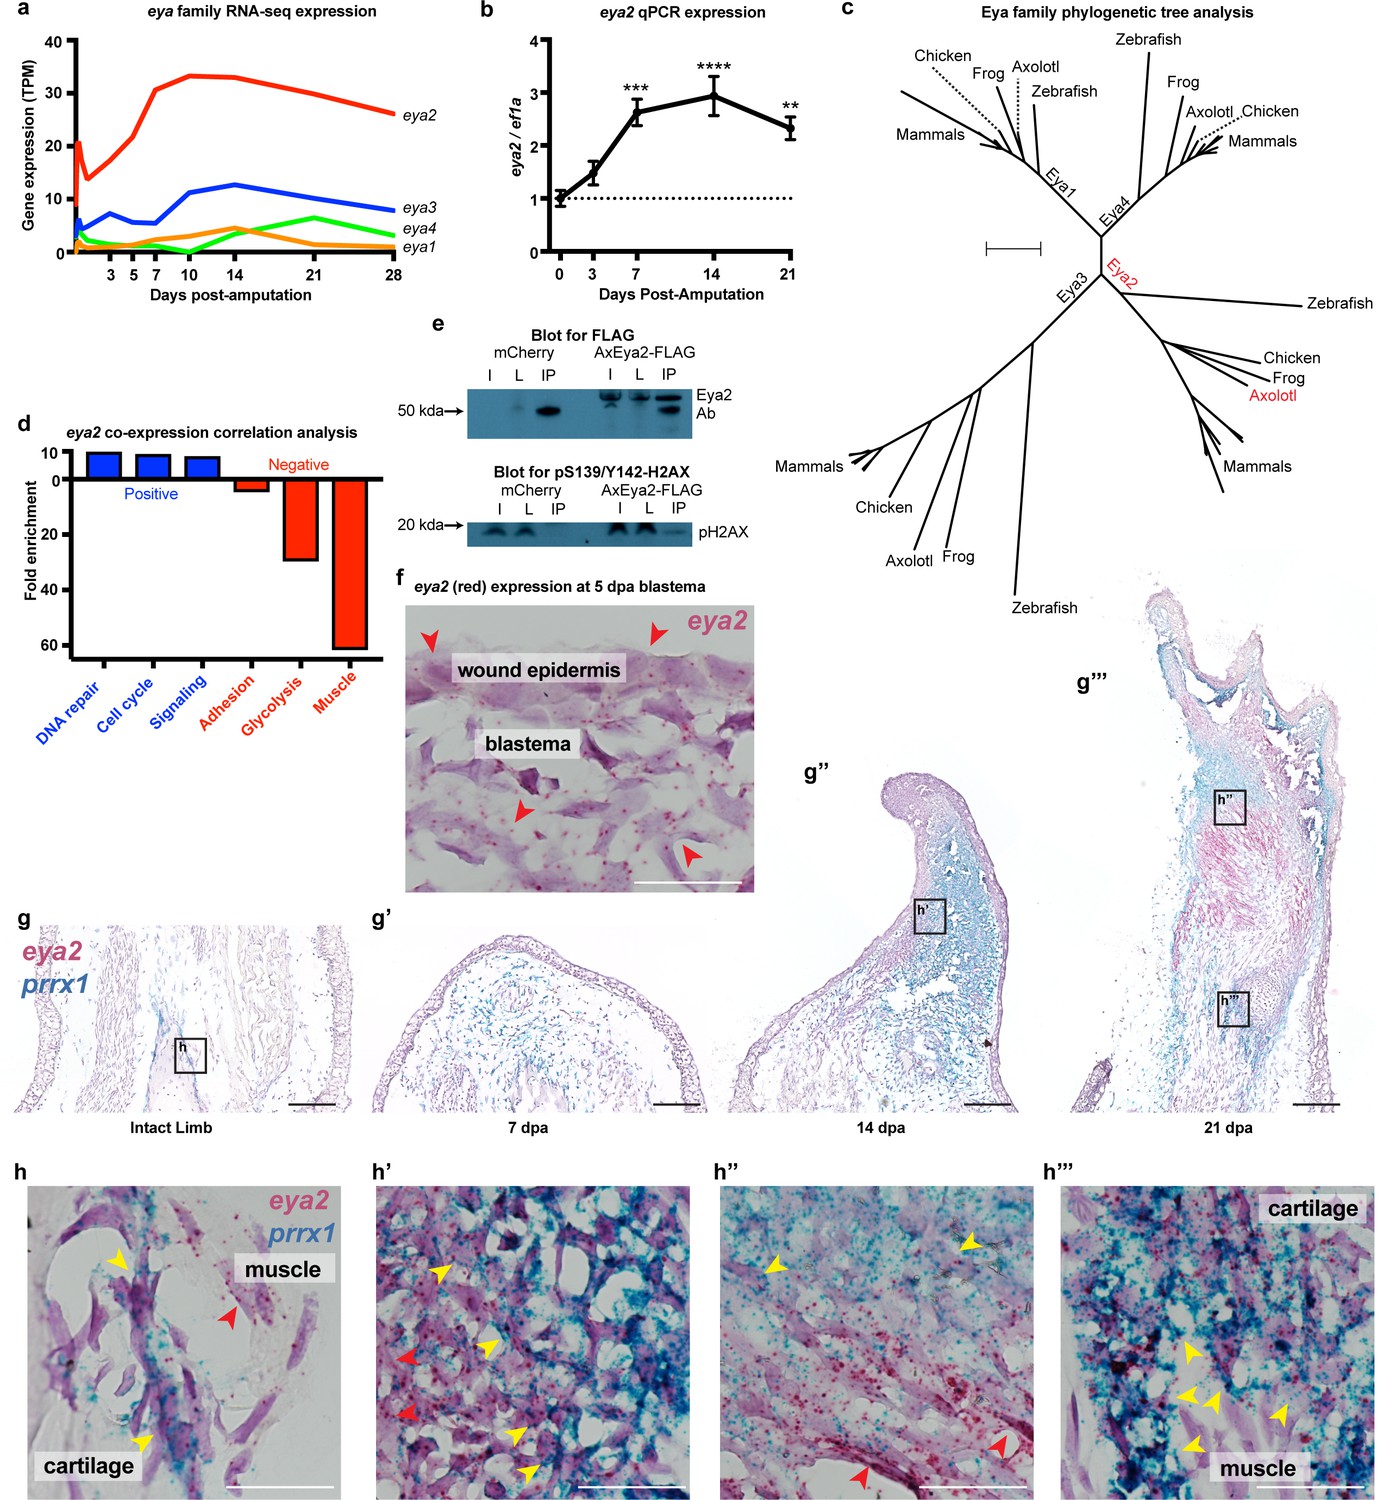
Eya2 is up-regulated during limb regeneration, expressed by limb progenitors and associated with cell cycle and DNA repair.
(a) RNA-seq derived gene expression of the eya gene family during different time points of axolotl limb regeneration. Note that eya2 is the most expressed gene of the eya gene family and appears up-regulated upon amputation. (b) Validation of eya2 gene expression profile using qPCR. We found that normalized eya2/ef1a levels are significantly up-regulated following limb amputation (One-way ANOVA: p-value<0.0001, with Bonferroni’s multiple comparisons test: 0 dpa vs 7 dpa: p-value<0.001, 0 dpa vs 14 dpa: p-value<0.0001, 0 dpa vs 21 dpa: p-value<0.01), indicating that Eya2 may play an important role during limb regeneration. (c) Validation of Eya2 homology with other vertebrate Eya2 proteins using phylogenetic tree analysis. (d) Gene Ontology Enrichment Analysis (FDR < 0.05) of genes found to be positively (R2 >0.8, slope >0, blue bars) or negatively (R2 >0.8, slope <0, red bars) associated with eya2 expression. These data suggest that Eya2 is associated with DNA repair and cell cycle during limb regeneration. (e) Co-immunoprecipitation (Co-IP) experiment using the axolotl Eya2 protein fused with a FLAG tag (AxEya2-FLAG) or mCherry control. Immunoblot against the FLAG tag revealed the axolotl Eya2 protein in the samples transfected with the Eya2-FLAG plasmid and not in the control, as expected (blot for FLAG). Immunoblot against the phosphorylated form of H2AX revealed a band in the precipitate derived from the AxEya2-FLAG IP sample and not in the mCherry control (blot for pS139/Y142-H2AX). I: Sample before IP, L: Flow-through after IP, IP: Pulled-down proteins. (f) RNA in situ hybridization for eya2 (red puncta) in 5 dpa blastema section, Scale Bar: 50 μm. Eya2 appears to be expressed by most cells in the wound epidermis and blastema. (g–g’’’) Time course RNA in situ hybridization for eya2 (red puncta) and prrx1 (blue puncta) during regeneration. Scale Bars: 250 μm. (g) Intact limb. (g’). 7 dpa early blastema. (g’’) 14 dpa mid-late blastema. (g’’’) 21 dpa palette stage. (h–h’’’) High magnification inserts of (g–g’’’) images. Scale Bars: 25 μm. (h) Intact limb. Eya2 is expressed by muscle cells (red arrow) and prrx1+ periosteal cells (yellow) which are known cartilage progenitors. (h’) 14 dpa blastema. Eya2 is robustly expressed in the regenerating muscle (red arrow) and blastema cells positive for prrx1 (yellow arrow) (h’’) 21 dpa regenerate. Eya2 is expressed in the regenerating muscle (red arrows) while expression in the prrx1+ population is getting diminished (yellow arrow). (h’’’) 21 dpa regenerate-proximal area. Eya2 is expressed in the newly regenerated prrx1+ periosteal cells (yellow arrow), while there is no expression in fully developed muscle. ns denotes p-value>0.05, * denotes p-value<0.05, ** denotes p-value<0.01, *** denotes p-value<0.001, **** denotes p-value<0.0001. Vertical bars on plots represent standard error of the mean (SEM).
Figure 2—figure supplement 1

Gene Ontology Enrichment Analysis of eya2 co-expression correlation analysis during limb regeneration.
(a) Biological processes positively correlated with eya2 expression. These data represent functions of genes found to be expressed in a similar manner as eya2 indicating that eya2 may regulate, be part of or be regulated by these processes. What the result suggests is that the eya2 expression profile is correlated with expression profiles for genes that annotate to cell cycle (blue) and DNA repair (red) GO terms. (b) Biological processes negatively correlated with eya2 expression. These data represent functions of genes found to be expressed when eya2 expression is missing or down-regulated. Note that functions related to mature muscle (red) are strongly negatively correlated which is in support of the role of Eya2 during early muscle development.
Figure 2—figure supplement 2
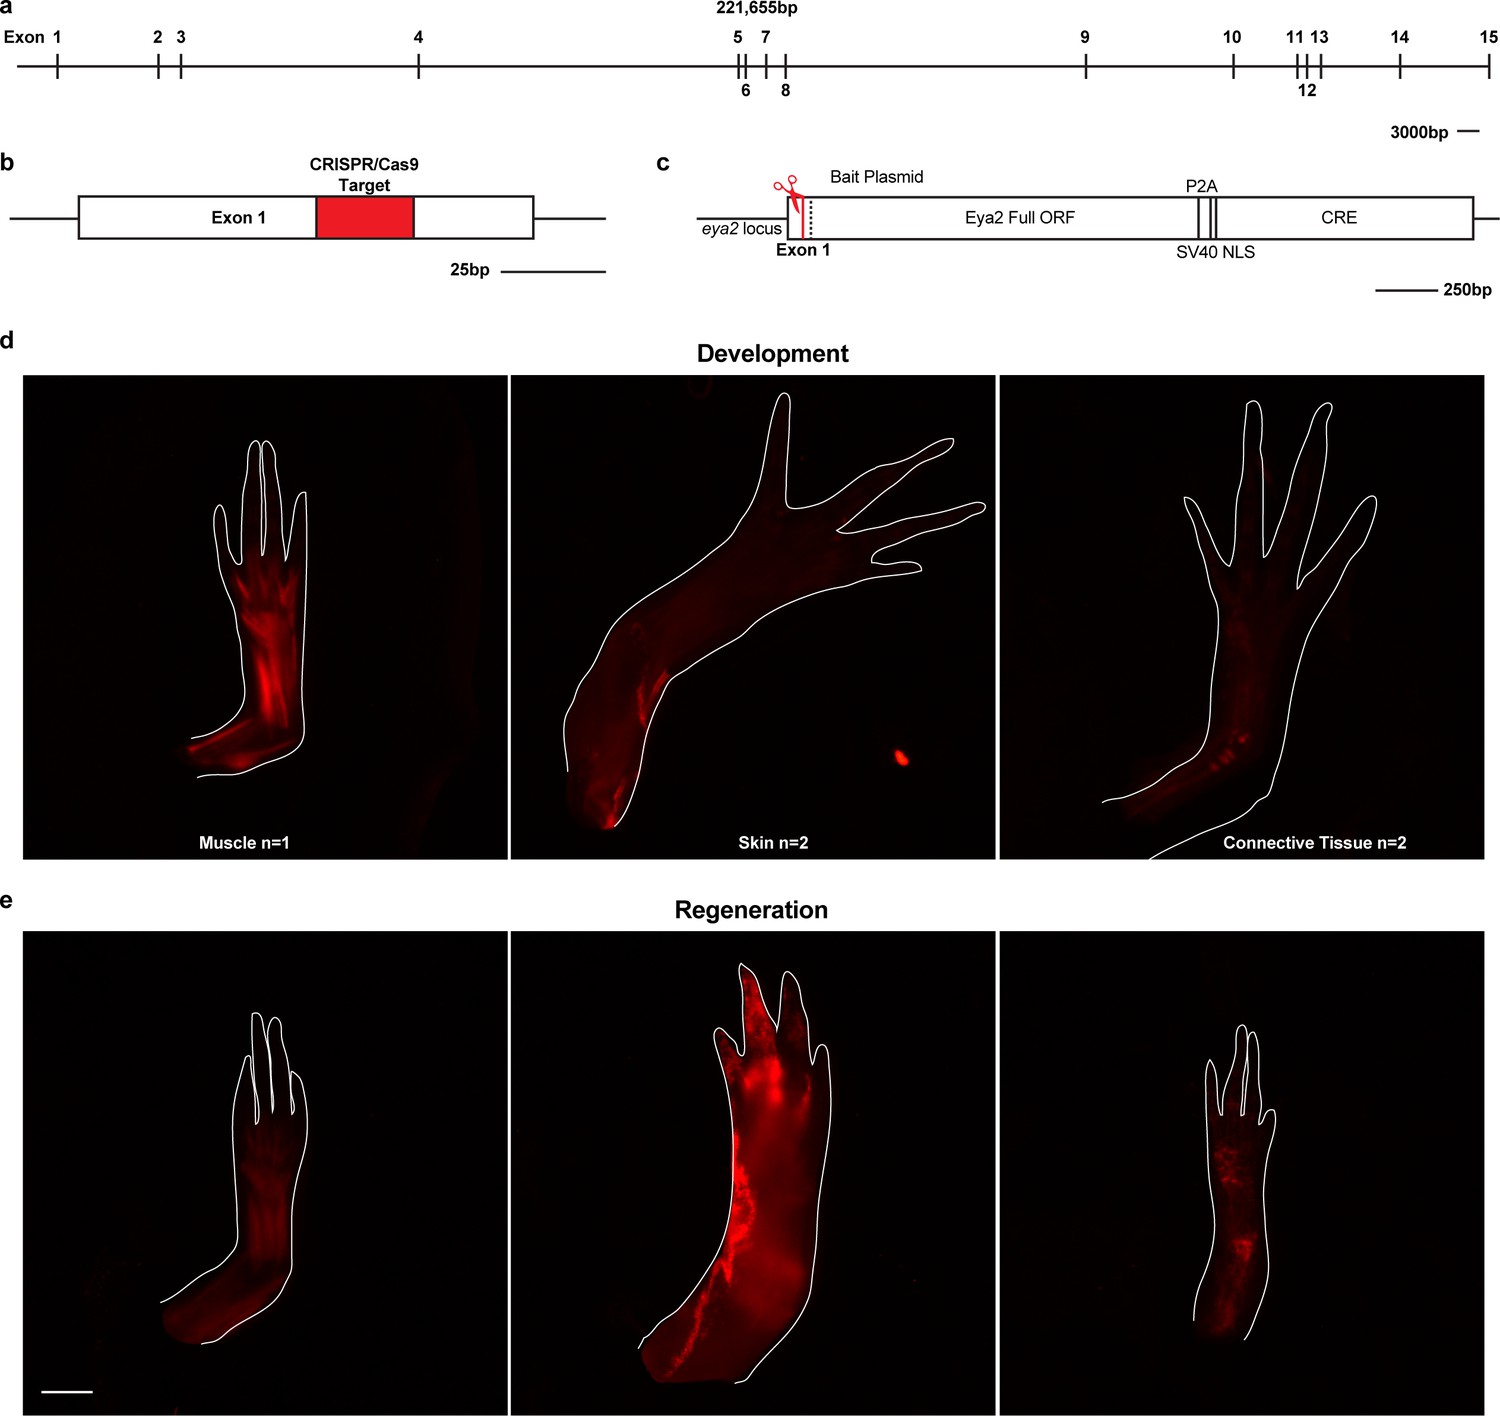
Eya2 lineage trace analysis.
(a) The axolotl eya2 locus. Scale Bar: 3000 bp. As expected, the axolotl eya2 locus has the same number of exons as the human eya2 locus but considerably longer introns. (b) Exon 1 was targeted with a specific CRISPR/Cas9 complex. Red area denotes the target sequence. Scale Bar: 25 bp. (c) The axolotl eya2 locus following knock-in of the bait plasmid containing the full ORF of the eya2 gene and cre recombinase separated by the self-cleaving viral P2A peptide. The Cre recombinase will be expressed under the eya2 endogenous promoter and permanently label eya2-expressing cells with mCherry following removal of the loxp-GFP-stop-loxp sequence in Cre reporter animals. (d) Fluorescent images from limbs of F0 mosaic eya2 knock-in Cre reporter animals denoting lineage trace with mCherry. Since the knock-in event was targeted at the single-cell stage embryo, any cell expressing eya2 during development would be permanently labeled with mCherry expression. Note that all three major limb lineages, muscle, skin and connective tissue cells are able to express eya2. (e) The resulting mCherry fluorescence in regenerates when limbs in (d) are amputated. Scale Bar: 1 mm.
Figure 3 with 3 supplements
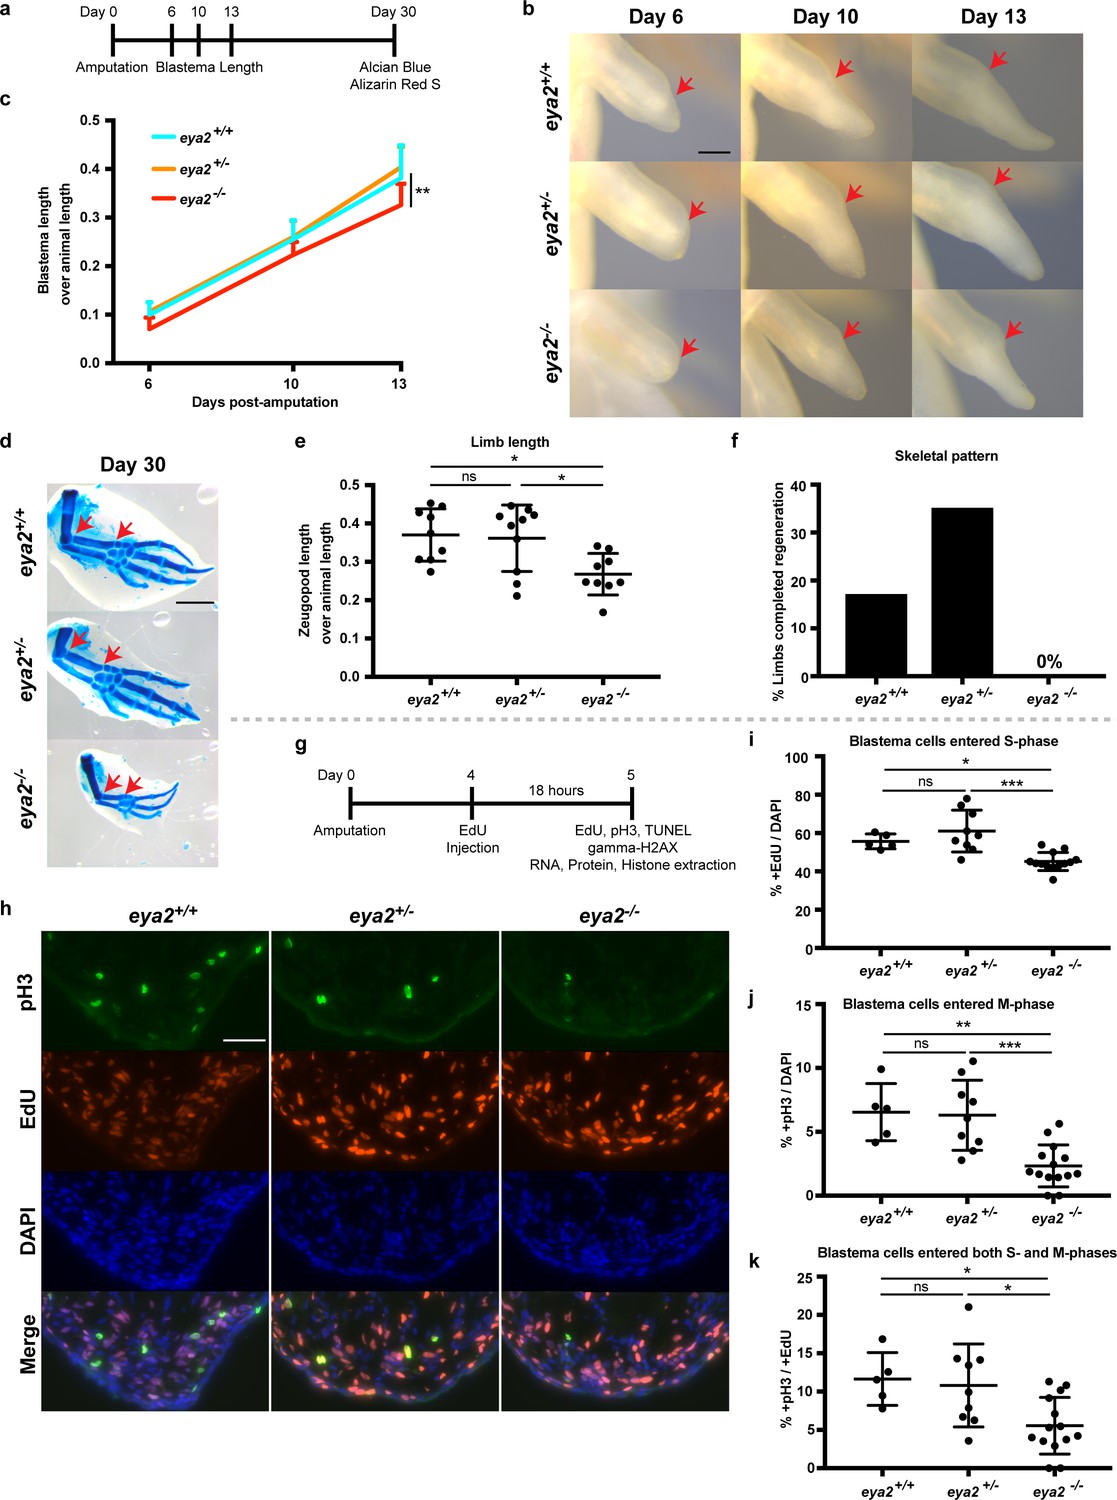
CRISPR/Cas9-targeted eya2 mutant axolotls regenerate slower and have stalled cell cycle.
(a) Experimental design to test limb regeneration rates in eya2-/- axolotls. Bright field imaging was conducted at 6, 10, and 13 dpa to determine blastema length overtime. Final limb collection was performed at 30 dpa, time that some control axolotls had all four digits regenerated. 30 dpa limb were processed to visualize their skeleton using alcian blue and alizarin red S. (b) Representative images of blastema at different time points during regeneration. Arrows point at the amputation site. Scale Bar: 0.5 mm. Note that eya2-/- axolotls have a smaller blastema even at 6 dpa. (c) Quantification of blastema length from (b). Eya2-/- axolotls have smaller blastema compared to eya2+/+ and eya2+/- (Repeated measures two-way ANOVA, interaction: p-value<0.05, time: p-value<0.0001, genotype <0.01; Bonferroni’s multiple comparisons tests: 13 dpa eya2+/+ vs 13 dpa eya2-/-: p-value<0.01 and 13 dpa eya2+/- vs 13 dpa eya2-/-: p-value<0.0001). (d) Representative images of limb regenerates stained with alcian blue and alizarin red S stains to visualize skeletal elements. 30 dpa regenerates. Red arrows point to the beginning and the end of the zeugopod. Scale Bar: 1 mm. Note the relative smaller limb regenerates of the eya2-/- axolotls. (e), Quantification of zeugopod length from (d). Eya2-/- 30 dpa regenerates are significantly smaller than those from eya2+/+ and eya2+/- axolotls (One-way ANOVA with Bonferroni’s multiple comparisons tests: eya2+/+ vs eya2-/-: p-value<0.05, eya2+/- vs eya2-/-: p-value<0.05). (f) Analysis of skeletal pattern from (d). Skeletal elements were quantified to determine whether or not the full limb pattern is regenerated. Eya2-/- animals did not have any limb that had successfully regenerated all skeletal elements (Fisher Exact Probability Test on a 2 × 3 table: p-value<0.05). (g) Experimental design to test cellular proliferation during regeneration. EdU was injected at 4 dpa and blastema tissues were harvested 18 hr later and processed for immunofluorescence (IF). (h) Representative images of blastema sections at 5 dpa stained with pS10-H3, EdU and DAPI. Scale Bar: 100 μm. (i) Quantification of percent +EdU cells in the whole blastema. There are less blastema cells entering the cell cycle in eya2-/- axolotls (Kruskal-Wallis test with Dunn’s multiple comparisons test: eya2+/+ vs eya2-/-: p-value<0.05, eya2+/- vs eya2-/-: p-value<0.001). (j) Quantification of percent +pH3 cells in the whole blastema. There are less blastema cells actively dividing in eya2-/- axolotls (One-way ANOVA with Bonferroni’s multiple comparisons test: eya2+/+ vs eya2-/-: p-value<0.01, eya2+/- vs eya2-/-: p-value<0.001). (k) Quantification of percent +pH3 cells in the +EdU population. There are less blastema cells that entered the cell cycle at the time of EdU pulse and actively dividing at the time of collection in eya2-/- axolotls (One-way ANOVA with Bonferroni’s multiple comparisons test: eya2+/+ vs eya2-/-: p-value<0.05, eya2+/- vs eya2-/-: p-value<0.05). ns denotes p-value>0.05, * denotes p-value<0.05, ** denotes p-value<0.01, *** denotes p-value<0.001, **** denotes p-value<0.0001. Vertical bars on plots represent SEM.
Figure 3—figure supplement 1
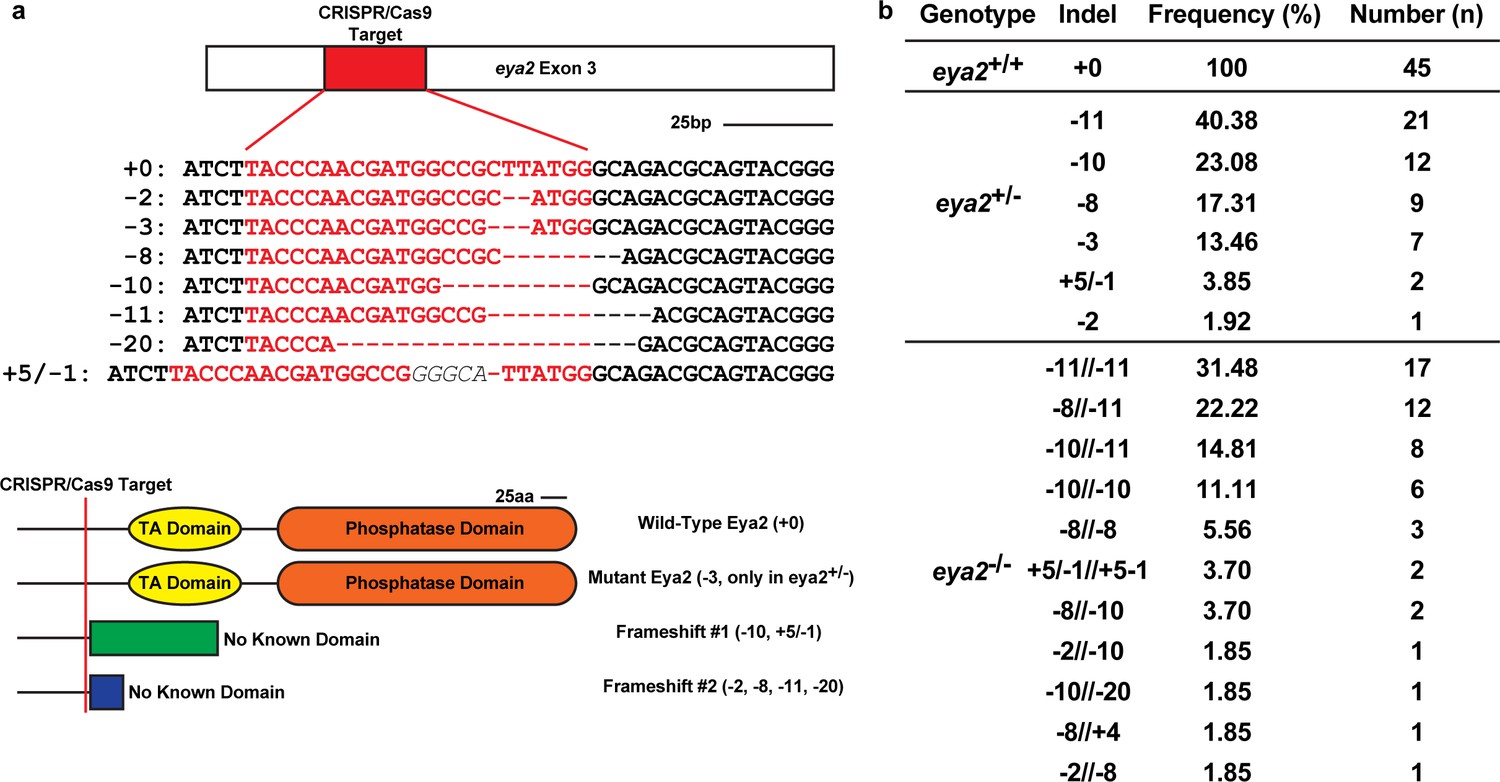
Eya2 mutant animal genotyping.
(a) Eya2 Exon 3 was targeted with a specific CRISPR/Cas9 complex. Red area denotes the target sequence. Sequences indicate specific indels found in our population of animals used in the experiments. Scale Bar: 25 bp. Cartoons illustrate the differences between the Eya2 proteins and their domains predicted by the genotyping for each identified indel. The orange rectangle is the phosphatase domain and the yellow eclipse is the transactivation (TA) domain of the wild-type Eya2 protein. The green and blue rectangles illustrate extra amino acid sequences expected to be translated following the CRISPR/Cas9 target site which have no known predicted function and share no similarity to the wild-type Eya2 sequence. Scale Bar: 25aa. (b) Genotypes, observed indels, observed frequencies and total number of animals used in the experiments.
Figure 3—figure supplement 2
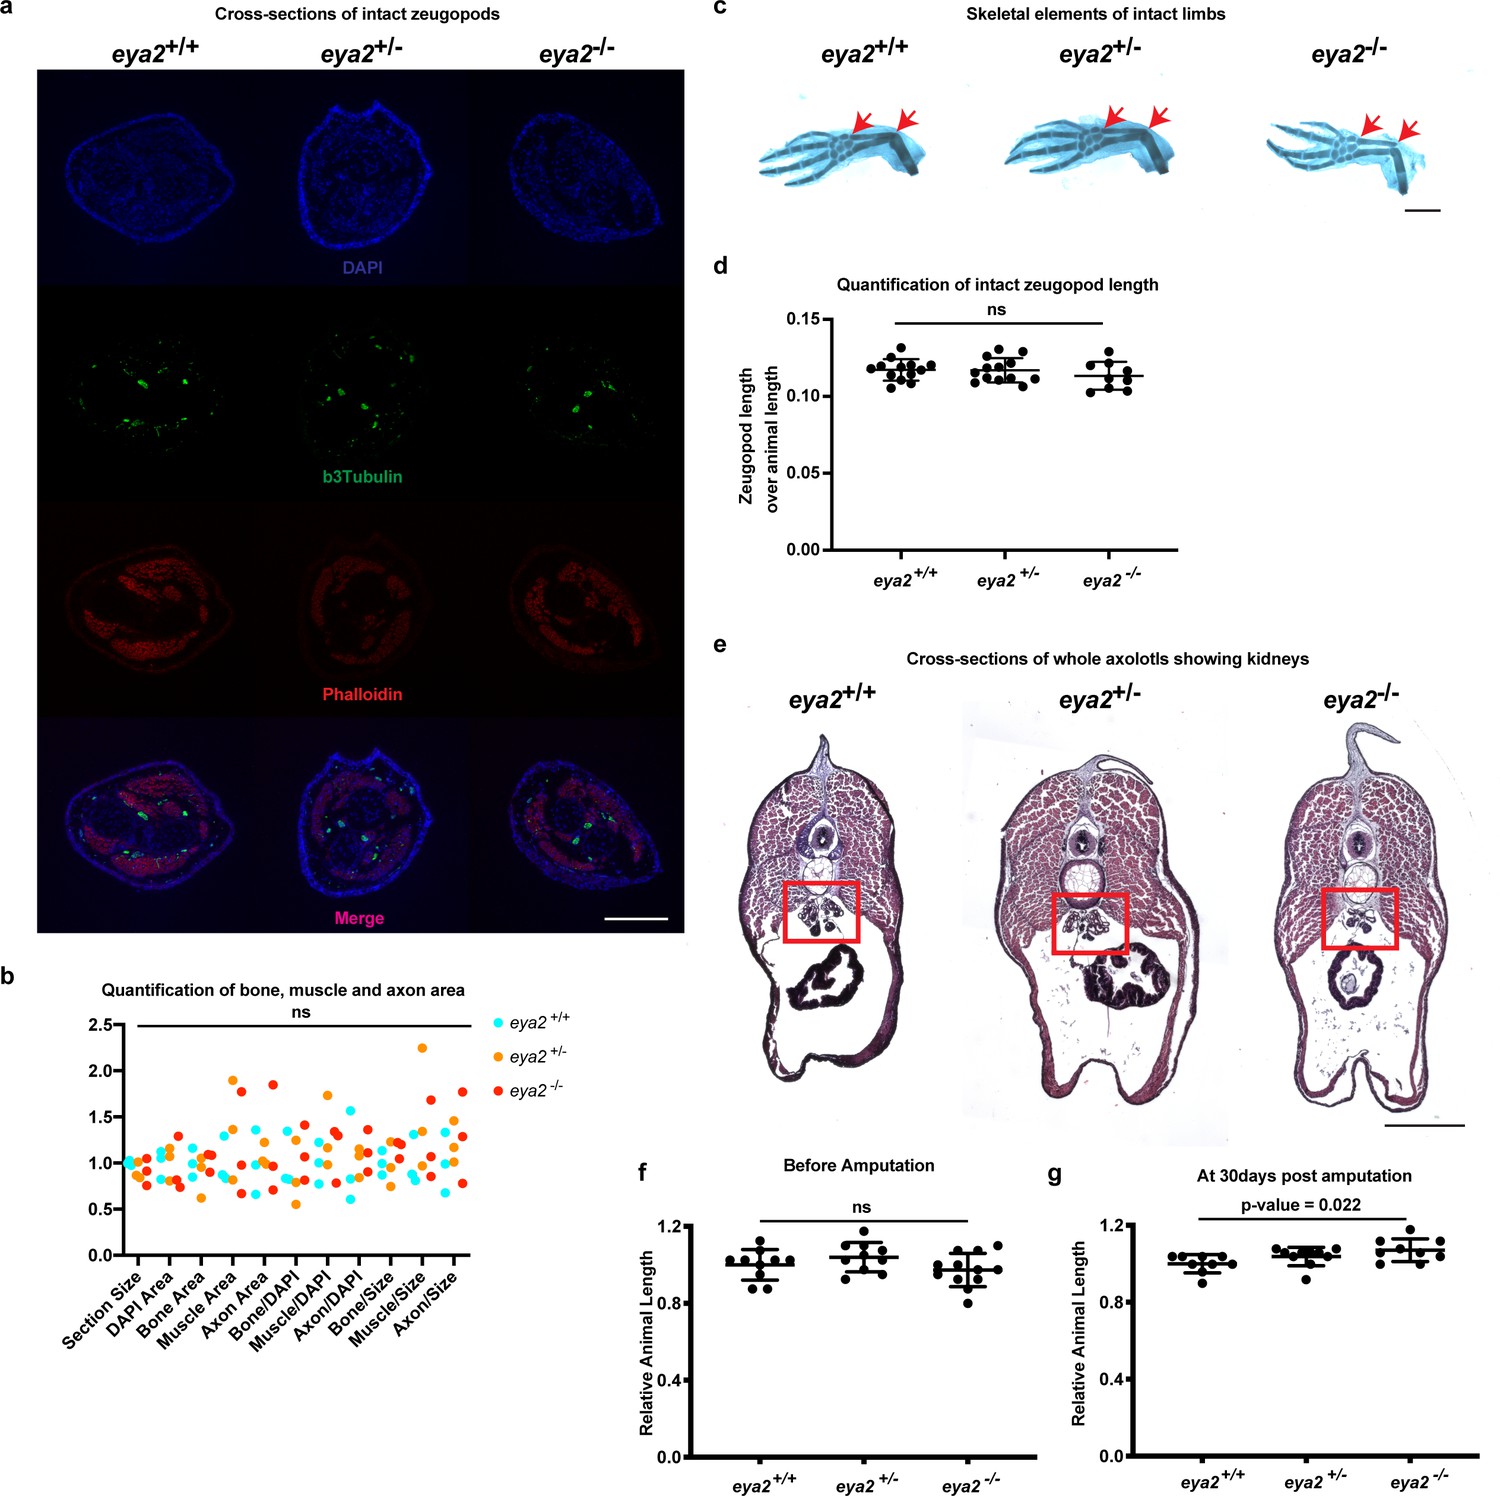
Eya2 mutant animal characterization.
(a) Cross sections of intact limbs from all genotypes stained with βIII-tubulin (green, neural axons), phalloidin (red, muscle) and DAPI (blue, bone margins). Scale Bar: 400 μm (b), Quantification of the bone, muscle and axon area relative to DAPI area or section area. Note that all eya2 genotypes have normal limbs with axons, muscle and bone (Two-way ANOVA: Interaction, Row Factor, Column Factor: p-value>0.05, with Bonferroni’s multiple comparisons test: p-value>0.05 for all comparisons). (c) Representative images of alcian blue and alizarin red S from intact limbs across all eya2 genotypes. Red arrows show zeugopod length. Scale Bar: 1 mm. (d) Quantification of zeugopod length from (c). There is no difference among genotypes in the zeugopod length of intact limbs (One-way ANOVA: p-value=0.4839, with Bonferroni’s multiple comparisons test: eya2-/- vs eya2+/+: p-value>0.05, eya2-/- vs eya2+/-: p-value>0.05). (e) Cross-sections of whole axolotls at a level where kidneys are shown (red box). All eya2-/- animals showed deformed kidneys (n = 7) versus eya2+/+ (n = 3) and eya2+/- (n = 3). Scale Bar: 1 mm. Dorsal is top, ventral is bottom. (f) Relative animal length at 0 dpa. Eya2 mutant animals appear to grow normally (One-way ANOVA: p-value=0.1758, with Bonferroni’s multiple comparisons test: eya2-/- vs eya2+/+: p-value>0.05, eya2-/- vs eya2+/-: p-value>0.05). (g) Relative animal length at 30 dpa. Eya2 mutant animals appear to have grown slightly bigger than eya2+/+ and eya2+/- siblings (One-way ANOVA: p-value=0.0255, with Bonferroni’s multiple comparisons test: eya2-/- vs eya2+/+: p-value<0.05, eya2-/- vs eya2+/-: p-value=0.5179, eya2-/+ vs eya2+/+: p-value=0.3724). ns denotes p-value>0.05, * denotes p-value<0.05, ** denotes p-value<0.01, *** denotes p-value<0.001, **** denotes p-value<0.0001. Vertical bars on plots represent SEM.
Figure 3—figure supplement 3
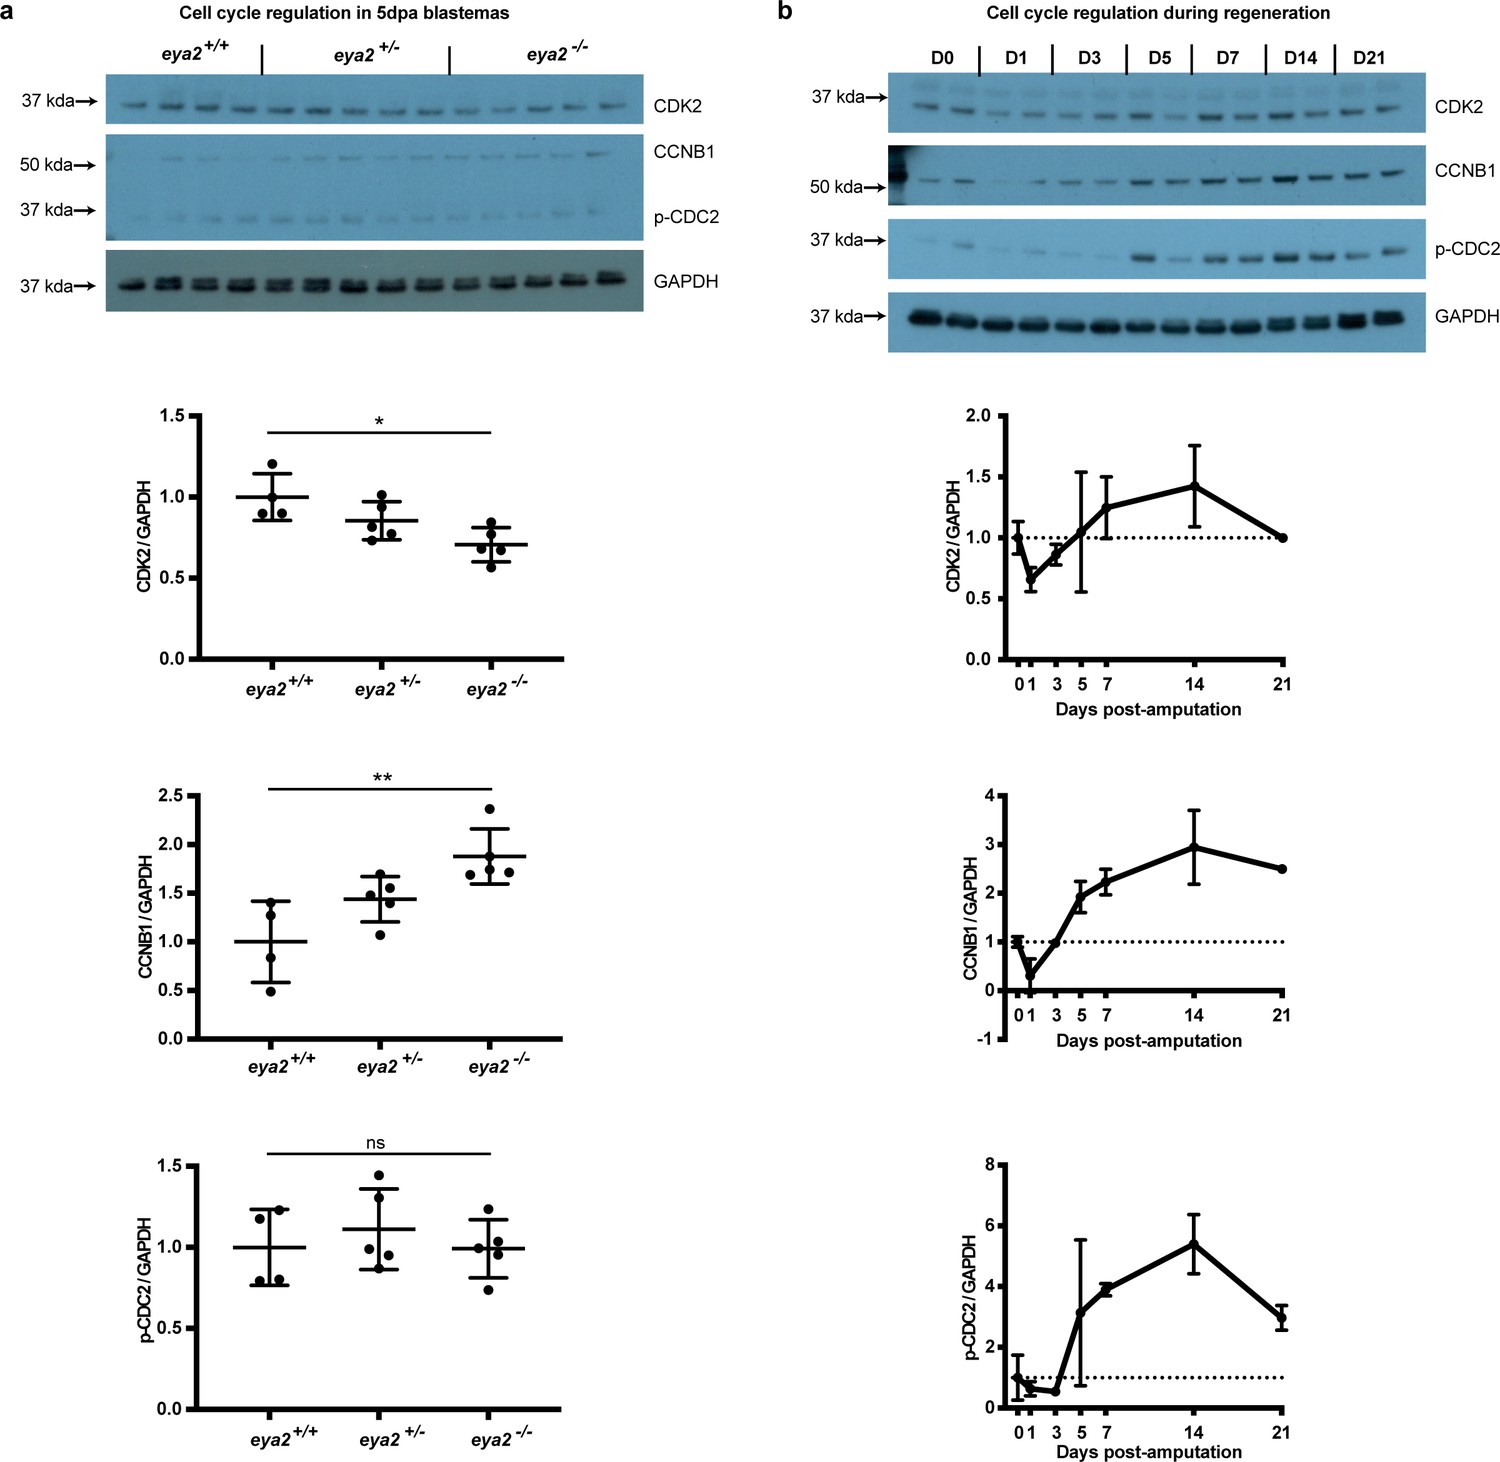
Cell cycle regulation in 5 dpa blastemas across eya2 genotypes and at different time points during limb regeneration.
(a) Cell cycle regulation in 5 dpa blastemas among eya2 genotypes. Cyclin-dependent kinase 2 (CDK2), G2/mitotic specific cyclin-B1 (CCNB1), phospho Tyr-15 Cyclin-dependent kinase 1 (p-CDC2) and GAPDH were assessed using western blot. Quantification indicates decreased levels of CDK2/GAPDH (One-way ANOVA: p-value=0.0136, with Bonferroni’s multiple comparisons test: eya2-/- vs eya2+/+: p-value<0.05), increased levels of CCNB1/GAPDH (One-way ANOVA: p-value=0.0051, with Bonferroni’s multiple comparisons test: eya2-/- vs eya2+/+: p-value<0.01) and no change in p-CDC2/GAPDH levels (One-way ANOVA: p-value=0.6513, with Bonferroni’s multiple comparisons test: eya2-/- vs eya2+/+: p-value>0.05). The data validated that eya2-/- blastema cells proliferate slower and were stalled at the G2 phase as indicated by the increased levels of CCNB1. (b) Cell cycle regulation at different time points during regeneration in wild-type animals. CDK2, CCNB1 and p-CDC2 levels appear to decline relative to GAPDH at 1-3 dpa following amputation but to elevate, as expected, later during regeneration when blastema proliferation occurs (5-21 dpa).
Figure 4 with 1 supplement
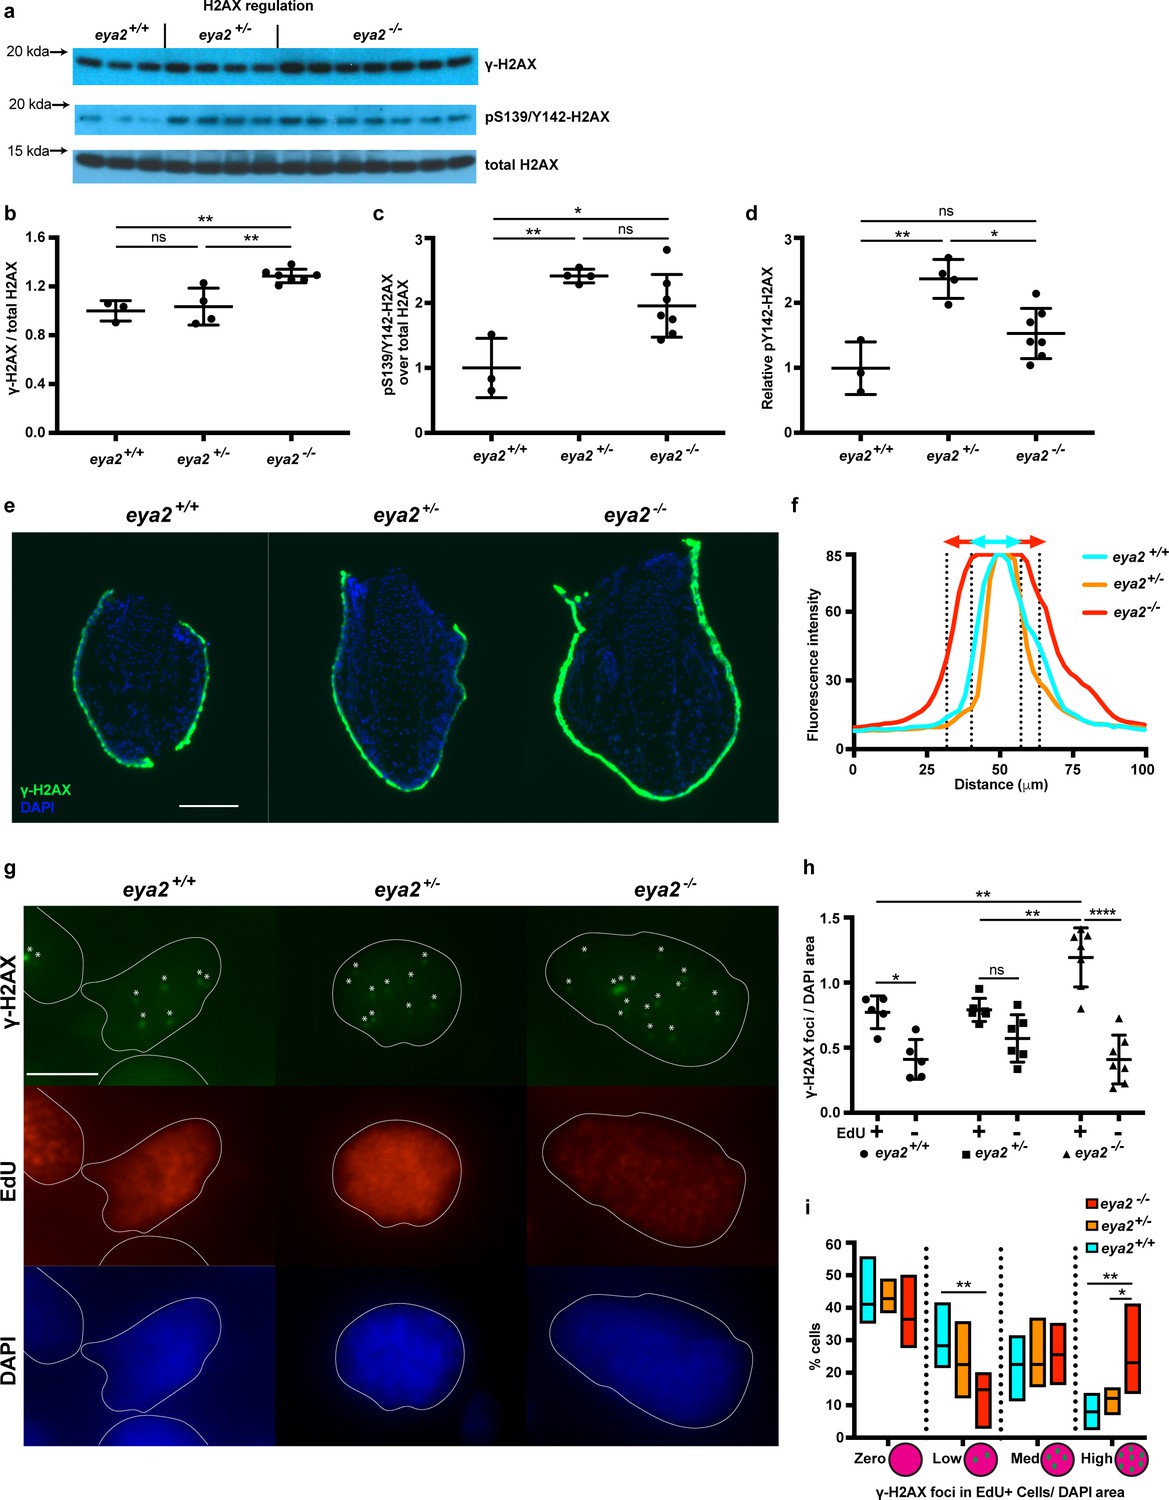
Proliferating eya2-/- blastema cells have increased γ-H2AX levels.
(a) Western blot for H2AX and its phosphorylation status in 5 dpa blastema tissue. Note the robust up-regulation of γ-H2AX in eya2-/- tissues and the up-regulation of pS139/Y142-H2AX signal in eya2+/- tissues. (b,c,d) Quantification of (a). (b) Relative γ-H2AX levels across genotypes. Eya2-/- blastema have significantly more relative γ-H2AX levels, indicating higher genotoxic stress signals (One-way ANOVA with Bonferroni’s multiple comparisons test: eya2+/+ vs eya2-/-: p-value<0.01, eya2+/- vs eya2-/-: p-value<0.01). (c) Relative pS139/Y142-H2AX levels across genotypes. Eya2+/+ blastema have significant less relative pS139/Y142-H2AX signal than eya2+/- and eya2-/- blastema (One-way ANOVA with Bonferroni’s multiple comparisons test: eya2+/+ vs eya2+/-: p-value<0.01, eya2+/+ vs eya2-/-: p-value<0.05). (d) Relative pY142-H2AX levels across genotypes. Eya2+/- blastema have significantly more relative pY142-H2AX levels than eya2+/+ and eya2-/- (One-way ANOVA with Bonferroni’s multiple comparisons test: eya2+/- vs eya2+/+: p-value<0.01, eya2+/- vs eya2-/-: p-value<0.05). (e) Representative images of γ-H2AX immunofluorescence on 5 dpa blastema sections at low magnification. Note the robust γ-H2AX signal intensity in eya2-/- skin. Scale Bar: 150 μm. (f) Quantification γ-H2AX intensity across the skin in each genotype from (e). Eya2-/- axolotls have significantly more γ-H2AX in their skin compared to eya2+/- and eya2+/+ (Two-way ANOVA interaction: p-value<0.0001, genotype: p-value<0.0001). (g) Representative images of blastema sections stained for DAPI (blue), γ-H2AX (green) and EdU (red). Stars (*) point to nuclear γ-H2AX foci, white lines denote the boundaries of the nucleus. Scale Bar: 10 μm. (h) Quantification of γ-H2AX foci per area of nucleus across different genotypes and proliferation status from (g). Blastema cells that have entered the cell cycle have significantly more γ-H2AX foci per area of nucleus irrespective of genotype (Two-way ANOVA: EdU: p-value<0.0001). EdU+ eya2-/- blastema cells have significantly increased numbers of γ-H2AX foci per area of nucleus compared to those from eya2+/+ and eya2+/- blastema (Two-way ANOVA interaction: p-value<0.001, with Bonferroni’s multiple comparisons test: EdU+ eya2-/- vs EdU+ eya2+/+: p-value<0.01, EdU+ eya2-/- vs EdU+ eya2+/-: p-value<0.01). (i) Percent of cells in the +EdU blastema population in different categories of γ-H2AX foci concentrations. The data indicate that the same fraction of cells have γ-H2AX foci irrespective of genotype (Two-way ANOVA with Bonferroni’s multiple comparisons test: for γ-H2AX zero concentration: eya2+/+ vs eya2+/-: p-value>0.05, eya2+/+ vs eya2-/-: p-value>0.05, eya2+/- vs eya2-/-: p-value>0.05) but eya2-/-blastema cells (red bars) have more cells with high and less cells with low γ-H2AX concentration (Two-way ANOVA with Bonferroni’s multiple comparisons test: for low γ-H2AX concentration: eya2-/- vs eya2+/+: p-value<0.01, for high γ-H2AX concentration: eya2-/- vs eya2+/+: p-value<0.01, eya2-/- vs eya2+/-: p-value<0.05). ns denotes p-value>0.05, * denotes p-value<0.05, ** denotes p-value<0.01, *** denotes p-value<0.001, **** denotes p-value<0.0001. Vertical bars on plots represent SEM.
Figure 4—figure supplement 1
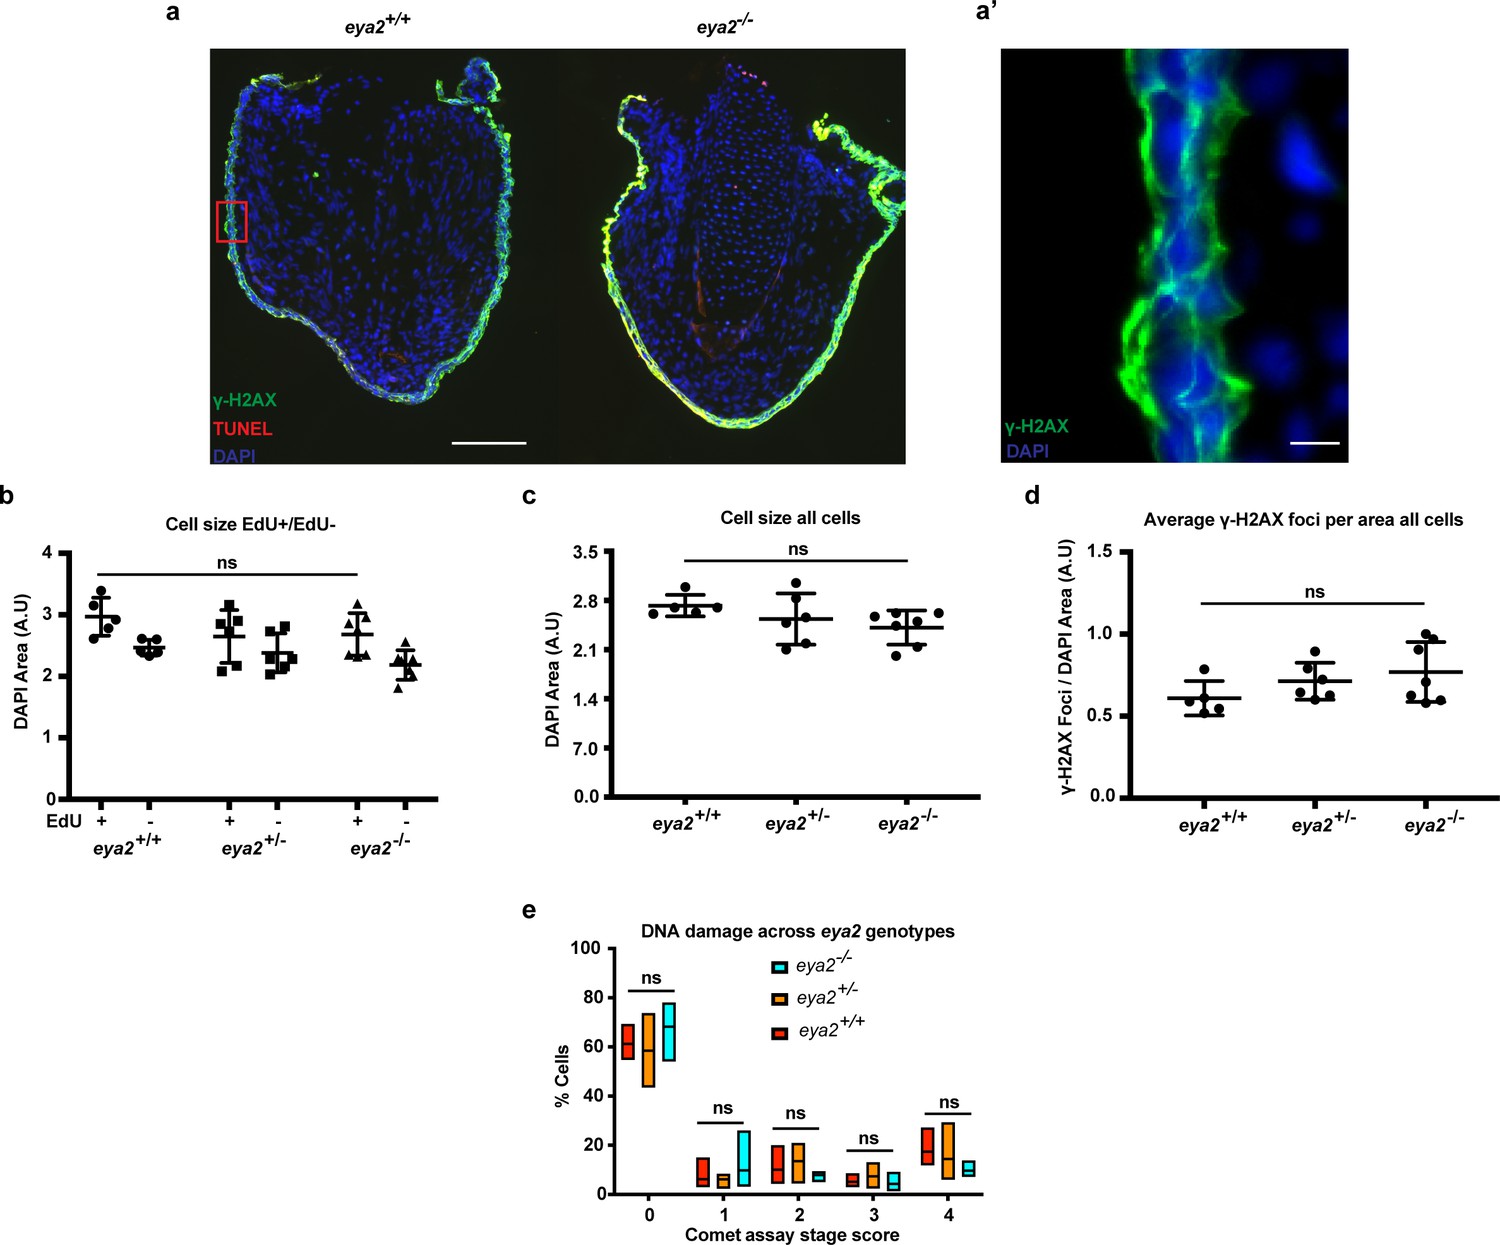
TUNEL assay on Eya2 mutant blastema sections, DNA damage quantification in 5 dpa blastema cells and parameters associated with Figure 4h.
(a) 5 dpa blastema sections from eya2+/+ and eya2-/- animals stained for TUNEL assay (red), γ-H2AX (green) and DAPI (blue). Scale Bar 150 μm. Eya2-/- blastema cells do not undergo apoptosis (0%, n = 3). (a’) Higher magnification of red box insert from (a). Image shows γ-H2AX staining in green throughout all layers of the skin. Interestingly, the staining pattern in the skin is not nuclear (for γ-H2AX foci in blastema cells see Figure 4). Scale Bar: 10 μm. (b) Blastema cell size across different eya2 genotypes and proliferation status. EdU+ blastema cell nucleus is bigger in size than EdU- (Two-way ANOVA: EdU Factor: p-value<0.001). There is no difference in nucleus size among eya2 genotypes (Bonferroni’s multiple comparisons test: EdU+ eya2-/- vs EdU+ eya2+/+: p-value>0.05, EdU+ eya2-/- vs EdU+ eya2+/-: p-value>0.05). (c) Average nucleus cell size across genotypes irrespective of EdU status. Blastema cell nucleus size appears the same among all eya2 genotypes (One-way ANOVA with Bonferroni’s multiple comparisons test: eya2-/- vs eya2+/-: p-value>0.05, eya2-/- vs eya2+/+: p-value>0.05). (d) Average γ-H2AX foci per DAPI area across genotypes. There is no difference in γ-H2AX foci when cells are analyzed irrespective of their EdU status (One-way ANOVA with Bonferroni’s multiple comparisons test: eya2-/- vs eya2+/-: p-value>0.05, eya2-/- vs eya2+/+: p-value>0.05). (e) Comet assay on 5 dpa blastema cells across eya2 genotypes. No differences were found among genotypes in the amount of DNA damage present in their genome (Two-way ANOVA: Interaction and Column Factor p-value>0.05, with Bonferroni’s multiple comparisons tests: p-value>0.05 for all comparisons. ns denotes p-value>0.05. Vertical bars on plots represent SEM.
Figure 5 with 1 supplement
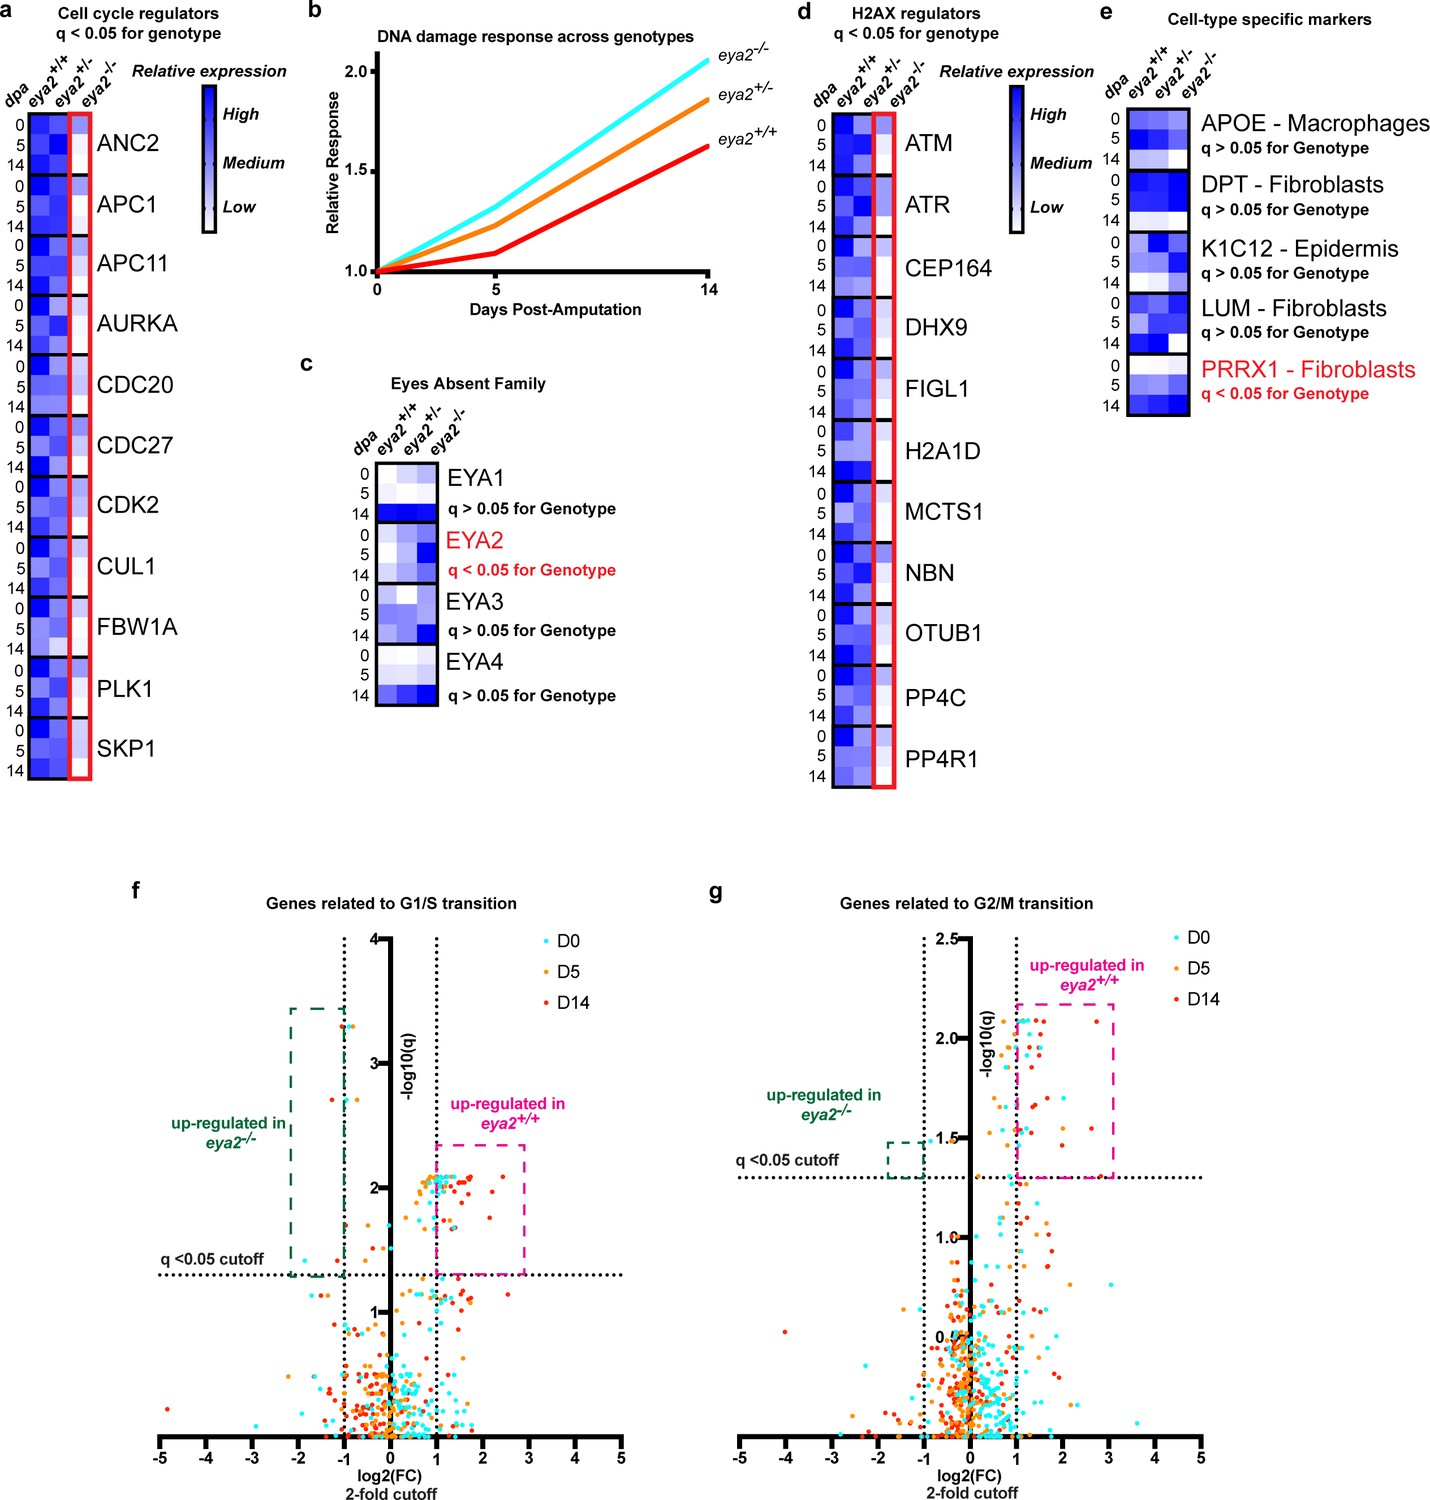
RNAseq analysis of eya2-/- tissues confirms the connection between Eya2, DDR and cell cycle progression.
(a) Relative expression of known cell cycle regulators found differentially regulated (q-value <0.05) across genotypes using RNAseq. Eya2-/- blastema tissues have significantly down-regulated genes associated with cell cycle progression corroborating our previous proliferation data. (b) DNA damage response across all genotypes during limb regeneration at 0, 5 and 14 dpa. Note that eya2-/- blastema tissues have significantly elevated the expression of genes associated with DDR indicating a robust genotoxic stress signal. (c) Relative expression of the eya gene family across genotypes and timepoints. Note that the only differentially regulated gene found using RNAseq analysis (q-value <0.05) was eya2 itself which appears up-regulated in the eya2-/- background. (d) Relative expression of genes known to regulate H2AX post-translational modifications. Eya2-/- blastema tissues have significantly down-regulated these genes (q-value <0.05) indicating a potential molecular mechanism that compensates for the elevated levels of γ-H2AX that persist in absence of Eya2 activity. (e) Relative expression of genes known to mark specific cell types during axolotl limb regeneration. Expression of macrophage, fibroblast and epidermis markers do not appear to be affected by the absence of Eya2 activity (q-value >0.05). Interestingly, the connective tissue progenitor marker prrx1 appears up-regulated in the eya2-/- blastemas (q-value <0.05). (f) Volcano plot with genes known for their role in G1/S transition of the cell cycle. The pink area depicts genes up-regulated in eya2+/+ samples whereas the green area depicts genes up-regulated in eya2-/- samples. Note that most of the genes significantly up-regulated beyond the cutoffs (q < 0.05, fold change (FC) >2) illustrated as dotted lines are in the eya2+/+ samples indicating faster cell cycle progression. (g) Volcano plot with genes known for their role in G2/M transition of the cell cycle. The pink area depicts genes up-regulated in eya2+/+ samples whereas the green area depicts genes up-regulated in eya2-/- samples. Note that most of the genes significantly up-regulated beyond the cutoffs (q < 0.05, fold change (FC) >2) illustrated as dotted lines are in the eya2+/+ samples indicating faster cell cycle progression.
Figure 5—figure supplement 1
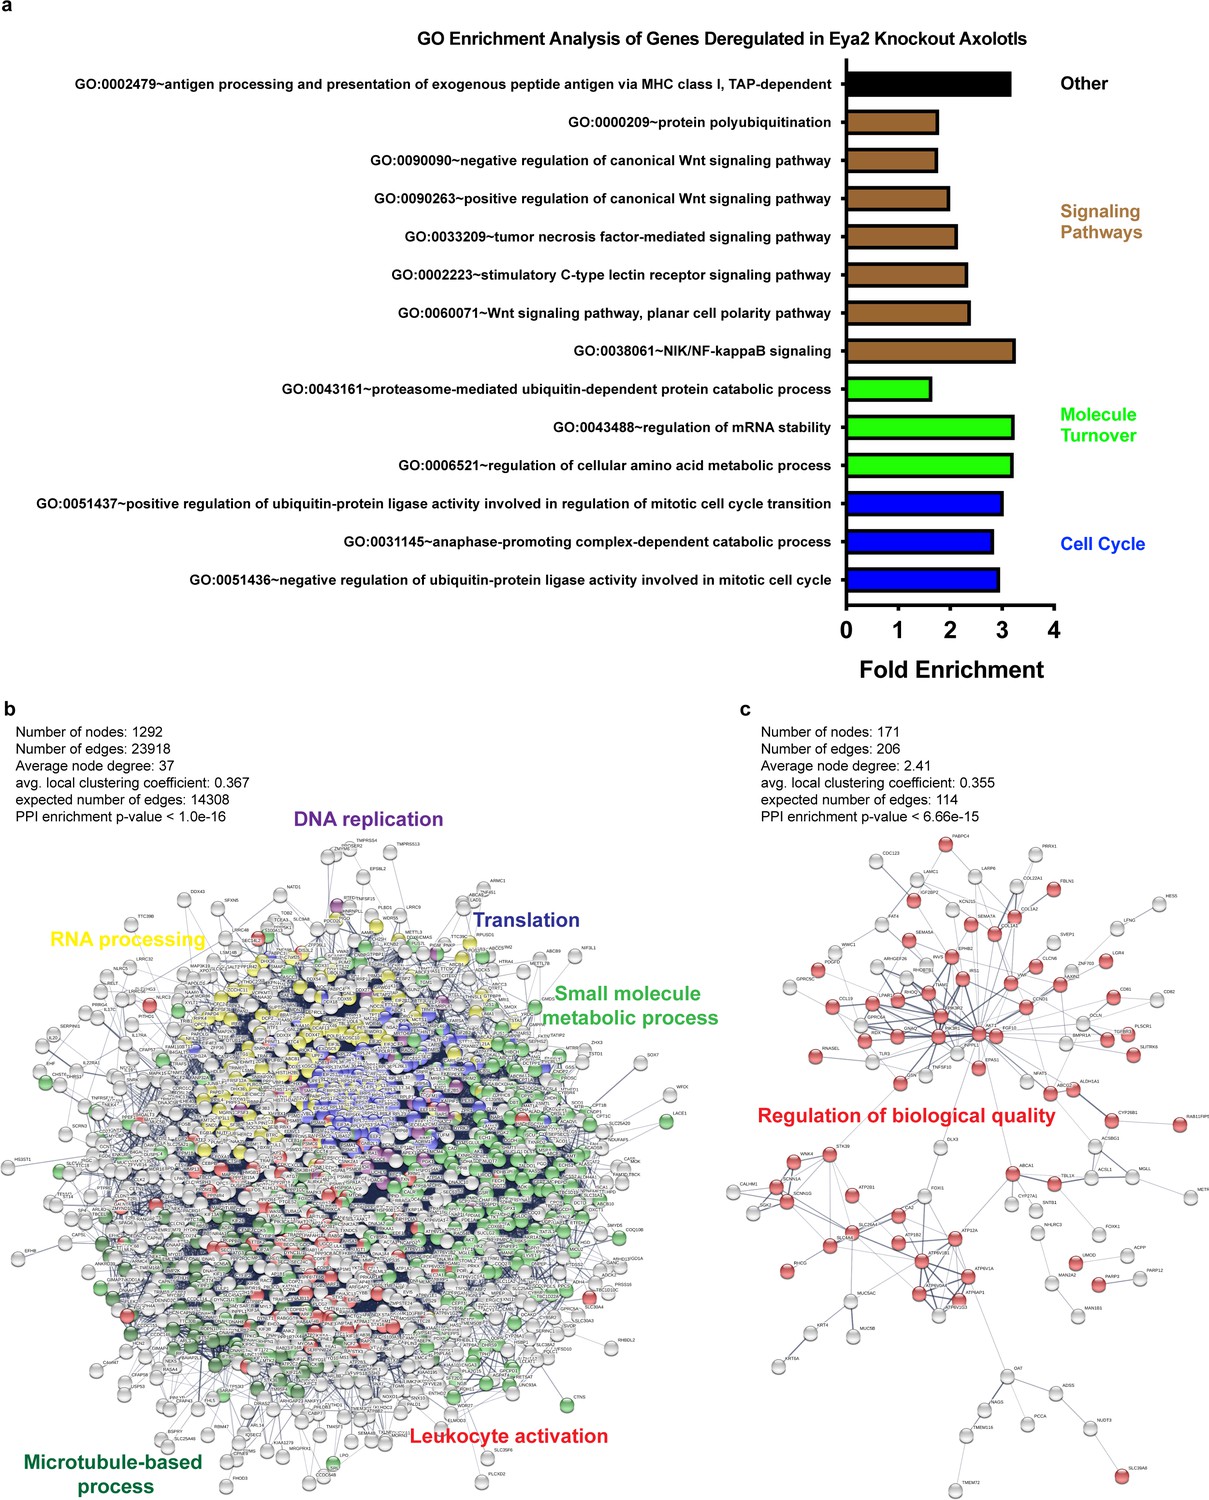
GO and network enrichment analysis of biological processes from genes deregulated in Eya2 mutant axolotls.
(a) GO enrichment analysis. Terms shown were identical to those previously predicted as associated with Eya2 using the co-expression correlation analysis (Figure 2—figure supplement 1). (b) Network analysis of genes down-regulated in eya2-/- tissues versus eya2+/+ (q < 0.01). Highlighted are important processes that validate our previous observations including cell cycle arrest (DNA replication in purple) and cellular stress (Translation in blue, small molecule metabolic process in green, RNA processing in yellow). (c) Network analysis of genes up-regulated in eya2-/- tissues versus eya2+/+ (q < 0.01). Highlighted are the genes associated with regulation of biological quality which may be implicated in attenuating the persistent DDR and bring cellular function to homeostasis.
Figure 6 with 1 supplement
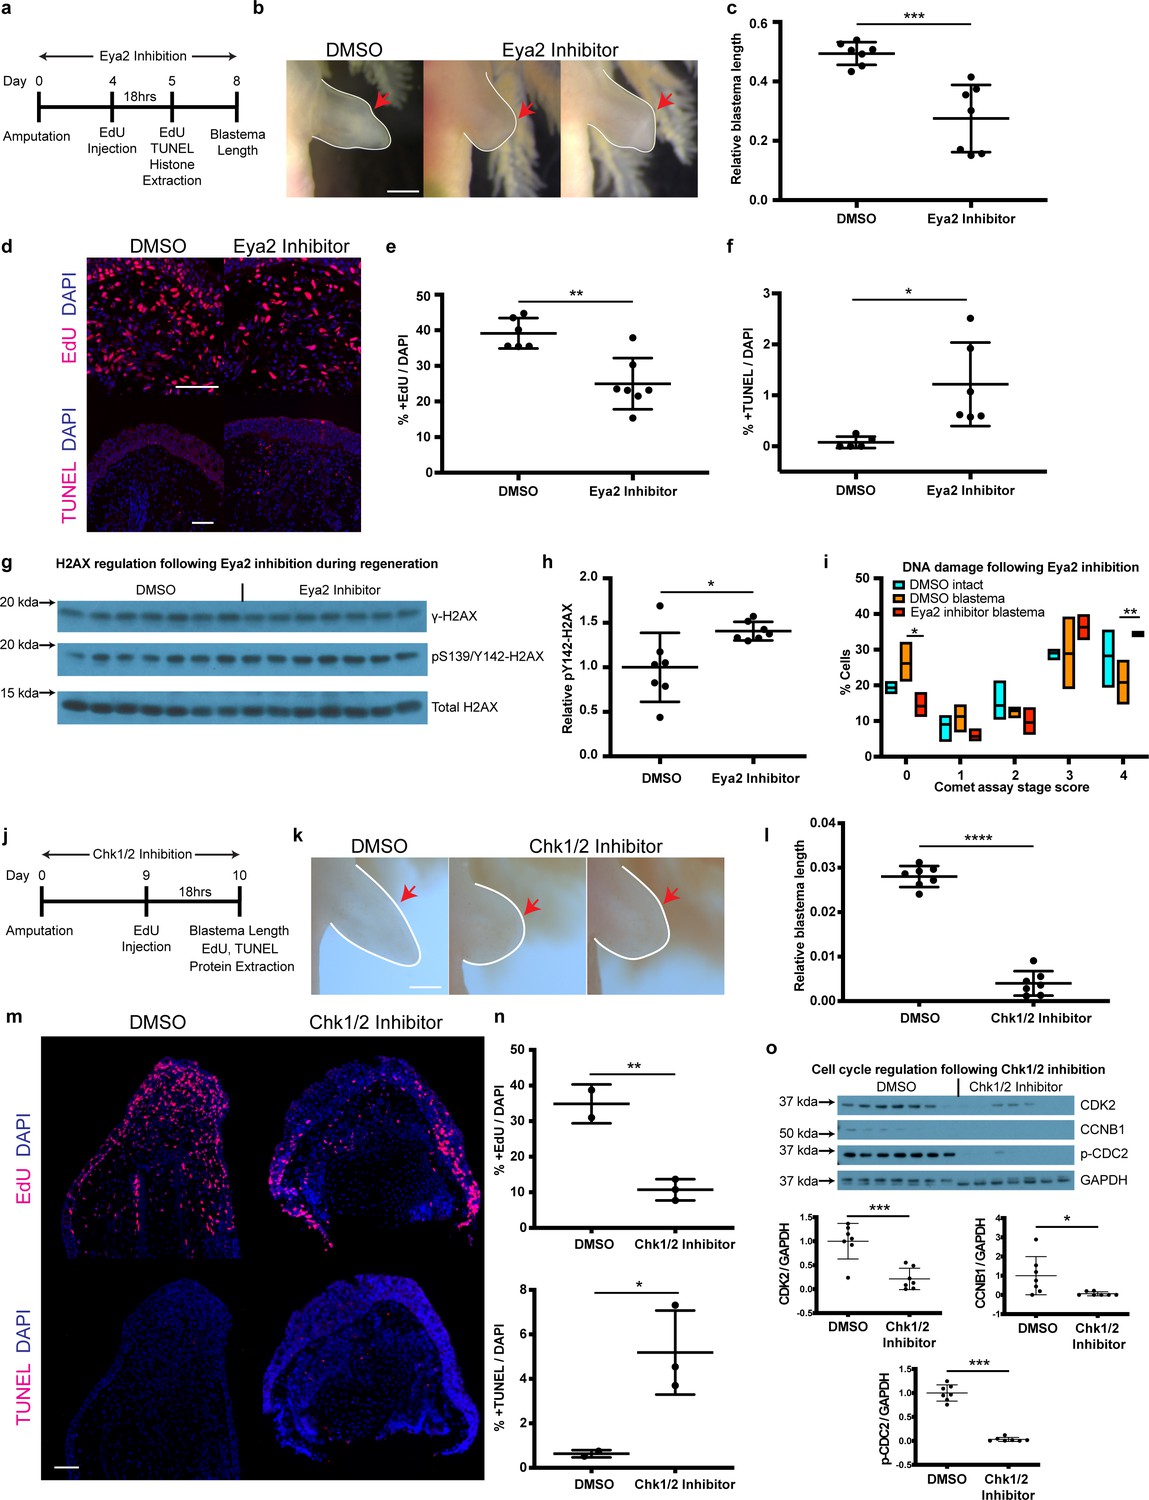
Pharmacological inhibition of Eya2 and Chk1/2 impairs regeneration, reduces cell proliferation, increases apoptosis and affects DDR.
(a) Experimental design of Eya2 inhibitor treatment: EdU was injected at 4 dpa and tissues were collected for immunofluorescence 18 hr later. EdU, TUNEL, Comet assay and histone extraction was performed at 5 dpa. Blastema length was measured at 8 dpa. (b) Representative images of blastema treated with DMSO and Eya2 inhibitor. Limbs are outlined in white line; red arrows indicate amputation plane. Scale Bar: 2 mm. (c) Quantification of blastema length from (b). Eya2 Inhibitor-treated blastema tissue is significantly smaller than DMSO-treated ones (Unpaired t test: p-value<0.001). (d) Representative images of 5 dpa blastema sections stained for DAPI (blue) and EdU or TUNEL (red) from animals treated with DMSO or Eya2 inhibitor. Scale Bars: 150 μm. (e) Quantification of percent +EdU cells from (d) top. Eya2 inhibitor-treated blastema tissues have significantly reduced number of cells entering the cell cycle (Unpaired t test: p-value<0.01). (f) Quantification of percent +TUNEL cells from (d) bottom. Eya2 inhibitor-treated blastema tissues have significantly increased number of cells undergoing apoptosis (Unpaired t test: p-value<0.05). (g) Western blot for H2AX and its phosphorylation status in 5 dpa blastema tissues from animals treated with DMSO or Eya2 inhibitor. (h) Quantification of relative pY142-H2AX levels from (g). Eya2 inhibitor-treated blastema tissues have significantly more relative pY142-H2AX levels indicating that we have successfully inhibited Eya2’s phosphatase domain (Unpaired t test: p-value<0.05). (i) Percent cells in each comet assay stage score category. A significantly bigger fraction of blastema cells treated with the Eya2 inhibitor show increased levels of DNA damage (Two-way ANOVA with Bonferroni’s multiple comparisons test: stage four comet assay score: DMSO Blastema vs Eya2 Inhibitor Blastema: p-value<0.01) while a significantly smaller fraction does not show signs of DNA damage (Two-way ANOVA with Bonferroni’s multiple comparisons test: stage 0 comet assay score: DMSO Blastema vs Eya2 Inhibitor Blastema: p-value<0.05). These data indicate that inhibiting Eya2 function upon amputation impairs regeneration rate by reducing cell cycle entry, increasing DNA damage, and triggering apoptosis in blastema cells. (j) Experimental design of Chk1/2 inhibitor treatment: EdU was injected at 9 dpa and tissues were collected for immunohistochemistry 18 hr later. At 10 dpa limbs were imaged to quantify blastema length and samples were collected for protein extraction. (k) Representative images of blastema treated with DMSO or Chk1/2 inhibitor. Scale Bar: 2 mm. (l) Quantification of blastema length from (k). Chk1/2 Inhibitor-treated blastema tissue is significantly smaller than DMSO-treated ones (Unpaired t test: p-value<0.0001). (m) Representative images of 10 dpa blastema sections stained for DAPI (blue) and EdU or TUNEL (red) from animals treated with DMSO or Chk1/2 inhibitor. Scale Bars: 125 μm. (n) Top: Quantification of percent +EdU cells from (m) top. Chk1/2 inhibitor-treated blastema tissues have significantly reduced number of cells entering the cell cycle (Unpaired t test: p-value<0.01). Bottom: Quantification of percent +TUNEL cells from (m) bottom. Chk1/2 inhibitor-treated blastema tissues have significantly increased number of cells undergoing apoptosis (Unpaired t test: p-value<0.05). (o) Western blot analysis of cell cycle regulators following Chk1/2 inhibition. CDK2, CCNB1, p-CDC2 and GAPDH levels were examined. CDK2 levels were significantly reduced in 10 dpa blastema upon Chk1/2 inhibition compared to DMSO controls (Unpaired t test: p-value<0.001). CCNB1 levels were significantly reduced upon Chk1/2 inhibition (Unpaired t test: p-value<0.05). P-CDC2 levels were significantly reduced upon Chk1/2 inhibition (Unpaired t test: p-value<0.05). These data indicate proper regulation of DDR through the major DNA damage checkpoints controlled by Chk1/2 is important for tissue regeneration. ns denotes p-value>0.05, * denotes p-value<0.05, ** denotes p-value<0.01, *** denotes p-value<0.001, **** denotes p-value<0.0001. Vertical bars on plots represent SEM.
Figure 6—figure supplement 1
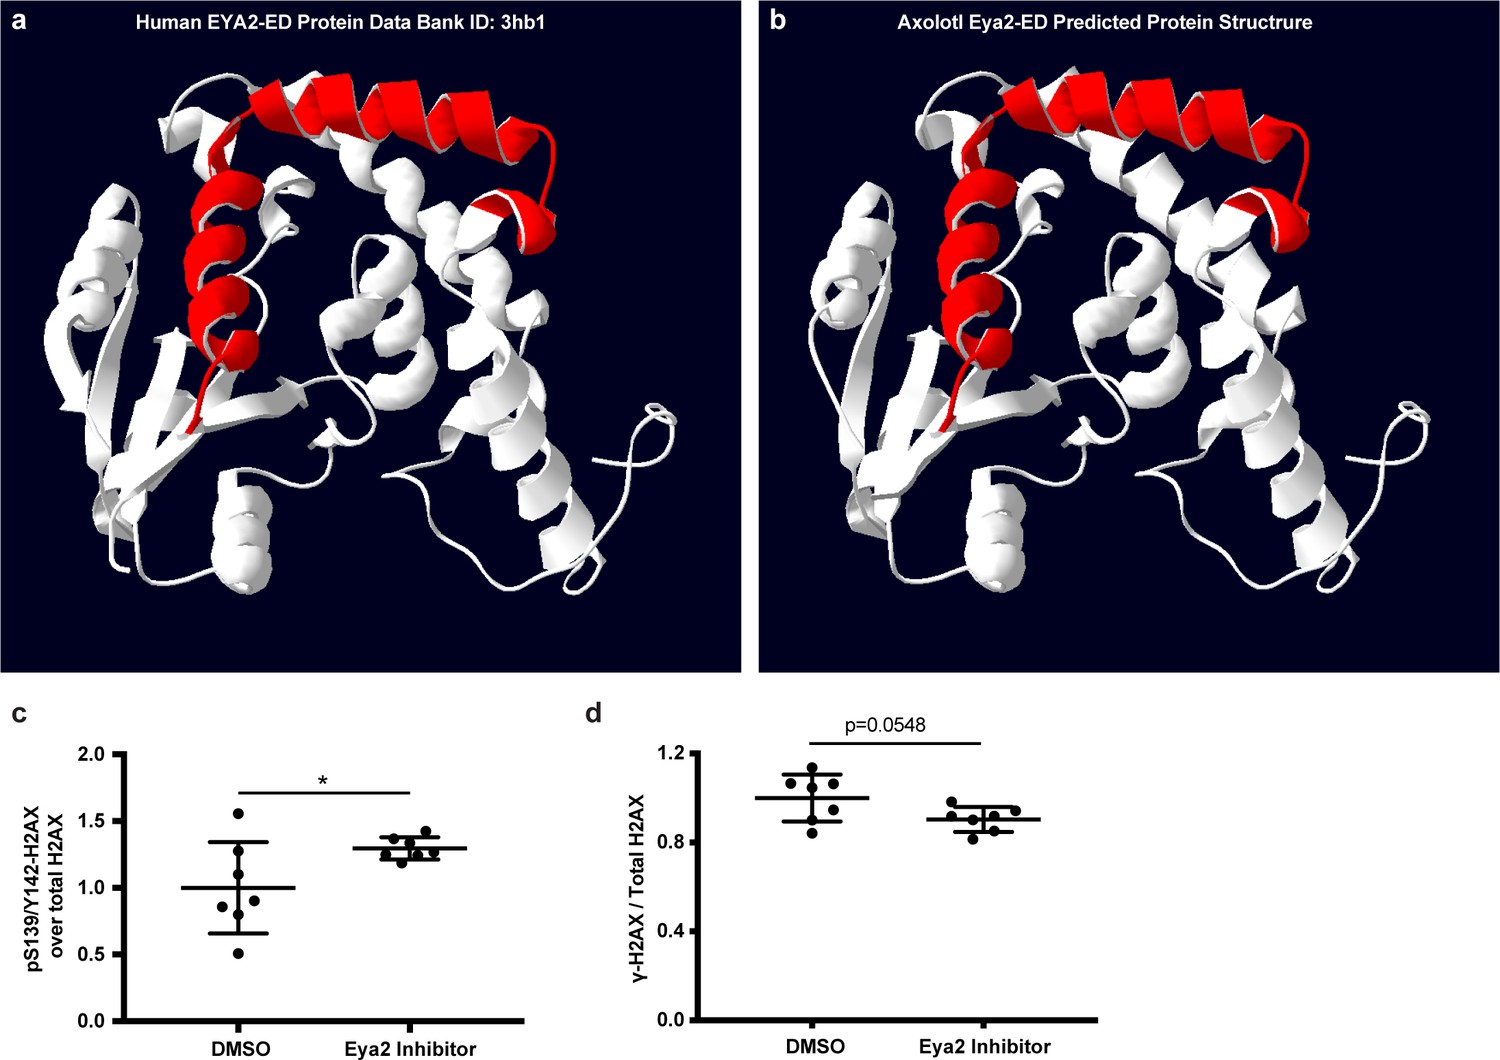
Eya2 protein structure visualization and H2AX quantification of Figure 6g.
(a) Human EYA2-ED protein structure. (b) Predicted axolotl Eya2-ED protein structure. (a,b), Red helices denote important areas required for binding of the Eya2 phosphatase inhibitor MLS000544460. The data indicate that the inhibitor could bind to the axolotl Eya2. (c) Quantification of relative pS139/Y142-H2AX levels from Figure 6g. (d) Quantification of relative γ-H2AX levels from Figure 6g. ns denotes p-value>0.05, * denotes p-value<0.05, ** denotes p-value<0.01, *** denotes p-value<0.001, **** denotes p-value<0.0001. Vertical bars on plots represent SEM.
Figure 7
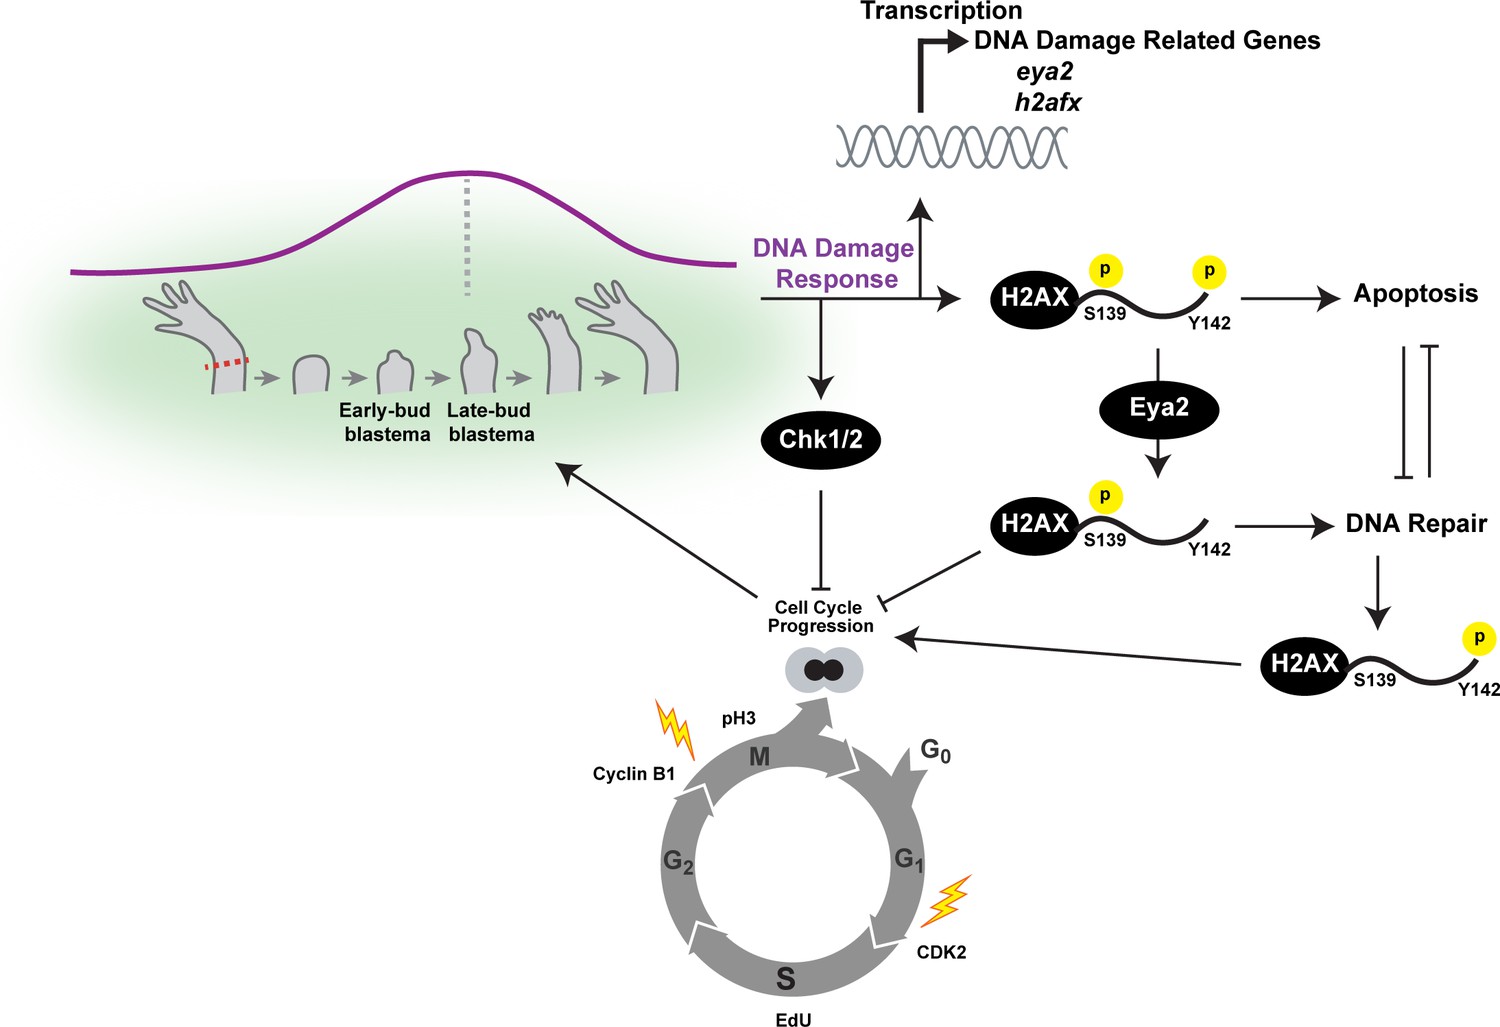
Overview of the connections between Eya2, DDR and regeneration.
Upon limb amputation, we found that there is up-regulation of genes associated with DNA damage response which peak at the late-bud blastema (purple line). When we inhibited the function of the serine/threonine-protein kinase Chk1 and Chk2 which regulate G1/S and G2/M transitions upon DNA damage, regeneration was inhibited. Interestingly, we found that cell cycle progression was severely impaired with reduction of EdU+ cells and diminishing of cell cycle regulators like CDK2 and Cyclin B1. These data indicated that proper DNA damage response is important for tissue regeneration. This hypothesis was further supported by the dynamic regulation of the DNA damage mediator protein H2AX, especially in progenitor cells that have entered the cell cycle. To further study the role of DDR during regeneration, we genetically ablated one of its components. We chose eya2 as our target because (1) was found up-regulated during regeneration, and (2) is known to regulate DNA repair by dephosphorylating H2AX at the Y142 amino acid. We found that in the absence of Eya2, there is a robust up-regulation of γ-H2AX levels at the tissue level and the number of nuclear γ-H2AX foci at the cellular level. This indicated an increase in genotoxic stress which was also corroborated transcriptome-wide using RNAseq. Interestingly, the increase in γ-H2AX levels was not associated with an increase of DNA damage accumulating in blastema cells indicating that the observed phenotype was due to deregulation of the DNA damage response by allowing persistent γ-H2AX. We found that this molecular signature resulted in inhibition of the cell cycle progression which ultimately affected the regeneration rate. We further explored the role of Eya2 in regulating DDR and cell cycle progression by utilizing an Eya2 inhibitor. Our data indicate that Eya2 inhibition significantly impaired limb regeneration by de-regulation of H2AX phosphorylation status, decrease in cell cycle progression, higher levels of DNA damage and triggering of apoptosis in blastema cells. Together, our data indicate that Eya2 is a critical modulatory protein that mediates cell cycle progression by properly regulating DDR and its function is important for understanding how highly regenerative organisms like axolotls are able to efficiently regrow tissues without compromising their genomic integrity and cellular potency.
Additional files
-
Supplementary file 1
DNA damage response analysis.
This file contains gene expression data related to DDR from high-throughput studies. DDR Genes: Data related to Figure 1a and Figure 1—figure supplement 1a. DDR Analysis – Figure 1b: Data related to Figure 1b. DDR Analysis Eya2- RNAseq: Data related to Figure 5b.
- https://cdn.elifesciences.org/articles/51217/elife-51217-supp1-v2.xlsx
-
Supplementary file 2
Eya2 co-expression correlation analysis and Gene Ontology enrichment.
This file contains data used for the eya2 co-expression correlation analysis during regeneration presented in Figure 2d and Figure 2—figure supplement 1. +Correlation Eya2: Gene expression over time, R (Vitale et al., 2017) and slope values for genes positively correlated with eya2. GO Enrichment +Correlation: Enriched GO Terms from the +Correlation Eya2 dataset. -Correlation Eya2: Gene expression over, R2 and slope values for genes negatively correlated with eya2. GO Enrichment -Correlation: Enriched GO Terms from the – Correlation Eya2 dataset.
- https://cdn.elifesciences.org/articles/51217/elife-51217-supp2-v2.xlsx
-
Supplementary file 3
RNAseq data with genotype and naïve expression analysis, Gene Ontology enrichment and protein network analysis.
This file contains data related to the RNAseq performed in Eya2 mutant axolotls during regeneration. Data are presented in Figure 5, and Figure 5—figure supplement 1. Expression values are given as TPMs. Expression – qvalue: All expression values, annotation, and qvalues using both our analysis per sample. GO Analysis q < 0.01 down: GO analysis using genes differentially expressed between eya2 genotypes. Network Analysis q < 0.01 down: Enriched terms and associated genes found down-regulated in eya2-/-. Network Analysis q < 0.01 up: Enriched terms and associated genes found up-regulated in eya2-/-. G1 S Volcano Plot: Genes related to G1/S transition and used in Figure 5. G2 M Volcano Plot: Genes related to G2/M transition and used in Figure 5.
- https://cdn.elifesciences.org/articles/51217/elife-51217-supp3-v2.xlsx
-
Supplementary file 4
Statistical analysis used throughout the paper.
This file contains the statistical analysis (statistical tests and all values related to the statistical test including number of samples tested (n)) used for each Figure and panel. Tabs are labeled based on the Figure and Figure Panel they are referring to.
- https://cdn.elifesciences.org/articles/51217/elife-51217-supp4-v2.xlsx
-
Transparent reporting form
- https://cdn.elifesciences.org/articles/51217/elife-51217-transrepform-v2.docx
Download links
A two-part list of links to download the article, or parts of the article, in various formats.
Downloads (link to download the article as PDF)
Open citations (links to open the citations from this article in various online reference manager services)
Cite this article (links to download the citations from this article in formats compatible with various reference manager tools)
Eya2 promotes cell cycle progression by regulating DNA damage response during vertebrate limb regeneration
eLife 9:e51217.
https://doi.org/10.7554/eLife.51217


