Notochord vacuoles absorb compressive bone growth during zebrafish spine formation
- Duke University, United States
- University of California, San Francisco, United States
- Boston College, United States
- Max Planck Institute for Heart and Lung Research, Germany
Figures
Figure 1 with 1 supplement
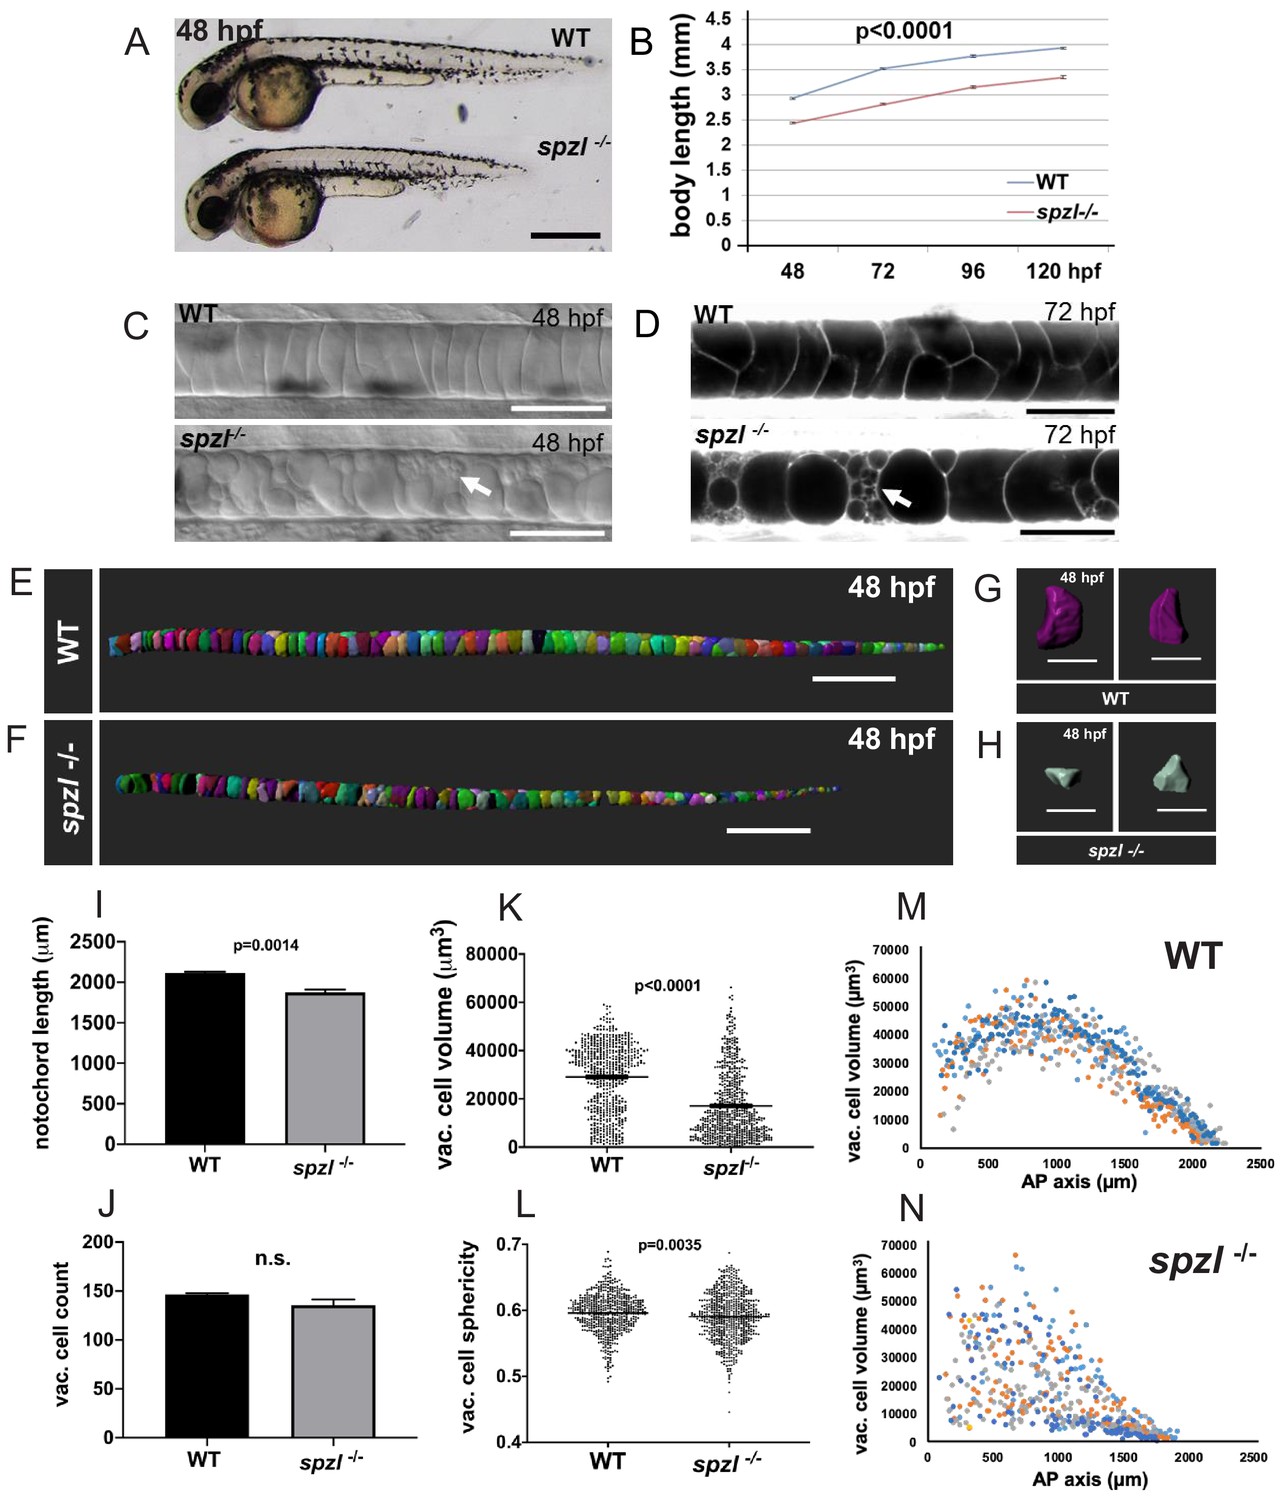
spzl is a recessive mutation which causes notochord vacuole fragmentation, impaired axis elongation, and altered vacuolated cell packing.
(A) Whole mount lateral view of 48 hpf spzl-/- (bottom) and WT sibling (top) embryos. Scale bar = 500 µm. (B) Body length measurements (mm) from 48 to 120 hpf. n = 30 for WT and n = 27, n = 30, n = 29, n = 28 for spzl-/- respectively. p<0.0001 at all time points, two-way ANOVA with Sidak’s test. At 24 hpf spzl mutant embryos (n = 20) are also significantly shorter than WT (n = 15), p=0.001, unpaired t-test using Welch’s correction. (C) Live DIC images of 48 hpf WT (top) and spzl-/- (bottom) embryos. Arrow points to fragmented vacuoles. Scale bars = 50 µm. (D) Live confocal images of 72 hpf WT (top) and spzl-/- (bottom) notochords stained with Cell Trace to visualize internal membranes. Arrow points to area of vacuole fragmentation. Scale bars = 50 µm. (E–F) Notochord 3D reconstructions for 48 hpf WT (E) and spzl-/- (F) embryos. Scale bar = 200 µm. (G–H) Single cell 3D reconstructions for WT (G) and spzl-/- (H) visualized at different angles to show cell shape. Scale bar = 50 µm. (I) Notochord length measurements for WT and spzl-/- at 48 hpf. (J) Total number of vacuolated cells in WT and spzl-/- at 48 hpf. (K) Plot of cell volume measurements of WT and spzl-/- notochord cells at 48 hpf. (L) Sphericity of individual notochord cells for WT and spzl-/- at 48 hpf. (M–N) Volume of notochord cells along the AP axis of WT and spzl-/- at 48 hpf. p-values were determined by an un-paired t-test using Welch’s correction.
Figure 1—figure supplement 1
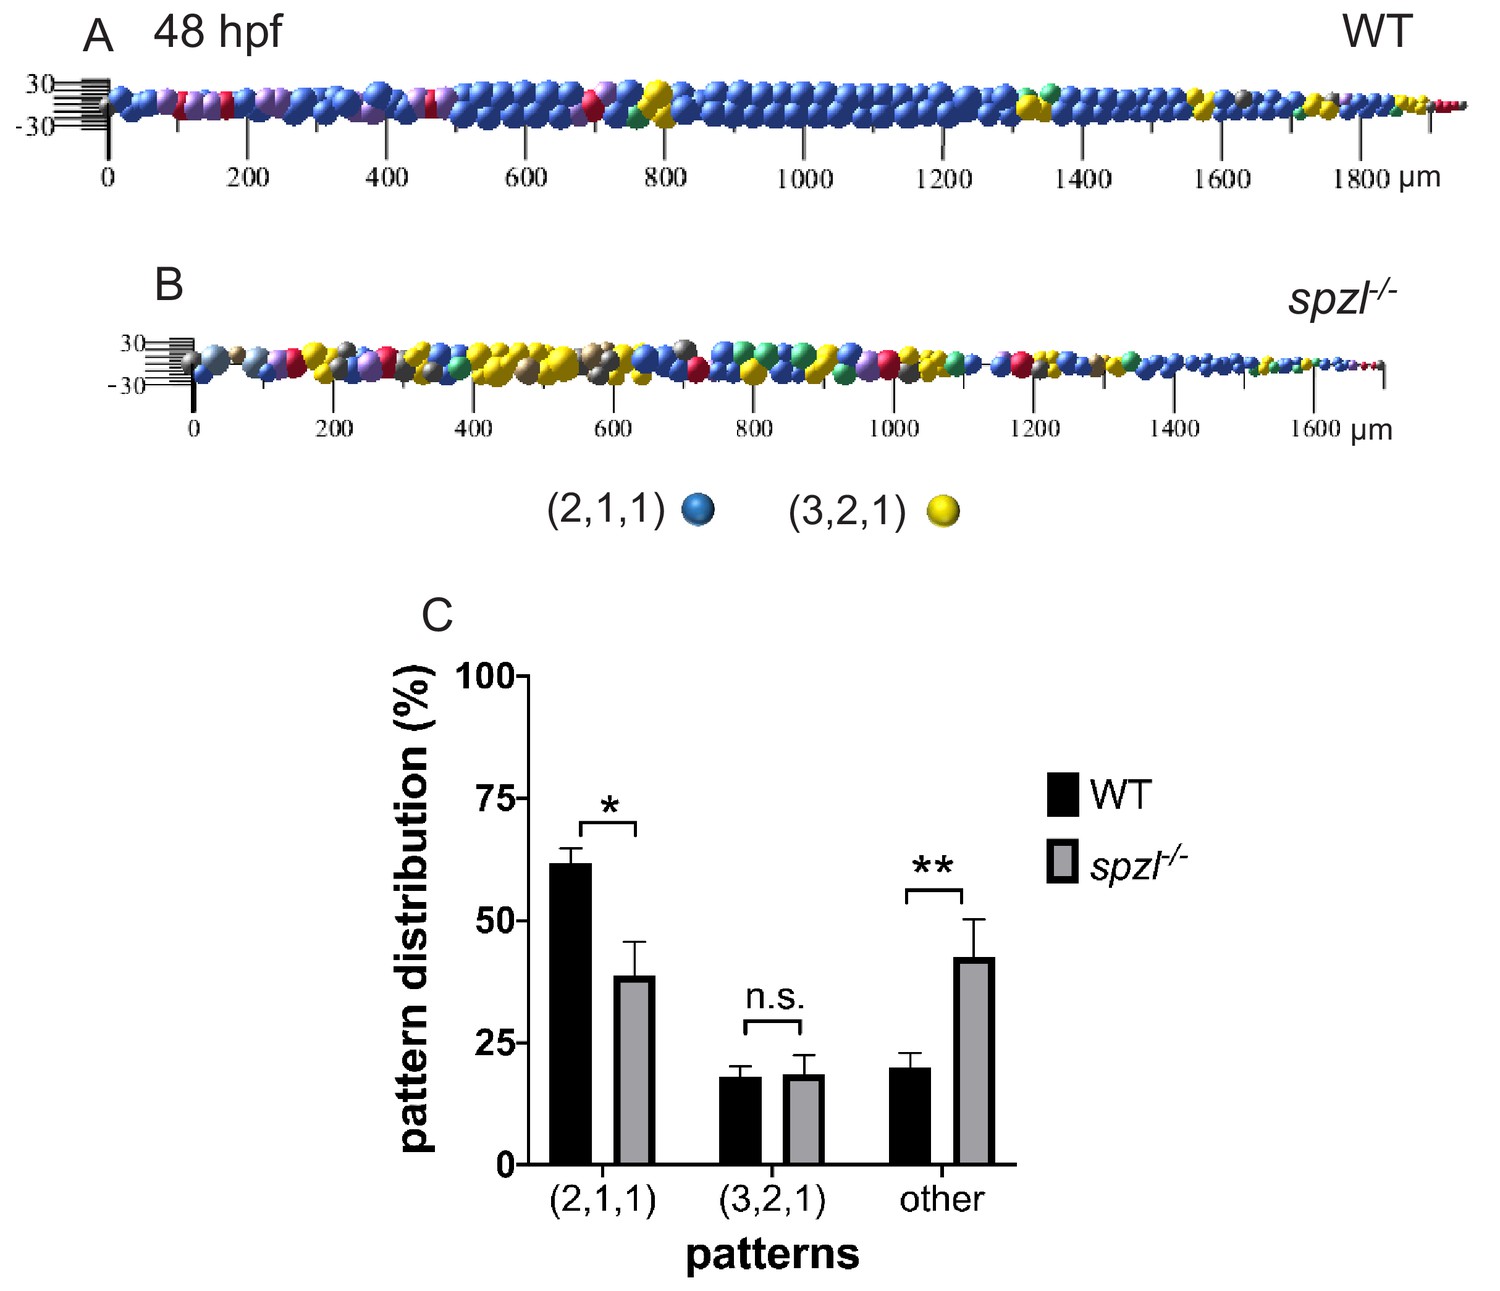
Vacuolated cell arrangement is altered in spzl mutants.
(A) Sphere plot depicting cellular arrangements in WT at 48 hpf. (B) Sphere plot depicting cellular arrangements in spzl-/- at 48hpf. (C) Distribution of patterns in 48 hpf for WT (n = 4) and spzl-/-n = 5). Paired t-test, *p=0.0254, **p=0.0389.
Figure 2 with 1 supplement
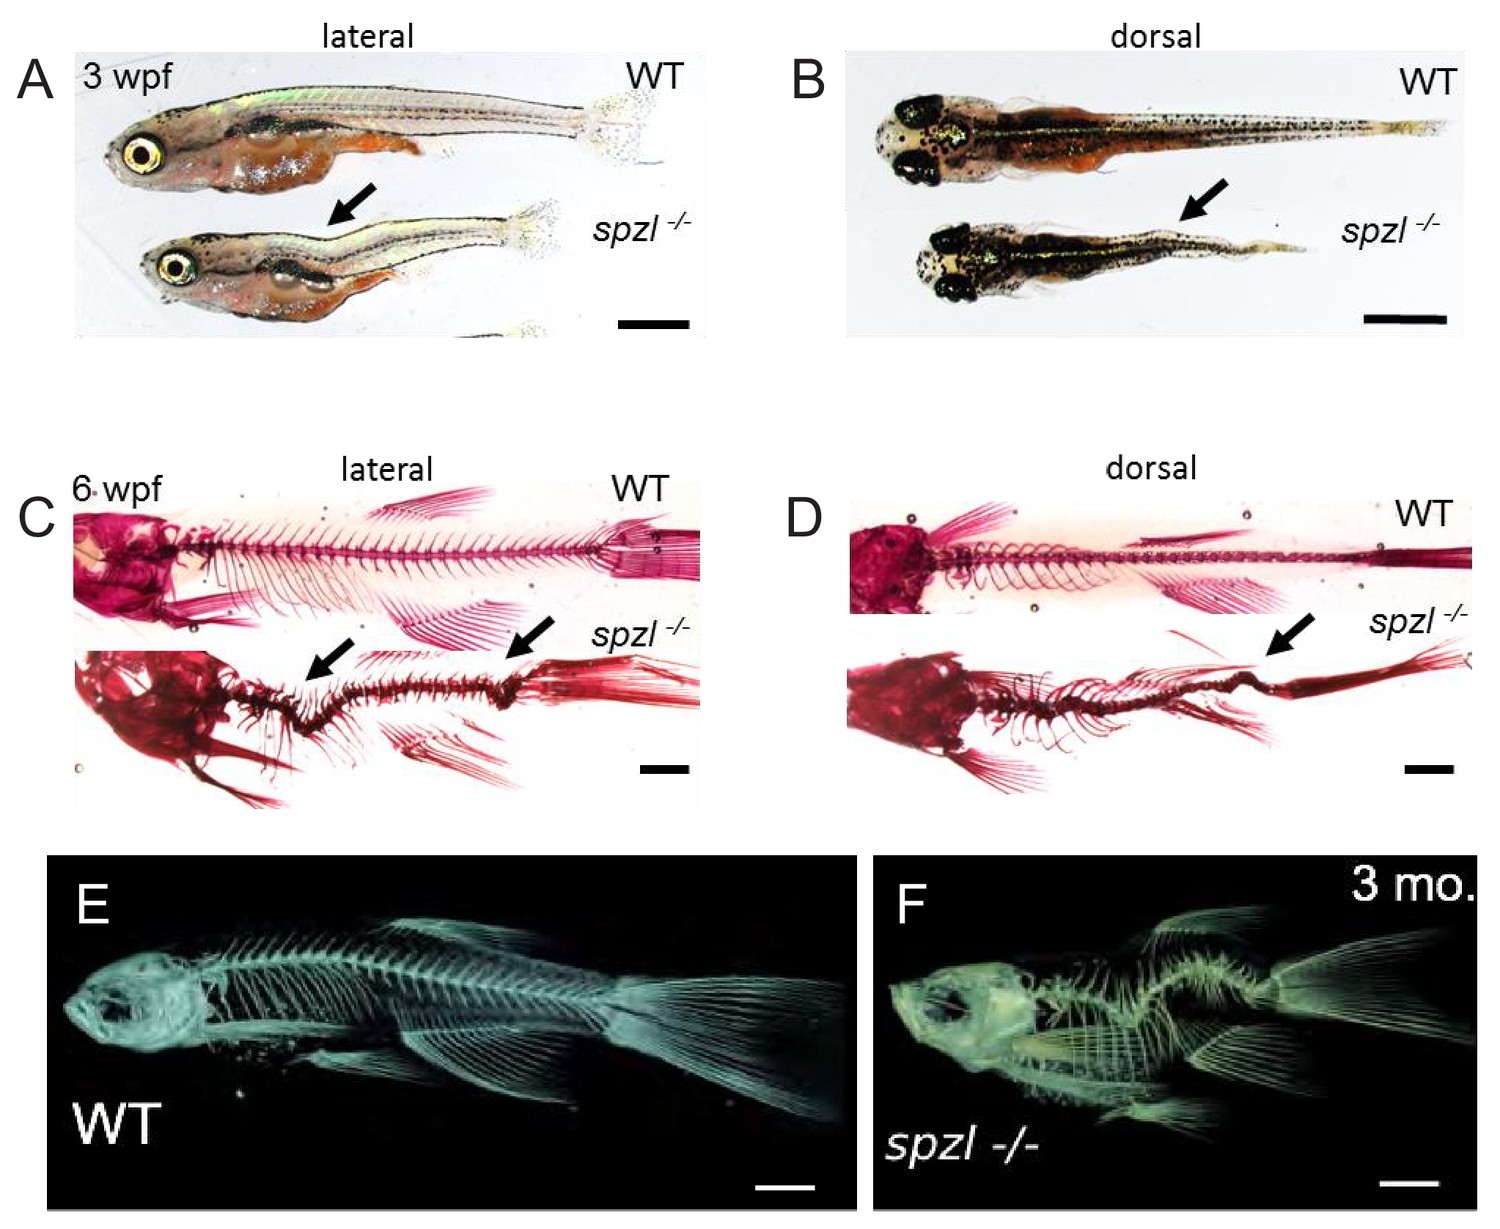
spzl mutants present spine kinks at juvenile and adult stages.
(A–B) Whole mount lateral and dorsal views of 3 wpf WT and spzl-/- fish. Scale bars = 1 mm. (C–D) Lateral and dorsal views of 3 wpf WT and spzl-/- fish stained with alizarin red to visualize the mineralized skeleton. Scale bars = 1 mm. Arrows point to kinks in the axis. (E–F) μCT images of 3 month old WT and spzl-/- adult fish. Scale bars = 2 mm.
Figure 2—figure supplement 1
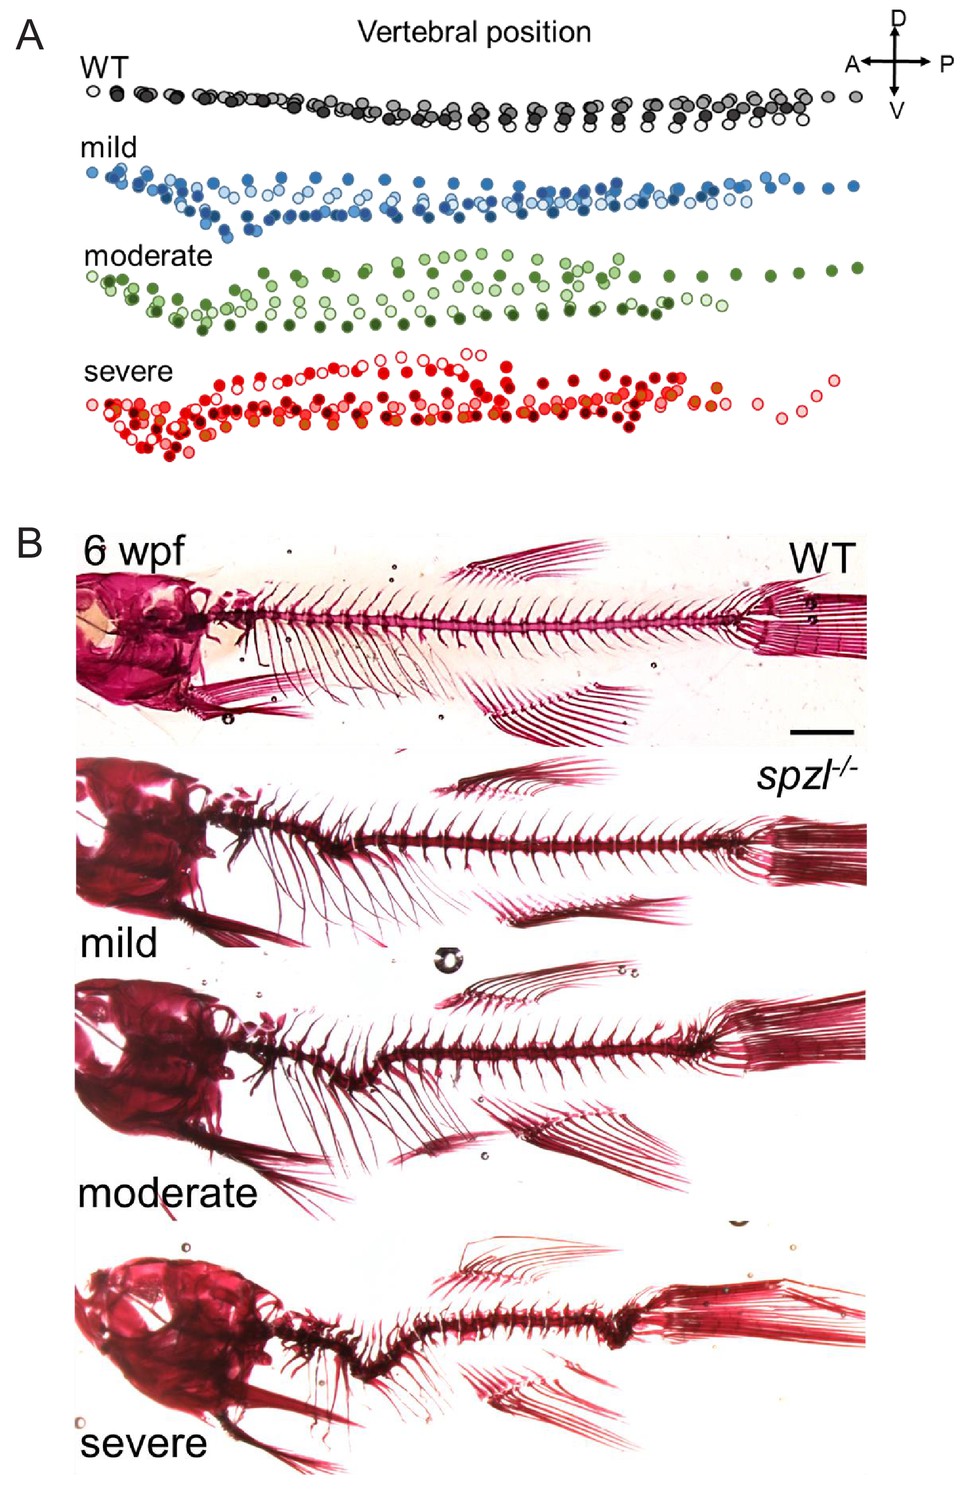
Spine defects in spzl mutants.
(A) Diagram depicting the skeletal traces of WT and spzl-/-at 6wpf. Each dot represents a single vertebra. (B) Alizarin red stained skeletal preparations of representative 6wpf WT and spzl-/- mutants scored in (A).
Figure 3 with 1 supplement
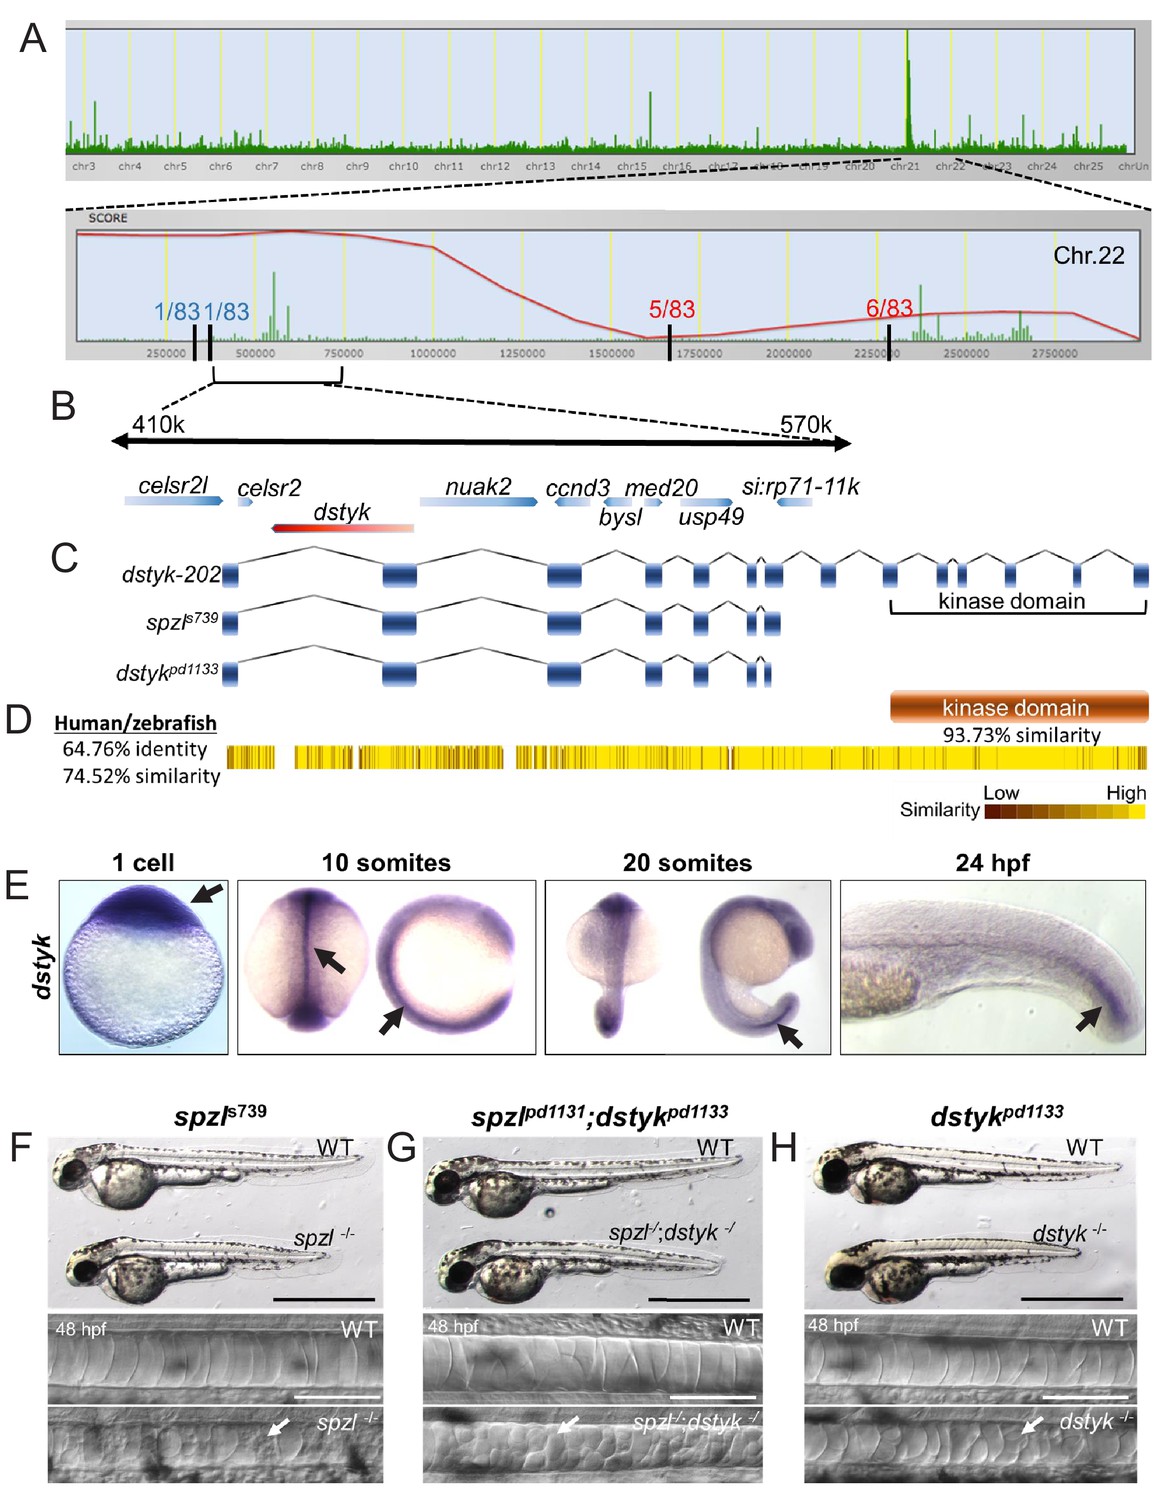
Loss of Dstyk function causes the spzl phenotype.
(A) Genome view of SNPtrack linkage analysis of exome sequencing data. The spzl locus maps to chromosome 22 (top panel), with a high probability interval (red line) centered around 410–570 Kbps. Recombination events with a panel of 83 mutants at either side of the spzl locus define a ~ 1.2 Mb critical interval. (B) Genome organization of the critical genomic interval near the spzl locus. A nonsense mutation generates an early stop codon in dstyk. (C) Cartoon depicting predicted gene product structure of dstyk-202, spzls739 and the Crispr/Cas9 generated dstykpd1133 allele. (D) Dstyk is a Ser/Thr and Tyr kinase. Heat map depicting amino acid similarity between the human and zebrafish proteins. The kinase domain (highlighted) is 93.73% similar. (E) In situ hybridization for dstyk expression at the 1 cell stage, 10 somites, 20 somites, and 24 hpf, respectively. Arrows point to highly expressing areas of the notochord. (F–H) Bright field images of spzl-/-and WT sibling, spzl;dstykpd1133-/- and WT sibling, dstykpd1133 homozygous mutant and WT sibling, scale bars = 1 mm. DIC images of the notochord of 48 hpf embryos. Arrows point to fragmented vacuoles. Scale bars are 100 µm.
Figure 3—figure supplement 1
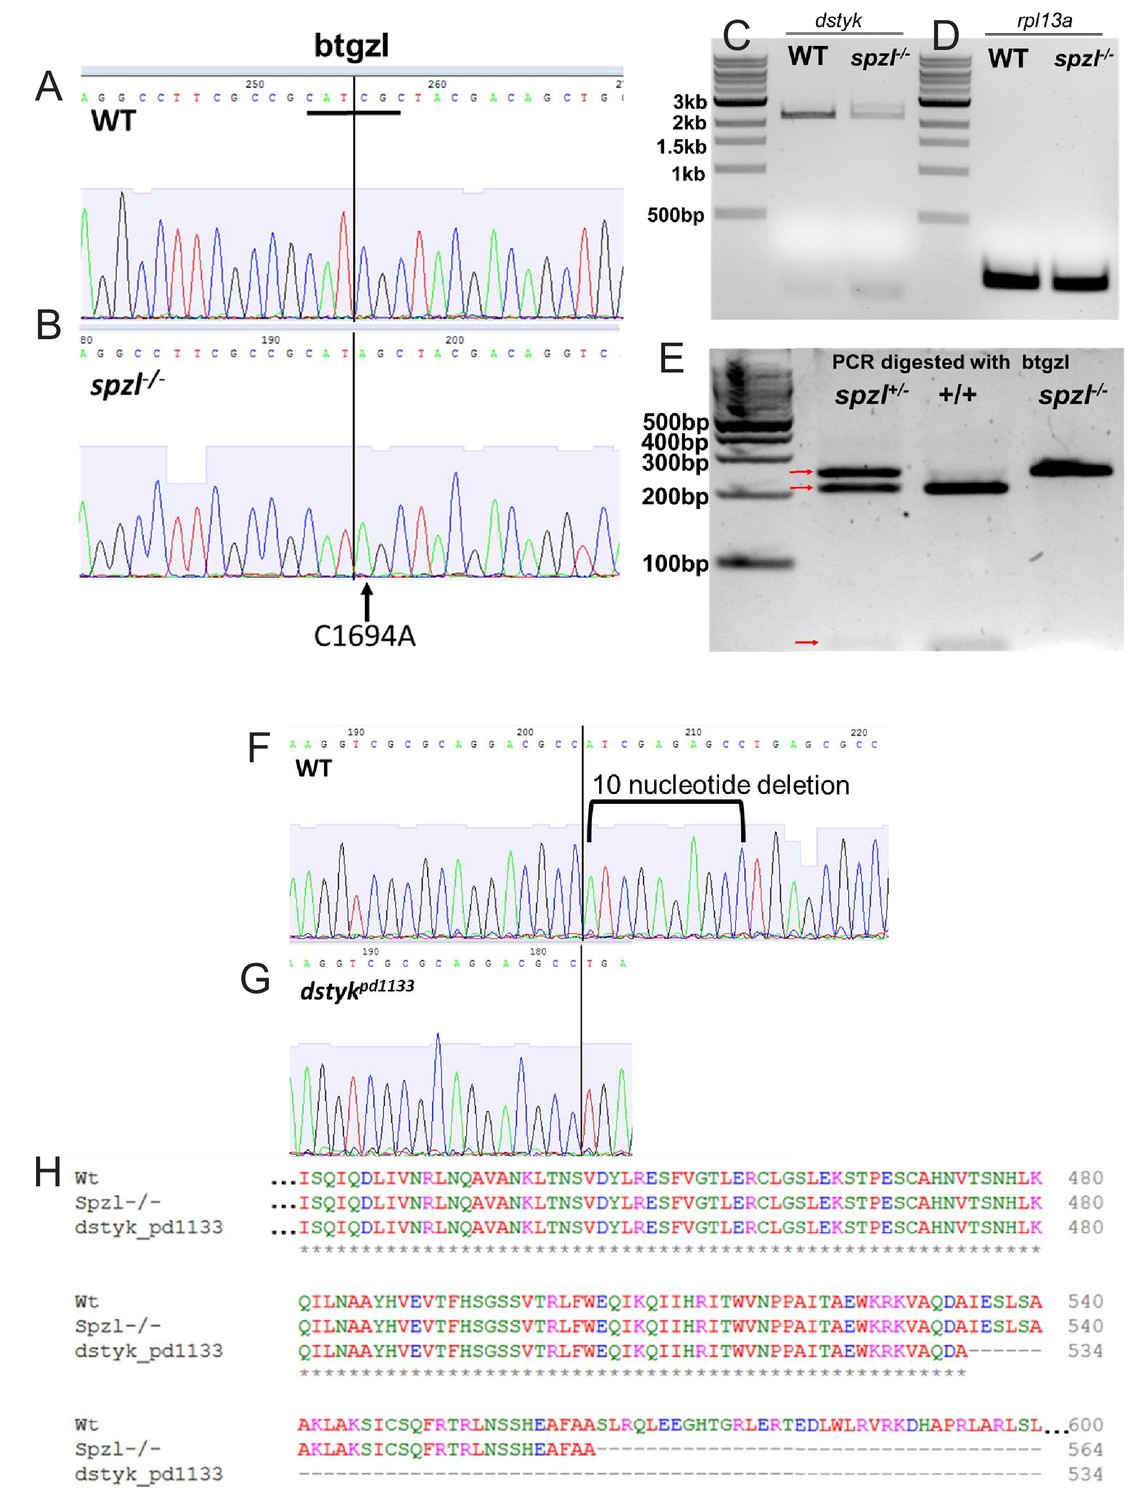
Characterization of spzl and dstyk mutant alleles.
(A) Chromatogram of WT sequence. The genotyping enzyme btgzI cut site is marked with a black line. (B) Chromatogram of spzl-/- sequencing. C1694A is marked with an arrow. (C) dstyk RT-PCR of 7 dpf WT and spzl-/- cDNA. (D) rpl13a RT-PCR of 7dpf WT and spzl-/- cDNA (E) Genotyping pcr for spzl+/-, WT, and spzl-/-. Arrows point to btgzI digestion products. (F) Chromatogram for the WT dstyk sequence. Bracket indicates area of 10 bp deletion in the dstykpd1133 mutant. (G) Chromatogram of dstykpd1133 sequence. (H) Protein alignment of dstyk, spzls739, and dstykpd1133.
Figure 4 with 1 supplement
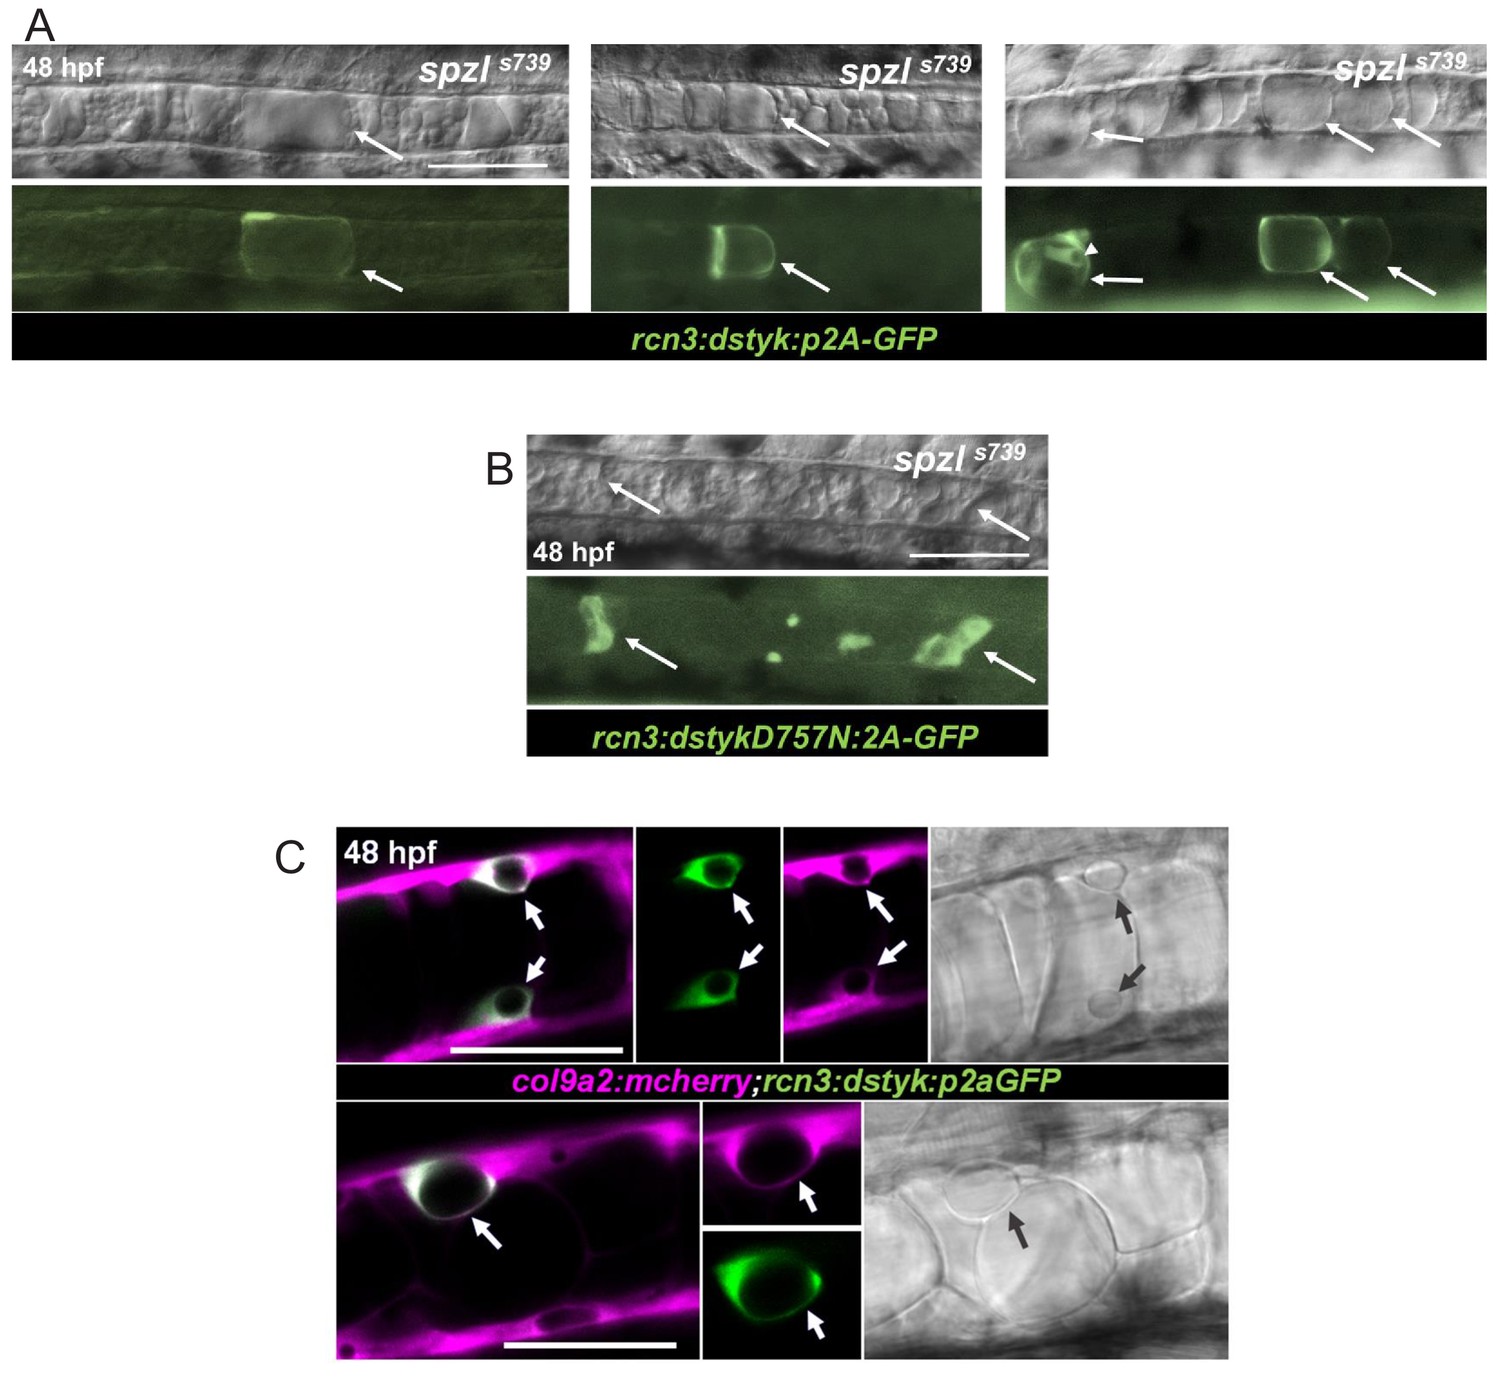
Dstyk’s kinase activity is required cell-autonomously for vacuole formation.
(A) Live DIC image (top) and live fluorescent image (bottom) of spzl mutants injected with a construct driving dstyk:p2aGFP expression in the notochord. The arrows point to GFP expressing cells with rescued vacuole integrity. Arrow head points to an expressing sheath cell that also develops a vacuole. WT dstyk rescued vacuole integrity in 90% of expressing cells (n = 30). Scale bar = 100 µm. (B) Live DIC image (top) and fluorescent image (bottom) of a spzl-/- embryo injected with dstykD757N:p2aGFP, a construct driving a (D757N) kinase dead version of dstyk in the notochord. Expressing cells (arrows) exhibit fragmented vacuoles and only 5% rescue (n = 20). Scale bar = 100 µm. (C) Confocal and DIC images of WT embryos at 48 hpf expressing col9a2:mcherry in the notochord sheath and injected with dstyk:p2aGFP. Sheath cells expressing dstyk:p2aGFP develop a vacuole. Arrows point to the vacuole. Scale bar = 50 µm.
Figure 4—figure supplement 1
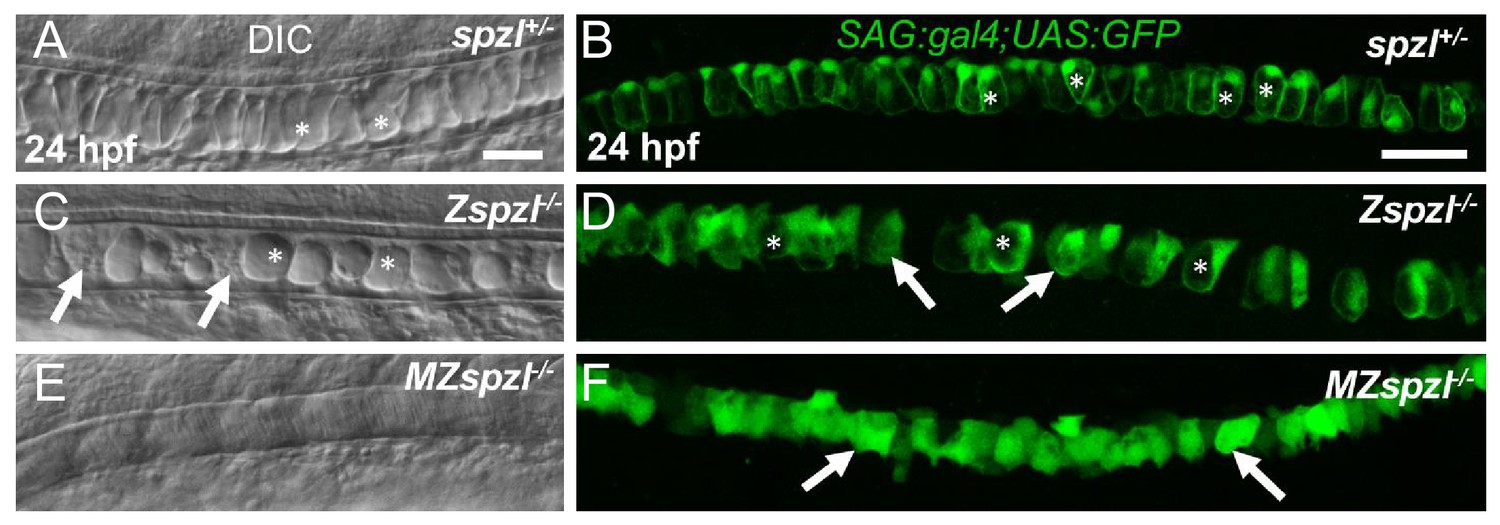
Maternal zygotic embryos completely lack inflated vacuoles.
(A,C,E) DIC images of 24 hpf spzl+/-, zygotic spzl-/-, and maternal zygotic spzl-/- embryos respectively. (B,D,F) Live confocal images of 24 hpf spzl+/-, zygotic spzl-/-, and maternal zygotic spzl-/- embryos respectively expressingSAG:gal4;UAS:GFP in the notochord. Asterisks indicate inflated vacuoles. Arrows point to areas lacking fully inflated vacuoles.
Figure 5 with 1 supplement

Dstyk regulates fusion of pre-vacuolar carriers with the notochord vacuole.
(A–B) Maximum projection of a light sheet microscopy live image of WT and spzl-/- embryos at 48hpf and 65hpf, respectively. (C–D) Still images from a 17 hr light sheet movie of a WT and spzl-/- embryos zebrafish embryo during vacuole biogenesis depicting vacuole fusion events. Vacuole membranes are labeled by NFATC:gal4;UAS:GFPrab32 expression. Arrows point to GFP-Rab32 positive vesicles. Arrowheads point to large vesicle (vacuolinos) docking events. n = 2 animals per genotype. Asterisks mark fusion events. Scale bar = 100 µm.
Figure 5—figure supplement 1
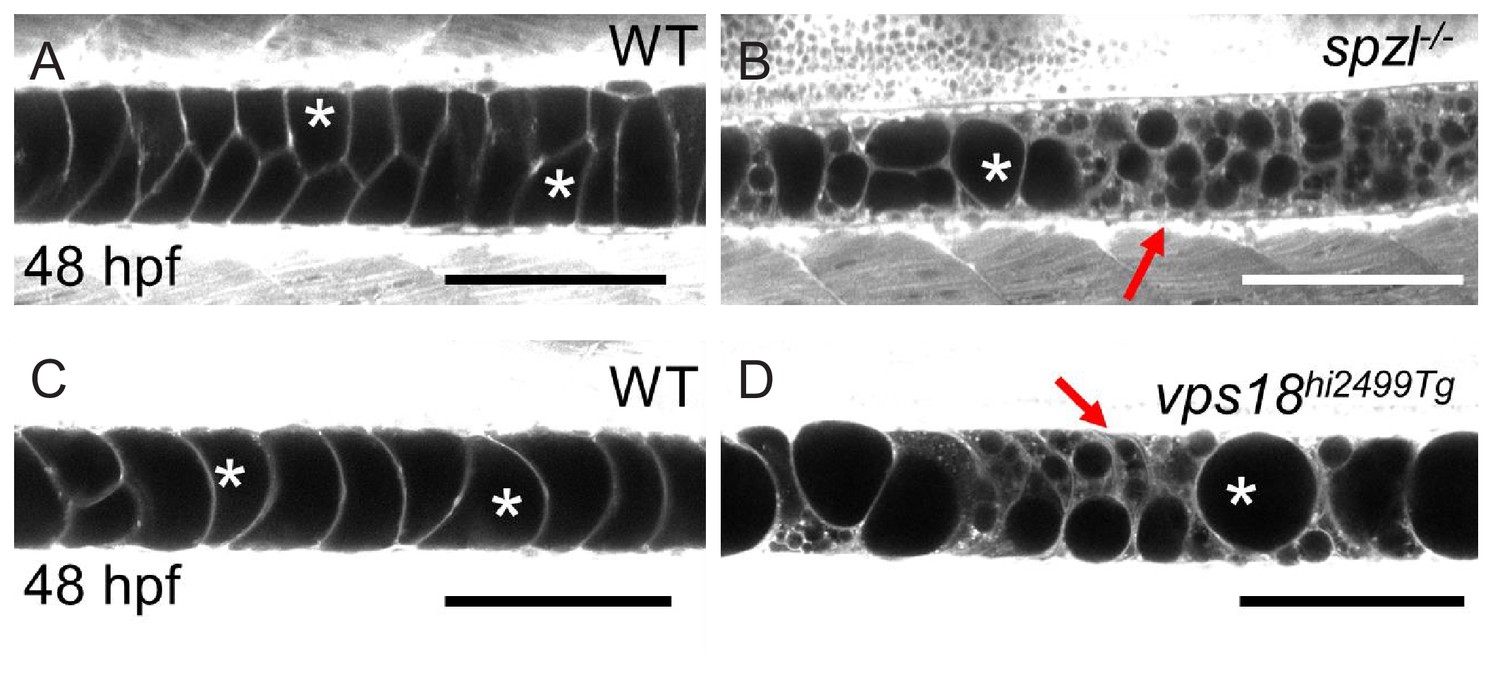
vps18 mutants exhibit a vacuole fragmentation phenotype similar to that of spzlmutants.
(A) Live confocal image of a 48 hpf WT embryo stained with Cell Trace. (B) Live confocal image of a 48 hpf spzl mutant stained with Cell Trace. (C) Live confocal image of a 48 hpf WT embryos stained with Cell Trace. (D) Live confocal image of a 48 hpf vps18hi2499Tg mutant embryo. Arrows point to areas of vacuole fragmentation. Asterisks mark fully inflated vacuoles. Scale bar = 100 µm.
Figure 6

Notochord vacuoles absorb compressive vertebral bone growth.
(A) Optical sections (left panels) of a live confocal time course during spine formation in WT fish expressing GFP in the vacuolated cells of the notochord and mCherry-NTR in osteoblasts. Asterisks mark the lumen of large vacuoles. Arrows point to vacuoles that re-orientate as they are being squeezed by the growing bone. Maximum intensity projection (right panel) of osteoblast recruitment during bone development. The indentations in the notochord result from concentric bone growth. n = 5, 8, 3, 3, 3, 2 animals respectively. (B–D) Schematic depicting the shape changes that occur in vacuoles (B), centra (C), and the IVD (D) during vertebral growth between the standard-length stages 6.2 mm and 8.7 mm. Arrowheads point to areas of the notochord with fragmented vacuoles. Arrows indicate vacuoles undergoing shape change. Asterisks mark intact vacuoles. (E) Average sphericity of vacuolated cells decreases during notochord development and spine formation stages. Examples of cellular shapes are illustrated above each time point on the graph. Scale bar = 50 µm. (F) Live confocal image of a 14 dpf larva expressing DN-GFP-Rab32a mosaically in the notochord. n = 4 animals. Brackets mark centra. Dotted lines outline malformed centra. Solid lines outline normal centra. Tg(SAGFF214A:gal4); Tg(UAS:GFP); Tg(osx:NTR-mCherry). Scale bars are 100 µm.
Figure 7 with 1 supplement
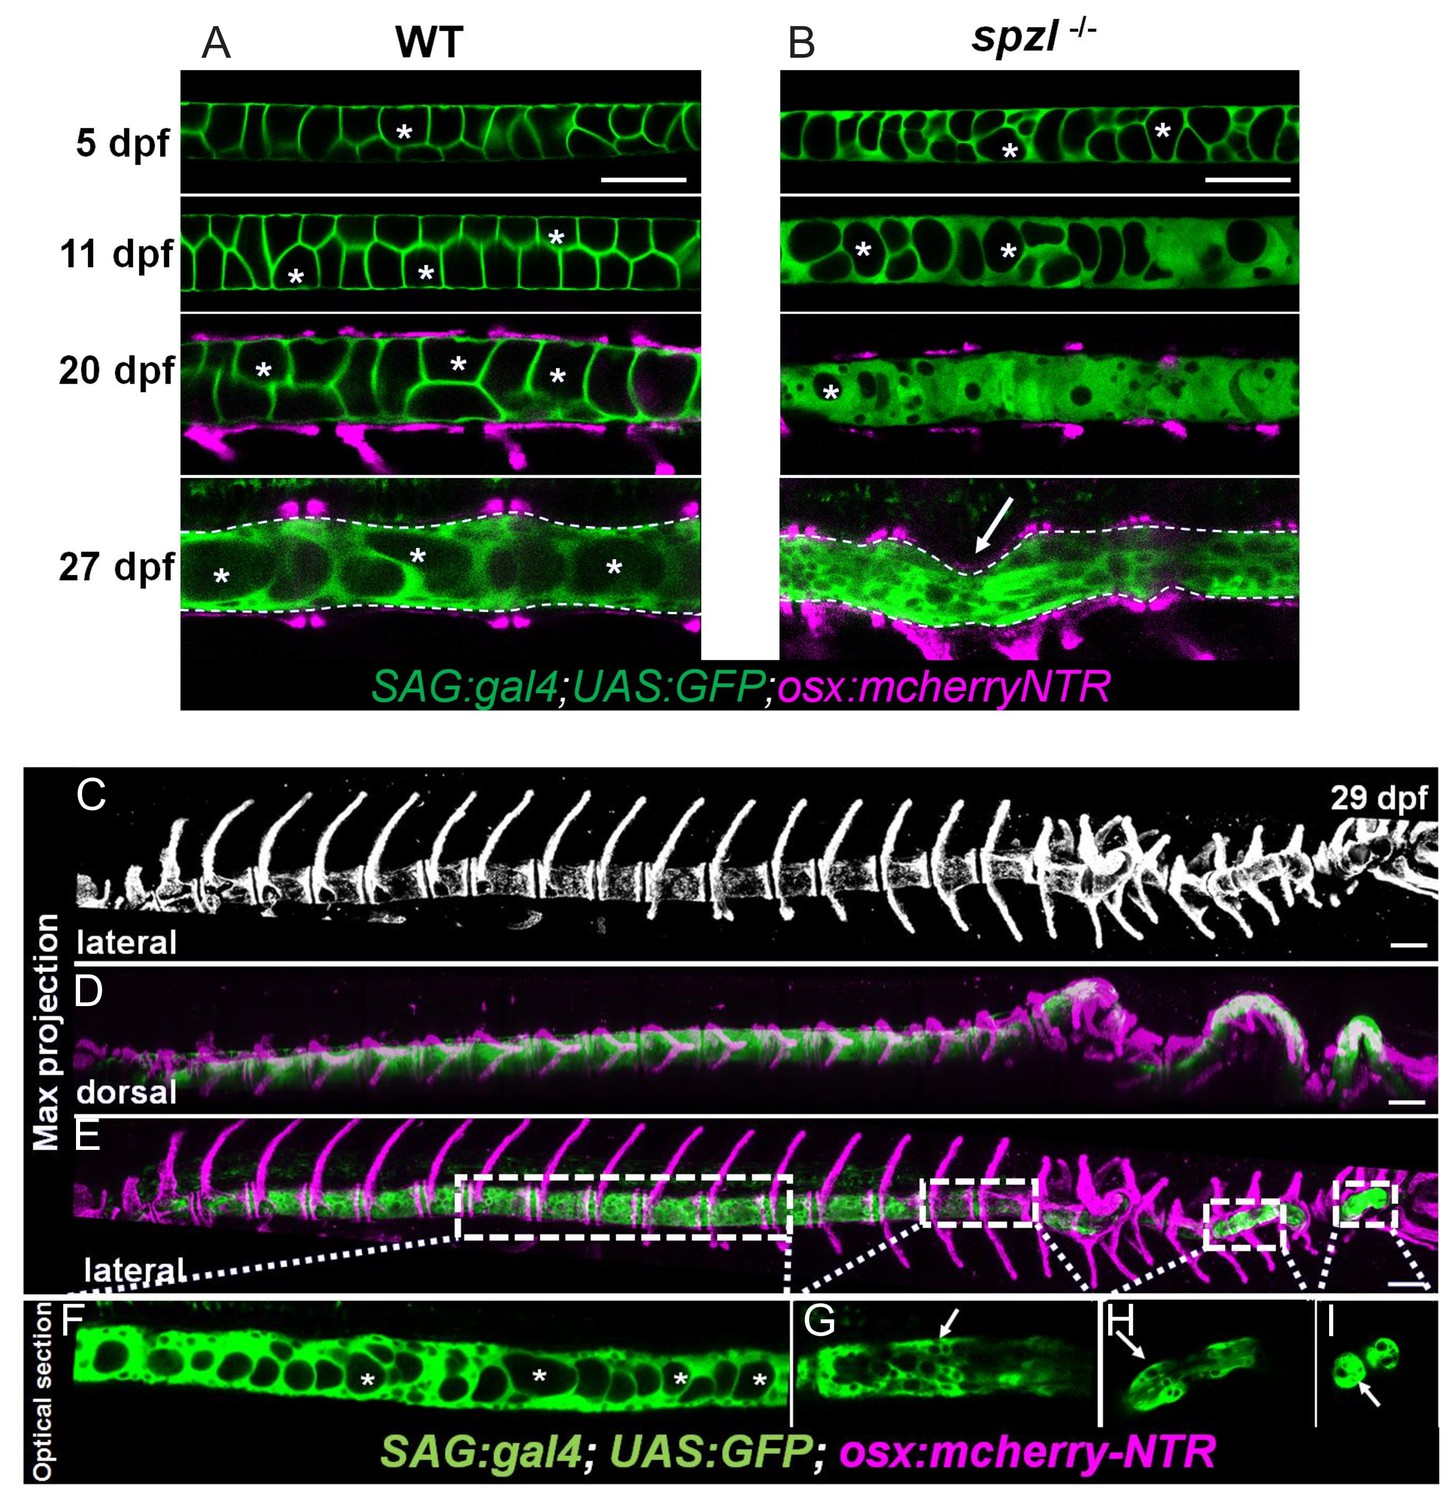
Loss of notochord vacuole integrity is associated with spine kinking in spzl mutants.
(A) Live confocal imaging time course of vacuole dynamics and morphology during spine development in WT zebrafish larvae. n = 3, 6, 11, 13. (B) Live confocal imaging time course of vacuole dynamics and morphology during spine development in spzl-/- larvae. n = 3, 4, 8, 7. (A–B) Larvae express GFP in the cytoplasm of vacuolated cells and mCherry in osteoblasts. Note the progressive loss of vacuoles in spzl-/- and the straight notochord and spine prior to the onset of concentric vertebral growth. Dotted lines mark the edge of the notochord. Arrow points to a spine kink in spzl-/-. (C) Maximum intensity projection of a laterally oriented 29 dpf spzl-/- larva. The spine is visualized by mCherry expression in the osteoblasts. (D–E) Maximum intensity projections showing dorsal (D) and lateral (E) views of a 29 dpf spzl-/- larva expressing mCherry in the osteoblasts and GFP in the notochord. The anterior spine is straight while the posterior region has developed several spine kinks (F) Optical confocal section of the straight anterior portion of the spine. Asterisks mark intact vacuoles. (G–I) Optical confocal sections of the posterior notochord where vacuoles are highly fragmented or absent and the spine is highly kinked. Gt(SAGFF214A:gal4); Tg(UAS:GFP); Tg(osx:NTR-mCherry). Scale bars are 100 µm.
Figure 7—figure supplement 1
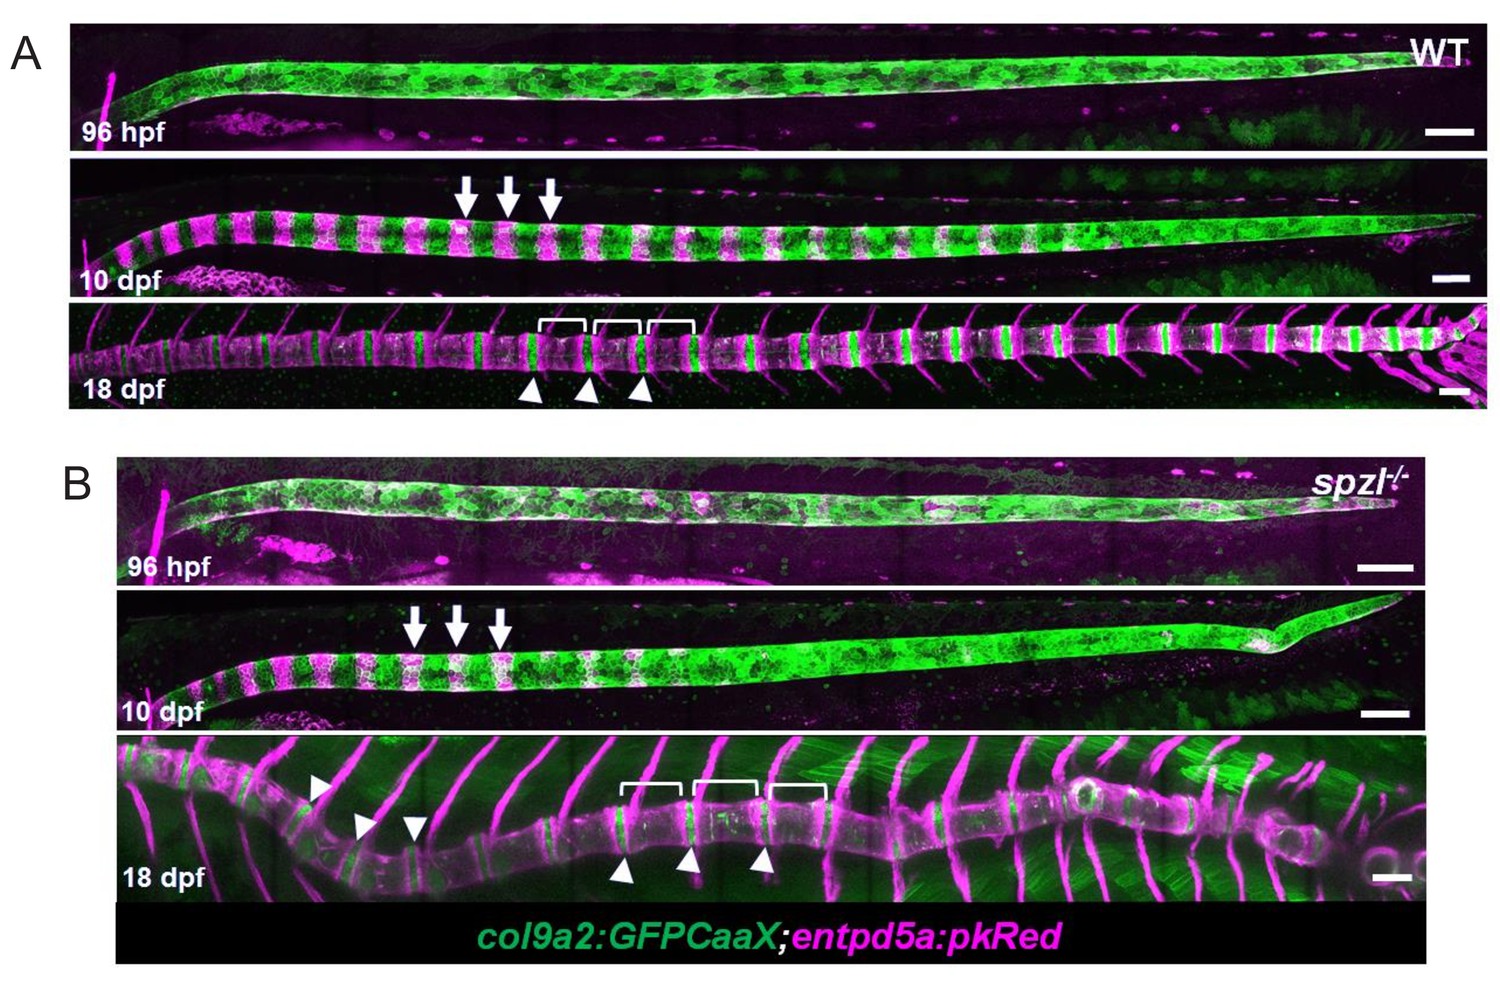
Notochord segmentation occurs normally in spzl mutants.
(A–B) Maximum intensity projections of live confocal images from WT and spzl-/- larvae during notochord segmentation. (B) Arrows point to mineralizing segments labeled with entpd5a:PkRed. Brackets highlight vertebrae. Arrowheads mark the intervertebral domains which are labeled with col9a2:GFPCaaX. Scale bar = 100 µm.
Figure 8
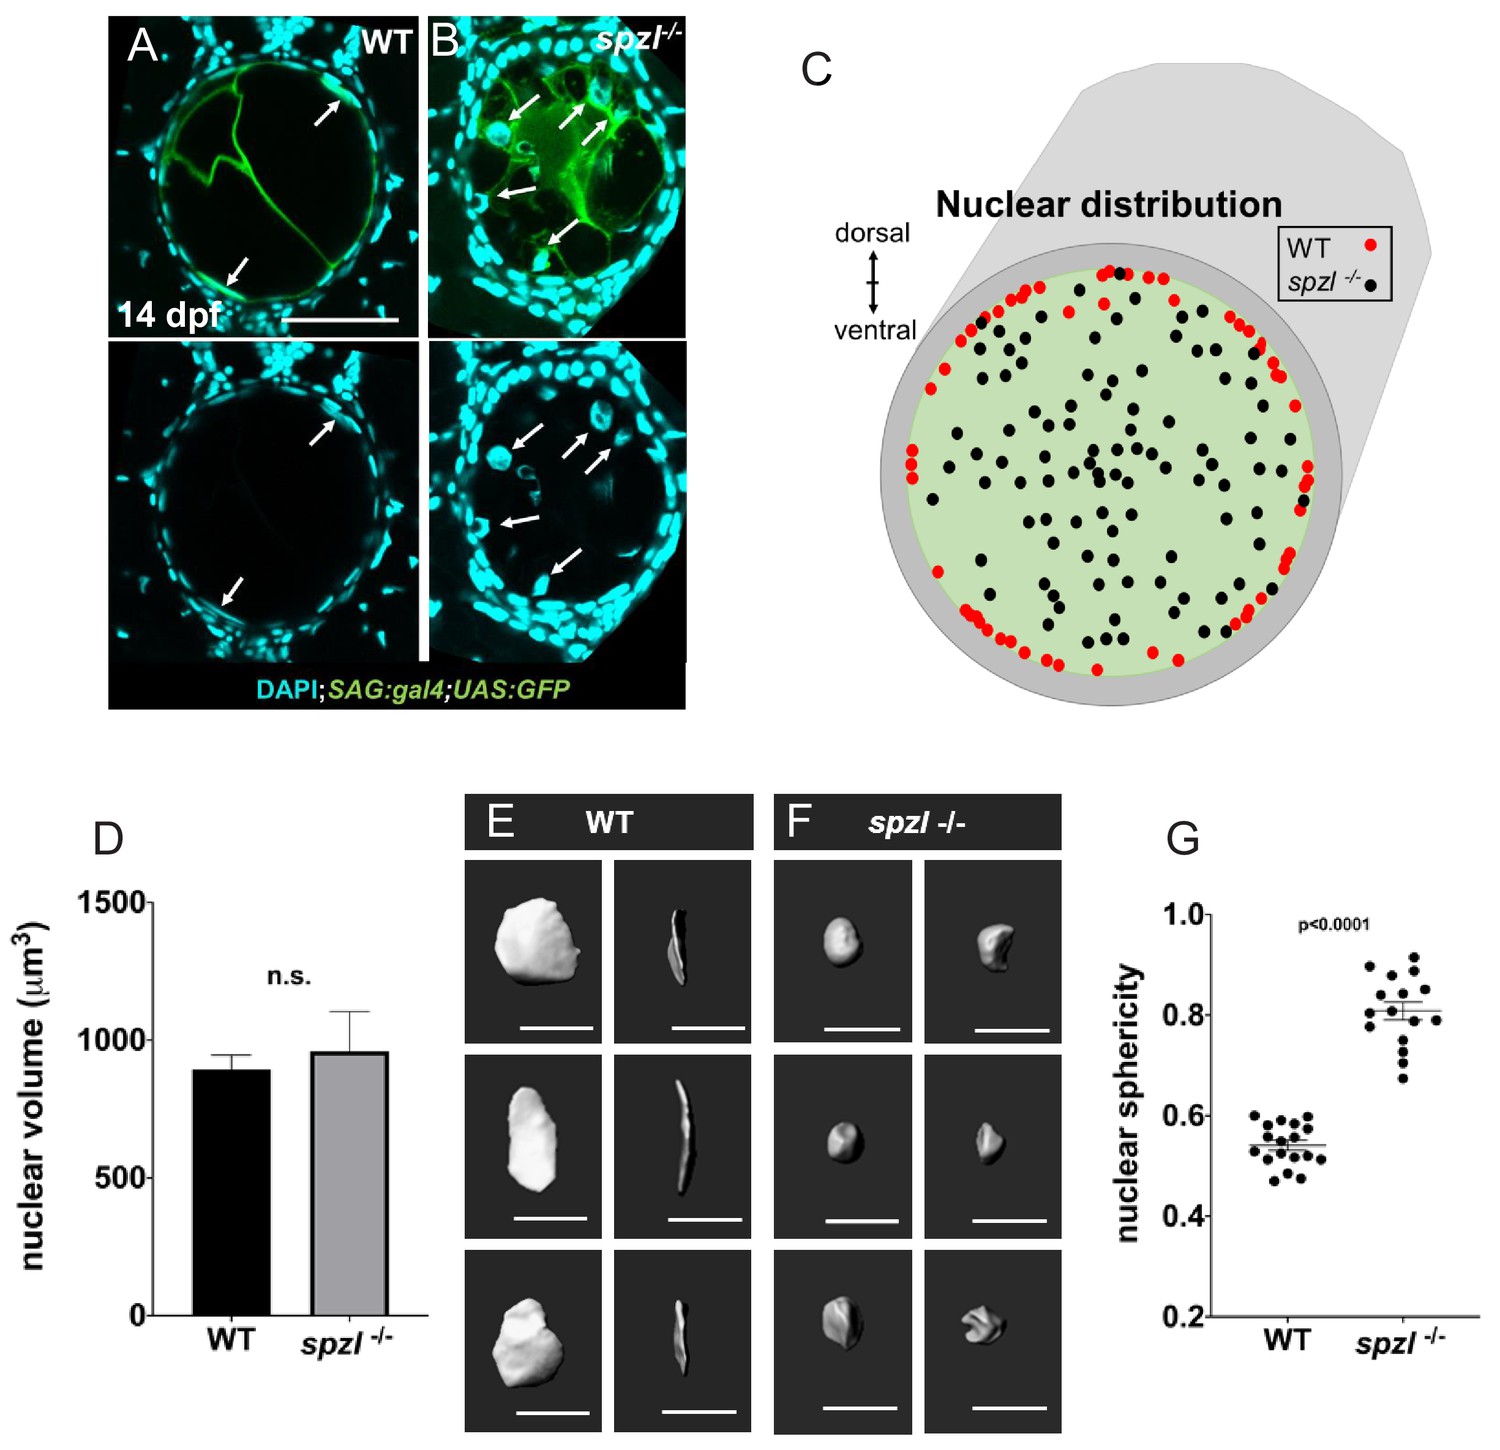
Nuclear distribution and shape indicate that hydrostatic pressure of the notochord is decreased in spzl mutants.
(A–B) Confocal images of cross sections of 14 dpf WT and spzl-/- larvae section. Vacuolated cells are labeled with SAG:gal4;UAS:GFP and nuclei are stained with DAPI. Scale bar = 50 µm (C) Plot of vacuolated cell nuclear distribution for WT (red, n = 29) and spzl-/- (black, n = 32). (D) Nuclear volume in WT and spzl-/- at 14 dpf. (E–F) Reconstructions of nuclei in WT (E) and spzl-/- (F) and two different viewing angles. Scale bar = 20 µm (G) Sphericity of WT and spzl-/- nuclei at 14 dpf. p-values were determined by an un-paired t-test using Welch’s correction.
Figure 9 with 1 supplement
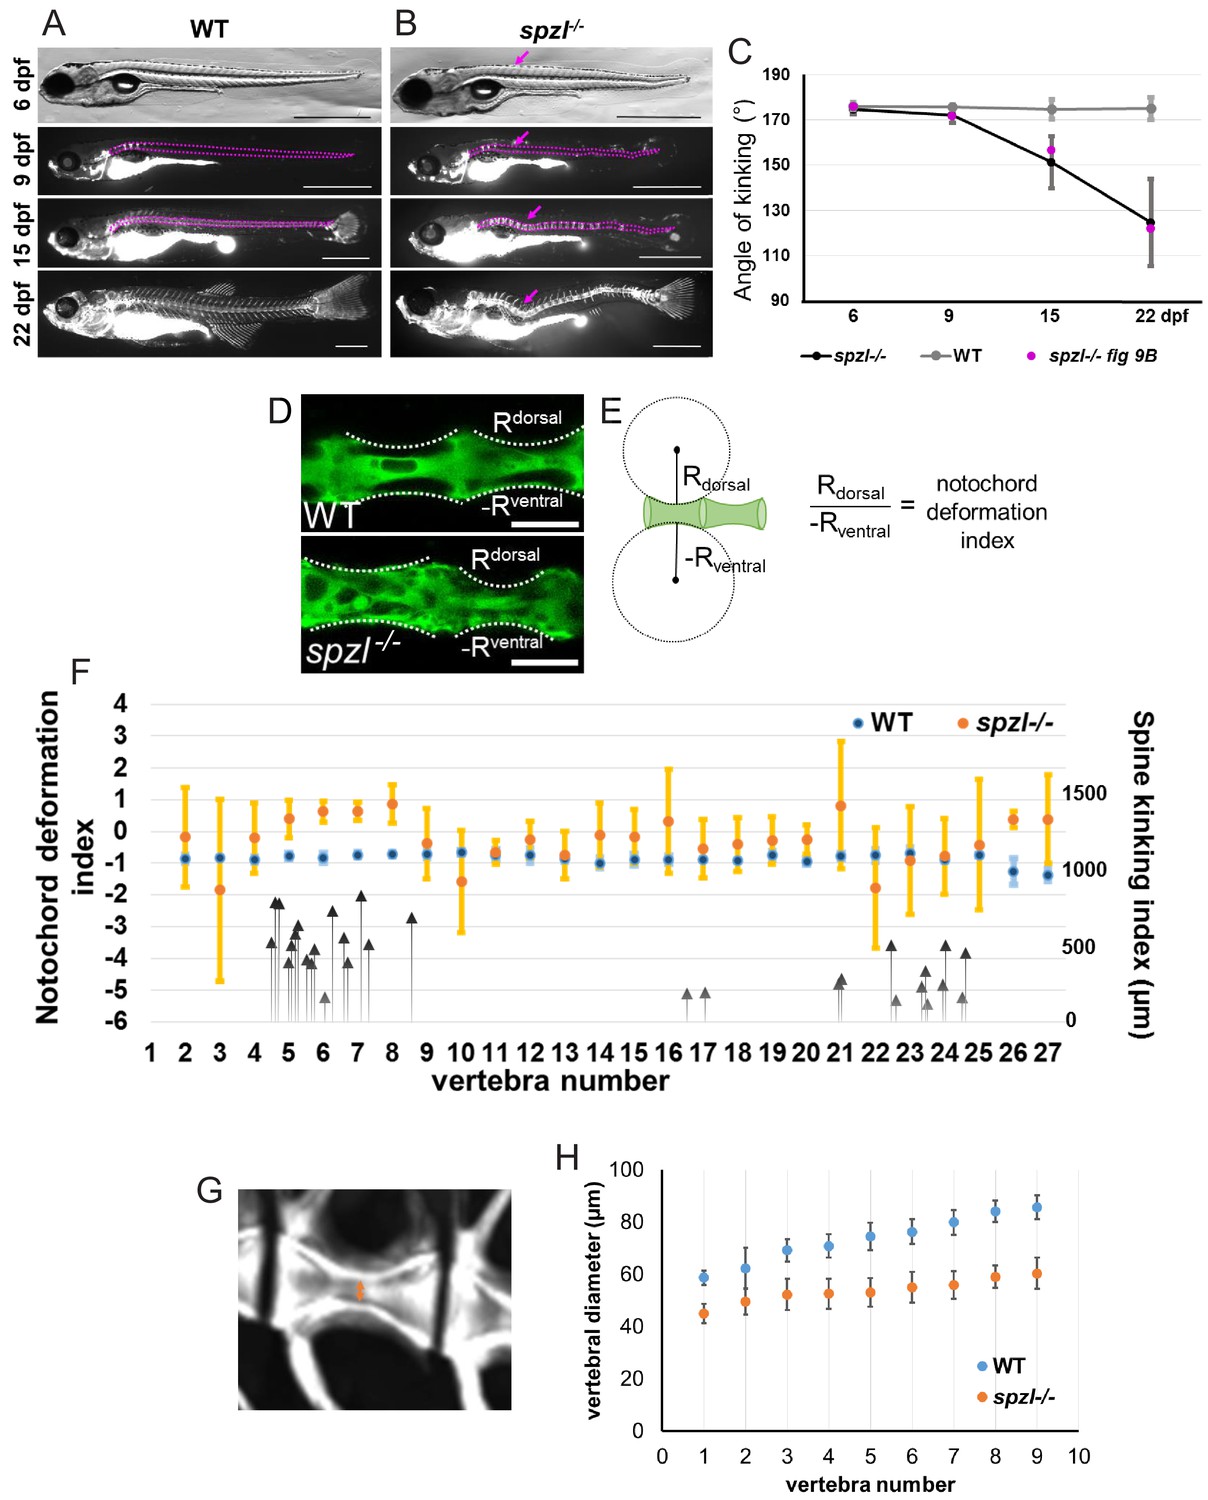
Loss of notochord vacuole integrity leads to spine kinking in spzl mutants during vertebral bone growth.
(A–B) Individual (A) WT and (B) spzl-/- fish were incubated with calcein and imaged under a fluorescence compound microscope throughout the time course of spine development. The dotted lines mark the notochord and spine and the magenta arrows mark developing kinks in the spine over time. The solid magenta lines mark that area where we measured the angle of kinking. Scale bars are 1 mm. (C) Quantification of the angle of spine kinking over time. Magenta dots refer to the representative fish in panel (B). n = 3 for WT, n = 18 for spzl-/-. Note that axis kinking starts after the onset of mineralization and gets progressively sharper as vertebral bone grows. (D) Optical confocal section of WT (top) and spzl-/- (bottom) expressing GFP in the cytoplasm of notochord vacuolated cells. Dotted line label the deformation angle caused by the growing vertebrae. The radius of this angle was then used to determine the notochord deformation index. Scale bar = 100 µm. (E) Cartoon depicting how the notochord deformation index was calculated. Normal vertebral growth should have a notochord deformation index of ~−1. (F) Notochord deformation index in 6.5–7.55 mm WT (blue) and 28 dpf spzl-/- larvae (orange). Fish were matched by bone development. n = 3 for WT, n = 5 for spzl-/-. Error bars are SD. The larger deviation illustrates that lack of symmetry in the notochord deformation in the spzl-/-mutants. Black arrows point to the vertebral location of spine kinks and the magnitude (in μm) they deviate from the center line in spzl-/- mutants (n = 18). Note that most kinks occur adjacent to areas where the asymmetric notochord deformation changes in orientation. (G) μCT image of a 2 mpf WT vertebra. Orange arrow indicates location of canal diameter measurements. (H) Canal diameter measurements from vertebrae 2–10 for WT (blue) and spzl-/-(orange). The decreased size of the vertebral canal suggests the notochord is more deformable in spzl-/- respect to WT. For WT n = 5. For spzl mutants n = 5.
Figure 9—figure supplement 1
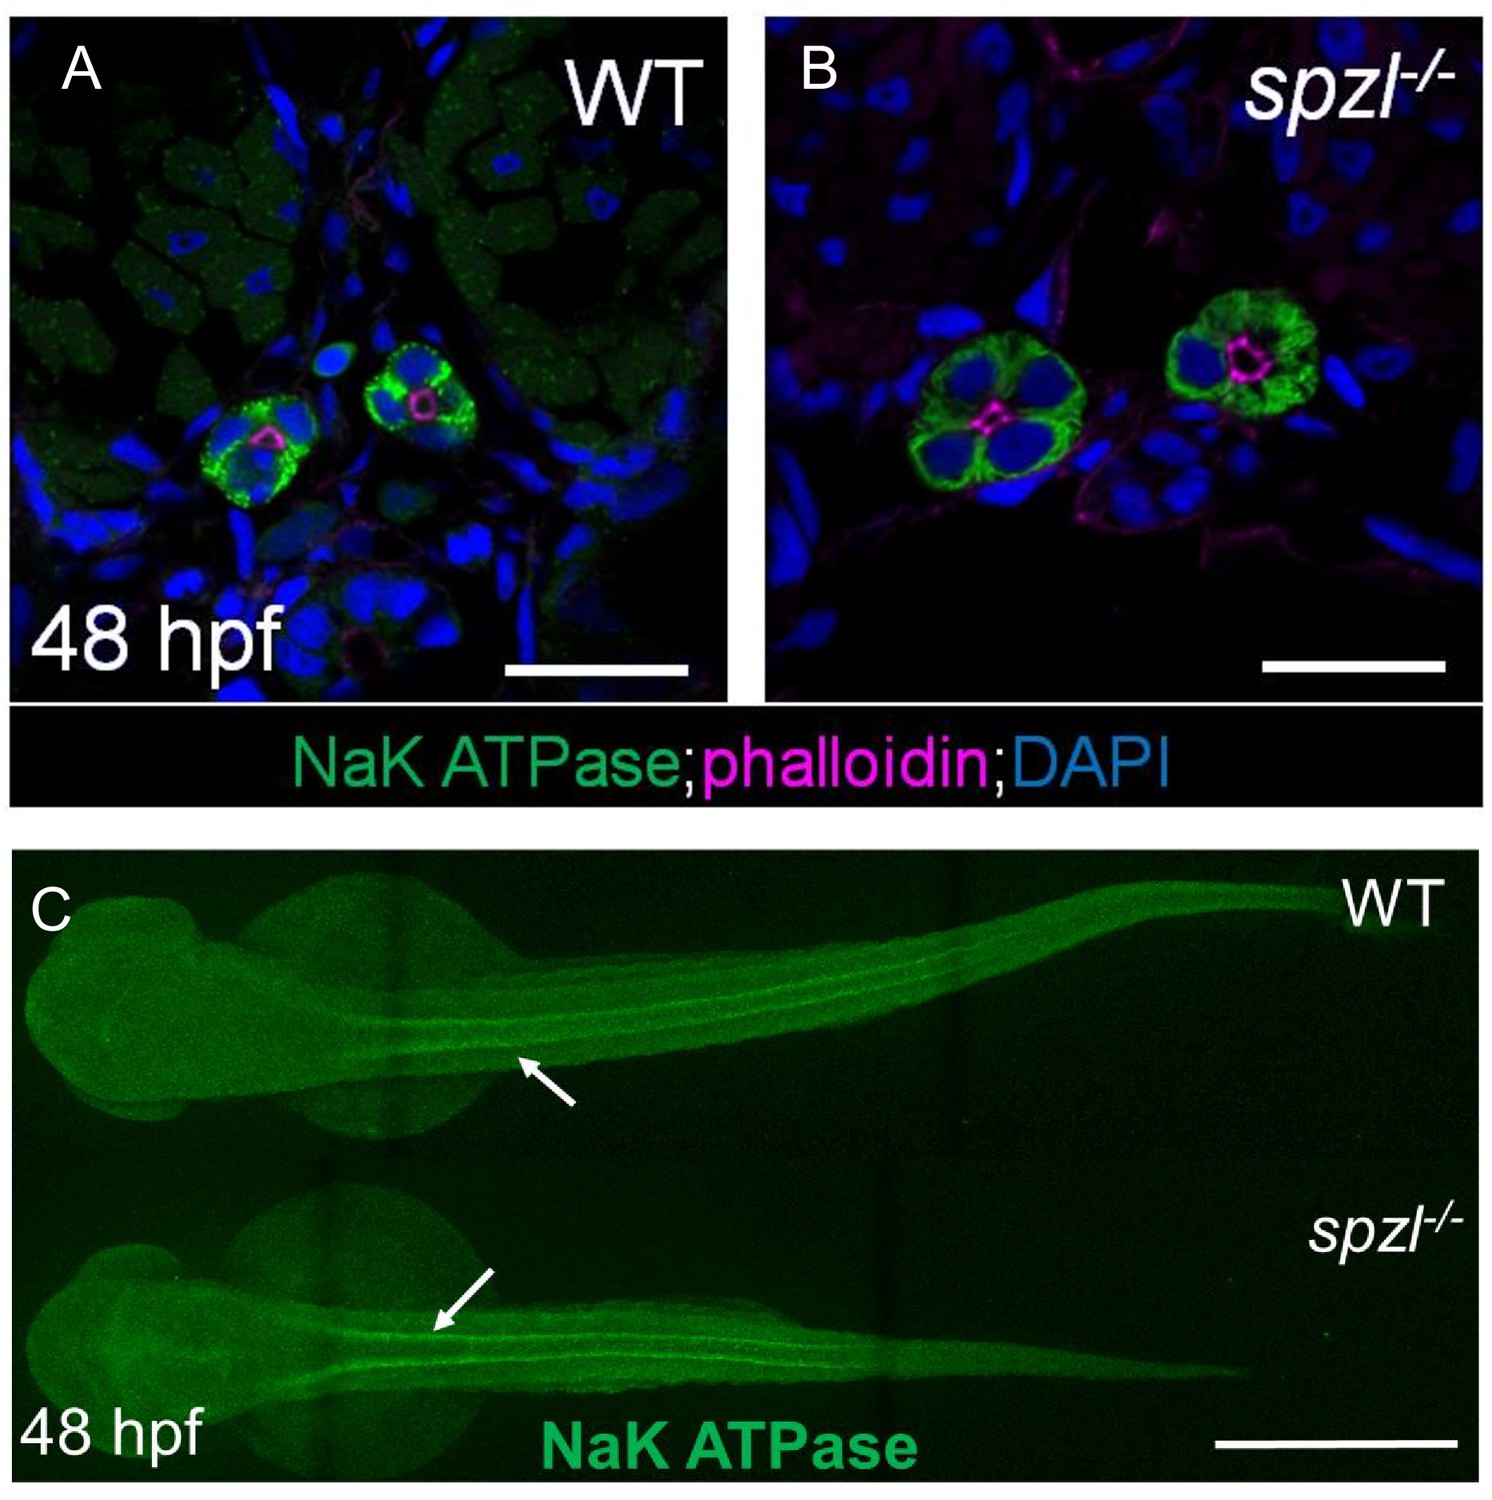
Pronephros development occurs normally in spzl mutants.
(A–B) Confocal images of cross sections from 48 hpf WT and spzl mutant embryos stained for NaK ATPase (green). Phalloidin (magenta) labels the apical membrane of the pronephros. Scale bar = 20 µm (C) Whole mount immunofluorescence stain of NaK ATPase labeling thepronephros in WT (top) and spzl-/- (bottom). Arrows point to pronephros. Scale bar = 500 µm.
Figure 10 with 1 supplement
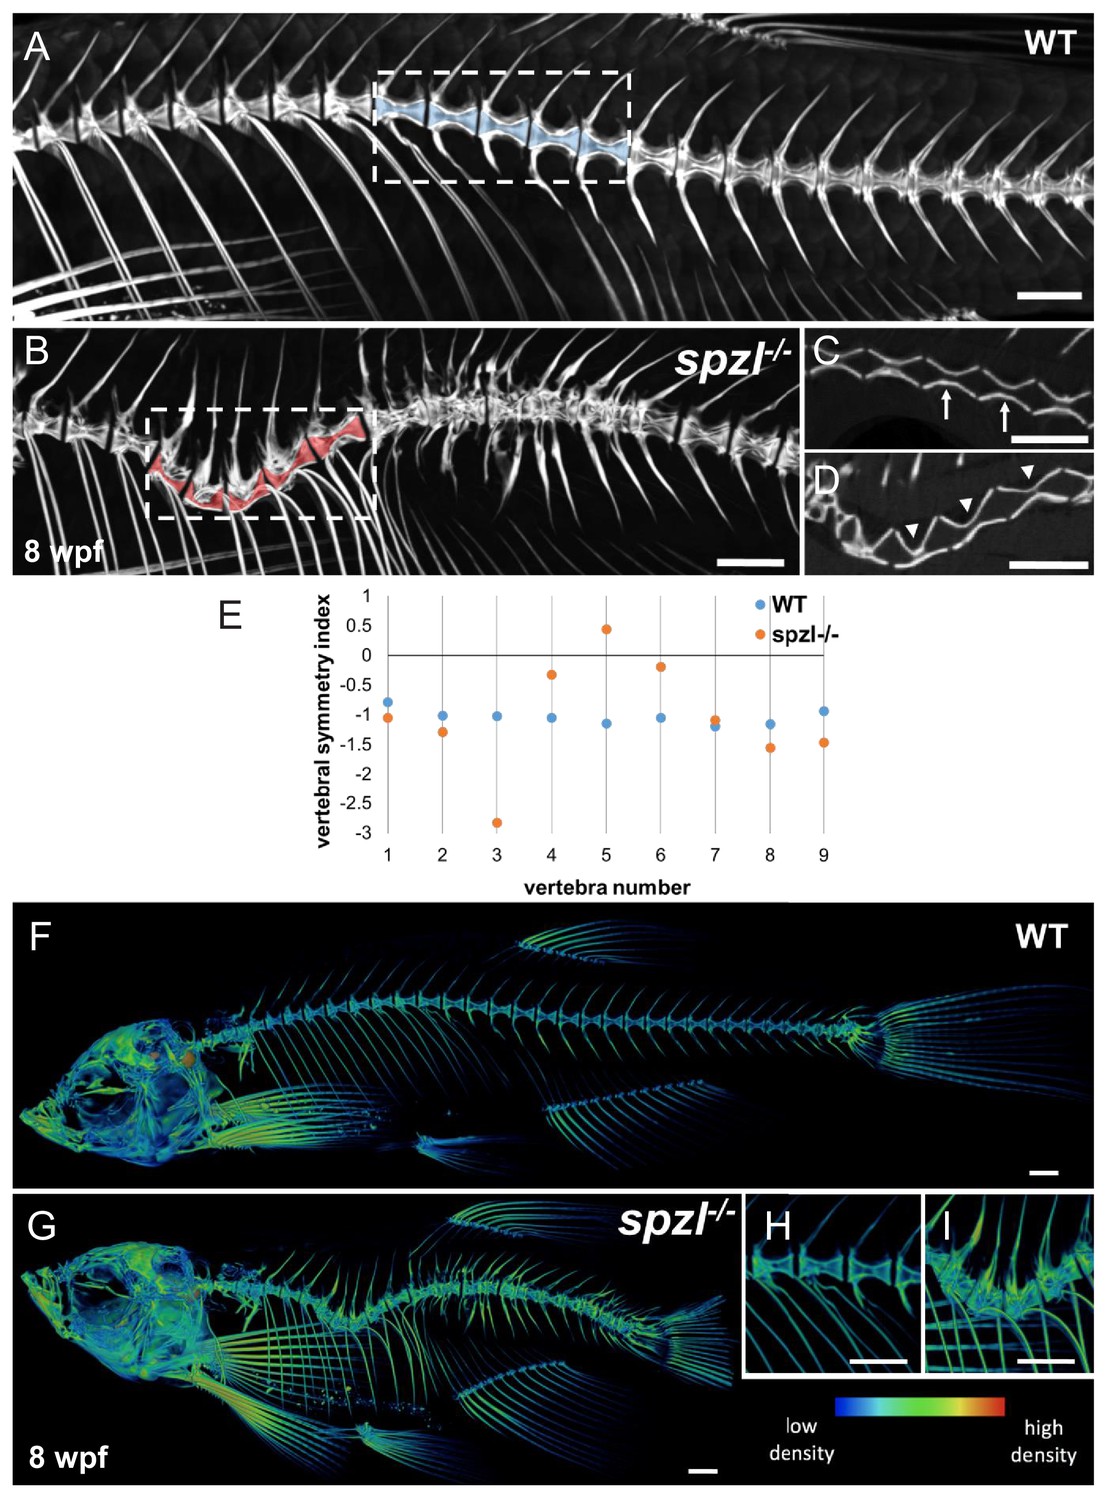
Vertebral malformations and increased mineralization in the spine of spzl-/- fish.
(A–B) μCT images of the spine of WT (A) and spzl-/- (B) fish at 8 wpf. Vertebral canals are highlighted in blue (WT) and red (spzl-/-). (C) Optical section of the dotted box in (A) for WT. Arrows point to symmetrical vertebrae. (D) Optical section of the dotted box in (B). Arrowheads point to the vertebral asymmetry in spzl-/- associated with the spine kink. (E) Vertebral symmetry index, calculated as in Figure 6E, of WT and spzl-/- obtained from the spine kinking area. Numbers correspond to vertebra number counted from the first rib bearing vertebra. (F–G) μCT reconstruction of 6wpf WT and spzl-/- mutant zebrafish. The reconstructions were pseudo-colored to show relative bone density. (H–I) Magnified insets of the spine for WT and spzl-/-. Scale bar = 1 mm.
Figure 10—figure supplement 1
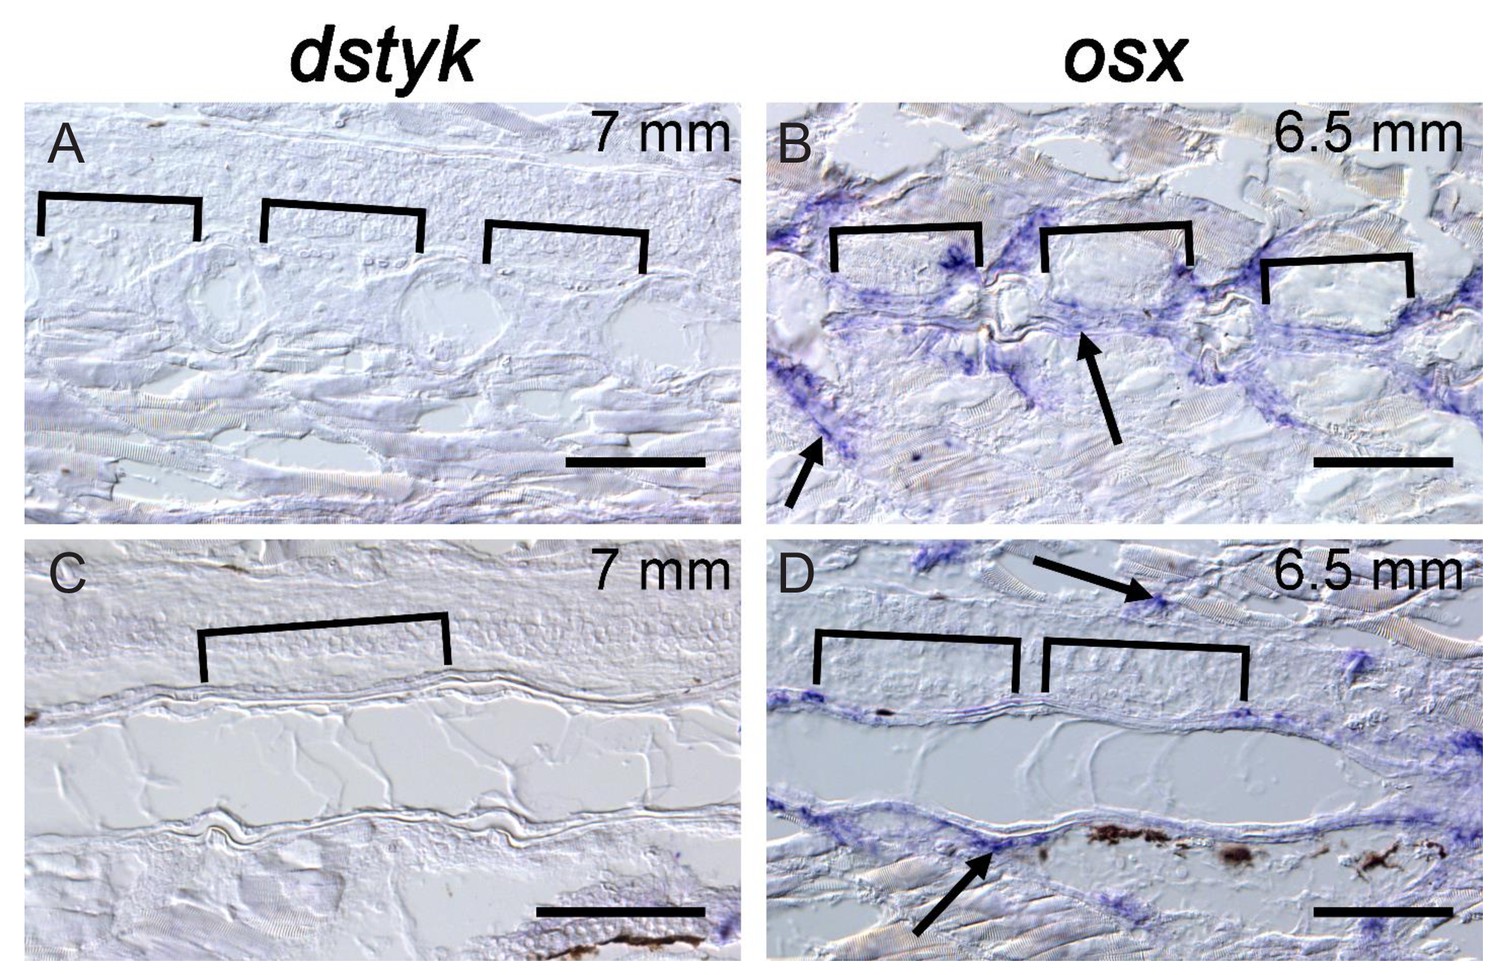
dstyk expression is not detectable at late stages in the notochord or in osteoblasts surrounding the notochord.
(A,C) In situ hybridization for dstyk at 7 mm stage. Sagittal sections were taken at the periphery of the notochord (A) and across the center of the notochord (C). Brackets indicate the mineralized centra. (B, D) In situ hybridization forosx at 6.5 mm standard length. Sagittal sections were taken at the periphery of the notochord (B) and across the center of the notochord (D). Brackets indicate the mineralized centra. Brackets indicate mineralized centra. Arrows point to osteoblasts. Scale bar = 100 µm.
Figure 11
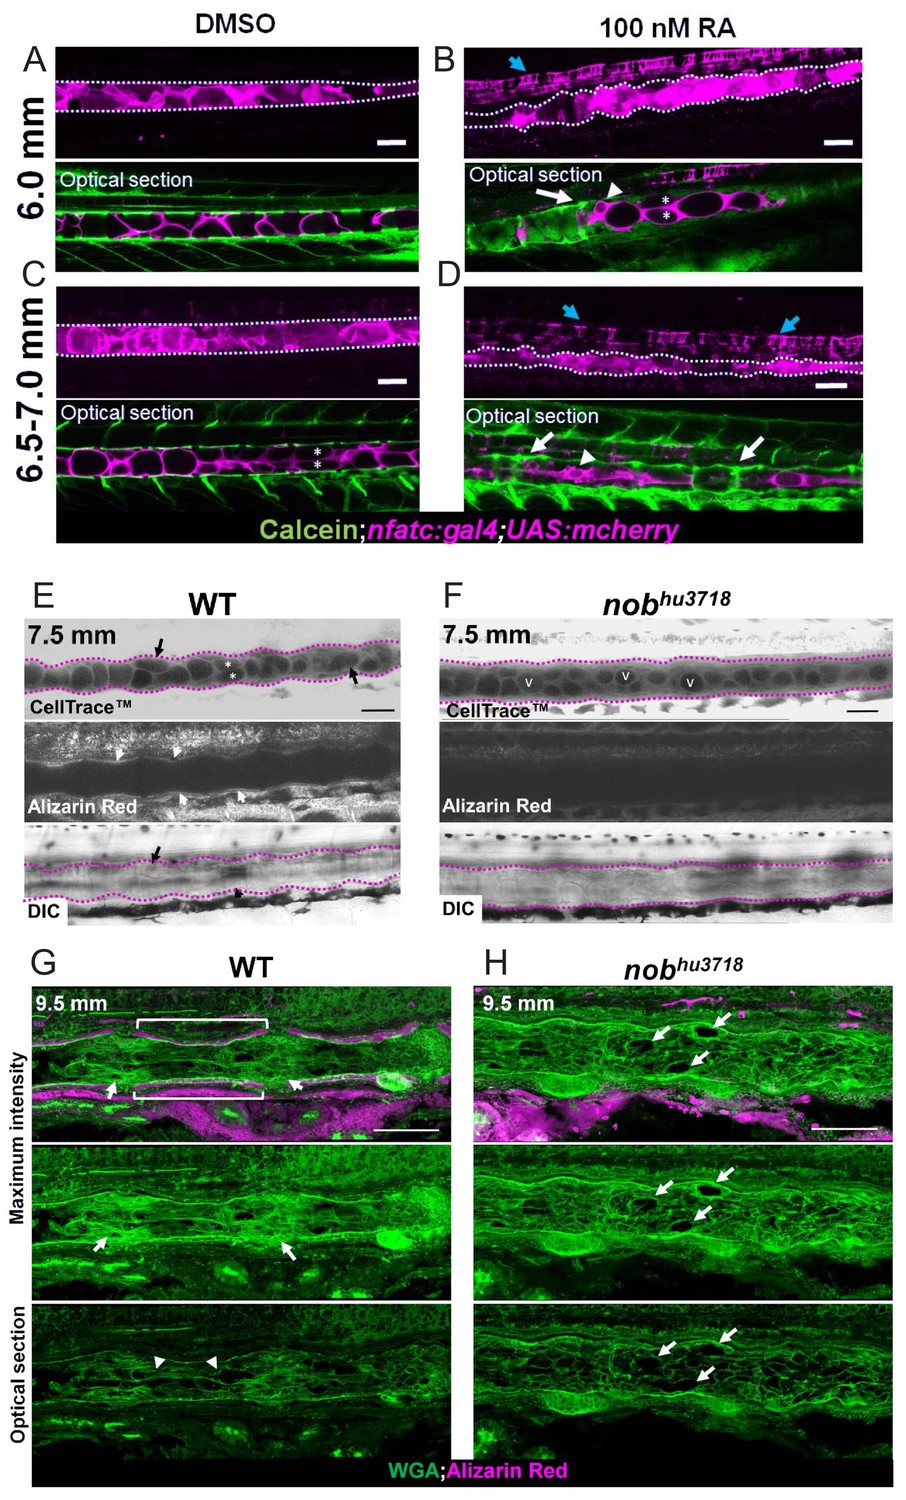
Notochord vacuole morphology and arrangement is altered with increasing or decreasing mineralization.
(A, C) Live confocal images of fish treated with 0.0002% DMSO for 1 week at 6.0 mm and 6.5–7 mm respectively. (B, D) Live confocal images of fish treated with 100 nM RA for 1 week at 6.0 mm and 6.5–7 mm respectively. Fish expressed nfatc:gal4;UAS:mcherry in the notochord and were stained with calcein to label centra. Scale bar = 100 µm. n = 3 for DMSO control and RA treatment. Notochord is outlined with a dotted white line. White arrows point to areas of increased mineralization, blue arrows point to the floor plate. Arrowheads indicate areas of increased vacuole fragmentation. Asterisks mark vacuolated cell stacking. (E) Live confocal image of a 7.5 mm WT zebrafish stained with Cell Trace to visualize internal membranes and live alizarin to label mineralized bone, n = 3. (F) Live confocal image of a 7.5 mm nobhu3718 stained with Cell Trace and alizarin red to label bone. n = 3. Black arrows point to vacuolated cells undergoing shape change. Asterisks mark stacked vacuolated cells. White arrows point to centra stained with alizarin red. v indicates rounded vacuoles that have not undergone shape change, fragmentation, or stacking. The notochord is outlined with a dotted fuchsia line. Scale bar = 100 µm. (G–H) Cryosections of a 9.5 mm WT (G) and nobhu3718 (H) larvae stained with WGA (green) and alizarin red (magenta). Brackets indicate IVD domains. Arrows point to mineralized centra. The notochord is outlined with a dotted white line. Arrowheads point to mesenchymal condensations. Scale bar = 100 µm.
Figure 12
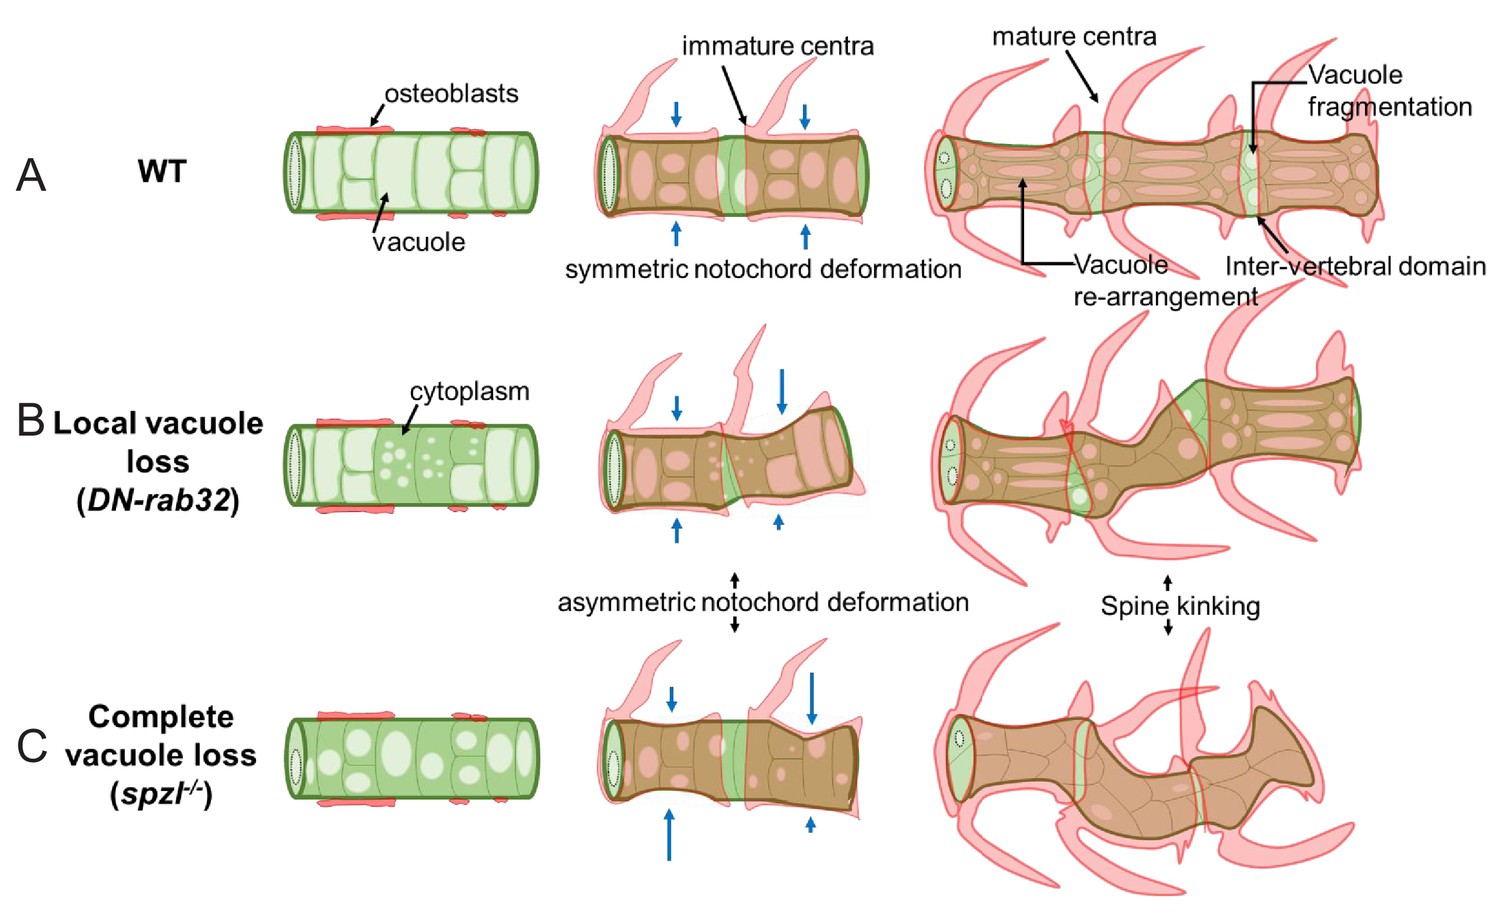
Working model depicting the proposed mechanism of notochord vacuole function.
(A) Schematic depicting vacuole dynamics during spine formation in WT. Large and fully inflated vacuoles (vacuole lumen in light green) can rearrange under the growing centra and fragment in the inter-vertebral domain to absorb locally the compression generated by bone growth. (B) Schematic depicting localized loss of vacuoles driven by mosaic genetic manipulation. Vacuoles are lost in some cells in a confined area, leaving an increased amount of cytoplasm (dark green). Vacuole loss renders the notochord more deformable, causing asymmetric centra growth and spine kinking. Normal vacuole behavior around the affected area insulates the defect to one are. (C) Schematic depicting the effect of global loss of vacuoles in spzl mutants. Vacuoles are smaller and are progressively lost prior to centra development. Compressive centra growth can no longer be absorbed locally, leading to loss of compartmentalization and the development of spine kinks at various points of the axis. Blue arrows indicate degree of notochord deformations.
Videos
Video 1
3D reconstruction of μCT imaging from a 3 mpf WT fish.
Video 2
3D reconstruction of μCT imaging from a 3 mpf spzl-/- fish.
Note kinking of the spine axis.
Video 3
Live imaging of vacuole biogenesis in WT.
Light sheet imaging of GFP-Rab32a membranes in a 48 hpf WT embryo. Note small carriers fusing with the main vacuole.
Video 4
Slow fusion of prevacuolar membranes with notochord vacuoles.
Light sheet imaging of GFP-Rab32a membranes in a 48 hpf WT embryo. Large pre-vacuolar membranes, i. e. vacuolinos, fuse with the main vacuole after a long lag period.
Video 5
Live imaging of vacuole biogenesis in spzl-/-.
Light sheet imaging of GFP-Rab32a membranes in a 48 hpf spzl-/- embryo. Fusion of small and large carriers to the main vacuole is impaired.
Additional files
-
Transparent reporting form
- https://cdn.elifesciences.org/articles/51221/elife-51221-transrepform-v2.docx
-
Source data 1
Raw data for all measurements, statistics, and graphs.
- https://cdn.elifesciences.org/articles/51221/elife-51221-data1-v2.xlsx
Download links
A two-part list of links to download the article, or parts of the article, in various formats.
Downloads (link to download the article as PDF)
Open citations (links to open the citations from this article in various online reference manager services)
Cite this article (links to download the citations from this article in formats compatible with various reference manager tools)
Notochord vacuoles absorb compressive bone growth during zebrafish spine formation
eLife 9:e51221.
https://doi.org/10.7554/eLife.51221


