The human coronavirus HCoV-229E S-protein structure and receptor binding
- The University of Toronto, Canada
- INRS-Institut Armand-Frappier, Institut National de la Recherche Scientifique, Université du Québec, Canada
- The Hospital for Sick Children Research Institute, Canada
Figures
Figure 1 with 1 supplement
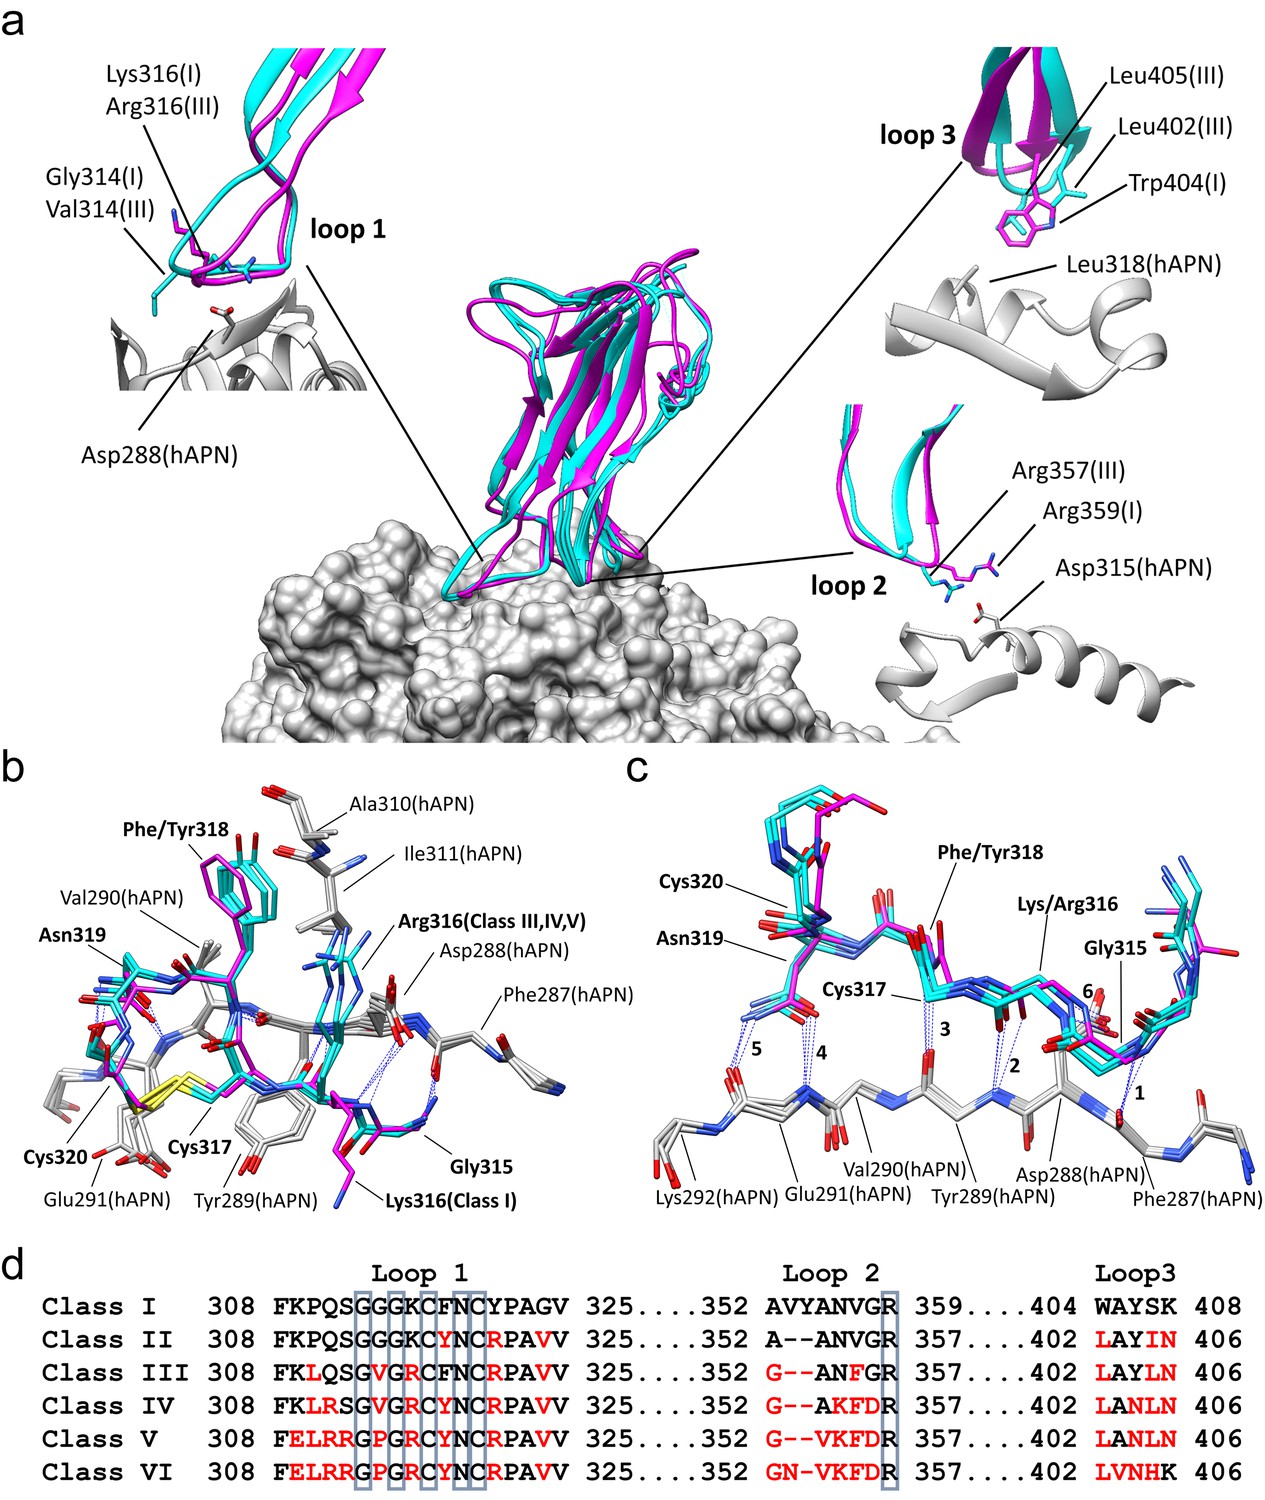
Comparison of the RBD-hAPN complexes.
In all panels, the Class I RBD is colored magenta, the Class III, IV and V RBDs are colored cyan, and hAPN is colored gray. (a) Center: superimposition of the Class I, III IV and V RBD-hAPN complexes. Surrounding: the Class I and Class III RBDs are shown; the Class III RBD provides an example of the major differences observed between the Class III, IV and V RBDs relative to Class I. Loop 1, a twist in the loop allows Arg316 to interact with Asp288. Loop 2, a 2-aa deletion reorients Arg357, enabling a better interaction with Asp315. Loop 3, Leu402 and Leu405 replace Trp404, with Leu405 maintaining the apolar contact with Leu318. (b) The 315–320 segment of Loop 1shows a high degree of structural conservation among the four complexes. (c) Six hydrogen bonds (blue dotted lines, marked 1–6) are conserved among the four complexes and they all involve Loop 1 residues 315–320. Five of them (hydrogen bonds 1–5 in the figure) involve the five exposed backbone amide/carbonyl groups of hAPN residues 287–291; the sixth is formed with the sidechain of hAPN residue Asp 288. For clarity, only sidechains that participate in hydrogen bonds are shown. (d) Receptor binding loop sequence alignment. Differences relative to Class I are colored red. The six residues conserved among all HCoV-229E viruses sequenced are enclosed in blue boxes.
Figure 1—figure supplement 1
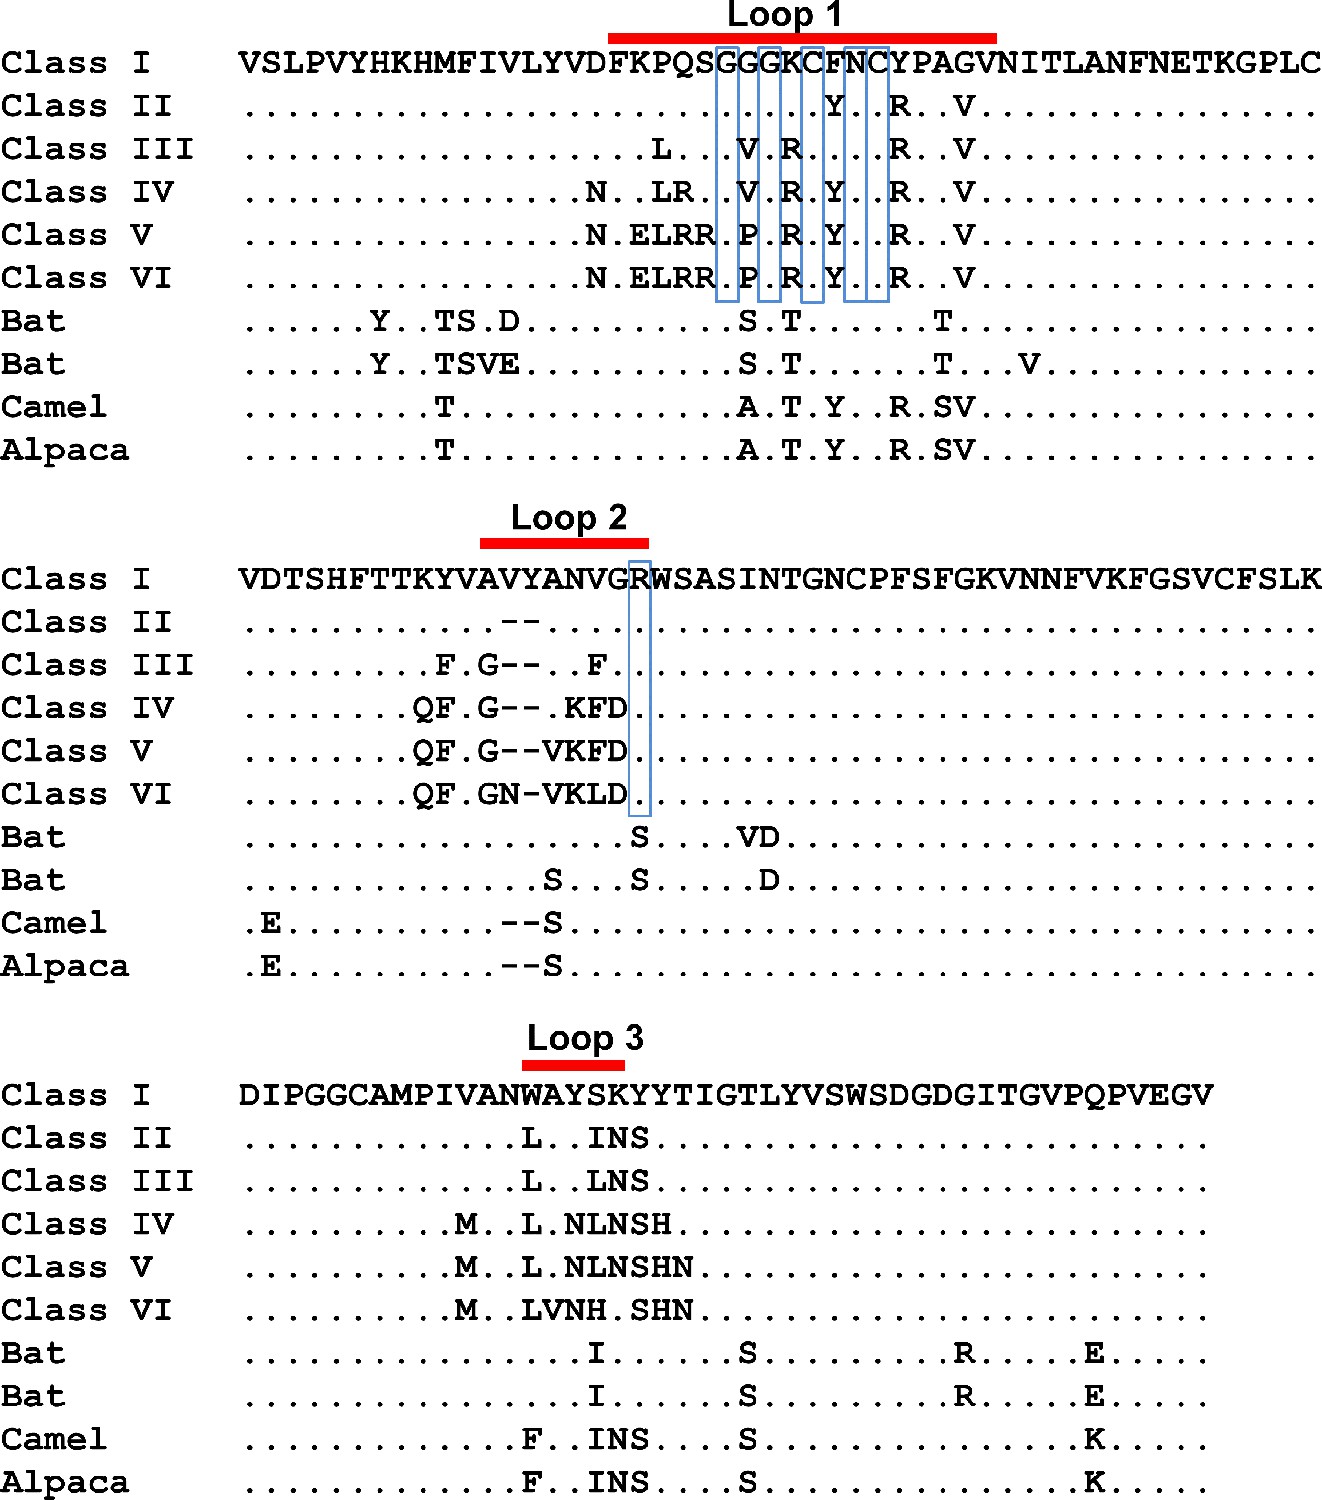
RBD sequence Alignment.
The Class I RBD sequence corresponds to residues 293–435 of NCBI AAK32191.1. The Class II - VI RBDs possess the receptor binding loops and supporting residues of their respective RBD classes and the Class I RBD residues in the remainder of the domain. The source of these sequences are: ABB90507.1 (Class II), ABB90514.1 (Class III), ABB90519.1 (Class IV), ABB90523.1 (Class V), and AFR45554.1 (Class VI). The six residues conserved among all HCoV-229E viruses sequenced are enclosed in blue boxes. RBD sequences of four animal CoVs that are closely related to HCoV-229E are also shown. These include two 229E-related CoVs from bat (ALK28775.1 and ALK28781.1), a camel CoV (ALA50088.1) and an alpaca CoV (AFI49431.1). Red bars indicate the limits of the receptor binding loops.
Figure 2 with 1 supplement
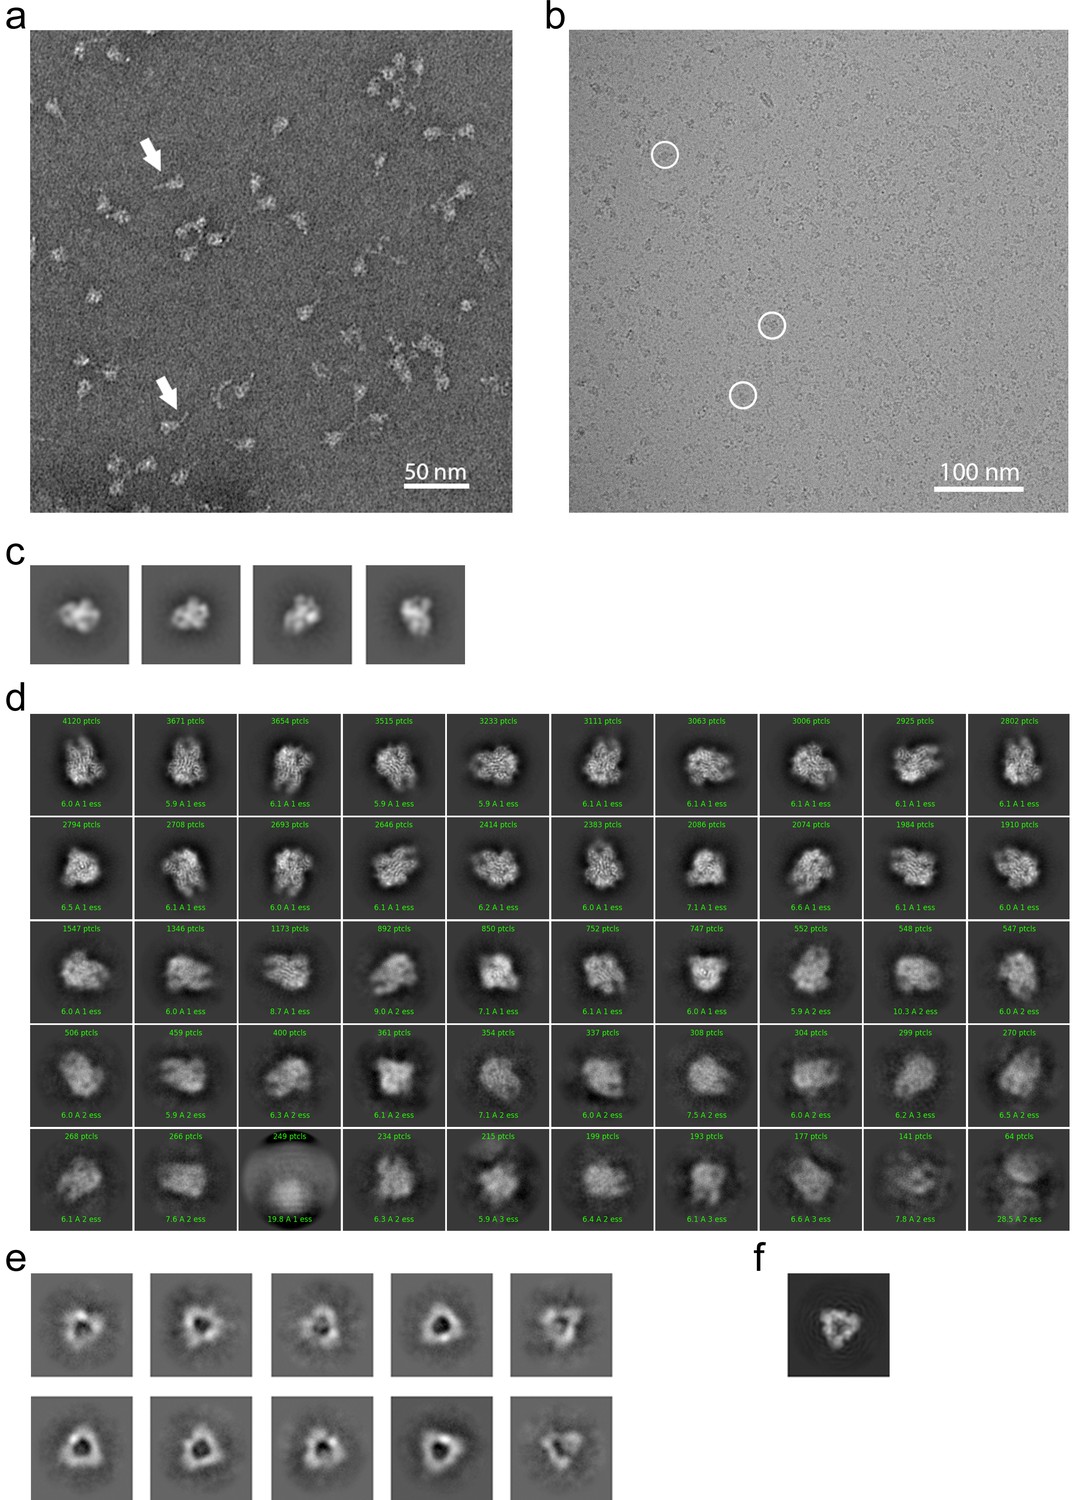
EM analysis of the HCoV-229E S-protein.
(a) An example negative stain micrograph. White arrowheads indicate particles with a readily discernable tail which is presumed to be formed by the HR2 region and the added foldon trimerization domain. (b) An example cryo-EM micrograph. For reference, three 229E S-protein particles are enclosed by white circles. (c) Selected 2D class averages of negative stain particles. (d) Cryo-EM 2D class averages of the ~71,000 particles used in the final refinement. (e) Cryo-EM 2D class averages of the putative S1 cap. (f) A simulated top view of the S1 cap at the same scale as in (e).
Figure 2—figure supplement 1

Orientation distribution of the 229E S-protein cryo-EM data.
In each panel, the 229E S-protein cryo-EM map is shown in the center. Left, side view; right, top view. Height and color of the columns indicate particle orientation frequencies.
Figure 3 with 1 supplement
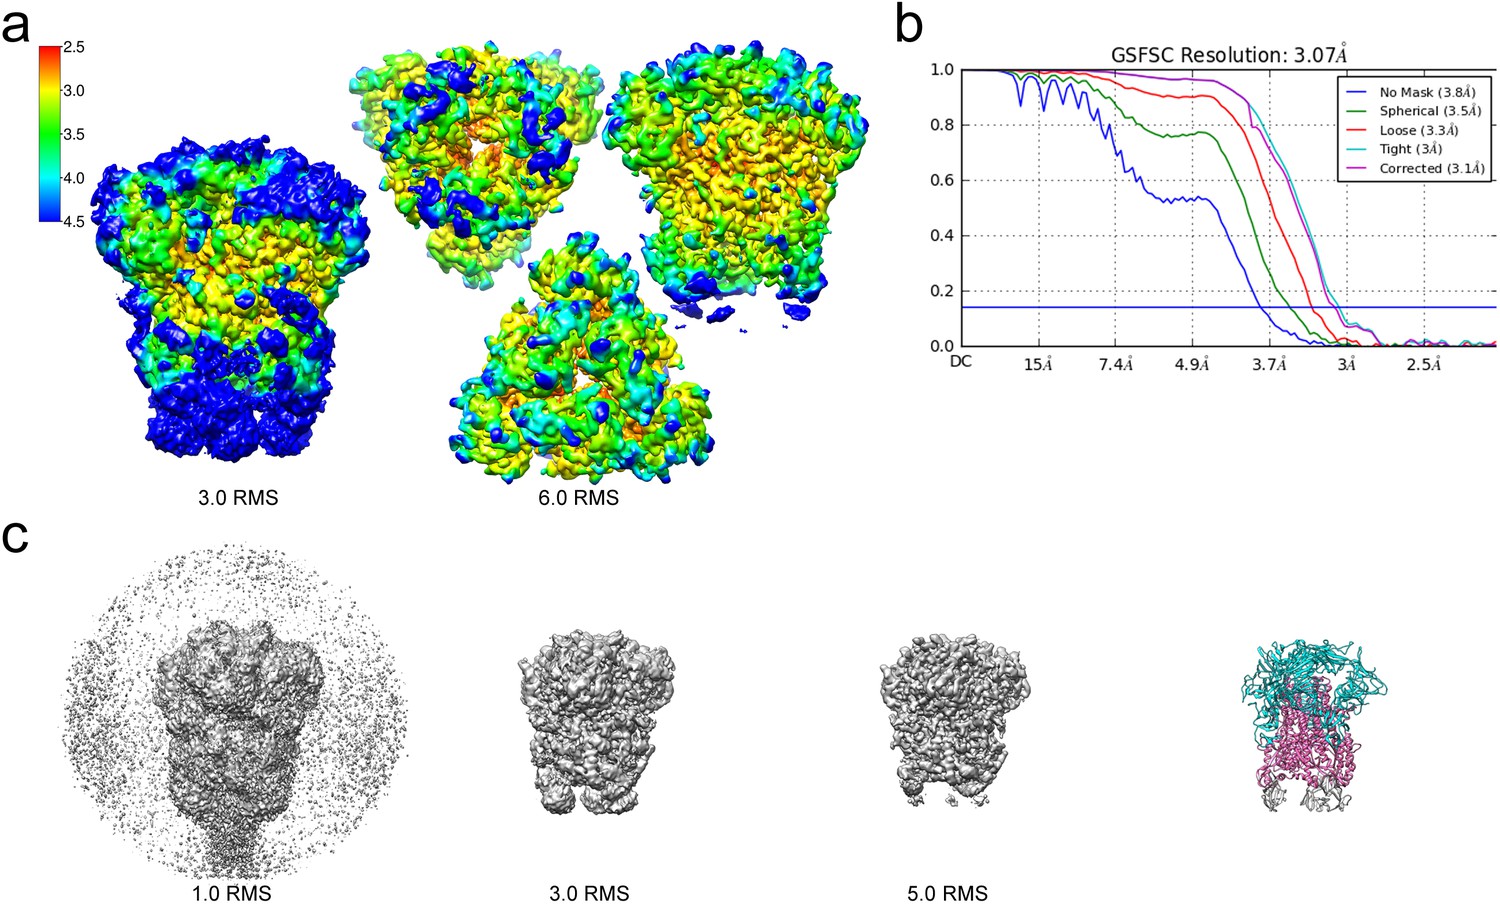
Resolution of the HCoV-229E S-protein cryo-EM map.
(a) Local resolution (Å) plotted on the cryo-EM map surface as a heat map. Leftmost image, a side view of the map contoured at 3.0 RMS to show the weak densities of the connector domains (at bottom). To the right, three views of the map contoured at 6.0 RMS showing that the entire S1 region and the helical core region of S2 are well-resolved. (b) GSFSC curves of the final 3D non-uniform refinement from cryoSPARC v2. The blue horizontal line indicates an FSC value of 0.143. (c) The cryo-EM map contoured at different levels to show the weak densities near the C-terminal end (bottom). To the right, the atomic model is shown in ribbon representation with the well resolved regions of the S1 and S2 subunits colored cyan and magenta, respectively. The poorly resolved connector domains are colored gray.
Figure 3—figure supplement 1
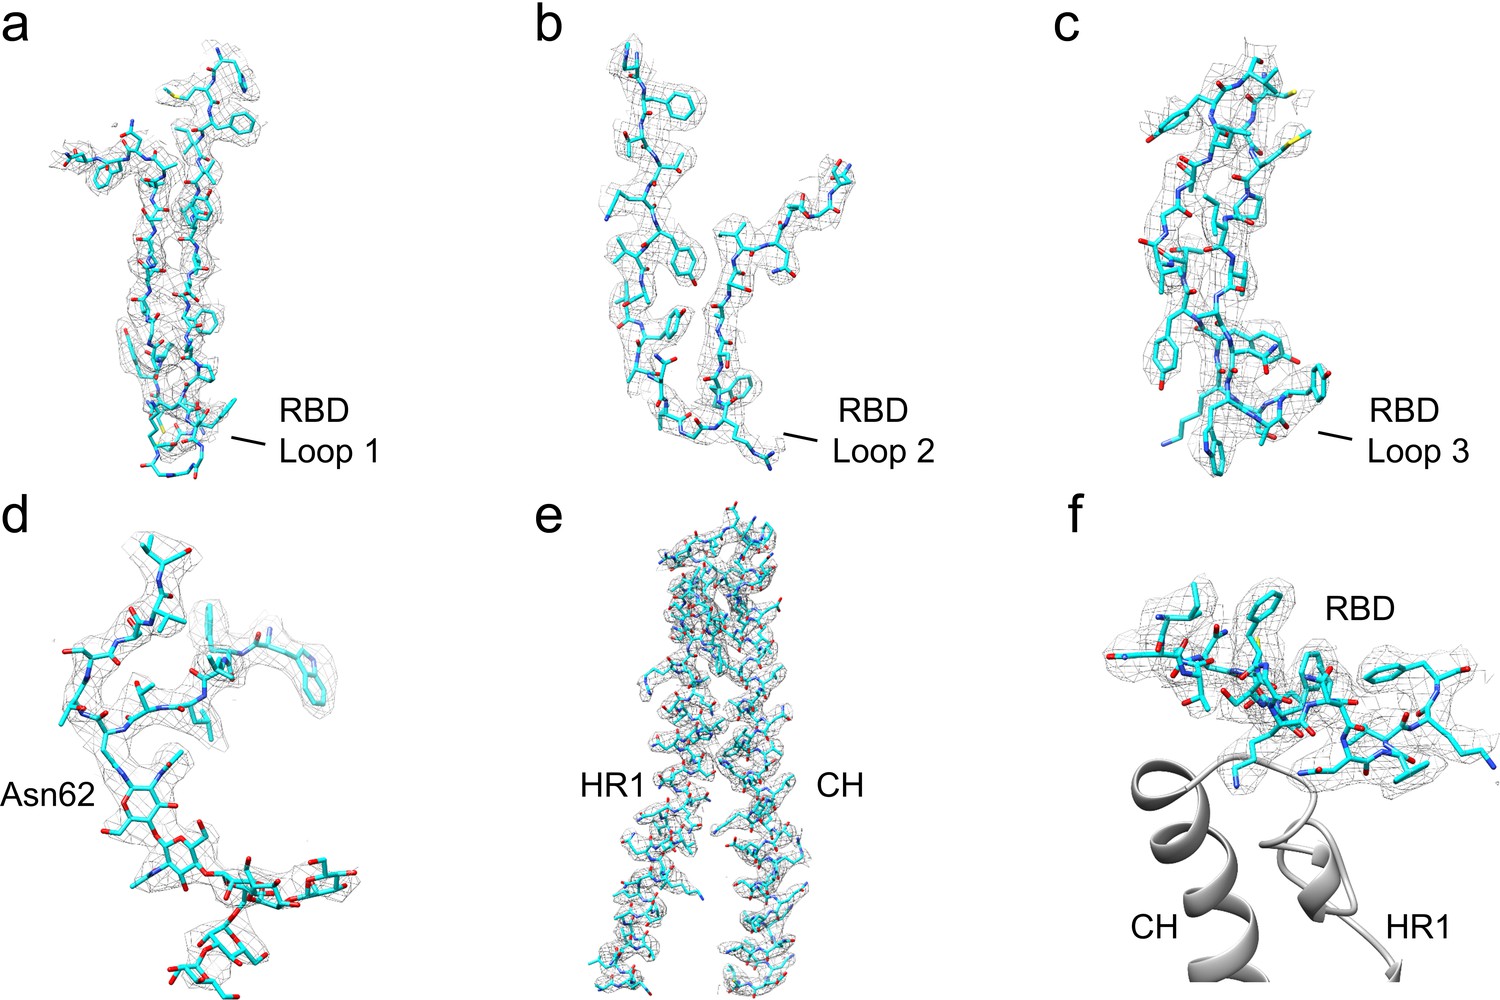
Examples of the atomic model built into the 229E S-protein cryo-EM map.
(a–c) RBD segments containing the three receptor binding loops. The tip of Loop 1 showed weak density. (d) Residues 57–67 and the N-linked glycan at Asn62. (e) Residues 820–918, encompassing CH and part of HR1. (f) Residues 364–382 at the bottom of the RBD are in contact with CH and HR1 in the S2 subunit (gray ribbons).
Figure 4 with 1 supplement
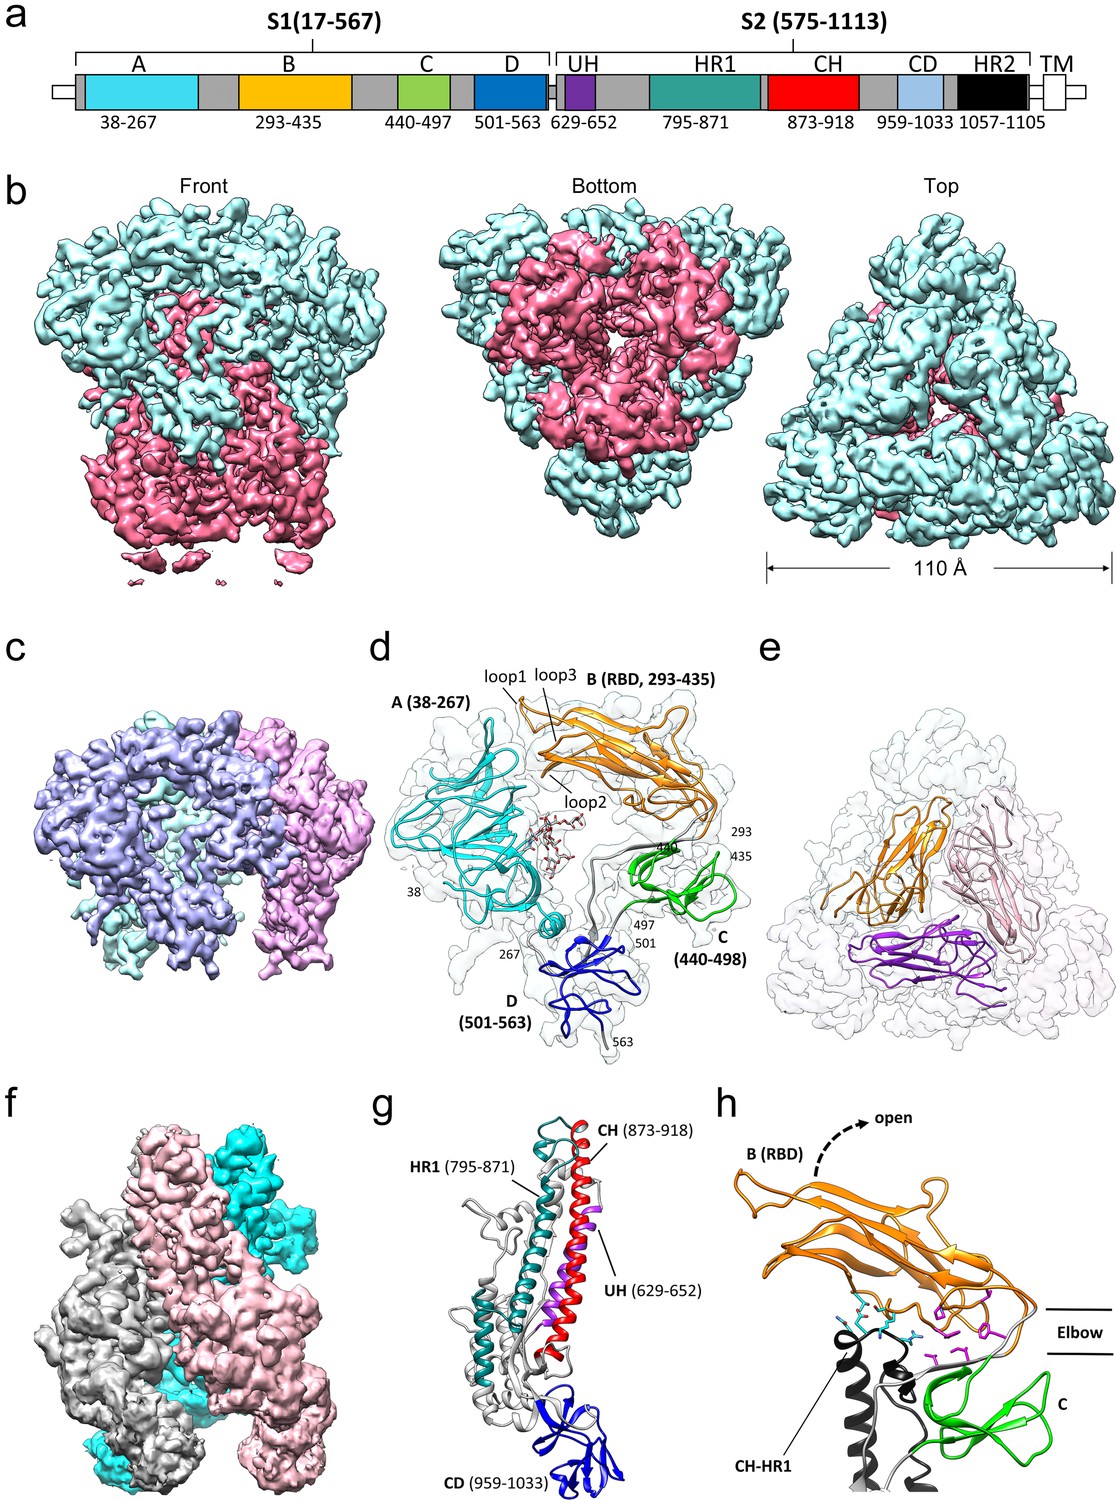
Cryo-EM structure of the HCoV-229E S-protein.
(a) Domain structure of the S-protein. UH, upstream helix; HR1, heptad repeat 1; CH, central helix; CD, connector domain; HR2, heptad repeat 2. TM, transmembrane segment. Segments colored in white are not part of the expressed ectodomain construct. (b) Three views of the unsharpened cryo-EM map contoured at 6.0 RMS. The S1 and S2 regions are colored cyan and magenta, respectively. (c) The portion of the cryo-EM map corresponding to the S1 region contoured at 5.0 RMS. Each subunit is colored differently. (d) Domain structure of an S1 subunit shown within a transparent rendering of the cryo-EM map. The highly ordered N-glycan (Asn 62) found in the center of the S1 subunit is shown in stick representation. The three receptor binding loops of the RBD (domain B) are labeled. (e) A portion of the cryo-EM map showing the S1 region viewed from the top. The three RBDs are shown as ribbons. (f) The portion of the cryo-EM map corresponding to the S2 region contoured at 3.0 RMS. Each subunit is colored differently. (g) Ribbon representation of the S2 subunit. (h) In the down conformation, the RBD (domain B, orange) makes polar interactions (cyan sidechains) with the CH-HR1 junction and hydrophobic interactions (magenta sidechains) in the elbow between domain B and domain C. The dotted arrow shows the direction that the RBD will take on conversion to the up conformation.
Figure 4—figure supplement 1
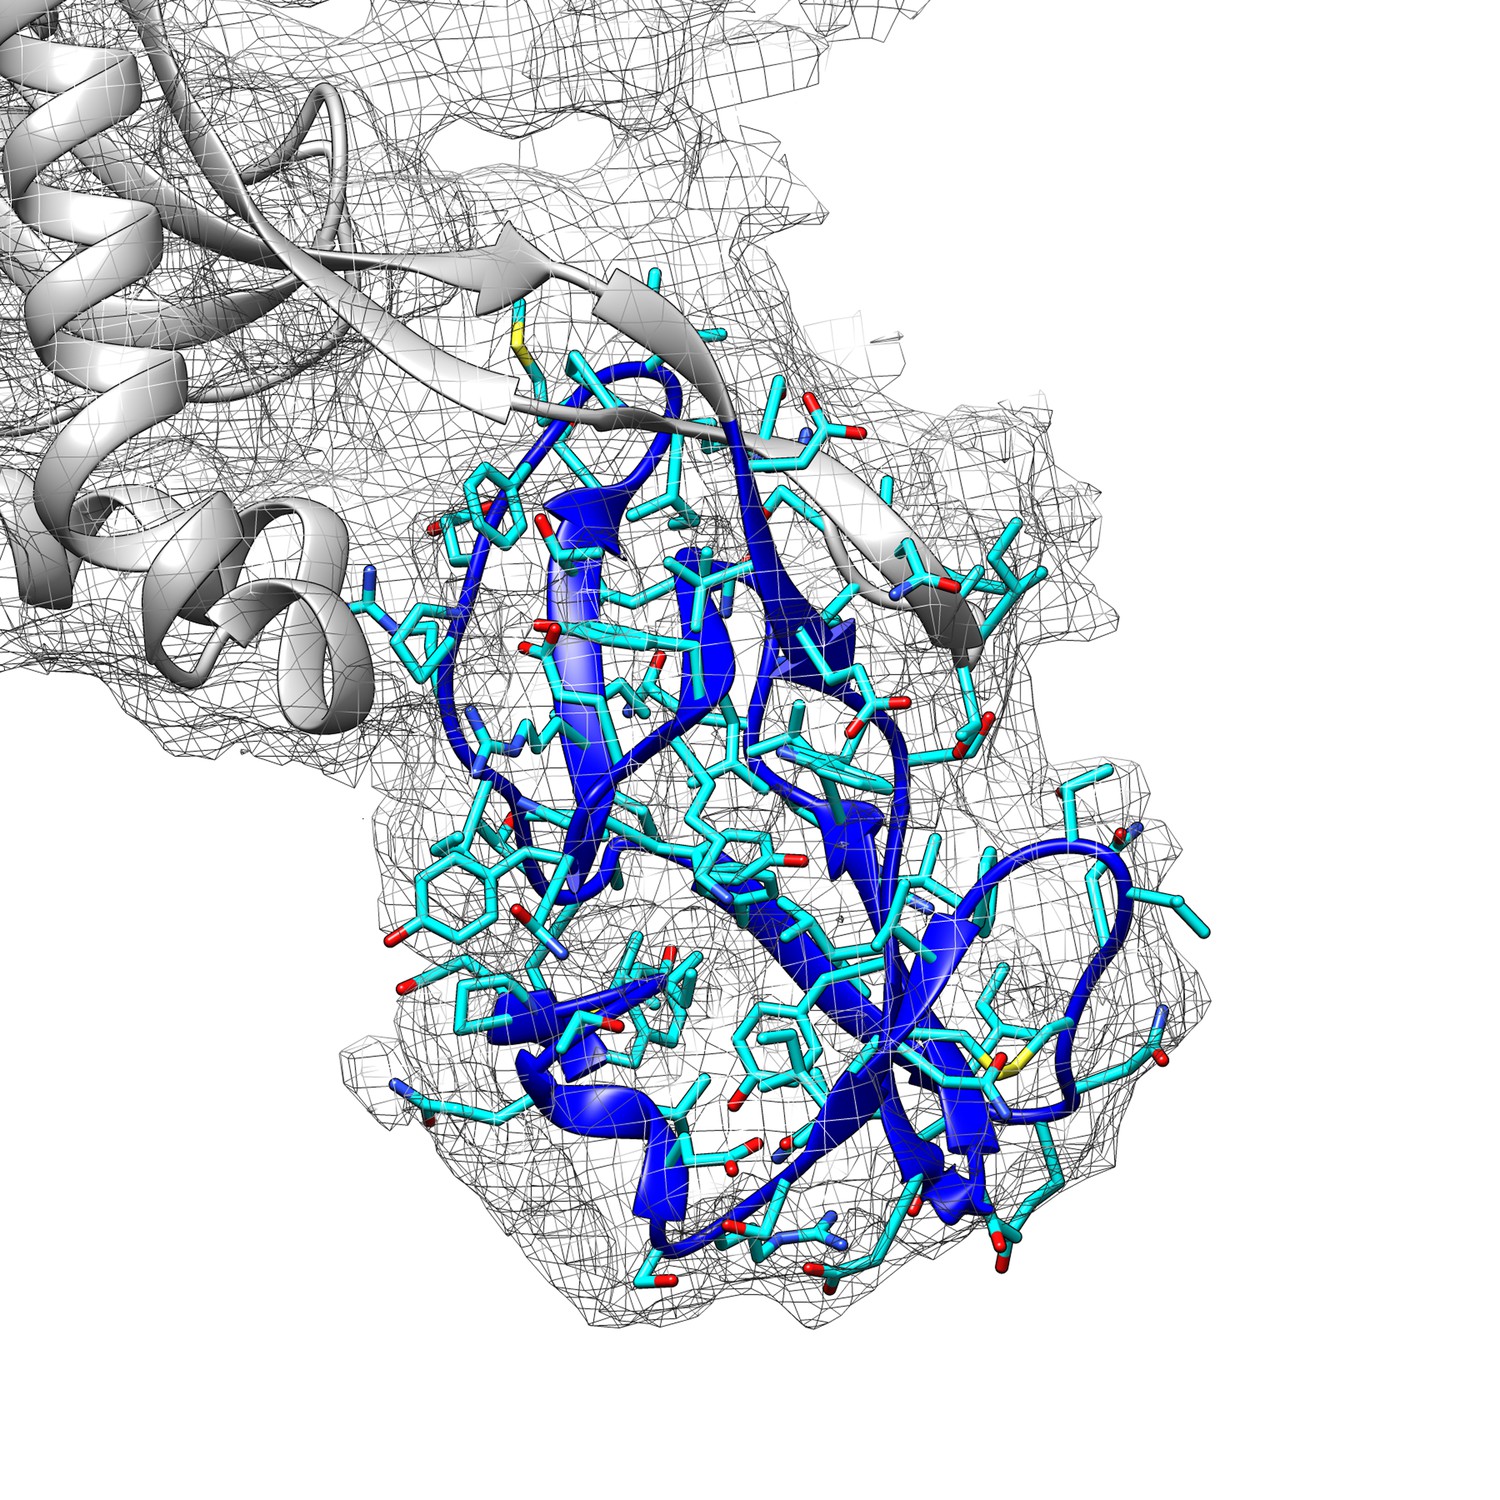
Fitting of the connector domain into its cryo-EM map density.
The cryo-EM map is contoured at 3.0 RMS to show the map density of the connector domain (blue ribbons).
Figure 5

Models of the complete HCoV-229E S-protein ectodomain and locations of the N-glycosylation sites.
(a) A composite model of the complete ectodomain showing the cryo-EM structure determined (enclosed by the box) and a homology model of the HR2 region based on PDB: 2FXP. For each N-glycan observed in the cryo-EM map, the Asn-linked GlcNAc moiety is shown in sphere representation; cyan, those on chain A (orange ribbons). The red dotted circles indicate other potential N-glycosylation sites on chain A. (b) The S2 region of the pre-fusion model. (c) A composite model of the 229E post-fusion form based on the MHV post-fusion structure (PDB: 6B3O) and a crystal structure of the post-fusion 229E HR1-HR2 six-helical bundle (PDB: 5YL9). Red, CH; teal, HR1; orange, HR2. Each potential N-glycan is indicated by a cyan sphere at the Asn sidechain amide group.
Figure 6
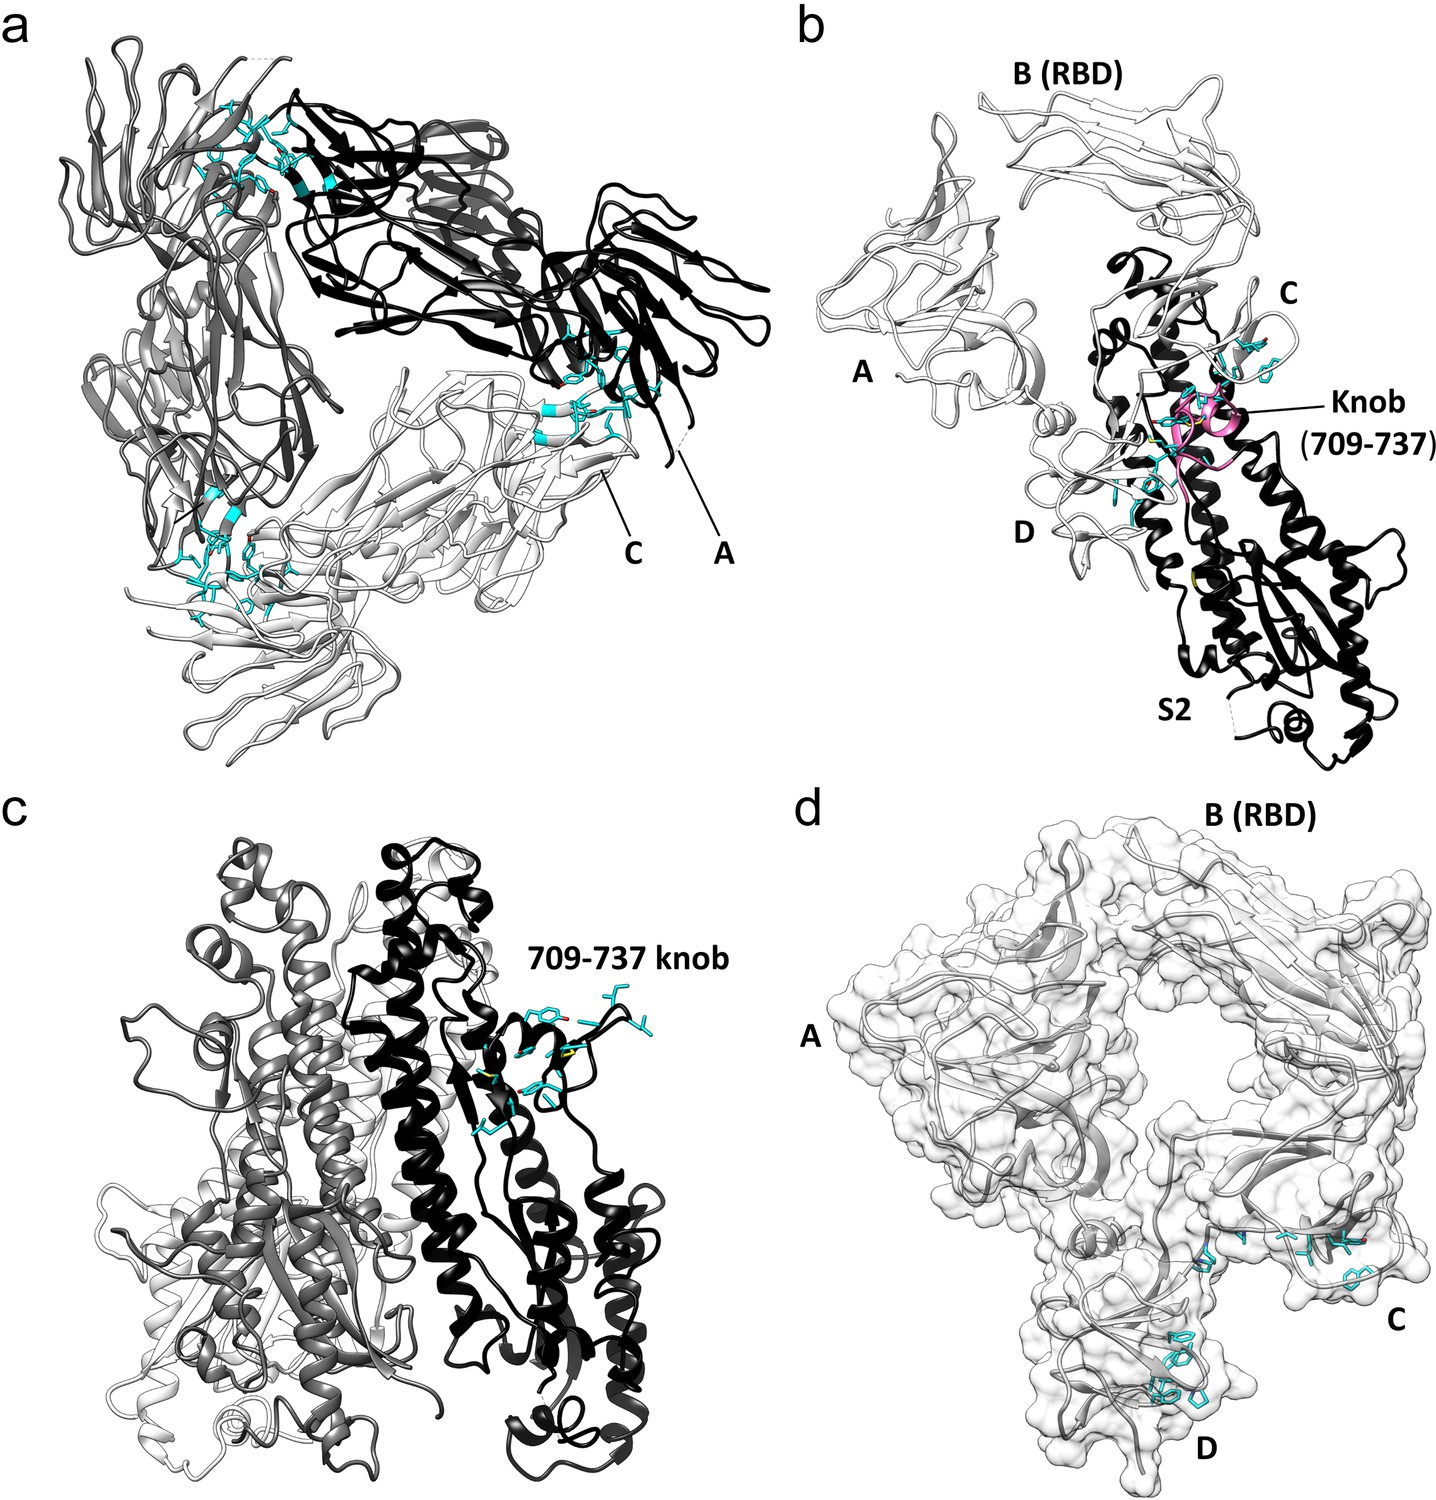
Key hydrophobic interactions defining the assembly of the HCoV-229E S-protein trimer.
(a) Hydrophobic interactions in the S1 region. Each monomer is colored white, gray and black, respectively. Apolar residues between the S1 subunits are colored cyan. (b) The S1 subunit of one monomer (white) interacts with the S2 subunit of another monomer (black). The C and D domains of the S1 subunit form a hydrophobic clamp over the knob formed by S2 subunit residues 709–737 (magenta); interacting apolar side chains are shown in cyan. (c) Side view of the S2 region of the trimer showing the 709–737 knob; apolar residues are colored cyan (on one monomer only). (d) The hydrophobic clamp is formed by domains C and D; apolar residues in contact with the 709–737 knob are shown in cyan.
Figure 7 with 1 supplement
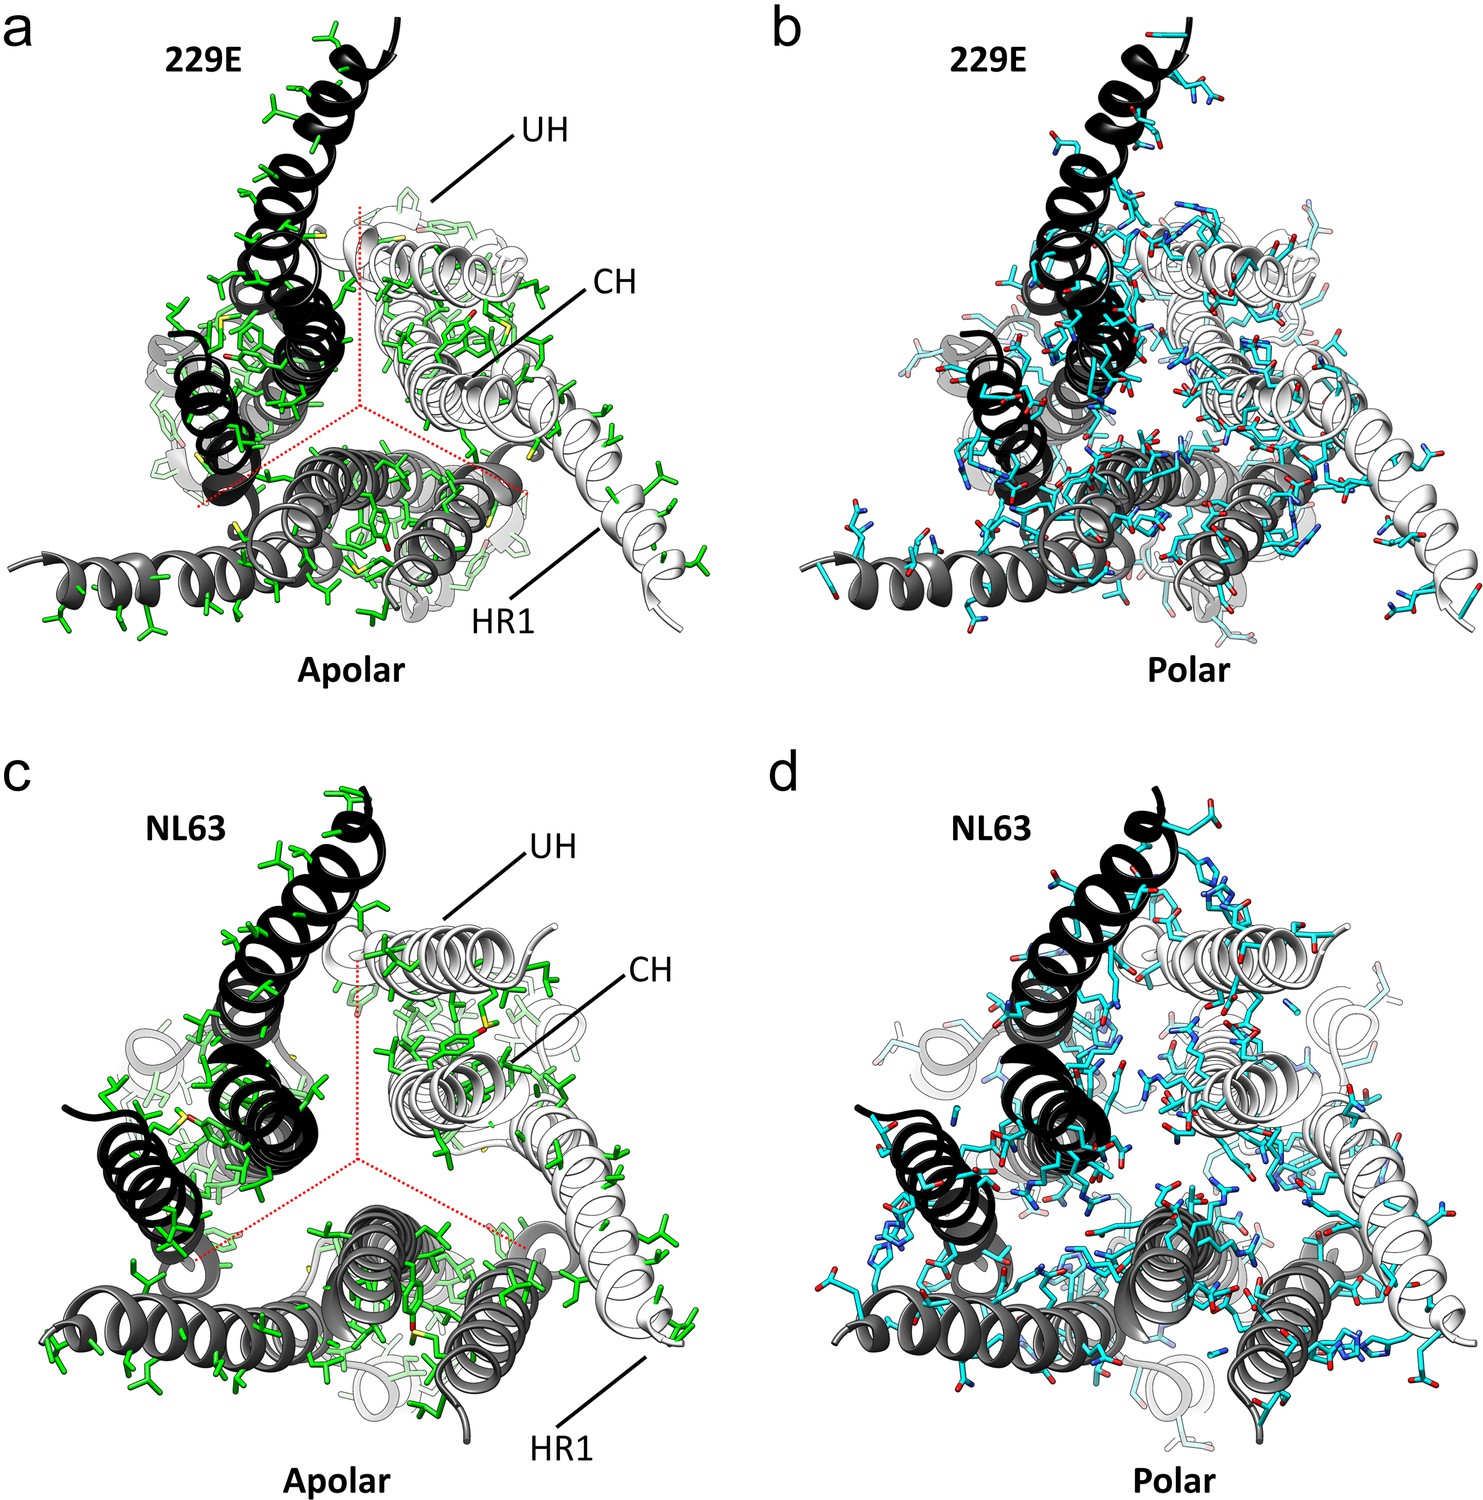
The interfaces in the S2 helical core region of the HCoV-229E S-protein are hydrophilic.
(a,b) Bottom views of the interfaces in the S2 helical core region. For clarity only the three major components of the trimer interface in the S2 region are shown: UH, HR1821-871 and CH. The red dotted lines indicate the interfaces between subunits. All the apolar residues in these segments are shown in (a). All the polar residues in these segments are shown in (b). (c, d) The trimer interfaces of the HCoV-NL63 S2 helical core region represented as in (a, b).
Figure 7—figure supplement 1
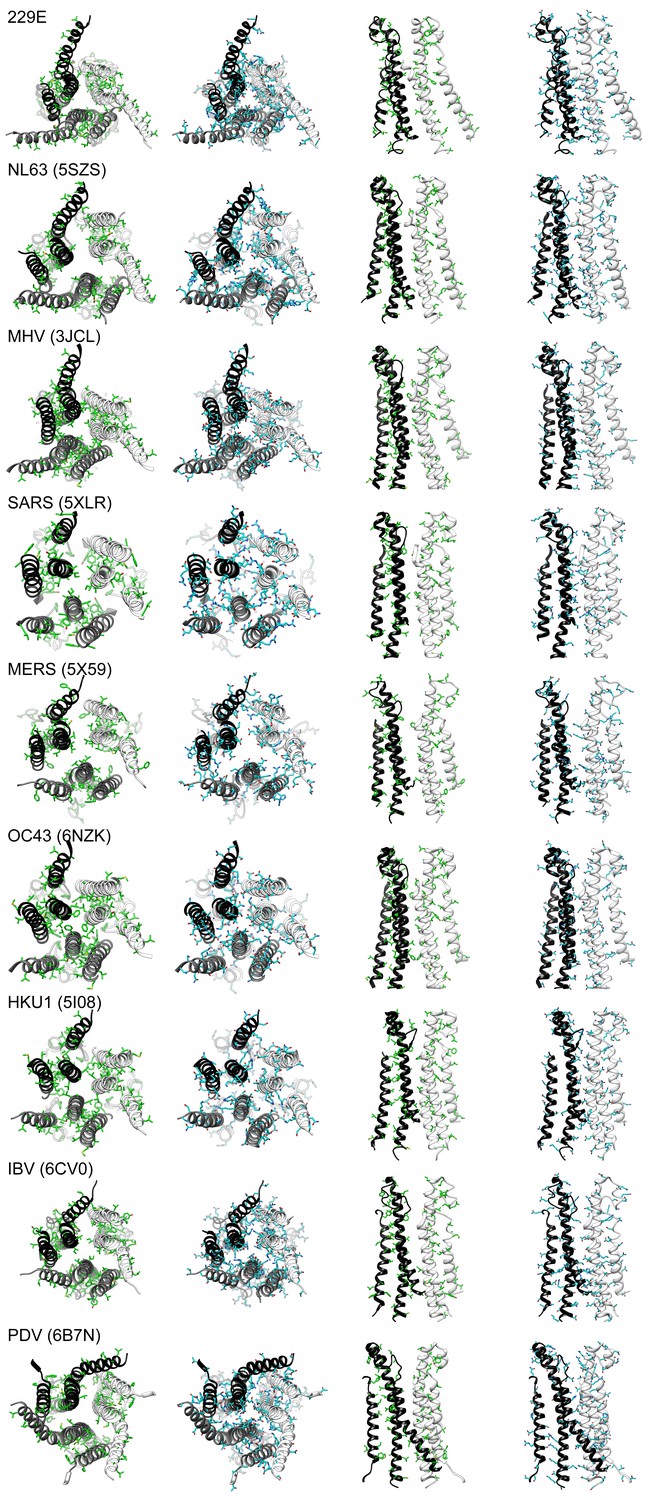
The subunit interfaces in the helical core region are hydrophilic in coronaviruses.
For each coronavirus S-protein, the three interface-forming helices CH, UH and HR1 long helix are shown with all their apolar (green) or polar (cyan) residues. From left to right: bottom view, apolar residues; bottom view, polar residues; side view, apolar residues; side view, polar residues. For the side views only two subunits are shown to reveal the interface. PDB entry IDs of the S-proteins are listed in the brackets.
Figure 8
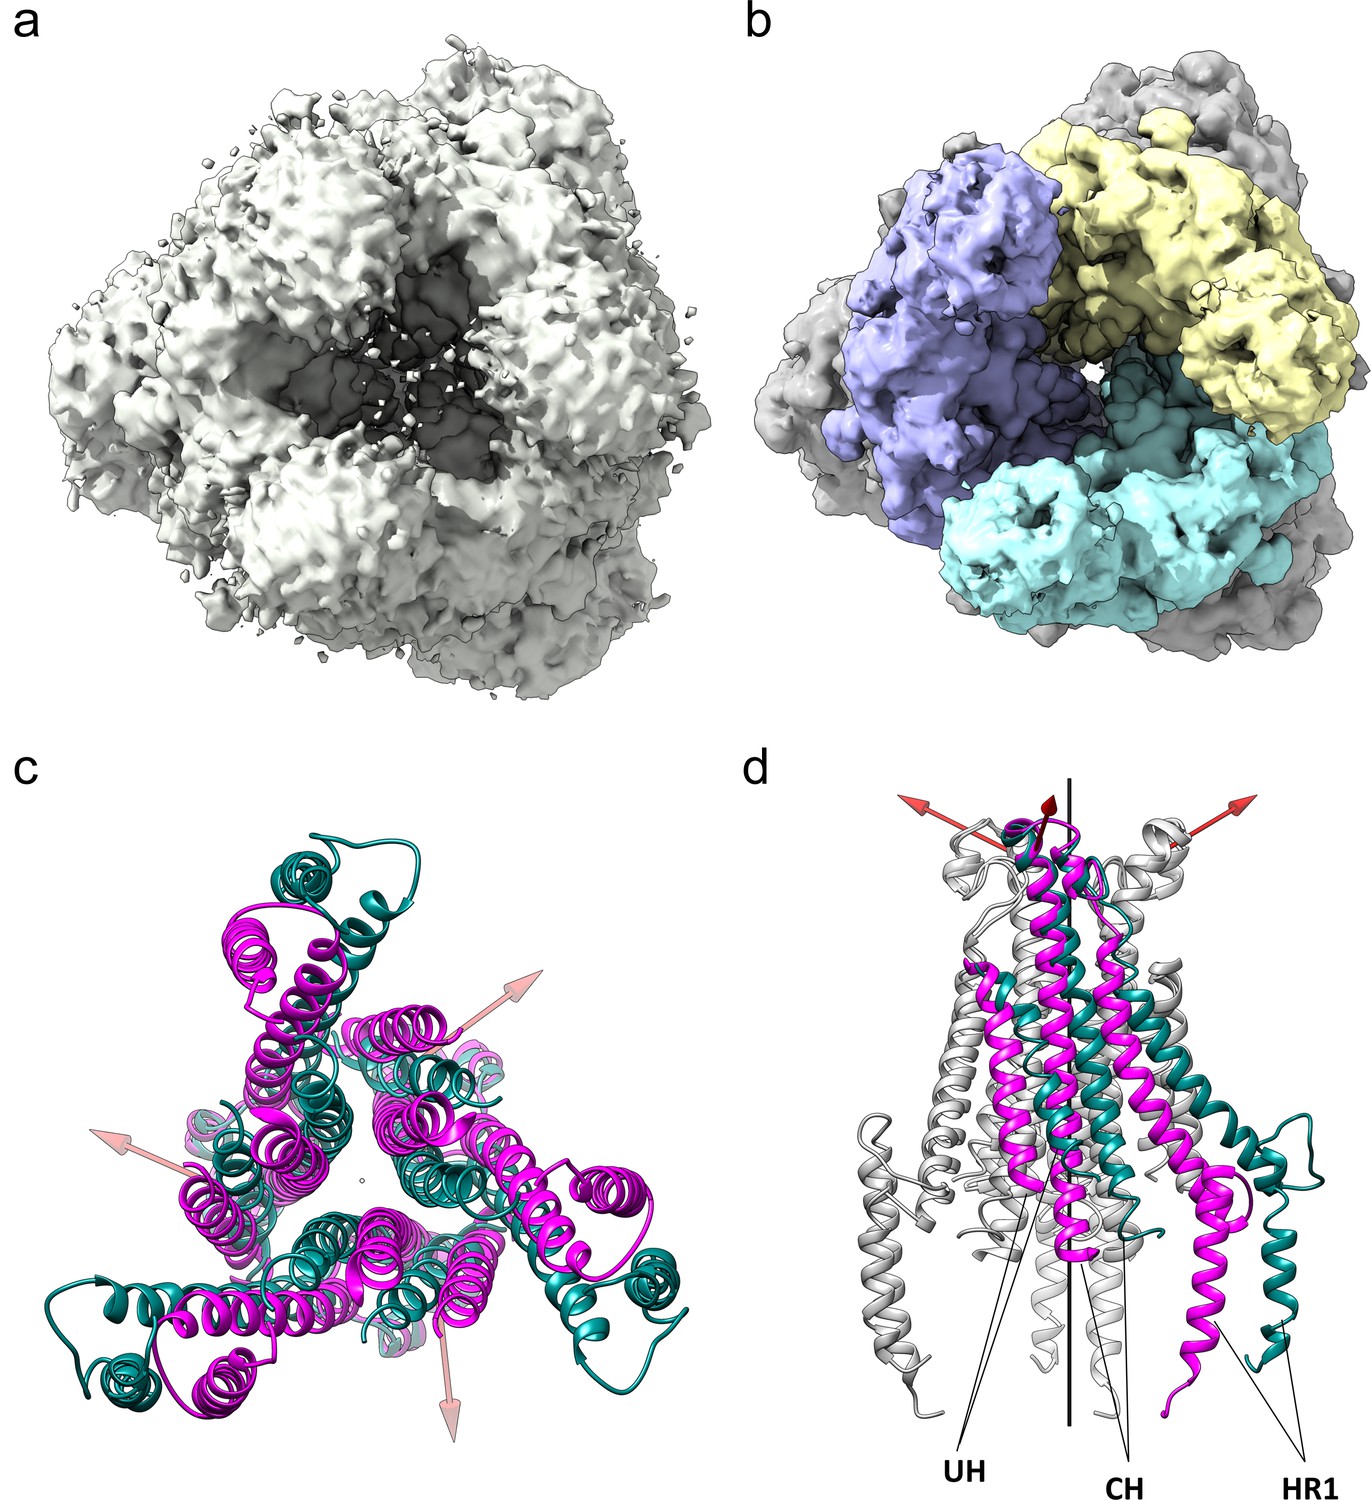
The HCoV-229E S-protein shows a large opening in the S2 region.
(a,b) Bottom views of the S-protein trimer at two contour levels showing the opening in S2 at (a) 1.5 RMS and (b) 3.0 RMS. The three S2 subunits are colored differently in (b). (c, d) Comparison of the 229E (teal) and NL63 (magenta) S2 core helices. (c) Bottom view. (d) Side view, with only one subunit colored. Each 229E S2 subunit rotates ~11° relative to the NL63 S2 subunit. Red arrows indicate the rotation axes around which each monomer rotates.
Videos
Video 1
Comparison of the 229E and NL63 S-proteins (Bottom view).
Two views showing a morphing between the two S-proteins. PDB ID: NL63, 5SZS. An S1 subunit is colored cyan. The S2 subunit with which it associates is from another monomer and it is colored blue.
Video 2
Comparison of the 229E and NL63 S-proteins(Side view).
Video 3
Comparison of the CH helix in the pre-fusion and post-fusion conformations of the MHV S-protein.
Top view showing the morphing between the two helices. PDB IDs: pre-fusion, 3JCL; post-fusion, 6B3O. Rotation of the CH helix during the conversion from the pre-fusion to the post-fusion conformation breaks one apolar contact (Leu 1062, blue) and forms another (Val 1070, green). The rest of the residues in the interfaces are polar.
Additional files
-
Supplementary file 1
Cryo-EM data collection and refinement statistics.
- https://cdn.elifesciences.org/articles/51230/elife-51230-supp1-v2.docx
-
Supplementary file 2
X-ray crystallographic data collection and refinement statistics.
**Values in parentheses are for the highest-resolution shell.
- https://cdn.elifesciences.org/articles/51230/elife-51230-supp2-v2.docx
-
Transparent reporting form
- https://cdn.elifesciences.org/articles/51230/elife-51230-transrepform-v2.docx
Download links
A two-part list of links to download the article, or parts of the article, in various formats.
Downloads (link to download the article as PDF)
Open citations (links to open the citations from this article in various online reference manager services)
Cite this article (links to download the citations from this article in formats compatible with various reference manager tools)
The human coronavirus HCoV-229E S-protein structure and receptor binding
eLife 8:e51230.
https://doi.org/10.7554/eLife.51230


