Reversible promoter methylation determines fluctuating expression of acute phase proteins
- MOE Key Laboratory of Cell Activities and Stress Adaptations, School of Life Sciences, Lanzhou University, China
- MOE Key Laboratory of Environment and Genes Related to Diseases, School of Basic Medical Sciences, Xi'an Jiaotong University, China
Figures
Figure 1
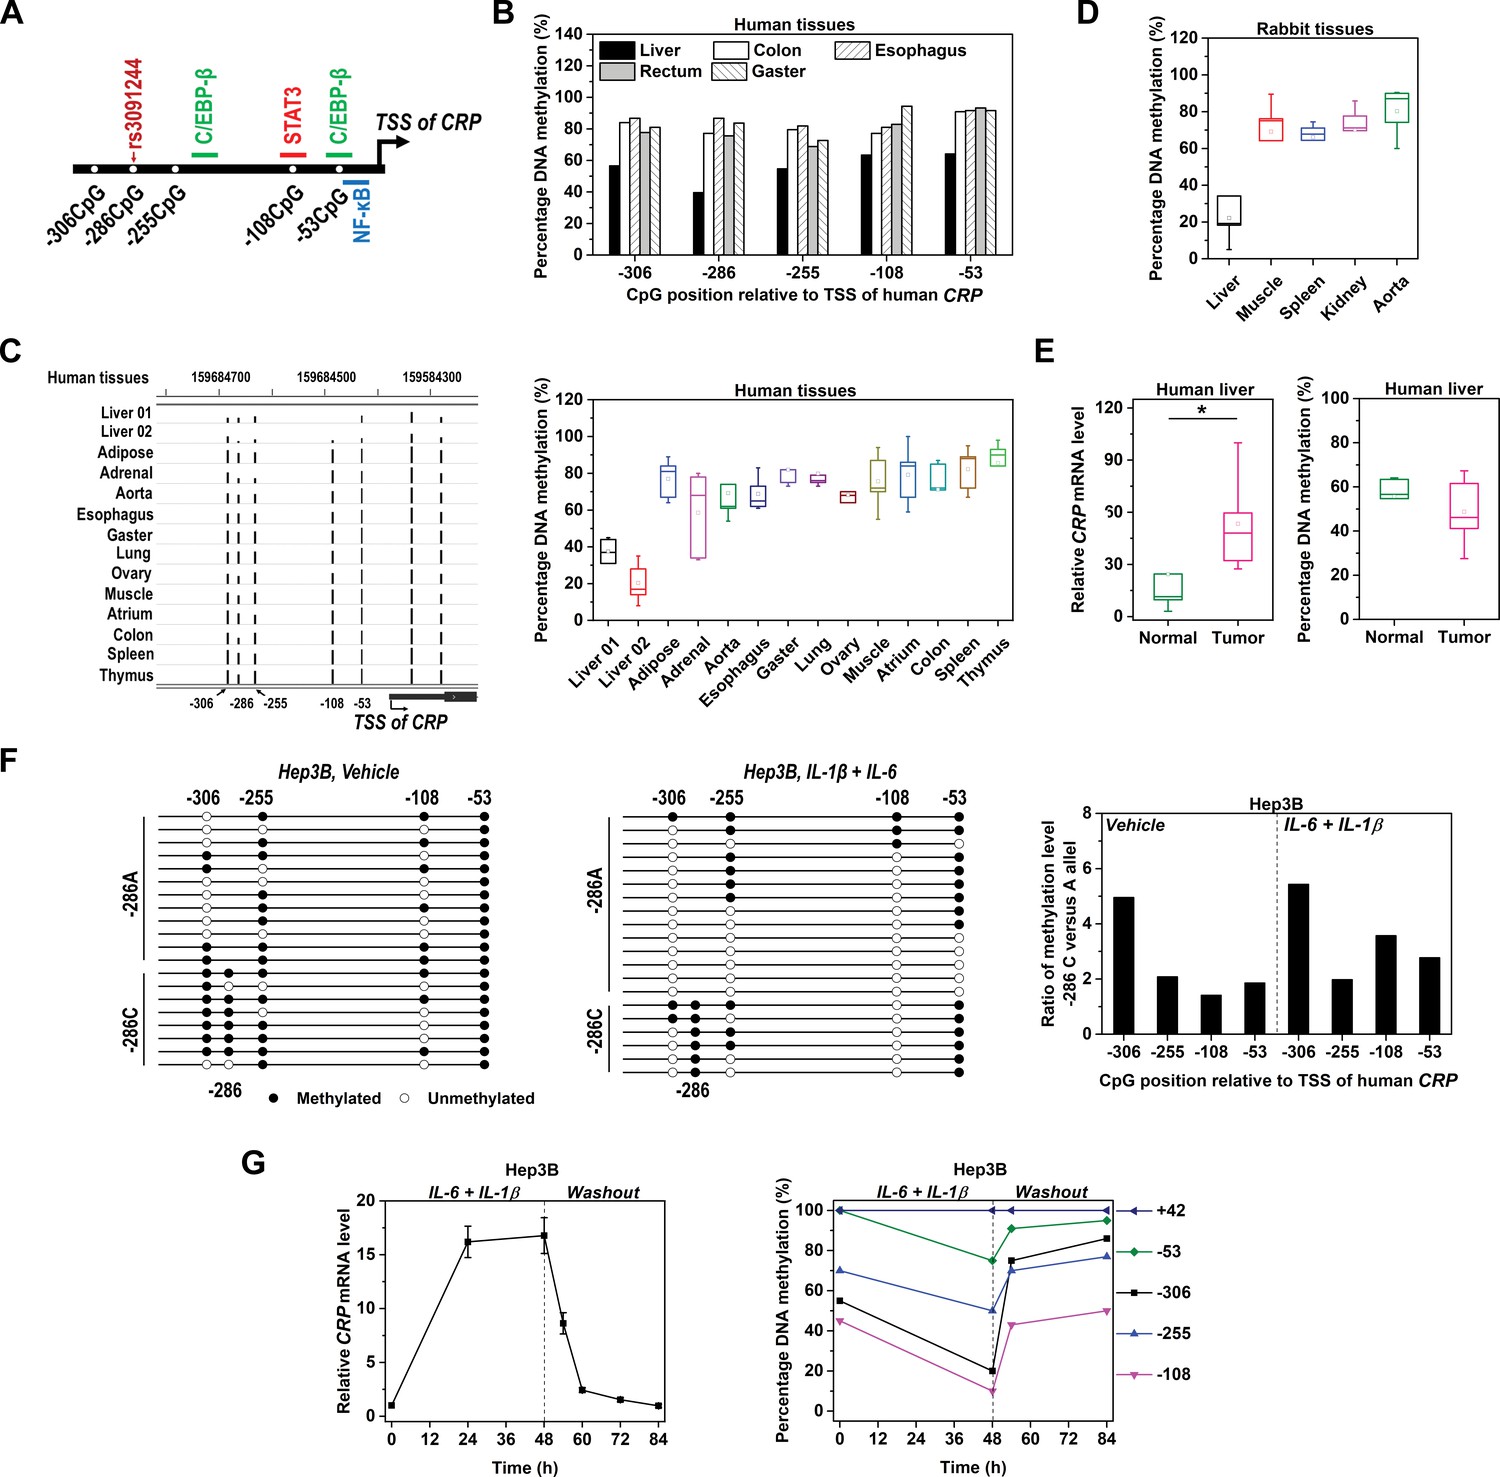
Methylation level of CRP promoter is inversely associated with expression.
(A) Schematic illustration of CRP promoter in which SNP rs3091244, CpG motifs and TF binding sites are indicated. (B) Methylation levels of CRP promoter (−550 ~ 1 bp) in pooled normal human tissues adjacent to tumors (five liver, eight colon, 10 esophagus, 10 rectum and 10 gaster) were determined by bisulfite cloning sequencing. (C) Methylation levels of CRP promoter in normal human tissues were retrieved from available GEO datasets generated by whole-genome bisulfite sequencing: Liver 01-GSM916049, Liver 02-GSM1716965, Adipose-GSM1120331, Adrenal-GSM1120325, Aorta-GSM1120329, Esophagus-GSM983649, Gaster-GSM1120333, Lung-GSM983647, Ovary-GSM1120323, Muscle-GSM1010986, Atrium-GSM1120335, Colon-GSM983645, Spleen-GSM983652, Thymus-GSM1120322 (Gene Expression Omnibus database). The bisulfite sequencing tracks of CRP promoter (left; the height of the black bars represents percentage of DNA methylation) and pooled analysis (right) are shown. (D) Methylation levels of CRP promoter in rabbit tissues were determined by bisulfite cloning sequencing. Liver is the major organ expressing CRP in both humans and rabbits. Accordingly, the methylation levels of CRP promoter are lower in normal liver tissues than in other tissues. (E) Levels of CRP expression (left) and promoter methylation (right) in tumor versus normal tissues from human livers (n = 5) were determined by q-PCR and bisulfite cloning sequencing, respectively. Liver tumors exhibit higher levels of CRP expression but lower levels of promoter methylation than adjacent normal liver tissues. *p<0.05 (paired t-test). (F) Bisulfite cloning sequencing of −286C versus −286A alleles of CRP promoter in Hep3B cells at resting (Vehicle treated) or induced states (IL-6 and IL-1β treated). −286A allele was less methylated than −286C allele at both states. (G) IL-6 (10 ng/ml) and IL-1β (1 ng/ml) treatment induced CRP expression (left) and promoter demethylation (right) in Hep3B cells, while withdraw of these cytokines led to a quick drop of CRP expression and promoter re-methylation. The result of one representative experiment is shown.
Figure 2 with 1 supplement
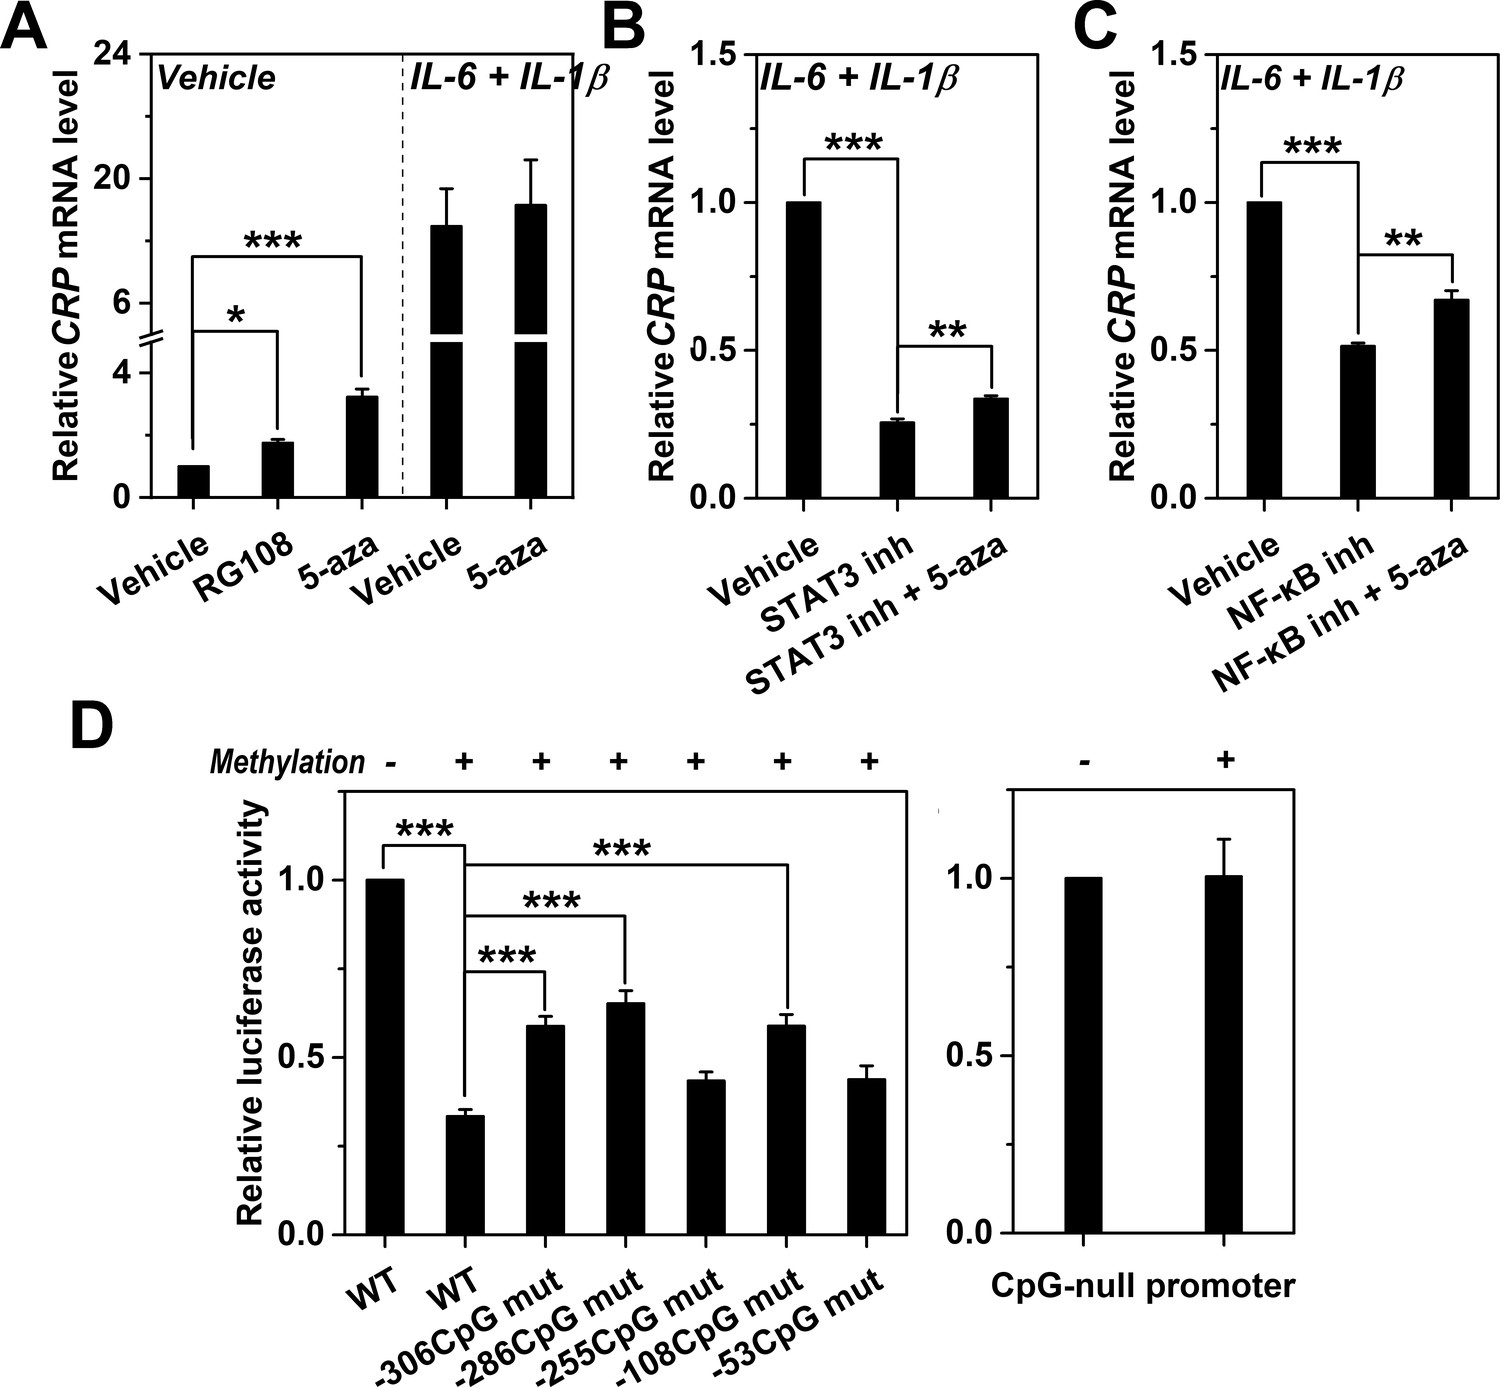
Methylation levels of CRP promoter causally determines expression.
(A) The effects of DNA methylation inhibitor RG-108 (25 μM, 24 hr) or 5-aza (5 μM, 12 hr) on CRP expression in Hep3B cells at the resting or induced state (n = 3). These inhibitors enhanced the resting but not the induced expression of CRP. At the induced state, the defective CRP expression caused by STAT3 (s31-201, 30 μM, 24 hr) (B) or NF-κB inhibition (BAY11-7082, 2 μM, 24 hr) (C) was partially reversed by 5-aza (5 μM, 24 hr) (n = 3). (D) In vitro vector methylation markedly inhibited reporter activities of wildtype CRP promoter (WT) following transfection into Hep3B cells (n = 3). Mutating individual CpG motif partially reversed this inhibition. As the control, in vitro vector methylation did not affect reporter activities of a CpG-null version of CRP promoter. Data are presented as mean ± SEM. *p<0.05, **p<0.01, ***p<0.001 (two-tailed t-test).
Figure 2—figure supplement 1
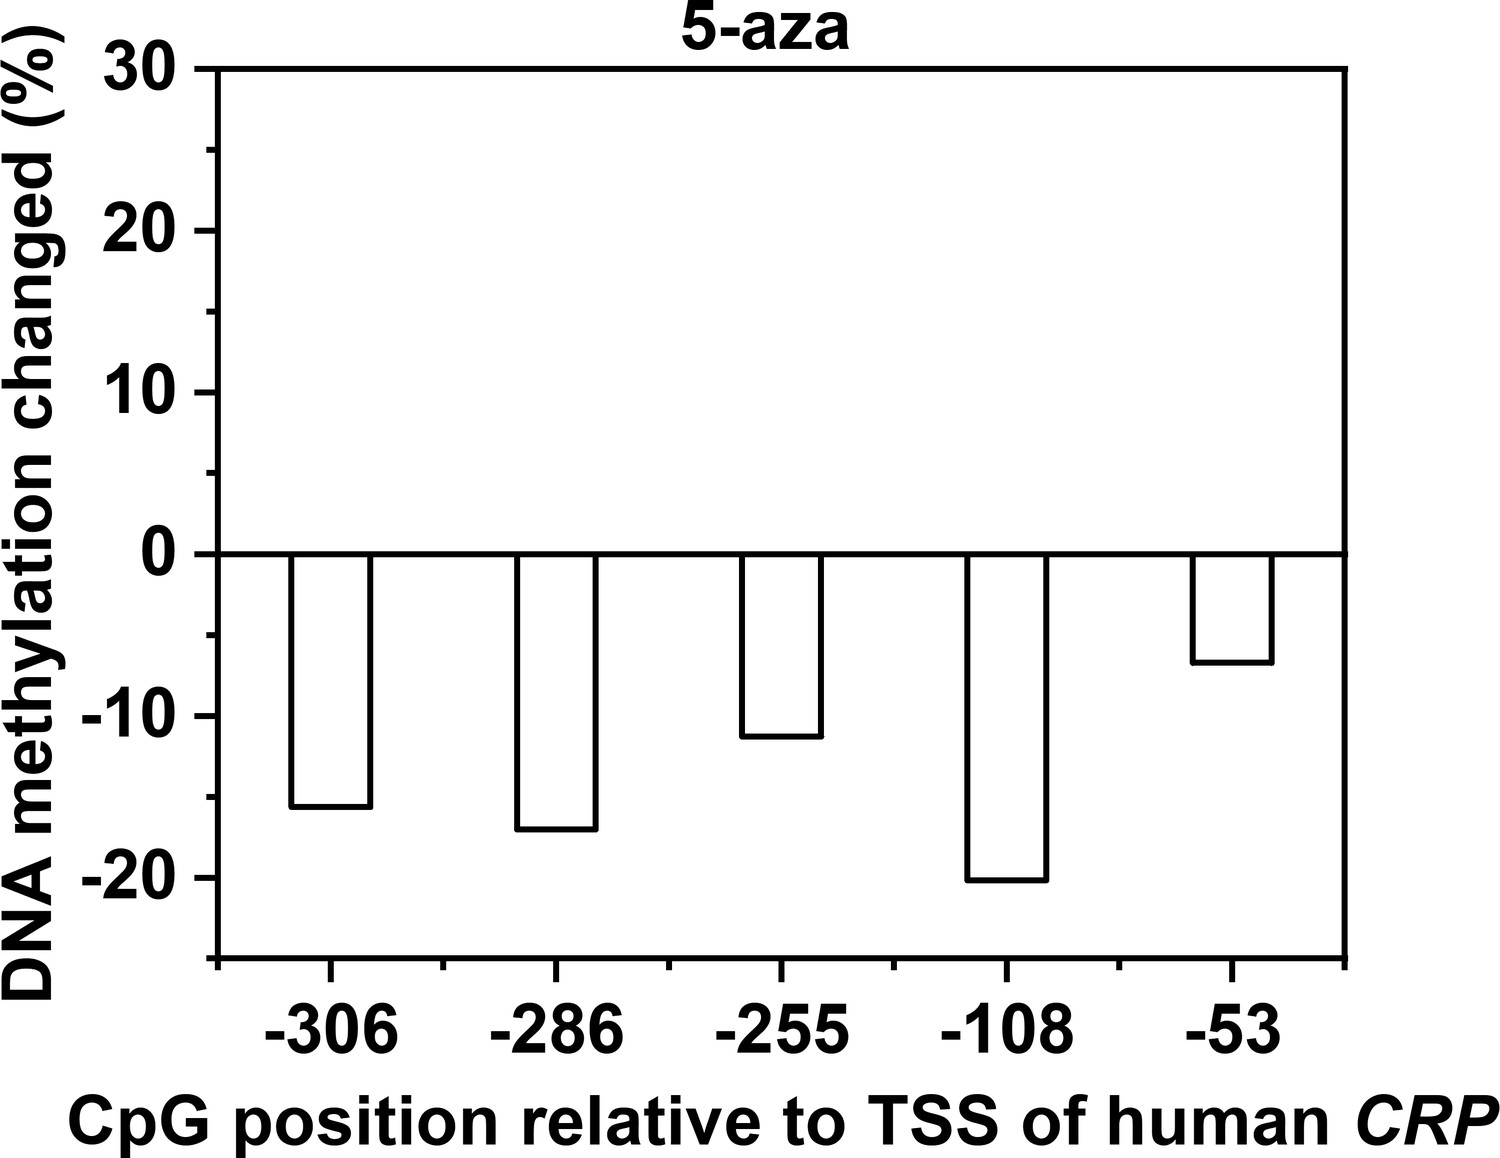
Validation of effects on promoter methylation of CRP by DNA methylation inhibitor.
Methylation levels of CRP promoter in Hep3B cells following treatment with 5-aza were determined with bisulfite cloning sequencing. Changes were calculated by subtracting DNA methylation levels of CRP promoter in vehicle-treated Hep3B cells from that in 5-aza-treated Hep3B cells.
Figure 3 with 3 supplements
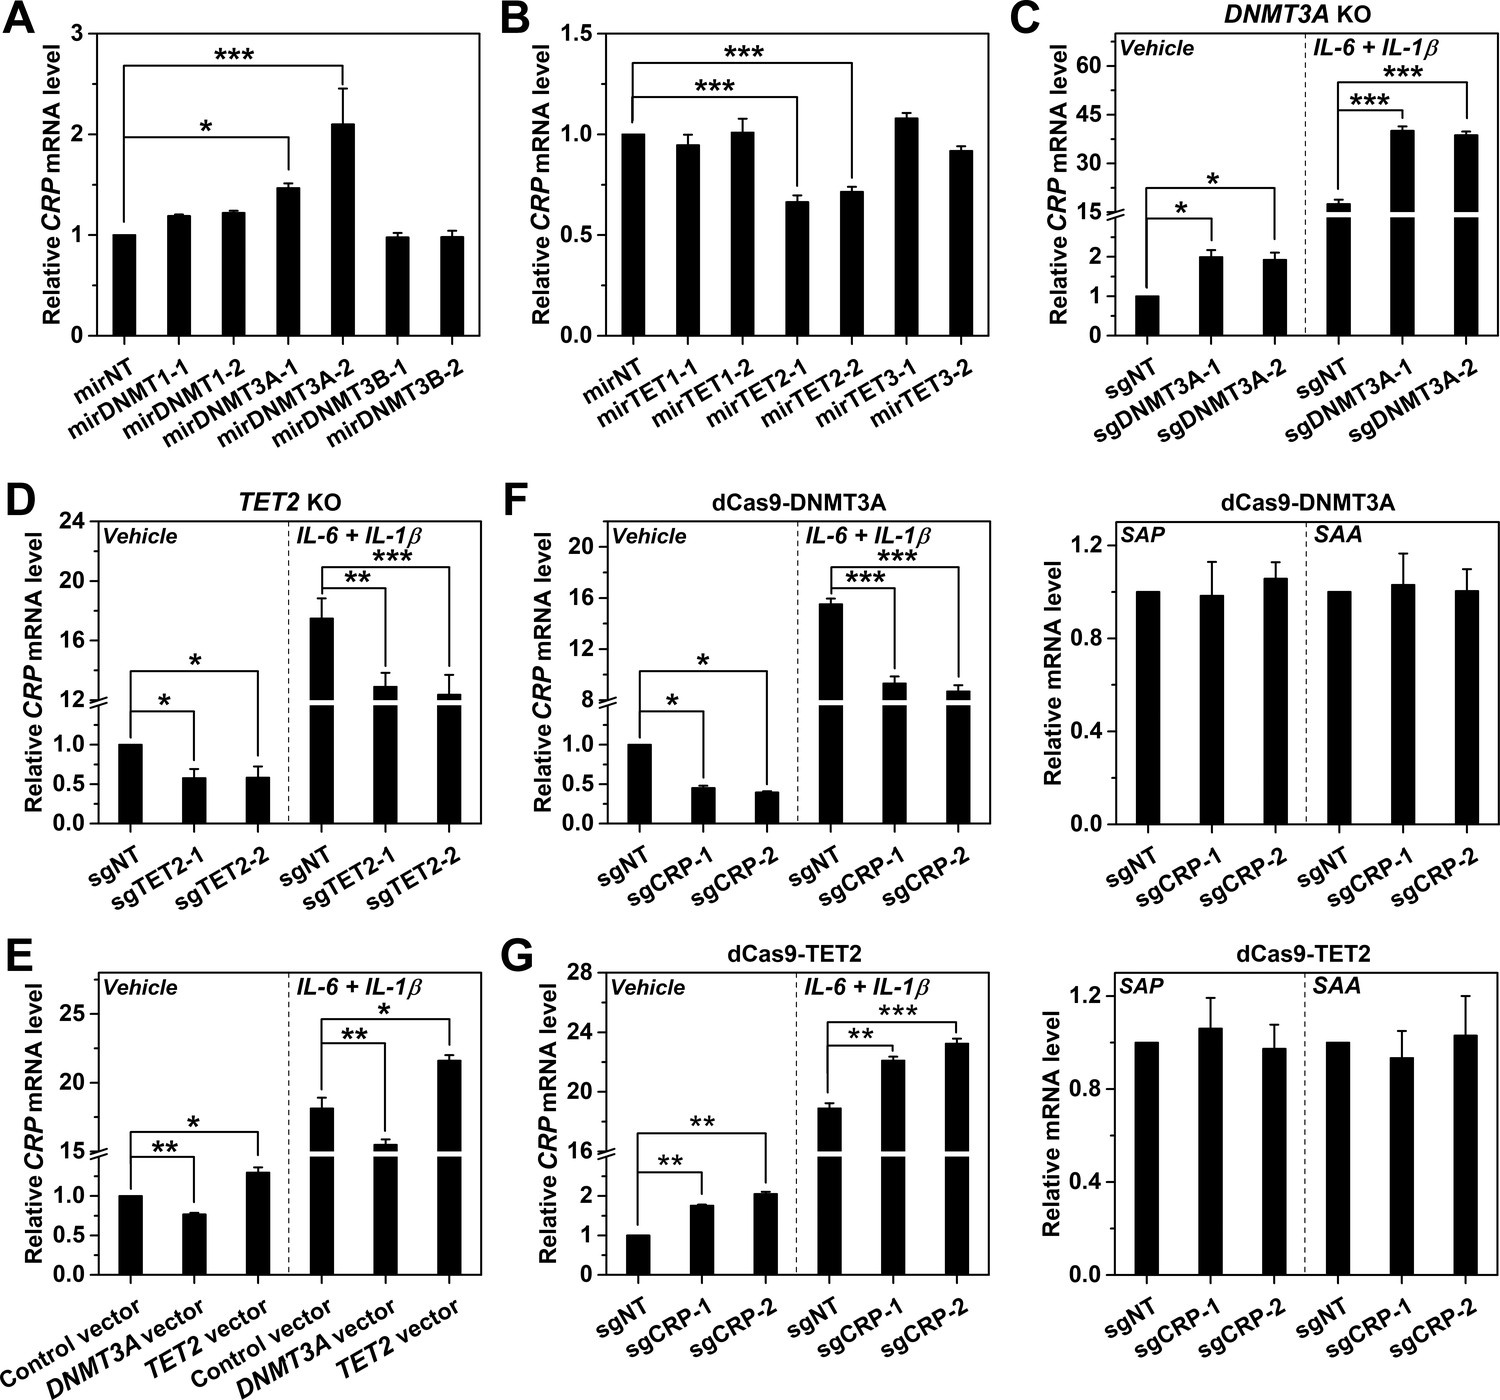
DNMT3A and TET2 regulate CRP expression.
CRP expression in Hep3B cells with DNMT (A) or TET (B) knockdown by control (mirNT) or target-specific miRNA (n = 3). (C) CRP expression in Hep3B cells with co-transfected Cas9 and sgRNAs targeting exon 14 (sgDNMT3A-1) or 2 (sgDNMT3A-2) of DNMT3A (n = 3). (D) CRP expression in Hep3B cells with co-transfected Cas9 and sgRNAs targeting exon 3 (sgTET2-1) or 7 (sgTET2-2) of TET2 (n = 3). (E) CRP expression in Hep3B cells with overexpressed DNMT3A or TET2 (n = 3). CRP expression in Hep3B cells with co-transfected catalytic domain of DNMT3A (F) or TET2 (G) fused to dCas9 and sgRNAs targeting CRP promoter (n = 3). The results identified DNMT3A and TET2 as the negative and positive regulators of CRP expression, respectively. Selective targeting of DNMT3A or TET2 to CRP promoter by dCas9 only regulated the expression of CRP, but did not affect that of serum amyloid A (SAA; a major human APR) or serum amyloid P component (SAP, a paralog of CRP). Data are presented as mean ± SEM. *p<0.05, **p<0.01, ***p<0.001 (two-tailed t-test).
Figure 3—figure supplement 1

Validation of effects on promoter methylation of CRP by DNA methylation-modulating manipulations.
Methylation levels of CRP promoter in Hep3B cells following DNMT3A KD, TET2 KD, DNMT3A KO or TET2 KO were determined with bisulfite cloning sequencing. Changes were calculated by subtracting DNA methylation levels of CRP promoter in mirNT- or sgNT-treated Hep3B cells from that in mirDNMT3A/TET2-, or sgDNMT3A/TET2-treated Hep3B cells.
Figure 3—figure supplement 2
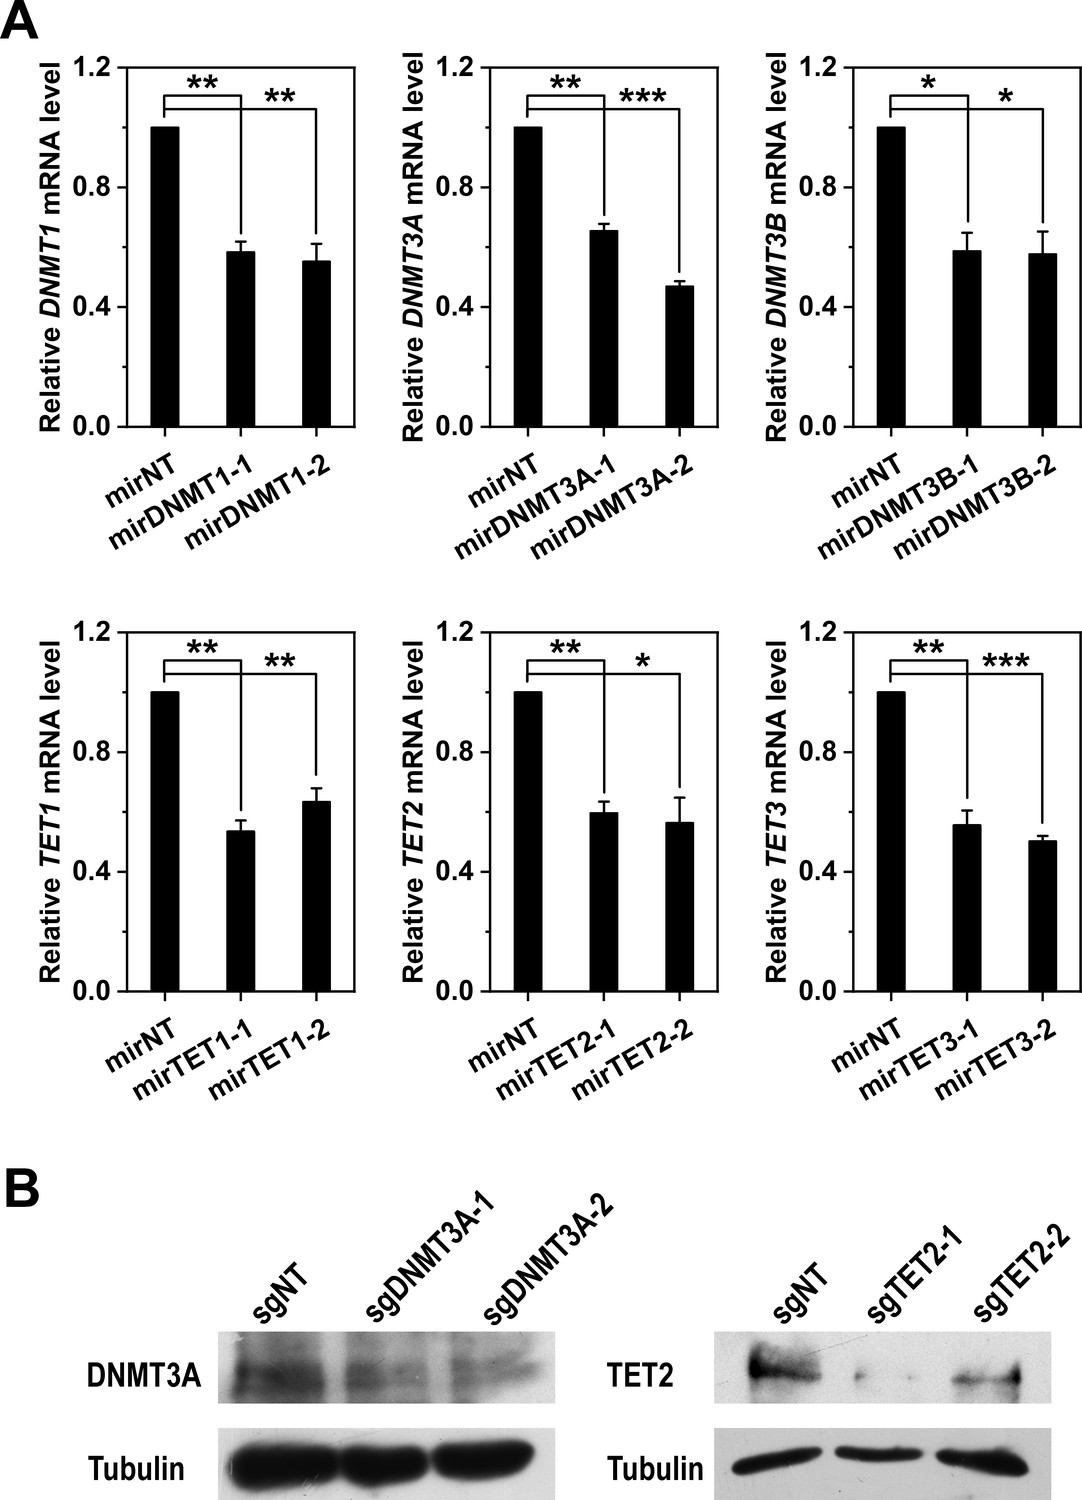
Validation of DNMT3A and TET2 knockdown and knockout.
(A) The mRNA levels of DNMTs and TETs in Hep3B cells transfected with the indicated miRNA were determined with q-PCR. (B) The protein levels of DNMT3A and TET2 in Hep3B cells co-transfected with Cas9 and the indicated sgRNAs were determined with immunoblotting. Both RNAi and Cas9-mediated knockout efficiently reduced the expression of DNMT3A or TET2. Data are presented as mean ± SEM. *p<0.05, **p<0.01, ***p<0.001 (two-tailed t-test).
Figure 3—figure supplement 3
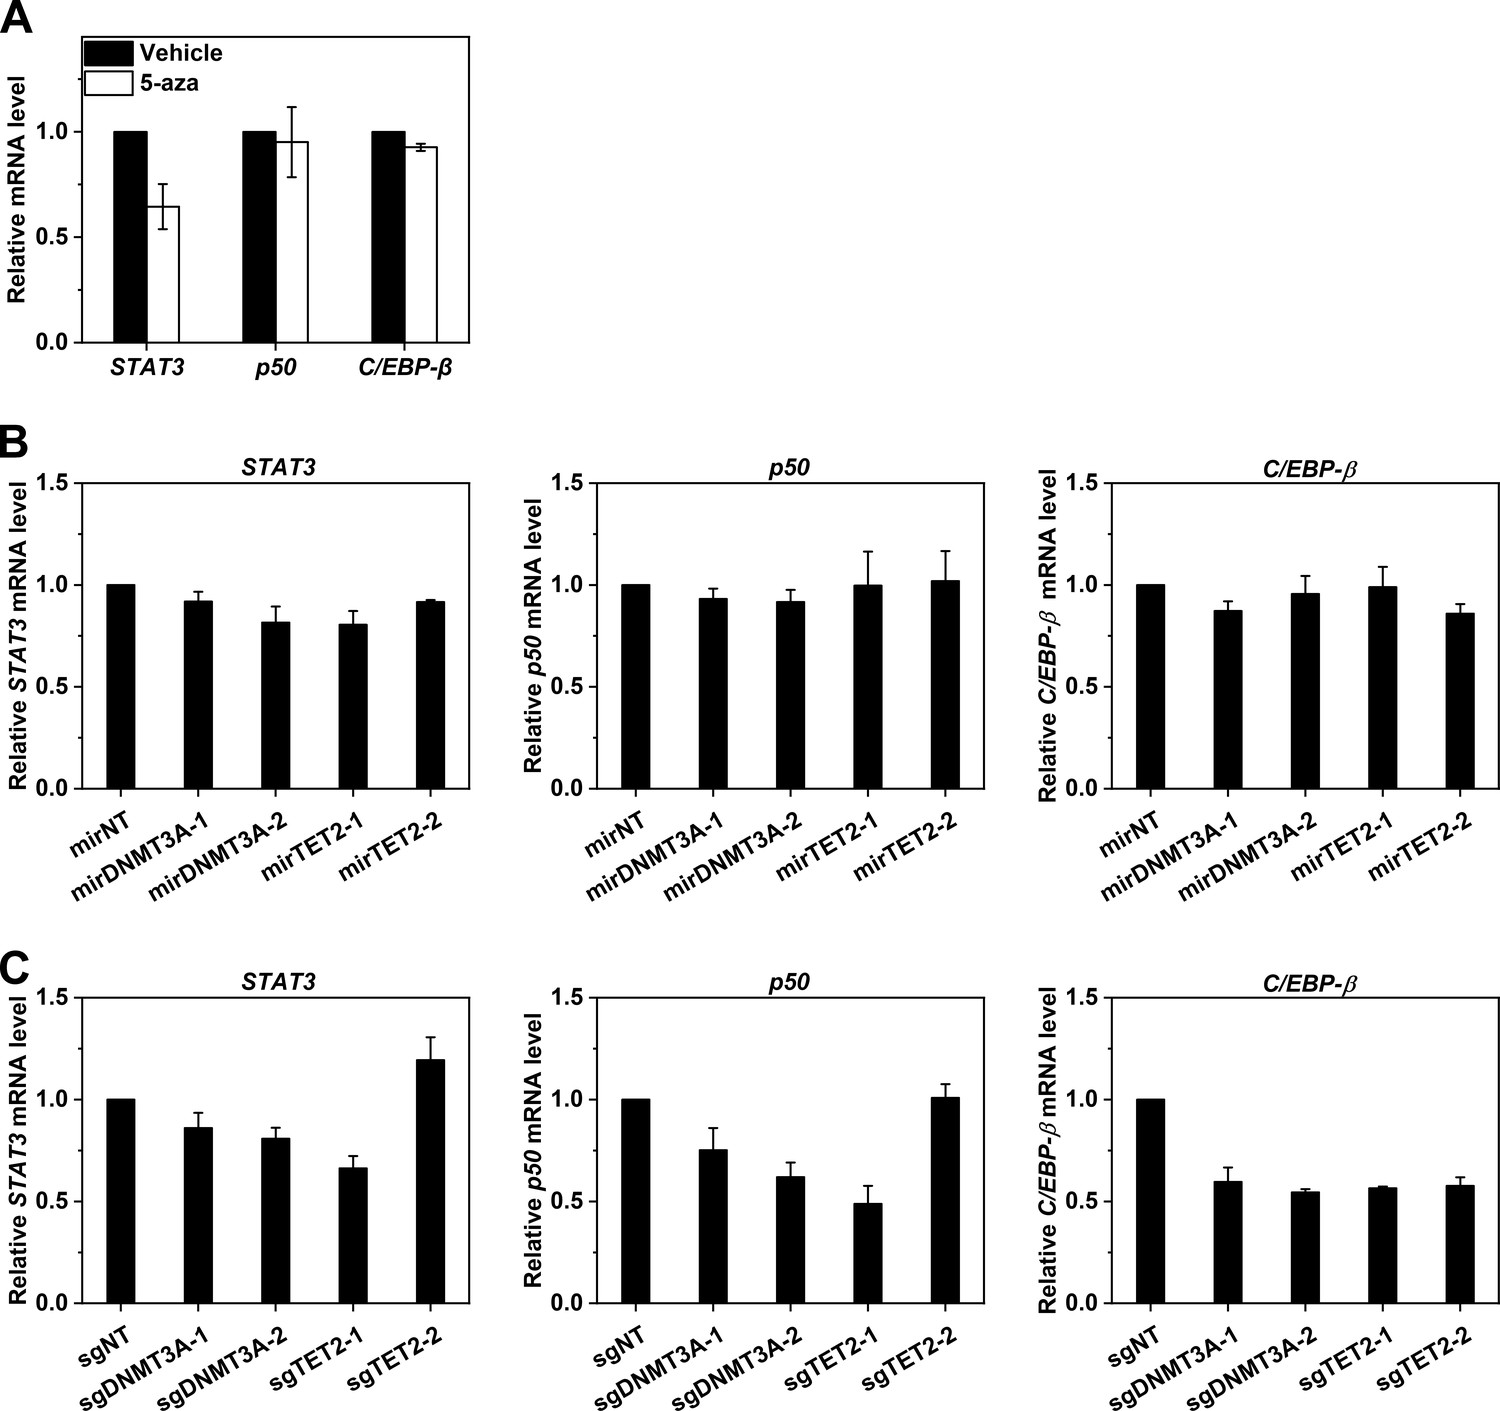
Effects on TF expression by DNA methylation-modulating manipulations.
The mRNA levels of STAT3, p50 and C/EBP-β in Hep3B cells following treatment with 5-aza (A), DNMT3A/TET2 KD (B), or DNMT3A/TET2 KO (C) were determined with q-PCR. Data are presented as mean ± SEM.
Figure 4
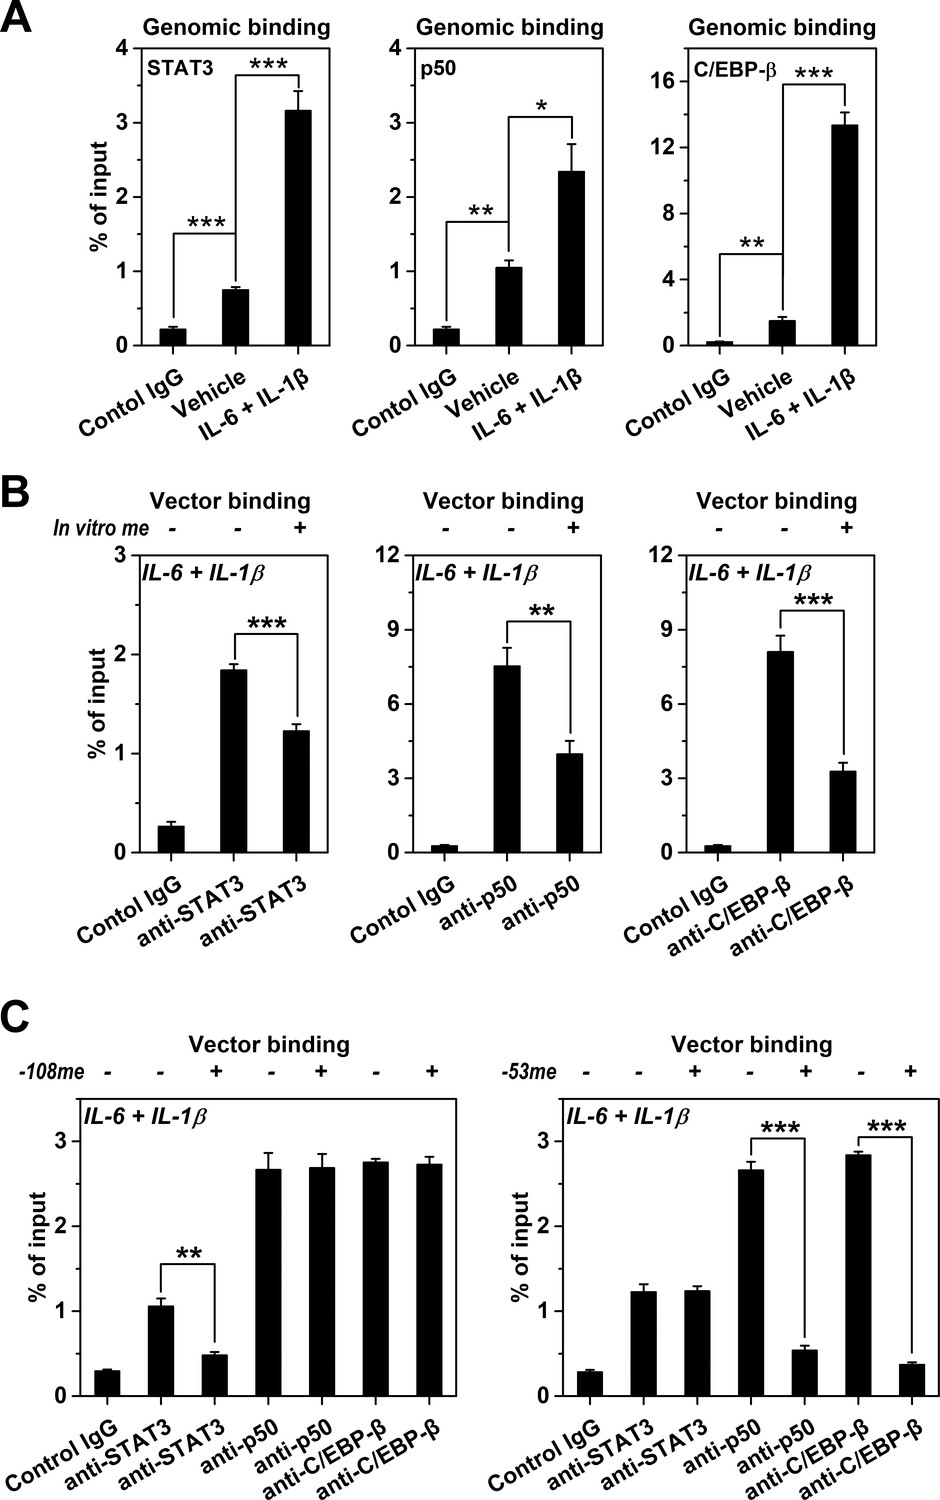
Methylation levels of CRP promoter affect TF recruitment.
The recruitment of TFs to CRP promoter in Hep3B cells was analyzed by ChIP. (A) The recruitment of STAT3, p50 and C/EBP-β to CRP promoter were all markedly enhanced at the induced versus resting state (n = 3). (B) In vitro vector methylation decreased the recruitment of STAT3, p50 and C/EBP-β to a vector containing CRP promoter at the induced state (n = 3). (C) Site-specific methylation at −53CpG inhibited the recruitment of p50 and C/EBP-β, whereas methylation at −108CpG inhibited the recruitment STAT3 to the vector containing CRP promoter at the induced state (n = 3). Data are presented as mean ± SEM. *p<0.05, **p<0.01, ***p<0.001 (two-tailed t-test).
Figure 5

TF recruitment and promoter methylation dynamically crosstalk to regulate the induced expression of CRP.
CRP expression (A) and promoter recruitment of STAT3 (B), p50 (C) and C/EBP-β (D) in Hep3B cells at the induced state without (WT) or with co-transfected Cas9 and sgRNA targeting exon 14 of DNMT3A (n = 3) or targeting exon 3 of TET2 (n = 2) over time. TET2 KO markedly reduced the induction of CRP, and almost abrogated the promoter recruitment of p50 and C/EBP-β. The recruitment of STAT3 to CRP promoter was still evident in TET2 KO cells. DNMT3A KO resulted in a stronger amplitude and altered dynamics of CRP induction. The recruitment to CRP promoter was enhanced for all the three TFs in DNMT3A KO cells, whereas the timing of recruitment was altered only for p50. (E) CRP expression in Hep3B cells treated with vehicle, 1 ng/ml IL-1β, 10 ng/ml IL-6 or their combination for 48 hr (n = 3). As IL-1β is unable to induce IL-6 production in Hep3B cells (Kramer et al., 2008), the effects of STAT3 and p50 can be largely dissociated by treating cells with one single cytokine (Kramer et al., 2008; Ganapathi et al., 1991; Ganapathi et al., 1988). IL-1β could not induce CRP expression, suggesting p50 is not required for the first wave of CRP induction. (F) Methylation levels of CRP promoter in Hep3B cells at the induced state treated without (Vehicle) or with inhibitors of STAT3 (30 μM s31-201) or NF-κB (2 μM BAY11-7082) for 24 hr. (G) Ratios of methylation levels on −286C versus −286A alleles in Hep3B cells at the induced state treated with the NF-κB inhibitor (2 μM BAY11-7082) for 24 hr. Methylation levels (H) and allelic methylation of CRP promoter (I) in Hep3B cells expressing a control or a C/EBP-β vector at the resting state. C/EBP-β overexpression showed no effect on methylation status of CRP promoter. The result of one representative experiment is shown. (J) CRP expression in Hep3B cells with or without C/EBP-β overexpression under the indicated conditions for 48 hr (n = 3). (K) CRP expression in Hep3B cells without (sgNT) or with C/EBP-β KO (sgC/EBP-β) following induction with 10 ng/ml IL-6 and 1 ng/ml IL-1β for 48 hr (n = 3). The dramatic effects of C/EBP-β KO or overexpression suggest that this TF is the major effector that respond to promoter methylation status and determine the amplitude of CRP expression. (L) A schematic illustration of how TF recruitment and promoter methylation dynamically orchestrate to regulate the induction of CRP. Data are presented as mean ± SEM. **p<0.01, ***p<0.001 (two-tailed t-test).
Figure 6
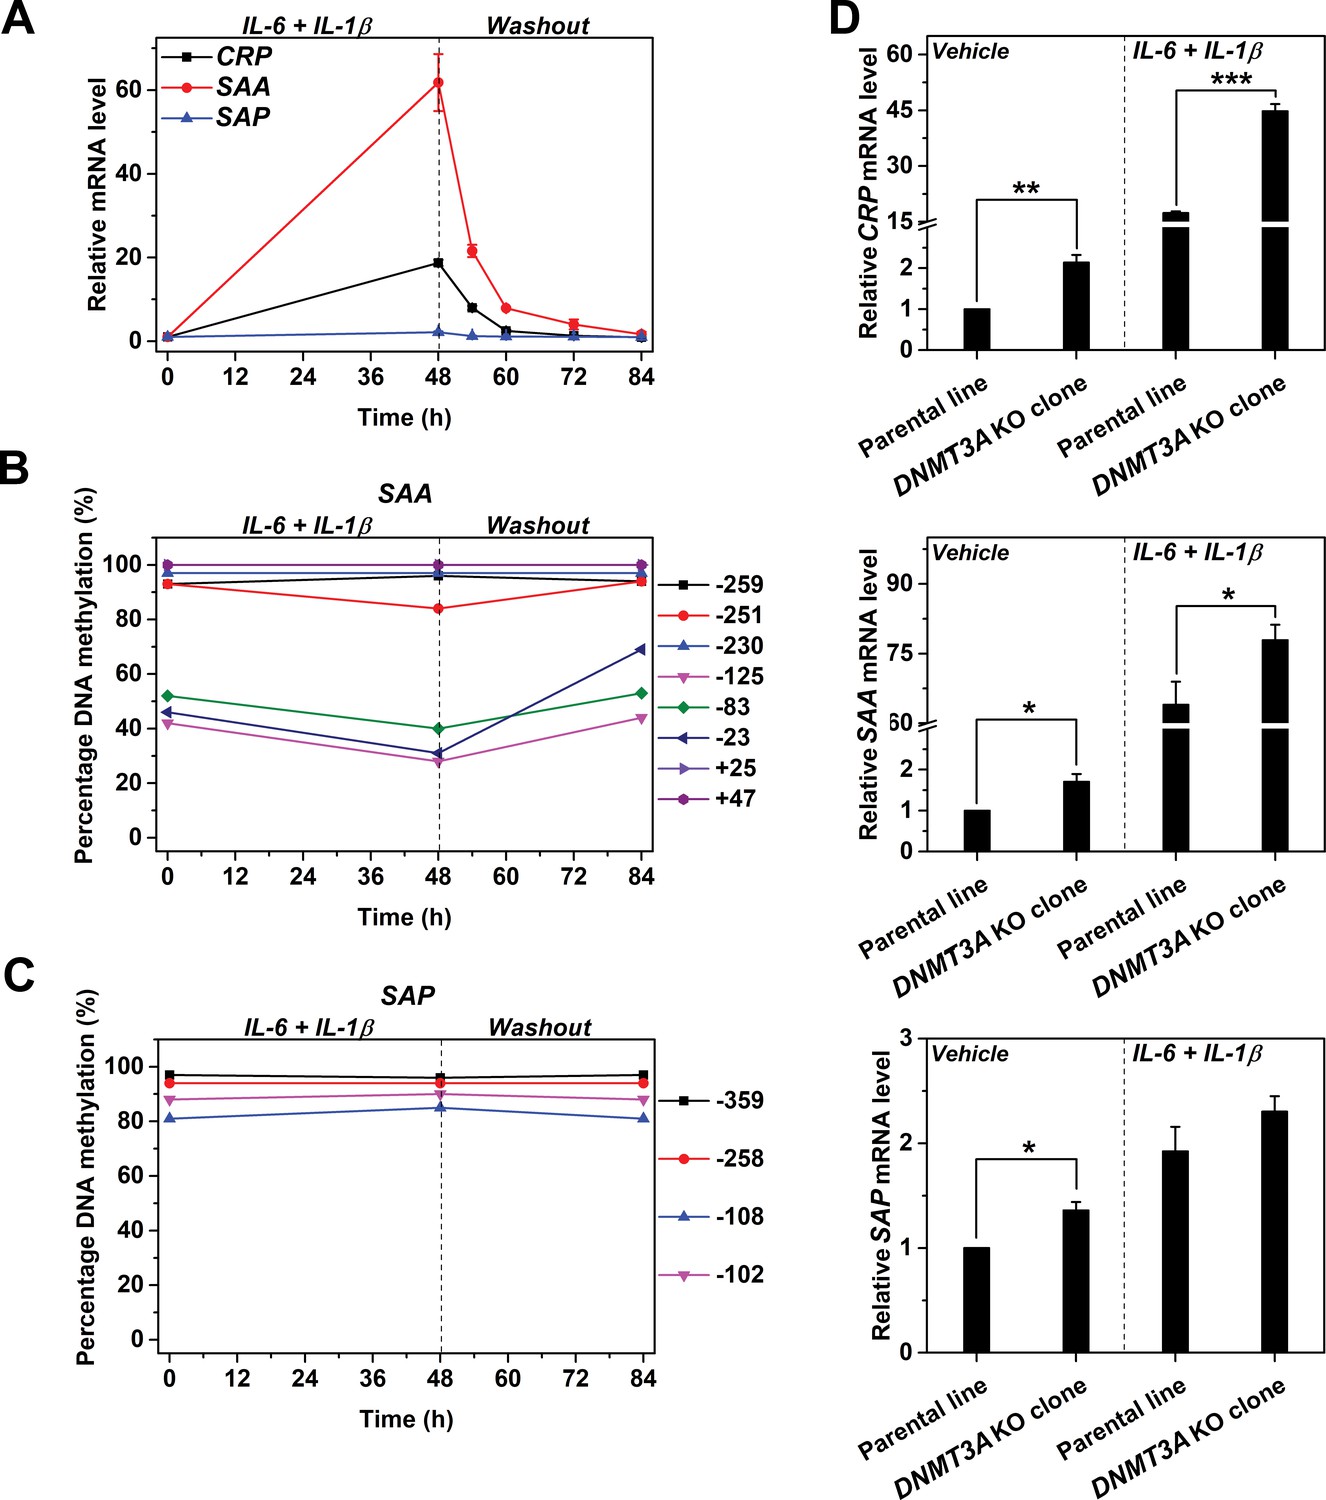
Reversible methylation regulates the induced expression of SAA.
Hep3B cells were treated with 10 ng/ml IL-6 and 1 ng/ml IL-1β for 48 hr, and then cultured in the absence of cytokine for 36 hr. (A) The expression levels of CRP, SAA and SAP (n = 3). (B) The methylation levels of SAA promoter. (C) The methylation levels of SAP promoter. The expression and methylation levels of SAA were inversely, and dynamically coupled. The expression of SAP was not induced, and methylation levels of its promoter did not change over time. The result of one representative experiment is shown. (D) The expression levels of CRP (upper), SAA (middle) and SAP (lower) in the parental or a clone of DNMT3A KO Hep3B cells at the resting or induced state (n = 3). DNMT3A KO enhanced the expression of CRP and SAA, but showed only marginal effects on that of SAP. Data are presented as mean ± SEM. *p<0.05, **p<0.01, ***p<0.001 (two-tailed t-test).
Figure 7 with 1 supplement
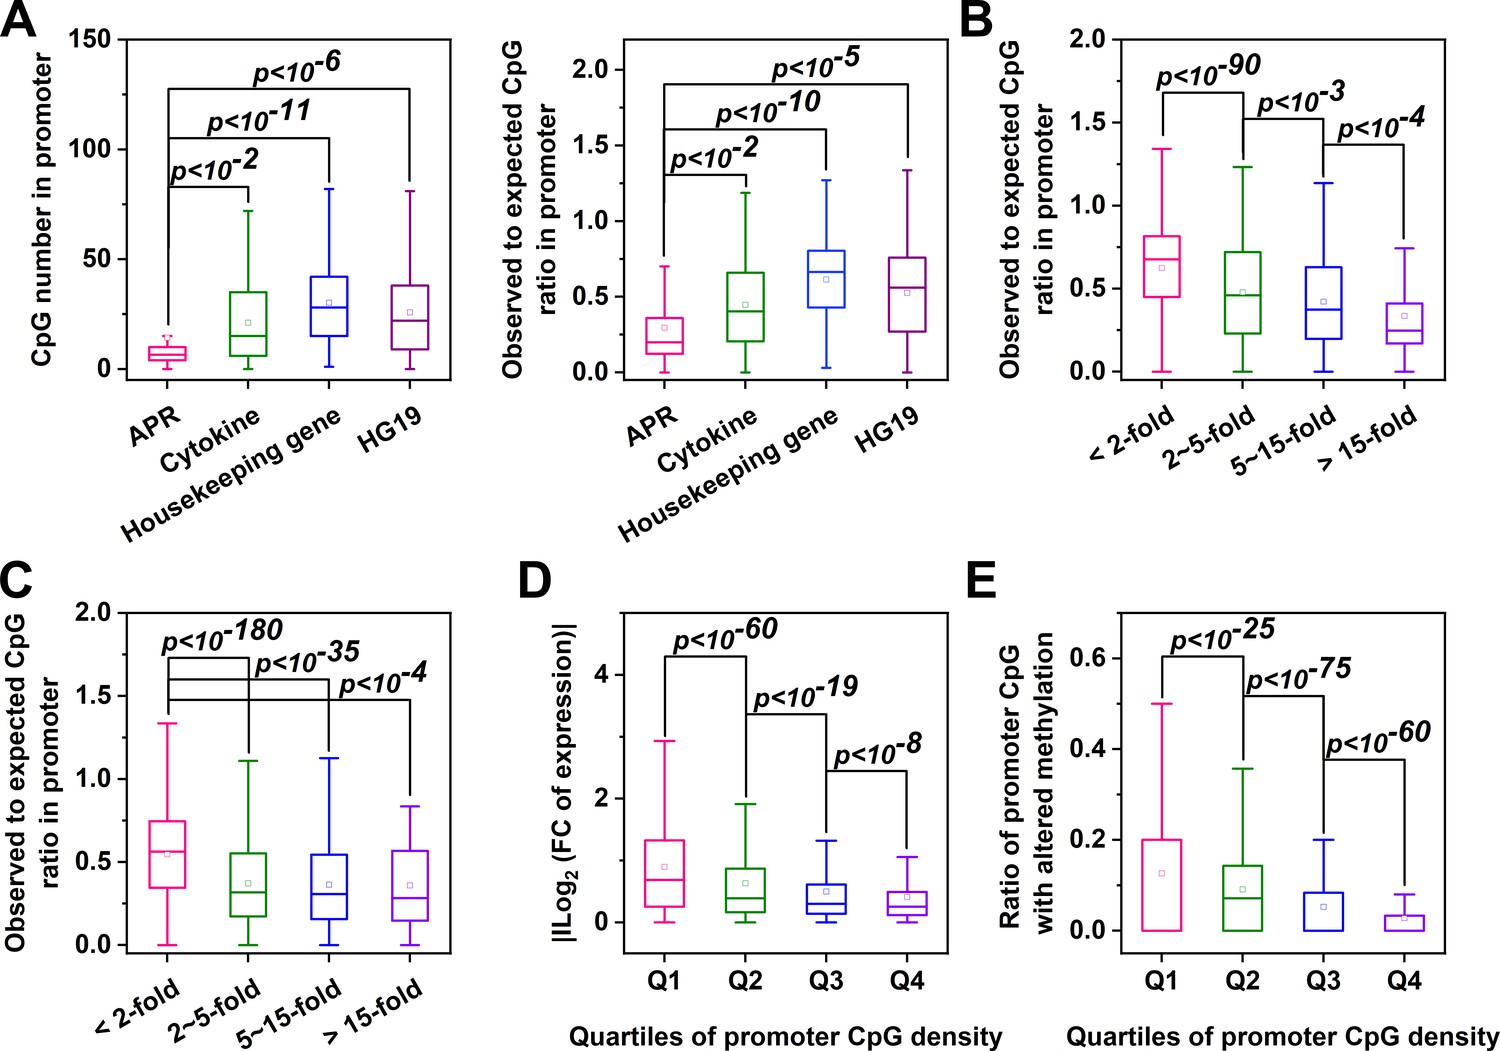
Genes with CpG-poor promoters are preferentialy demethylated and induced in acute inflammation.
(A) Both the numbers and ratios of promoter CpG are significantly lower in APRs (n = 34) than in cytokines (n = 117), housekeeping genes (n = 425) or all genes of HG19 (n = 20180). (B) Hep3B cells were treated with 10 ng/ml IL-6 and 1 ng/ml IL-1β for 24 hr, and gene expression profiles were determined by RNA-seq. Genes with larger expression changes exhibited lower promoter CpG ratios. There are 10979, 2130, 454, and 121 genes in <2 fold, 2 ~ 5 fold, 5 ~ 15 fold, and >15 fold categories, respectively. Mouse liver tissues were collected at the resting or turpentine-induced state. Their transcriptome and methylome were then determined and compared. (C) Genes whose expression changed by over 2-fold between the two states exhibit lower promoter CpG densities. There are 12338, 2876, 444, and 51 genes in <2 fold, 2 ~ 5 fold, 5 ~ 15 fold, and >15 fold categories, respectively. With the increase in promoter CpG density, genes show markedly reduced changes in levels of their expression (D) (There are 3096, 3903, 3903, and 3907 genes in Q1, Q2, Q3, and Q4 categories, respectively) and promoter methylation (E) (There are 3745, 3738, 3741, and 3742 genes in Q1, Q2, Q3, and Q4 categories, respectively). Statistical analysis was performed using K-S test.
Figure 7—figure supplement 1
Correlation and GO analysis.
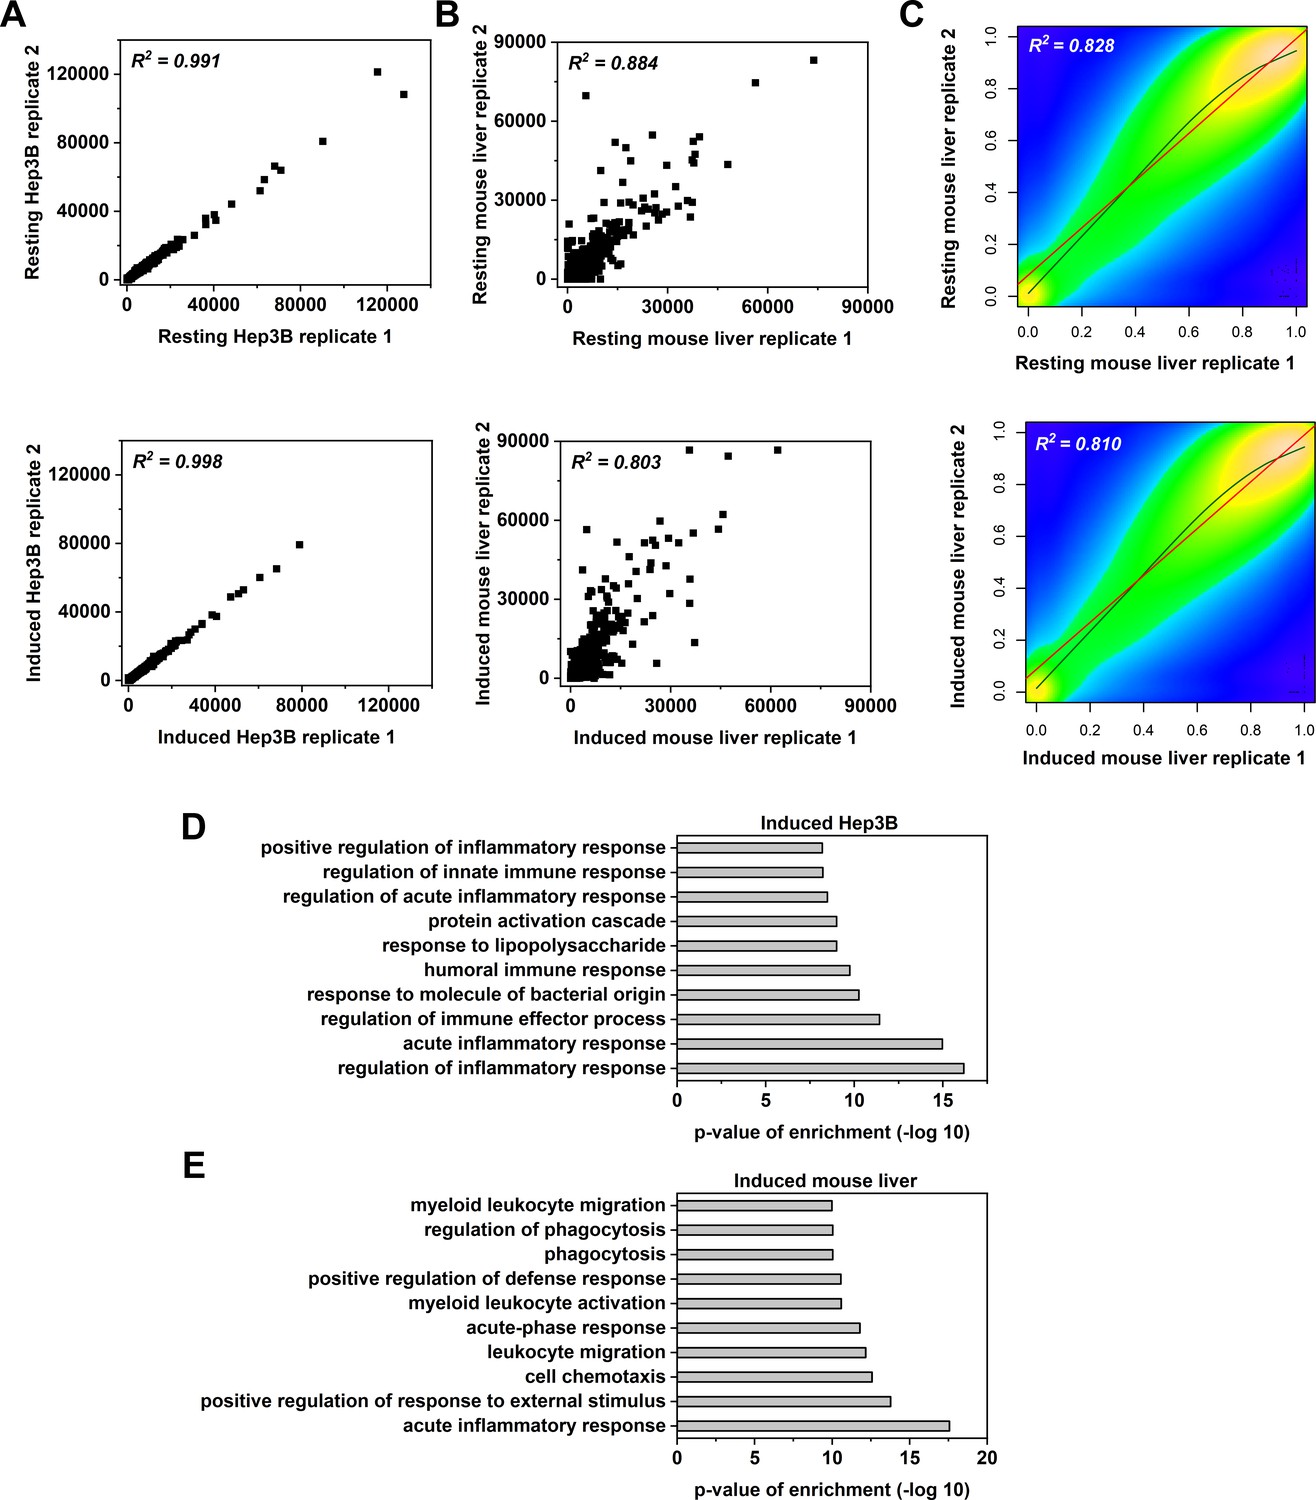
Transcriptomes derived from the two replicates of resting or induced Hep3B cells (A) or mouse livers (B) are plotted. Each point denotes a gene. The expression of 2705 and 3371 genes were changed by over 2-fold (up- and down-regulated) in induced Hep3B cells and in induced mouse livers, respectively. (C) Methylomes derived from the two replicates of resting or induced mouse livers are plotted. Methylation levels were calculated with CpG sites with at least 10 reads covered. Colors represent the density of CpG sites, wherein yellow denotes high density and blue denotes low density. Overall, 1262 differentially methylated regions (1 k sequence window) were identified in induced versus resting mouse livers. GO analysis of differentially expressed genes in induced 3B cells (D) or mouse livers (E).
Author response image 1

The bisulfite sequencing tracks of Nxpe5 (Log2(FC of expression) = 3.6), Cyp4a14 (Log2(FC of expression) = -3.1), Clec4n (Log2(FC of expression) = 1.9) and CRP (Log2(FC of expression) = 0.8).
Promoter CpGs are boxed by red rectangles.
Author response image 2
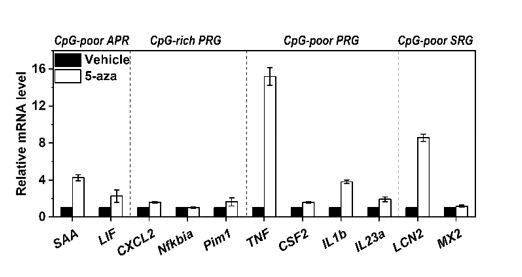
Expression of 2 additional APRs with CpG-poor promoters (SAA and LIF), 3 class A PRGs with CpG-rich promoters (CXCL2, Nfkbia, Pim1), 4 class B PRGs with CpG-poor promoters (TNF, CSF2, IL1b, IL23a), and 2 class B SRG with CpG-poor promoters (LCN2 and MX2) in Hep3B cells treated with or without 5-aza for 36 h.
Of note, TNF has been classified as a Class A PRG in mouse macrophages 5. However, the observed/expected CpG ratio of TNF promoter in human genome is 0.31, we thus classified it as a class B PRG here.
Additional files
-
Supplementary file 1
Key resources table.
- https://cdn.elifesciences.org/articles/51317/elife-51317-supp1-v2.docx
-
Transparent reporting form
- https://cdn.elifesciences.org/articles/51317/elife-51317-transrepform-v2.docx
Download links
A two-part list of links to download the article, or parts of the article, in various formats.
Downloads (link to download the article as PDF)
Open citations (links to open the citations from this article in various online reference manager services)
Cite this article (links to download the citations from this article in formats compatible with various reference manager tools)
Reversible promoter methylation determines fluctuating expression of acute phase proteins
eLife 9:e51317.
https://doi.org/10.7554/eLife.51317


