Reversible promoter methylation determines fluctuating expression of acute phase proteins
- MOE Key Laboratory of Cell Activities and Stress Adaptations, School of Life Sciences, Lanzhou University, China
- MOE Key Laboratory of Environment and Genes Related to Diseases, School of Basic Medical Sciences, Xi'an Jiaotong University, China
Abstract
Acute phase reactants (APRs) are secretory proteins exhibiting large expression changes in response to proinflammatory cytokines. Here we show that the expression pattern of a major human APR, that is C-reactive protein (CRP), is casually determined by DNMT3A and TET2-tuned promoter methylation status. CRP features a CpG-poor promoter with its CpG motifs located in binding sites of STAT3, C/EBP-β and NF-κB. These motifs are highly methylated at the resting state, but undergo STAT3- and NF-κB-dependent demethylation upon cytokine stimulation, leading to markedly enhanced recruitment of C/EBP-β that boosts CRP expression. Withdrawal of cytokines, by contrast, results in a rapid recovery of promoter methylation and termination of CRP induction. Further analysis suggests that reversible methylation also regulates the expression of highly inducible genes carrying CpG-poor promoters with APRs as representatives. Therefore, these CpG-poor promoters may evolve CpG-containing TF binding sites to harness dynamic methylation for prompt and reversible responses.
Introduction
Acute phase reactants (APRs) are liver-produced plasma proteins constituting an integral part of innate defense (Gabay and Kushner, 1999; Medzhitov, 2007). They are defined by a substantial change (>25%) of their plasma concentrations in response to inflammation. IL-6 (Kopf et al., 1994) and IL-1β (Zheng et al., 1995) are chief inducers of APR expression through activation of STAT3, NF-κB and C/EBP in hepatocytes (Bode et al., 2012; Quinton et al., 2012; Poli, 1998). C-reactive protein (CRP) is the first APR to be discovered, whose plasma concentrations at baseline are less than 2–3 µg/ml, but can rapidly increase up to 1000-fold upon infection or tissue injury; the heightened levels of CRP, however, return to the baseline with the resolution of inflammation (Pepys and Hirschfield, 2003; Du Clos, 2013; Pathak and Agrawal, 2019). The mechanisms of CRP induction have been thoroughly examined by reporter assays and truncation analysis. A region of ~220 bp in the proximal promoter of CRP that contains (nonconical) binding sites for STAT3, NF-κB and C/EBP-β is identified to be sufficient to mediate CRP induction by IL-6 and IL-1β (Singh et al., 2007; Young et al., 2008; Figure 1A).
Figure 1
Methylation level of CRP promoter is inversely associated with expression.
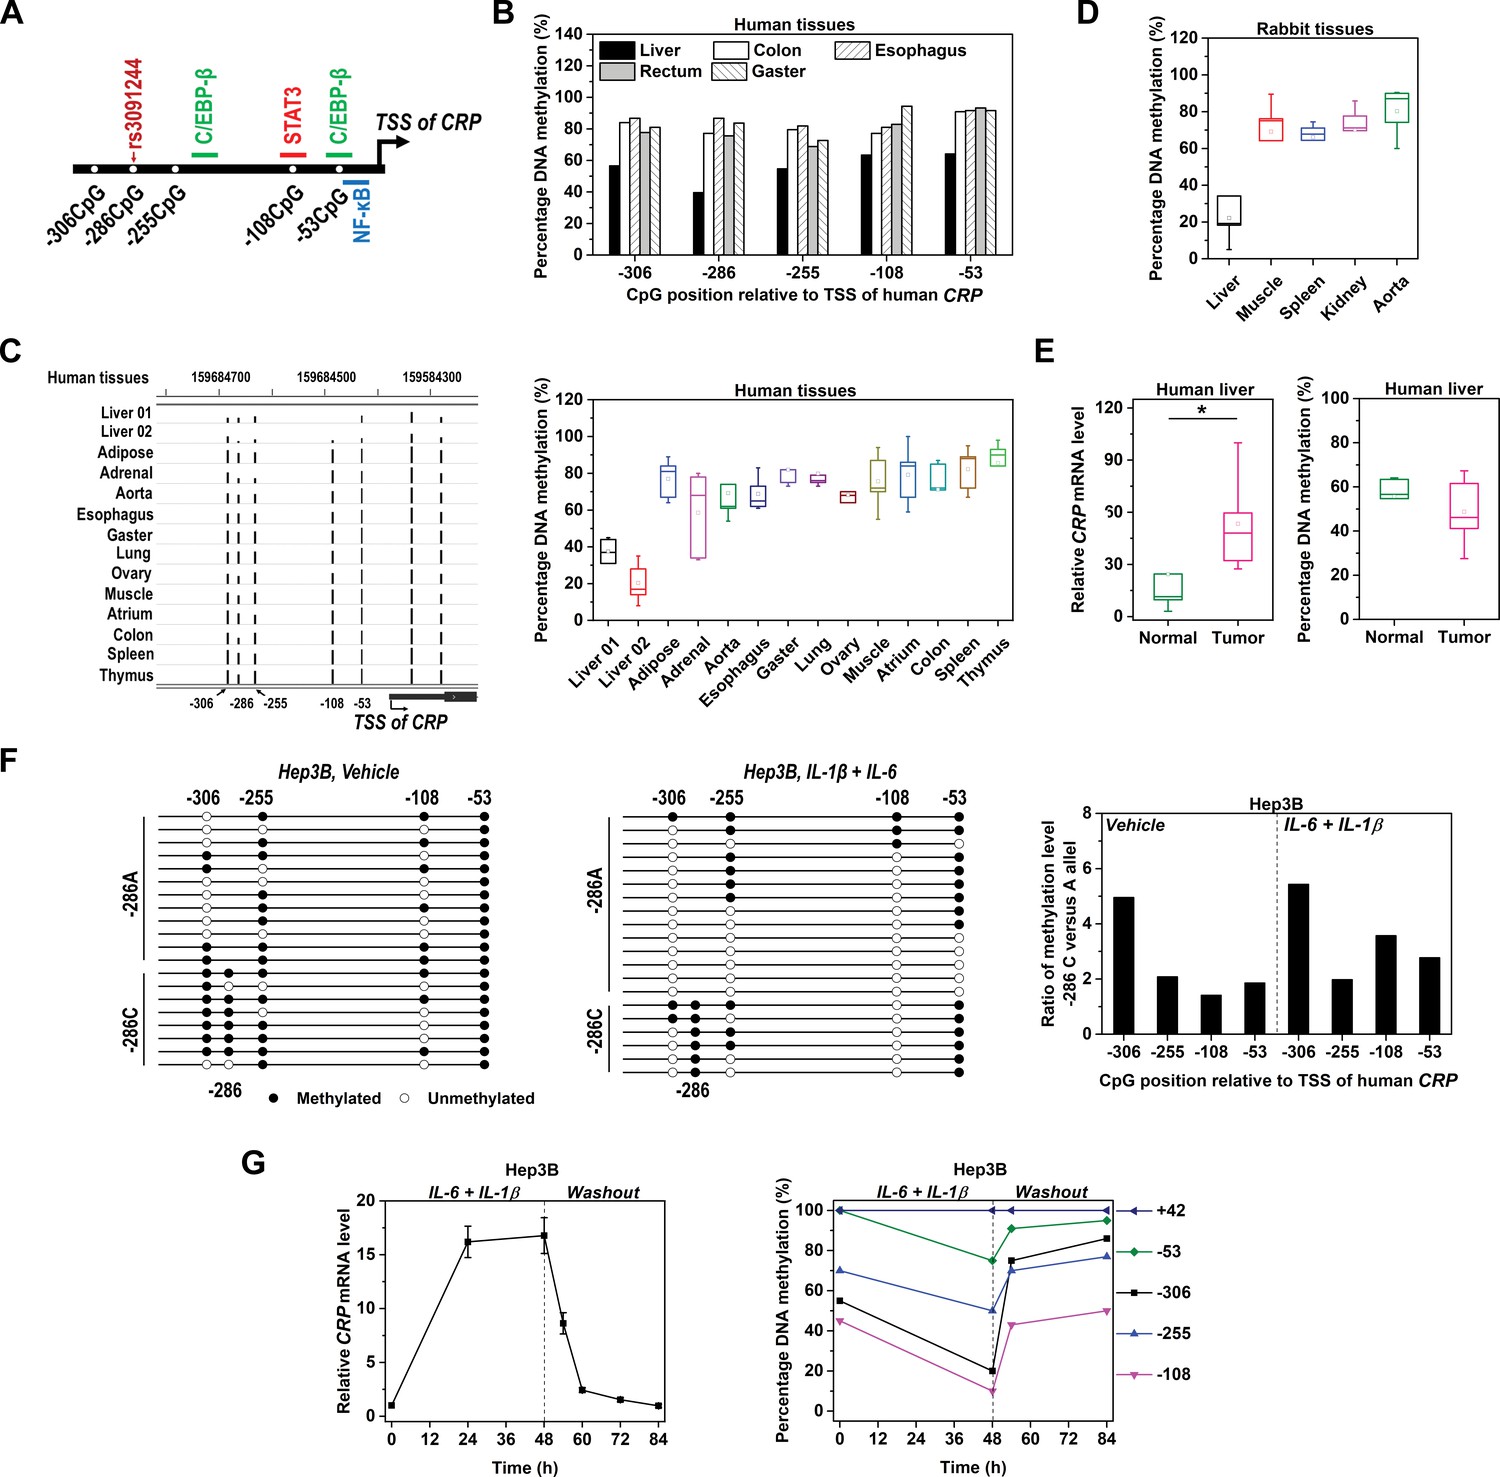
(A) Schematic illustration of CRP promoter in which SNP rs3091244, CpG motifs and TF binding sites are indicated. (B) Methylation levels of CRP promoter (−550 ~ 1 bp) in pooled normal human tissues adjacent to tumors (five liver, eight colon, 10 esophagus, 10 rectum and 10 gaster) were determined by bisulfite cloning sequencing. (C) Methylation levels of CRP promoter in normal human tissues were retrieved from available GEO datasets generated by whole-genome bisulfite sequencing: Liver 01-GSM916049, Liver 02-GSM1716965, Adipose-GSM1120331, Adrenal-GSM1120325, Aorta-GSM1120329, Esophagus-GSM983649, Gaster-GSM1120333, Lung-GSM983647, Ovary-GSM1120323, Muscle-GSM1010986, Atrium-GSM1120335, Colon-GSM983645, Spleen-GSM983652, Thymus-GSM1120322 (Gene Expression Omnibus database). The bisulfite sequencing tracks of CRP promoter (left; the height of the black bars represents percentage of DNA methylation) and pooled analysis (right) are shown. (D) Methylation levels of CRP promoter in rabbit tissues were determined by bisulfite cloning sequencing. Liver is the major organ expressing CRP in both humans and rabbits. Accordingly, the methylation levels of CRP promoter are lower in normal liver tissues than in other tissues. (E) Levels of CRP expression (left) and promoter methylation (right) in tumor versus normal tissues from human livers (n = 5) were determined by q-PCR and bisulfite cloning sequencing, respectively. Liver tumors exhibit higher levels of CRP expression but lower levels of promoter methylation than adjacent normal liver tissues. *p<0.05 (paired t-test). (F) Bisulfite cloning sequencing of −286C versus −286A alleles of CRP promoter in Hep3B cells at resting (Vehicle treated) or induced states (IL-6 and IL-1β treated). −286A allele was less methylated than −286C allele at both states. (G) IL-6 (10 ng/ml) and IL-1β (1 ng/ml) treatment induced CRP expression (left) and promoter demethylation (right) in Hep3B cells, while withdraw of these cytokines led to a quick drop of CRP expression and promoter re-methylation. The result of one representative experiment is shown.
Intriguingly, a promoter SNP (rs3091244) associated with plasma levels of CRP is located at 286 bp upstream the transcription start site (Szalai et al., 2005; Zacho et al., 2008; Allin et al., 2010). This SNP does not exist in binding sites of transcription factors (TFs) critical to CRP expression. Rather, the major −286C allele constitutes a CpG motif, at which DNA methylation frequently occurs; whereas the minor alleles of −286A/T disrupt the CpG motif and are associated with enhanced CRP expression. Beside the −286CpG, there are only four additional CpGs within the proximal promoter of CRP. Importantly, two of those CpGs are located at the binding sites of STAT3 and NF-κB/C/EBP-β (Figure 1A). Given that promoter methylation affects TF recruitment (Hu et al., 2013; Yin et al., 2017) and contributes to gene silencing (Jones, 2012; Wu and Zhang, 2014; Dor and Cedar, 2018; Luo et al., 2018; Blattler and Farnham, 2013), it is notable that levels of promoter methylation and expression of CRP appear to be negatively associated albeit with undefined causality (Wang et al., 2014). In the present study, we demonstrate that the expression pattern of CRP is causally determined by reversible promoter methylation, and that this regulation may also apply to highly inducible genes with CpG-poor promoters.
Results
Promoter methylation is inversely associated with CRP expression
To determine whether promoter methylation affects CRP expression, we first compared methylation levels of CRP promoter in different human tissues. CRP is expressed predominantly, if not solely, by the liver (Pepys and Hirschfield, 2003; Du Clos, 2013). Accordingly, methylation levels of CRP promoter in normal liver tissues were much lower than that in other tissues (Figure 1B). Analysis of published bisulfite sequencing datasets also confirmed that CRP promoter was most demethylated in the liver (Figure 1C). Similar results were further obtained in rabbits (Figure 1D), wherein CRP exhibits a comparable expression pattern as in humans. Moreover, malignant liver tissues expressed more CRP than adjacent normal tissues, and they were also less methylated at CRP promoter (Figure 1E). These data together reveal an inverse association between levels of promoter methylation and CRP expression across different tissues or cell types.
Hepatic Hep3B cell line is a conventional model to investigate APR expression (Singh et al., 2007; Young et al., 2008). CRP promoter in Hep3B cells harbors distinct alleles at the −286 position, with −286C on one allele and −286A on the other. Intriguingly, in addition to lacking the −286CpG, all other promoter CpGs on the −286A allele were much less methylated than that on the −286C allele at the resting state (Figure 1F). Such an allelic imbalance of promoter methylation was further reinforced at the induced state. Notably, the induction of CRP by IL-6 and IL-1β was accompanied by prominent promoter demethylation (Figure 1G). Following washout of the cytokines, however, both the expression and the promoter methylation of CRP were rapidly recovered. By contrast, the methylation level of a 5’ UTR CpG remained constant during the entire time course. Therefore, levels of promoter methylation and CRP expression are also specifically and dynamically associated in the same cell type.
Promoter methylation causally determines CRP expression
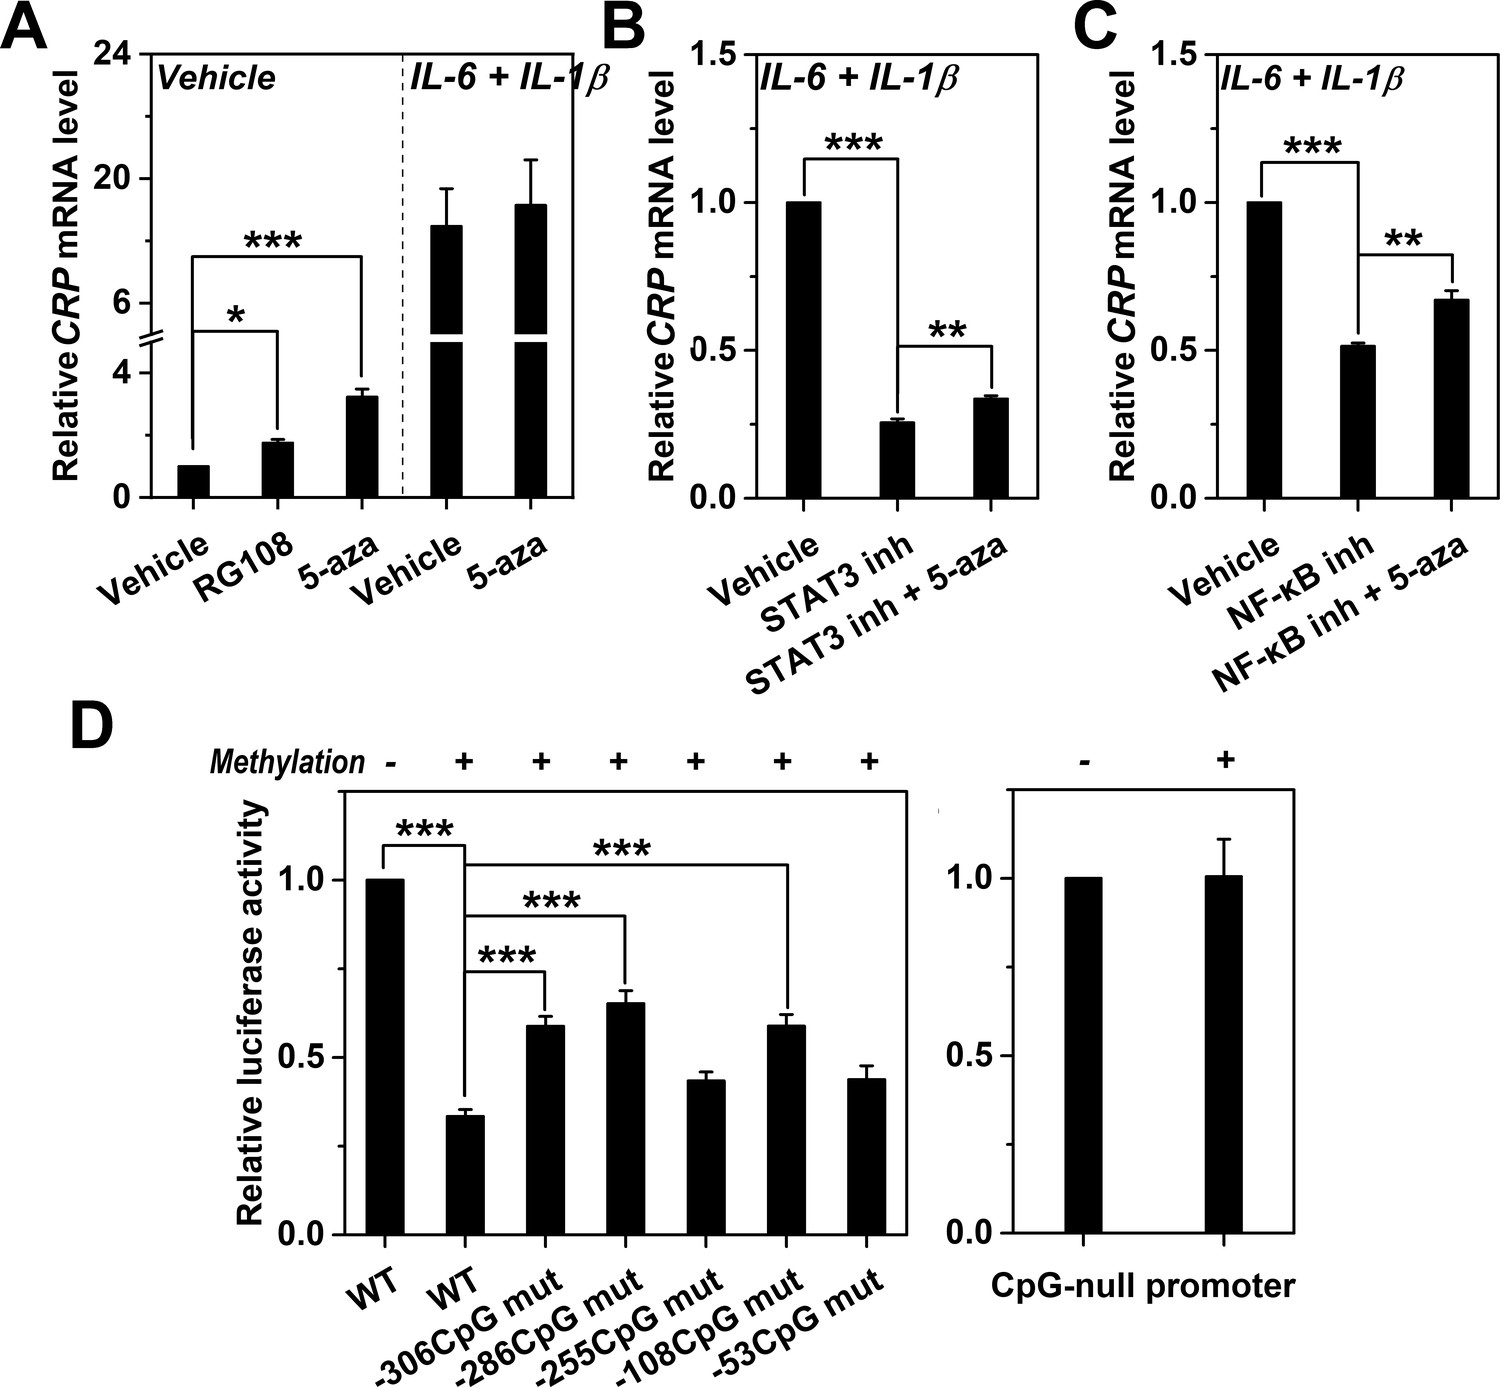
To clarify whether the observed association is causal, we directly modulated methylation levels of CRP promoter and examined its consequence on expression. Treating Hep3B cells with 5-aza or RG108 to inhibit DNA methylation significantly enhanced CRP expression at the resting state, but showed little effect at the induced state (Figure 2A; Figure 2—figure supplement 1) wherein CRP promoter also underwent active demethylation (Figure 1G). Nevertheless, 5-aza could moderately rescue the induced expression of CRP when STAT3 or NF-κB was inhibited (Figure 2B and C), hinting for their involvement in active demethylation of CRP promoter. Moreover, in vitro methylation before transfection markedly suppressed the reporter activity of CRP promoter in Hep3B cells (Figure 2D). This suppression, however, was partially reversed by mutating individual CpG motifs, and was completely absent with a CpG-null mutant of CRP promoter. These results suggest that promoter methylation inhibits, whereas its demethylation enhances CRP expression, thus supporting a causal association.
Figure 2 with 1 supplement see all
Methylation levels of CRP promoter causally determines expression.
(A) The effects of DNA methylation inhibitor RG-108 (25 μM, 24 hr) or 5-aza (5 μM, 12 hr) on CRP expression in Hep3B cells at the resting or induced state (n = 3). These inhibitors enhanced the resting but not the induced expression of CRP. At the induced state, the defective CRP expression caused by STAT3 (s31-201, 30 μM, 24 hr) (B) or NF-κB inhibition (BAY11-7082, 2 μM, 24 hr) (C) was partially reversed by 5-aza (5 μM, 24 hr) (n = 3). (D) In vitro vector methylation markedly inhibited reporter activities of wildtype CRP promoter (WT) following transfection into Hep3B cells (n = 3). Mutating individual CpG motif partially reversed this inhibition. As the control, in vitro vector methylation did not affect reporter activities of a CpG-null version of CRP promoter. Data are presented as mean ± SEM. *p<0.05, **p<0.01, ***p<0.001 (two-tailed t-test).
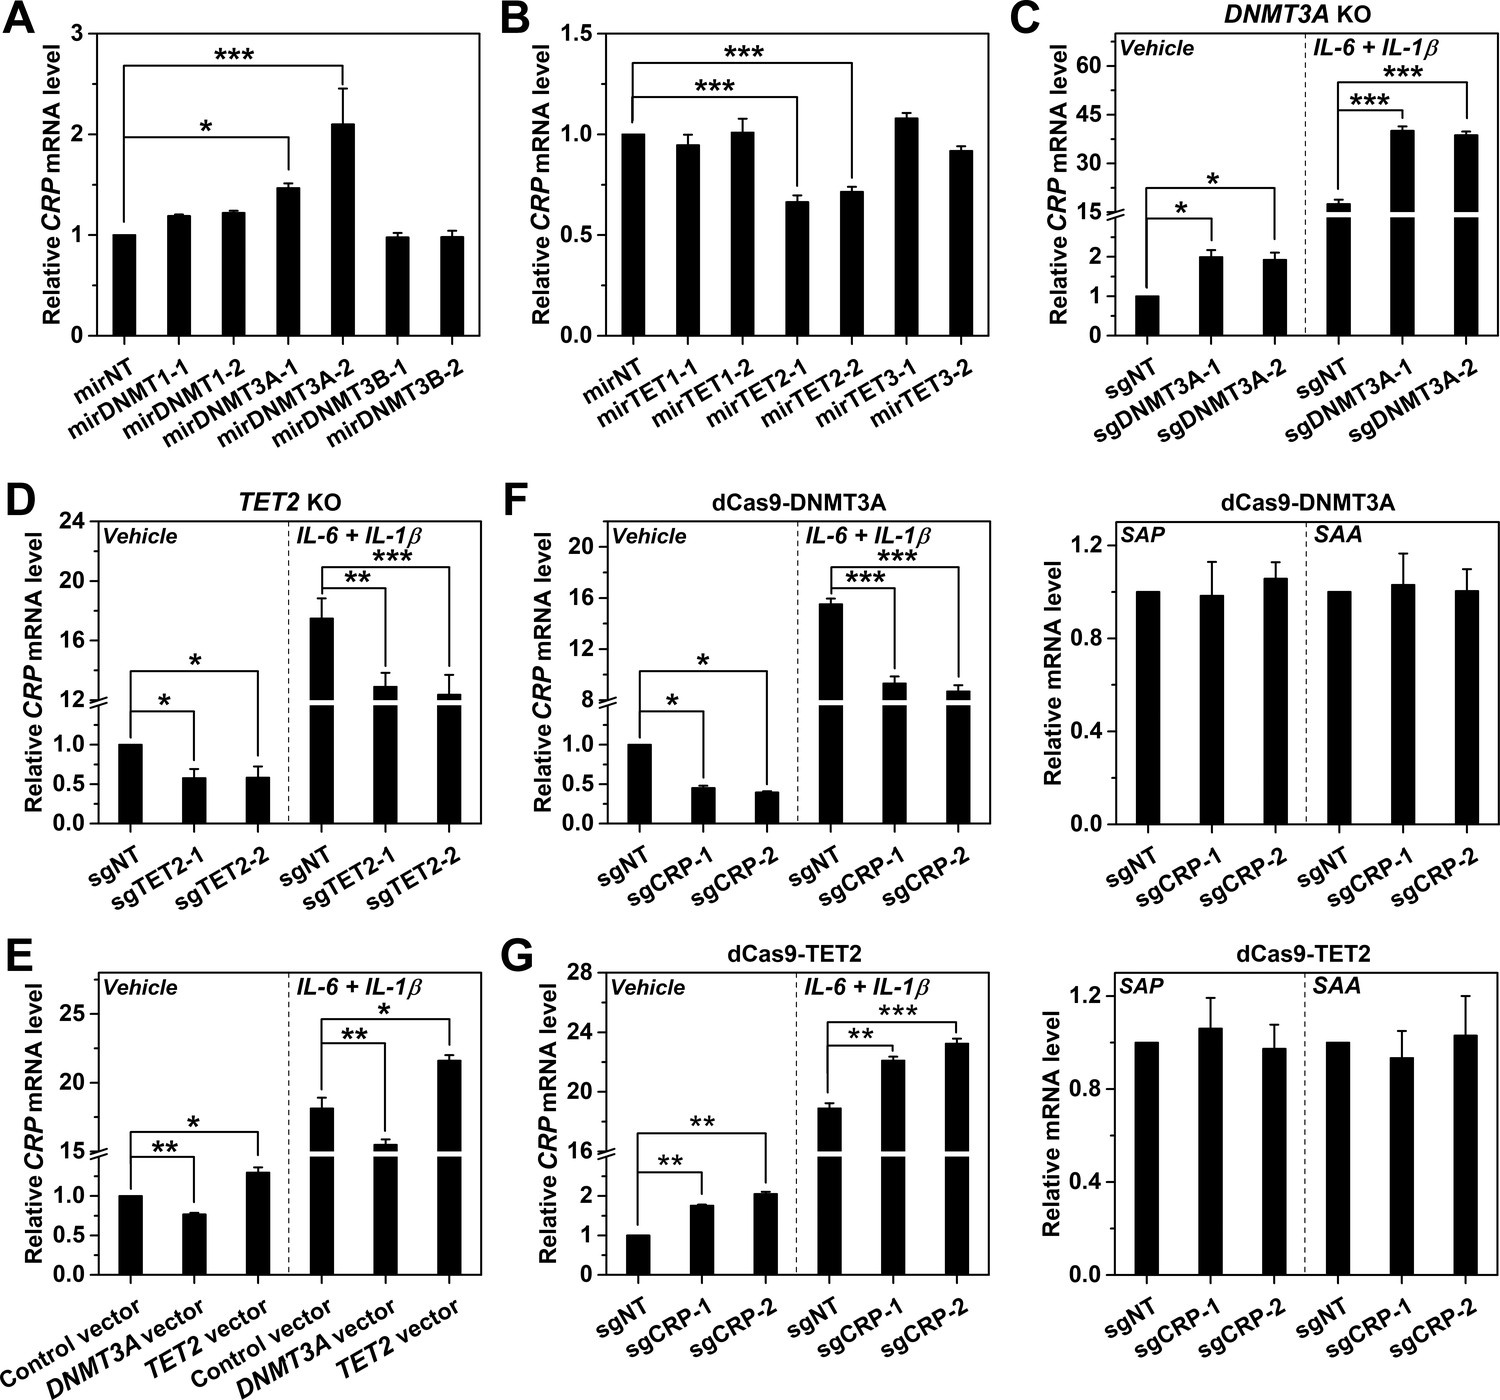
CpG methylation and demethylation are mediated by DNA methyltransferases (DNMTs) and ten-eleven translocations (TETs), respectively (Jones, 2012; Wu and Zhang, 2014; Dor and Cedar, 2018; Luo et al., 2018). A causal association with promoter methylation would therefore predict that the expression of CRP should also be regulated by DNMTs and/or TETs. Indeed, RNAi screening revealed that knockdown (KD) of DNMT3A enhanced (Figure 3A), whereas KD of TET2 reduced CRP expression in Hep3B cells (Figure 3B). Knockout (KO) of DNMT3A (Figure 3C) or TET2 (Figure 3D) with Cas9 yielded consistent but more pronounced effects. Importantly, DNMT3A/TET2 KD or KO showed expected effects on CRP promoter methylation and on their own expression (Figure 3—figure supplements 1 and 2) without upregulating TFs critical to CRP induction (Figure 3—figure supplement 3). On the other hand, the overexpression of DNMT3A reduced, while the overexpression of TET2 enhanced CRP expression (Figure 3E). These results together identify DNMT3A and TET2 as the negative and positive regulators of CRP expression, respectively, thus reinforcing the notion that CRP expression is causally determined by promoter methylation.
Figure 3 with 3 supplements see all
DNMT3A and TET2 regulate CRP expression.
CRP expression in Hep3B cells with DNMT (A) or TET (B) knockdown by control (mirNT) or target-specific miRNA (n = 3). (C) CRP expression in Hep3B cells with co-transfected Cas9 and sgRNAs targeting exon 14 (sgDNMT3A-1) or 2 (sgDNMT3A-2) of DNMT3A (n = 3). (D) CRP expression in Hep3B cells with co-transfected Cas9 and sgRNAs targeting exon 3 (sgTET2-1) or 7 (sgTET2-2) of TET2 (n = 3). (E) CRP expression in Hep3B cells with overexpressed DNMT3A or TET2 (n = 3). CRP expression in Hep3B cells with co-transfected catalytic domain of DNMT3A (F) or TET2 (G) fused to dCas9 and sgRNAs targeting CRP promoter (n = 3). The results identified DNMT3A and TET2 as the negative and positive regulators of CRP expression, respectively. Selective targeting of DNMT3A or TET2 to CRP promoter by dCas9 only regulated the expression of CRP, but did not affect that of serum amyloid A (SAA; a major human APR) or serum amyloid P component (SAP, a paralog of CRP). Data are presented as mean ± SEM. *p<0.05, **p<0.01, ***p<0.001 (two-tailed t-test).
Of note, inhibitor treatment or DNMT3A/TET2 manipulations would all affect the methylation status of entire genome. To exclude any indirect effect caused by global manipulation, we specifically modulated the methylation levels of CRP promoter by dCas9-mediated targeting of the catalytic domains of DNMT3A or TET2. Enforced methylation of CRP promoter by DNMT3A-dCas9 reduced the expression of CRP in Hep3B cells, but showed little effect on that of serum amyloid A (SAA, another major human APR) and serum amyloid P component (SAP, a paralog of CRP) (Figure 3F). By contrast, enforced demethylation of CRP promoter by TET2-dCas9 only selectively enhanced the expression of CRP (Figure 3G). We thus conclude that DNMT3A and TET2-tuned methylation status of CRP promoter constitutes a key part of the regulatory mechanism that causally determines the expression.
Promoter methylation of CRP dictates strength of TF recruitment
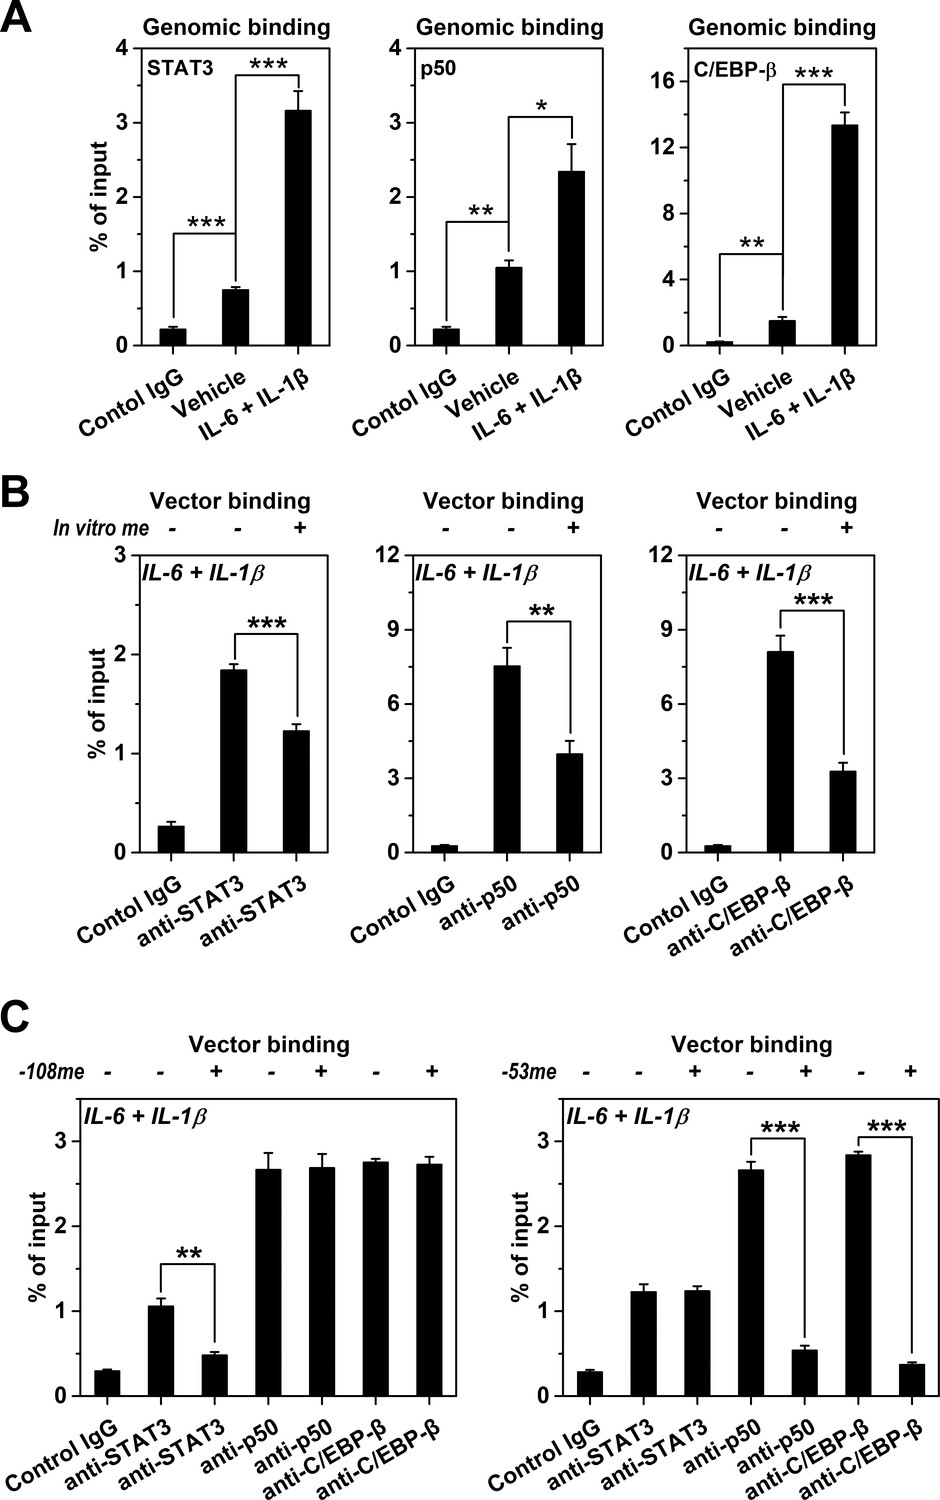
We next asked whether the promoter methylation-mediated regulation could be conferred by influencing TF recruitment. Indeed, IL-6 and IL-1β-induced demethylation of CRP promoter (Figure 1G) was paralleled by markedly enhanced recruitment of STAT3, NF-κB p50 and C/EBP-β (Figure 4A; Singh et al., 2007; Young et al., 2008). Moreover, in vitro methylation substantially reduced the recruitment of those TFs to vectors containing CRP promoter after transfection into Hep3B cells (Figure 4B). The −53CpG and −108CpG are at the binding sites of p50/C/EBP-β, and STAT3, respectively (Figure 1A). Accordingly, site-specific methylation of −53CpG selectively prevented the recruitment of p50 and C/EBP-β to CRP promoter, while site-specific methylation of −108CpG only inhibited the recruitment of STAT3 (Figure 4C). These CpG motifs at TF binding sites may thus act as rheostats with their methylation turning down the recruitment of critical TFs, resulting in reduced expression.
Figure 4
Methylation levels of CRP promoter affect TF recruitment.
The recruitment of TFs to CRP promoter in Hep3B cells was analyzed by ChIP. (A) The recruitment of STAT3, p50 and C/EBP-β to CRP promoter were all markedly enhanced at the induced versus resting state (n = 3). (B) In vitro vector methylation decreased the recruitment of STAT3, p50 and C/EBP-β to a vector containing CRP promoter at the induced state (n = 3). (C) Site-specific methylation at −53CpG inhibited the recruitment of p50 and C/EBP-β, whereas methylation at −108CpG inhibited the recruitment STAT3 to the vector containing CRP promoter at the induced state (n = 3). Data are presented as mean ± SEM. *p<0.05, **p<0.01, ***p<0.001 (two-tailed t-test).
Dynamic crosstalk among TFs and promoter methylation in induced expression of CRP
We further examined how TF recruitment and promoter methylation dynamically orchestrate to regulate the induced expression of CRP. IL-6 and IL-1β induced two waves of CRP expression: the first wave lasted from 0 to 6 hr yielding the minor peak, while the second lasted from 12 to 24 hr yielding the major peak (Figure 5A). The recruitment of STAT3 occurred during the first wave and saturated at 3 hr before the minor peak (Figure 5B). By contrast, the recruitment of p50 was more evident during the time lag between the two waves (Figure 5C). The recruitment of C/EBP-β, whose action depends on p50 (Cha-Molstad et al., 2000; Kramer et al., 2008; Agrawal et al., 2001), however, steadily rose till 12 hr (Figure 5D). These would suggest that the first wave of induced CRP expression is driven by early recruited STAT3, which licenses the late recruitment of p50 that synergizes with C/EBP-β to drive the second wave. As such, STAT3 is likely the pioneer TF that binds methylated CRP promoter to initiates induction and primes demethylation.
Figure 5

TF recruitment and promoter methylation dynamically crosstalk to regulate the induced expression of CRP.
CRP expression (A) and promoter recruitment of STAT3 (B), p50 (C) and C/EBP-β (D) in Hep3B cells at the induced state without (WT) or with co-transfected Cas9 and sgRNA targeting exon 14 of DNMT3A (n = 3) or targeting exon 3 of TET2 (n = 2) over time. TET2 KO markedly reduced the induction of CRP, and almost abrogated the promoter recruitment of p50 and C/EBP-β. The recruitment of STAT3 to CRP promoter was still evident in TET2 KO cells. DNMT3A KO resulted in a stronger amplitude and altered dynamics of CRP induction. The recruitment to CRP promoter was enhanced for all the three TFs in DNMT3A KO cells, whereas the timing of recruitment was altered only for p50. (E) CRP expression in Hep3B cells treated with vehicle, 1 ng/ml IL-1β, 10 ng/ml IL-6 or their combination for 48 hr (n = 3). As IL-1β is unable to induce IL-6 production in Hep3B cells (Kramer et al., 2008), the effects of STAT3 and p50 can be largely dissociated by treating cells with one single cytokine (Kramer et al., 2008; Ganapathi et al., 1991; Ganapathi et al., 1988). IL-1β could not induce CRP expression, suggesting p50 is not required for the first wave of CRP induction. (F) Methylation levels of CRP promoter in Hep3B cells at the induced state treated without (Vehicle) or with inhibitors of STAT3 (30 μM s31-201) or NF-κB (2 μM BAY11-7082) for 24 hr. (G) Ratios of methylation levels on −286C versus −286A alleles in Hep3B cells at the induced state treated with the NF-κB inhibitor (2 μM BAY11-7082) for 24 hr. Methylation levels (H) and allelic methylation of CRP promoter (I) in Hep3B cells expressing a control or a C/EBP-β vector at the resting state. C/EBP-β overexpression showed no effect on methylation status of CRP promoter. The result of one representative experiment is shown. (J) CRP expression in Hep3B cells with or without C/EBP-β overexpression under the indicated conditions for 48 hr (n = 3). (K) CRP expression in Hep3B cells without (sgNT) or with C/EBP-β KO (sgC/EBP-β) following induction with 10 ng/ml IL-6 and 1 ng/ml IL-1β for 48 hr (n = 3). The dramatic effects of C/EBP-β KO or overexpression suggest that this TF is the major effector that respond to promoter methylation status and determine the amplitude of CRP expression. (L) A schematic illustration of how TF recruitment and promoter methylation dynamically orchestrate to regulate the induction of CRP. Data are presented as mean ± SEM. **p<0.01, ***p<0.001 (two-tailed t-test).
In line with the above suggestion, STAT3 was the only TF showing appreciable early recruitment to CRP promoter upon enforced DNA methylation by TET2 KO (Figure 5B–D). This indicates that STAT3 can nevertheless be recruited to CRP promoter even when heavily methylated, consistent with the observations that vector binding of STAT3 was least sensitive to methylation (Figure 4B and C). This also indicates that STAT3 can act largely independent of p50 and C/EBP-β to drive CRP induction, albeit with a markedly reduced amplitude (Figure 5A). Indeed, the sole activation of STAT3 in wildtype cells was able to induce CRP expression to a level comparable to that of the minor peak, whereas the sole activation of NF-κB was completely ineffective (Figure 5E). Despite that, NF-κB inhibition (with intact STAT3) at the induced state resulted in an even stronger methylation of CRP promoter (Figure 5F) and a reversal of allelic imbalance (Figures 5G and 1F). Therefore, promoter demethylation requires p50 that acts downstream of STAT3.
Interestingly, enforced DNA demethylation by DNMT3A KO not only tripled CRP expression during the entire course of induction, but eliminated the time lag between the two waves (Figure 5A). The augmented amplitude can be explained by the enhanced recruitment of the three TFs, while the altered dynamics may correspond to the shifted timing of p50 recruitment (Figure 5B–D). As such, p50 selectively recruited during the time lag could be responsible for promoter demethylation to prime the second wave. Accordingly, C/EBP-β appears to be the major effector that responds to promoter demethylation: its overexpression did not demethylate CRP promoter (Figure 5H and I), but when combined with blockage of DNA methylation, it drove the resting expression of CRP to a level approaching to that induced by IL-6 and IL-1β (Figure 5J). C/EBP-β KO, however, lowered the induced expression of CRP by ~70% (Figure 5K). These together demonstrate a stepwise induction of CRP where TFs and promoter methylation dynamically orchestrate (Figure 5L).
Reversible methylation regulates expression of genes with CpG-poor promoters
Having established the regulation of CRP expression by reversible promoter methylation, we wondered whether the same regulation can be applied to other APRs. Indeed, SAA behaved similarly as CRP. Treating Hep3B cells with IL-6 and IL-1β resulted in a drastic increase in the expression of SAA (Figure 6A) and a reduction in methylation levels of its promoter (Figure 6B). These were, however, quickly recovered following cytokine withdraw. By contrast, neither the expression nor the promoter methylation of SAP was affected by treatment or withdraw of IL-6 and IL-1β (Figure 6A and C). Moreover, DNMT3A KO also markedly enhanced the induced expression of SAA, but barely affected that of SAP (Figure 6D). These results suggest that reversible promoter methylation may be a general mechanism underlies the induction of APRs.
Figure 6
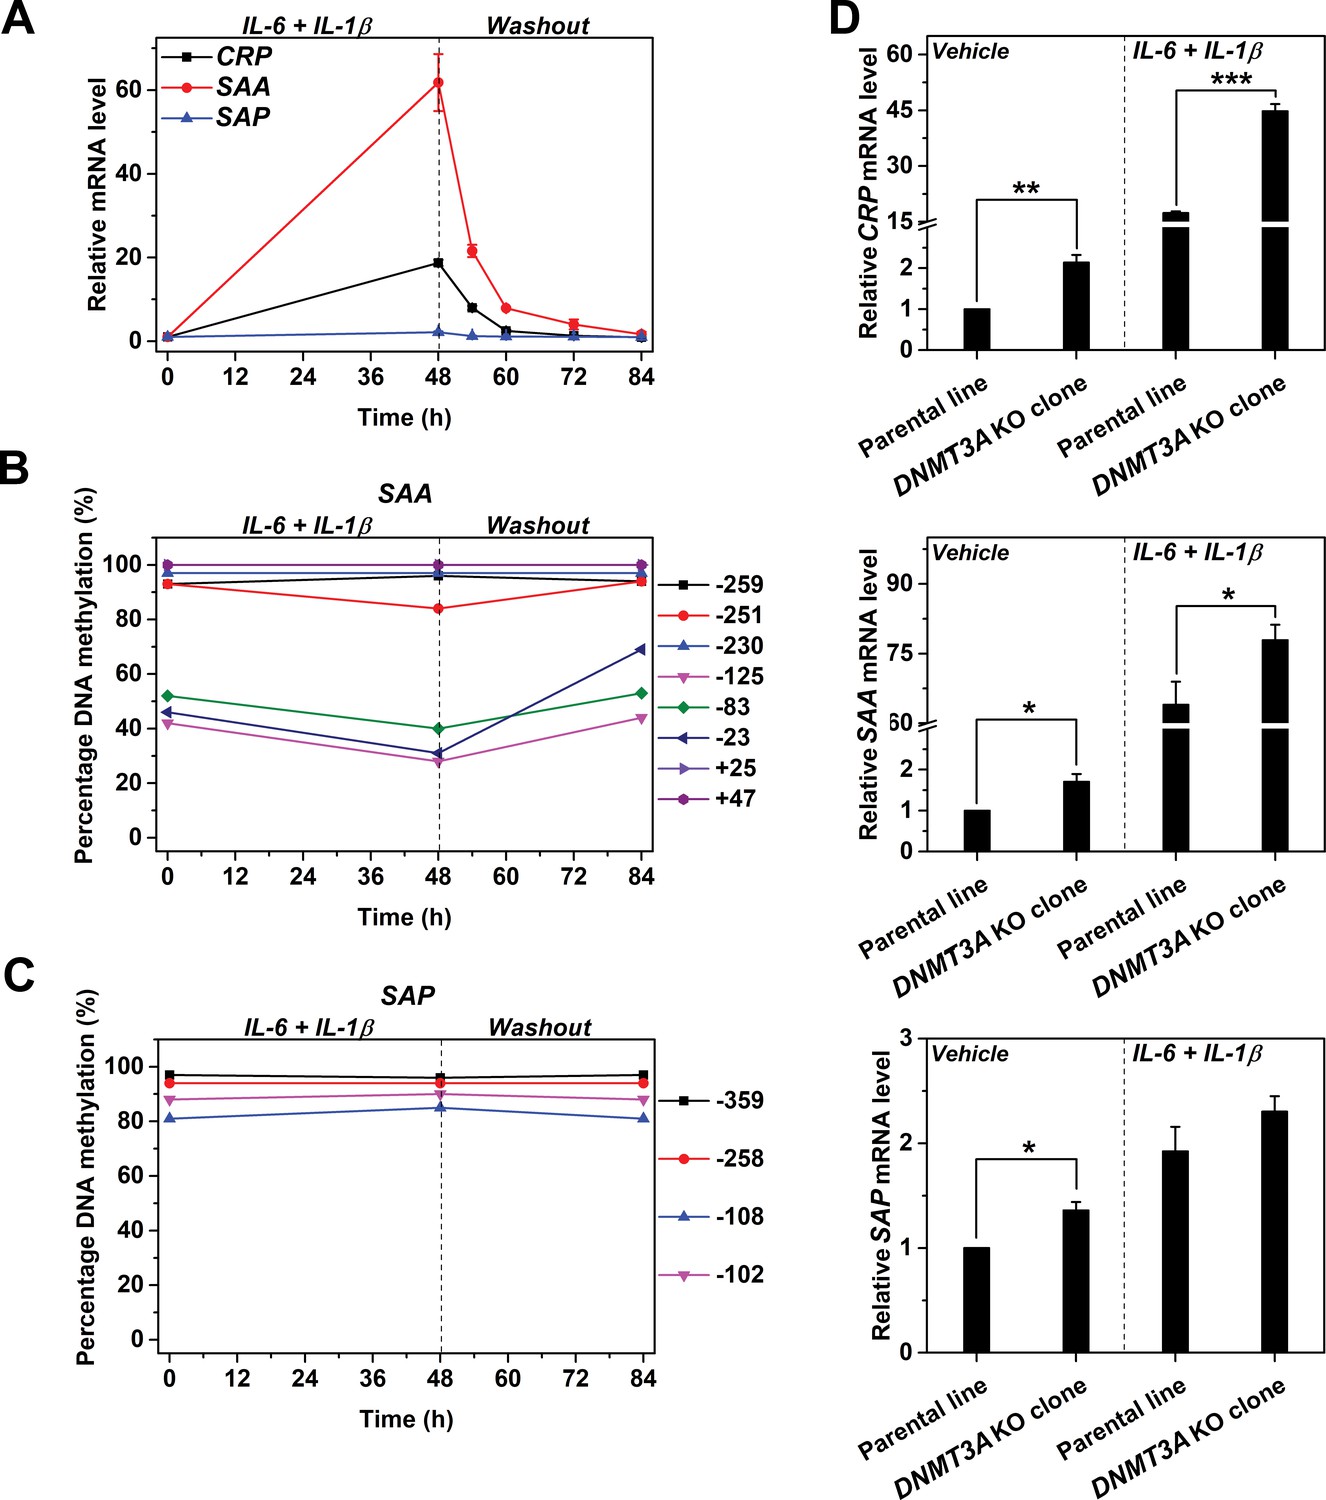
Reversible methylation regulates the induced expression of SAA.
Hep3B cells were treated with 10 ng/ml IL-6 and 1 ng/ml IL-1β for 48 hr, and then cultured in the absence of cytokine for 36 hr. (A) The expression levels of CRP, SAA and SAP (n = 3). (B) The methylation levels of SAA promoter. (C) The methylation levels of SAP promoter. The expression and methylation levels of SAA were inversely, and dynamically coupled. The expression of SAP was not induced, and methylation levels of its promoter did not change over time. The result of one representative experiment is shown. (D) The expression levels of CRP (upper), SAA (middle) and SAP (lower) in the parental or a clone of DNMT3A KO Hep3B cells at the resting or induced state (n = 3). DNMT3A KO enhanced the expression of CRP and SAA, but showed only marginal effects on that of SAP. Data are presented as mean ± SEM. *p<0.05, **p<0.01, ***p<0.001 (two-tailed t-test).
The promoters of most mammalian genes contain a high frequency (observed number/expected number >0.6) of CpGs termed CpG islands (CGIs) that are resistant to DNA methylation (Saxonov et al., 2006). The CpG frequency of CRP promoter, however, is exceptionally low (~0.23). Interestingly, a low CpG frequency appears to be general feature of APR promoters (Figure 7A). We then extended our analysis to genes with CpG-poor promoters. In Hep3B cells treated with IL-6 and IL-1β, strongly induced genes tended to manifest lower CpG ratios in their promoters (Figure 7B; Figure 7—figure supplement 1). Similar observations were also made in livers of mice undergoing turpentine-induced acute inflammation (Figure 7C). Importantly, genes with CpG-poor promoters showed significantly stronger changes in both expression and promoter methylation (Figure 7D and E; Figure 7—figure supplement 1). Therefore, dynamic methylation may also regulate the expression of highly inducible genes with CpG-poor promoters.
Figure 7 with 1 supplement see all
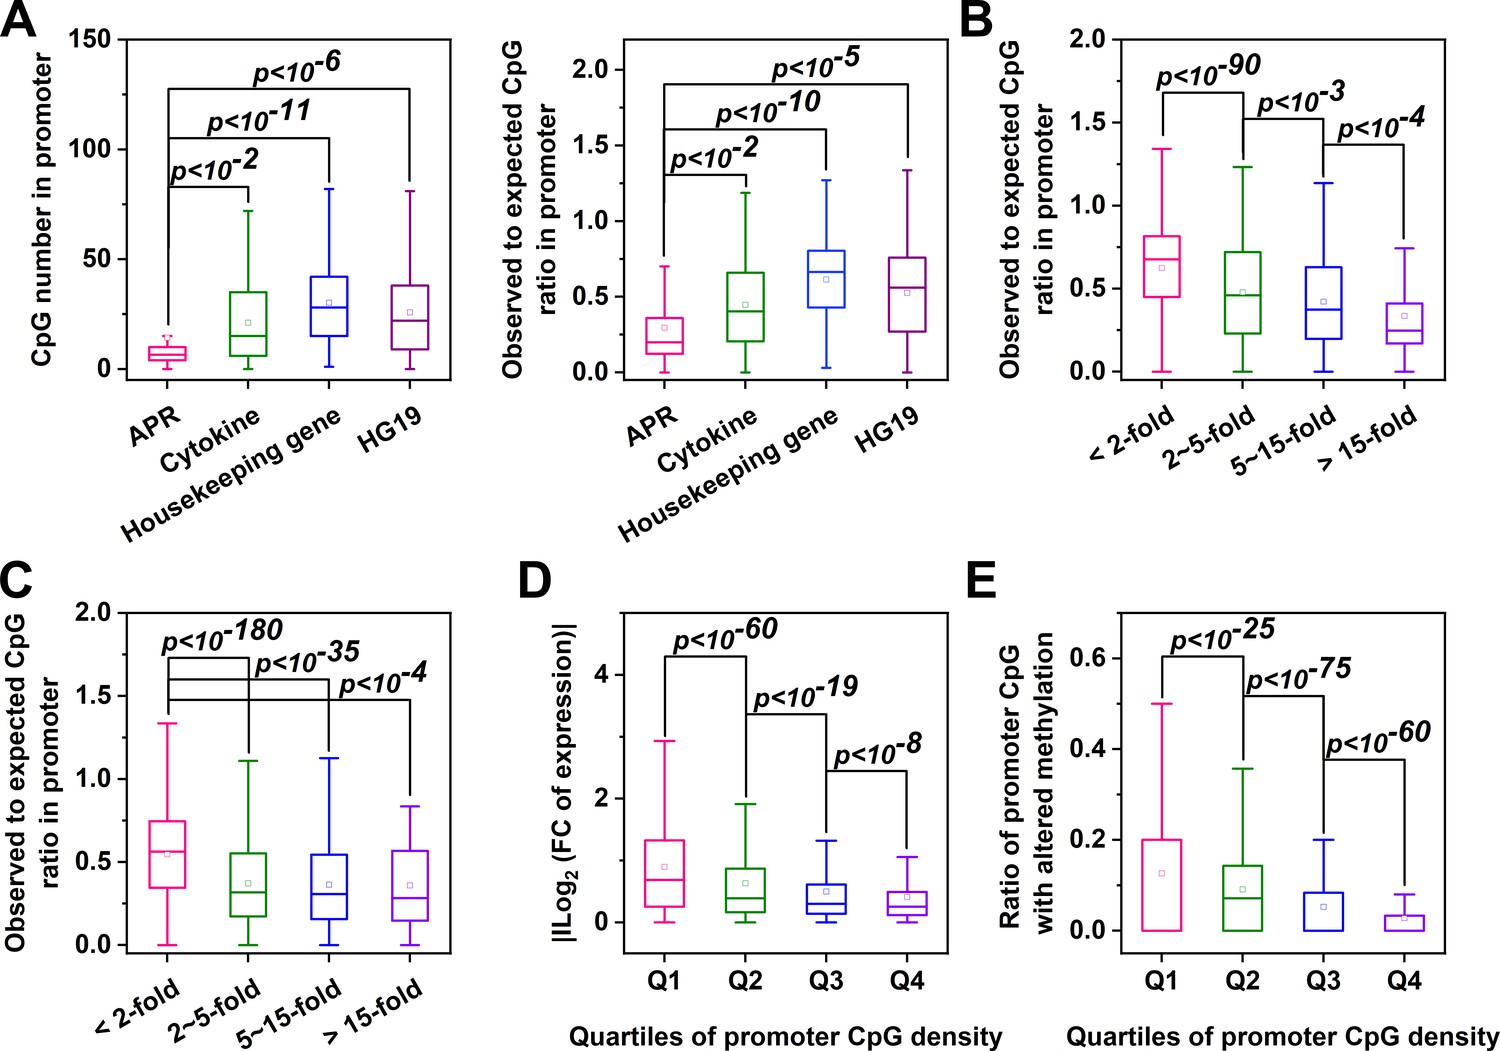
Genes with CpG-poor promoters are preferentialy demethylated and induced in acute inflammation.
(A) Both the numbers and ratios of promoter CpG are significantly lower in APRs (n = 34) than in cytokines (n = 117), housekeeping genes (n = 425) or all genes of HG19 (n = 20180). (B) Hep3B cells were treated with 10 ng/ml IL-6 and 1 ng/ml IL-1β for 24 hr, and gene expression profiles were determined by RNA-seq. Genes with larger expression changes exhibited lower promoter CpG ratios. There are 10979, 2130, 454, and 121 genes in <2 fold, 2 ~ 5 fold, 5 ~ 15 fold, and >15 fold categories, respectively. Mouse liver tissues were collected at the resting or turpentine-induced state. Their transcriptome and methylome were then determined and compared. (C) Genes whose expression changed by over 2-fold between the two states exhibit lower promoter CpG densities. There are 12338, 2876, 444, and 51 genes in <2 fold, 2 ~ 5 fold, 5 ~ 15 fold, and >15 fold categories, respectively. With the increase in promoter CpG density, genes show markedly reduced changes in levels of their expression (D) (There are 3096, 3903, 3903, and 3907 genes in Q1, Q2, Q3, and Q4 categories, respectively) and promoter methylation (E) (There are 3745, 3738, 3741, and 3742 genes in Q1, Q2, Q3, and Q4 categories, respectively). Statistical analysis was performed using K-S test.
Discussion
Though TFs critical to CRP expression have been identified, how their actions are coordinated remains unclear. This study demonstrates a previously unrecognized, epigenetic mechanism wherein methylation status of CRP promoter responds to and further modifies the effects of distinct TFs. At the induced state, the pioneered binding of STAT3 to CRP promoter in hepatocytes drives a minor wave of induction, and further licenses the subsequent recruitment of NF-κB p50. The two TFs probably work together to tip the balance of TET2 and DNMT3A at CRP promoter, leading to its demethylation. As significant cell proliferation was not noted, the methylated cytosine might be eventually removed by base excision repair mechanism (Wu and Zhang, 2014). Consequently, the demethylated promoter enhances the recruitment of C/EBP-β to drive the major wave of CRP induction. During the recovery phase, however, the loss of activated STAT3 and p50 results in a rapid remethylation of CRP promoter and termination of induction. At the resting state, however, the relatively hypomethylated promoter of CRP in the liver versus other tissues likely favors C/EBP-β recruitment, contributing to its tissue-specific, basal expression. These may form the basis for CRP, a putative pattern recognition receptor (Du Clos, 2013; Bottazzi et al., 2010), to constitute an integral part of immune surveillance in both homeostasis and inflammation.
In addition to CRP, we further show that reversible methylation also appears to be involved in regulation of highly inducible genes carrying CpG-poor promoters with APRs as representatives. In this regard, it is worth noting that DNA methylation is a relative stable epigenetic modification (Wu and Zhang, 2014). Though dynamic changes in global or local DNA methylation status have been demonstrated in processes of development, aging and disease, these (gradual) changes, once occurred, are largely persistent or irreversible (Wu and Zhang, 2014; Dor and Cedar, 2018; Luo et al., 2018; Halder et al., 2016; Sellars et al., 2015; Domcke et al., 2015; Flavahan et al., 2016; Dmitrijeva et al., 2018; Koch et al., 2018; Horvath and Raj, 2018) with its causality in determining gene expression even being questioned (Bestor et al., 2015). There are, however, only rare cases where the expression of specific genes, such as pS2 (Métivier et al., 2008; Kangaspeska et al., 2008) and IL-10 (Hwang et al., 2018), is regulated by rapid and reversible changes in DNA methylation. Our findings here identify an important scenario in which reversible promoter methylation plays a critical role in determining the expression pattern of a class of proteins featured by CpG-poor promoters in response to inflammatory stimuli.
Acute changes in DNA methylation have also been analyzed at a genome-wide scale in previous studies. One study examined mouse neurons activated by electroconvulsive stimulation, and found that methylation changes were preferentially occurred in CpG-poor regions (Guo et al., 2011). Though promoters were underrepresented in these regions, their methylation changes were nevertheless modestly anticorrelated with gene expression (Guo et al., 2011). Such CpG content-dependent changes in DNA methylation, however, were not observed in another study examining neurons activated by contextual learning (Halder et al., 2016). Moreover, DNA methylation changes in human dendritic cells following infection rarely occurred at promoters (Pacis et al., 2019; Pacis et al., 2015), and were claimed to be a consequence of gene expression (Pacis et al., 2019). Those findings thus argue that the regulation of reversible methylation on inducible expression of genes with CpG-poor promoters may be context-dependent, and that rigorously controlled case study should be integrated into genome-wide investigation to conclude on causality.
Interestingly, genes showing inducible expression in macrophages activated by endotoxin have been classified into two groups: nucleosome remodeling-independent genes with CpG-rich promoters, and nucleosome remodeling-dependent genes with CpG-poor promoters (Ramirez-Carrozzi et al., 2009). Despite their distinct requirements for SWI/SNF complexes, preassembled Pol II and new protein synthesis, both groups of genes exhibit a single-wave kinetics of induction (Ramirez-Carrozzi et al., 2009; Hargreaves et al., 2009; Ramirez-Carrozzi et al., 2006). This is in contrast with CRP and probably other major APRs, which show a two-wave kinetics of induction with the second wave licensed by promoter demethylation. However, nucleosome remodeling might still act downstream in the second wave, as C/EBP-β has recently been shown to promote CRP expression by recruiting BRG1 via MKL1 (Fan et al., 2019). Conversely, promoter methylation could also contribute to inducible expression of nucleosome remodeling-dependent genes in macrophages by directly regulating TF recruitment (Hu et al., 2013; Yin et al., 2017; Thomas et al., 2012).
Despite that most CpGs in mammalian promoters not associated with CGIs are usually methylated (Wu and Zhang, 2014; Luo et al., 2018), TETs and DNMTs can nevertheless mediate active demethylation and de novo methylation, respectively. This indicates that the methylation status of part of the genome may depend on the balance of the two types of enzymes (Jones, 2012; Wu and Zhang, 2014; Dor and Cedar, 2018; Luo et al., 2018; Blattler and Farnham, 2013). Cellular signaling able to tip the balance of TETs and DNMTs could thus represent a regulatory mechanism that finely and reversibly tunes the expression of certain genes in response to environmental cues. In case of CRP, DNMT3A and TET2 appear to be involved in the regulation. Though the mechanism of TF-induced local demethylation is not fully understood (Luo et al., 2018), TFs including NF-κB and EGR1 have been reported to evoke DNA demethylation in neurons (Jarome et al., 2015) for example by recruiting TET1 (Sun et al., 2019). Future study is warranted to elucidate how TFs regulate the balance of TETs and DNMTs and to discover scenarios where regulation by reversible DNA methylation plays a prominent role.
Materials and methods
Determination of promoter methylation level
Request a detailed protocolFrozen tumor/normal tissue sample pairs were obtained from the tissue bank of Gansu Cancer hospital. Genomic DNA samples extracted from tissues or Hep3B cells were bisulfite-converted and recovered using EpiTect Bisulfite Kit (QIAGEN, Hamburg, Germany; catalog number: 59104; lot number: 142338839, 145038568, 148214306, 151030901) according to the manufacturer’s instructions. Samples were then amplified with SureStart Taq DNA Polymerase (Agilent Technologies, Santa Clara, CA; catalog number: 600282; lot number: 0006129848). The primer sequences used were: human CRP (Forward: 5’-GTAGGTGTTGGAGAGGTAGTTATTA-3’; Reverse: 5’-ATTTATATCCAAAACAATAAAAAAATTTAC-3’); rabbit CRP (Forward: 5’-ATGTTAGAGTTGAAGGTGTTGGAGATA-3’; Reverse: 5’-AAATACTAAAAATCCTACATCCCTTACCTC-3’); human SAA (Forward: 5’-GTTTTTATTTTATATTTTTTAGTAG-3’; Reverse: 5’-TAATACTAATCTATACTATAACTAAACTAC-3’); human SAP (Forward: 5’-AAGAAAGAAAAGGTTTTGTTTTTA-3’; Reverse: 5’-ATTTTCCAAATCTACCTCCTAAC-3’)). Subsequent cloning and sequencing were performed as described (Varley et al., 2009). The experiments conformed to the Guide for the Care and Use of Laboratory Animals published by NIH, and were conducted according to the protocols approved by the Ethics Committee of Animal Experiments of Xi’an Jiaotong University and Lanzhou University (2016–064 and A201307050027).
Determination of gene expression
Request a detailed protocolHuman hepatocellular carcinoma cell line Hep3B were obtained from cell bank of Chinese Academy of Sciences (Shanghai, China). Hep3B cells were cultured in MEM media (Sigma-Aldrich, St. Louis, MO; catalog number: M0643; lot number: SLBF6418, SLBM7544V) containing 10% FBS (Biological industries, Beit Haemek, Israel; catalog number: 04-001-1A; lot number: 1418110). Cells were tested for mycoplasma and have been authenticated by Cel-ID (Mohammad et al., 2019) using RNA-seq: their correlation (R2) to Hep3B cells (G28888.Hep_3B2.1.7.3) in Cancer Cell Line Encyclopedia project is 0.92 (p<10−24). Total RNA was extracted with RNAiso Plus reagent (Takara, Shiga, Japan; catalog number: 9108, 9109; lot number: 2270A, AA4102-1, AA6201-1, AA3101-1). cDNA was synthesized from 1 μg total RNA using reverse transcriptase M-MLV (Takara; catalog number: 2641B; lot number: AG70412A), Oligo d(T)15 Primers (Takara; catalog number: 3805; lot number: T1301BA), dNTP mixture (Takara; catalog number: 4019; lot number: B4101A), and recombinant ribonuclease inhibitor (Takara; catalog number: 2313B; lot number: K8101GA). Gene expression was determined with quantitative PCR (q-PCR) using SYBR Premix Ex Taq II (Takara; catalog number: RR820A; lot number: AK7602) in a CFX96 Real-Time PCR Detection System (Bio-rad, Hercules, CA). The gene expression levels were normalized to that of ACTB. The primer sequences used were: human CRP (Forward: 5’-GGAGCAGGATTCCTTCGGT-3’; Reverse: 5’-CACTTCGCCTTGCACTTCAT-3’); human SAA (Forward: 5’-GTGATCAGCGATGCCAGAGAGA-3’; Reverse: 5’-CCAGCAGGTCGGAAGTGATTG-3’); human SAP (Forward: 5’-CTTGATCACACCGCTGGAGAAG-3’; Reverse: 5’-CTTGGGTATTGTAGGAGAAGAGGCTG-3’); human ACTB (Forward: 5’-CGTGGACATCCGCAAAGAC-3’; Reverse: 5’- CTCAGGAGGAGCAATGATCTTGA-3’).
Gene expression profiles of Hep3B cells with or without IL-6 and IL-1β treatment for 24 hr were determined with RNA sequencing services provided by GENEWIZ (South Plainfield, NJ). Transcriptome and methylome of C57BL/6 mouse liver tissues at the resting or turpentine-induced state were determined with RNA sequencing and whole genome bisulfite sequencing services (WGBS) provided by GENEWIZ. All RNA-seq and WGBS data have been deposited in GEO under accession code GSE146797.
Where appropriate, Hep3B cells were treated with 10 ng/ml rhIL-6 (R and D Systems, Minneapolis, MN; catalog number: 206-IL; lot number: OJZ1716061), 1 ng/ml rhIL-1β (R and D System; catalog number: 201-LB; lot number: AD1515091), 5-Azacytidine (5-aza; 5 µM, 12 hr; DNA methylation inhibitor) (Sigma-Aldrich; catalog number: A2385; lot number: SLBL4994V), RG108 (25 µM, 24 hr; DNA methylation inhibitor) (Selleck Chemicals, Houston, TX; catalog number: S2821; lot number: 02), BAY11-7082 (2 µM, 24 hr; NF-κB inhibitor) (Selleck Chemicals; catalog number: S2913; lot number: 01), S31-201 (30 µM, 24 hr; STAT3 inhibitor) (Selleck Chemicals; catalog number: S1155; lot number: 02) or Stattic (5 µM, 24 hr; STAT3 inhibitor) (Selleck Chemicals; catalog number: S7024; lot number: 01).
Modulation of DNA methylation regulators
Request a detailed protocolFor knockdown, targeting sequences were synthesized (GENEWIZ), and cloned into pcDNA6.2-GW/EmGFP-miR vector (Invitrogen, Carlsbad, CA; catalog number: K4935-00). The targeting sequences were: DNMT1 (#1 5’-GATTTGGAAAGAGACAGCTTA-3’; #2 5’-CAACAGAGGACAACAAGTTCA-3’); DNMT3A (#1 5’-GGTGTGTGTTGAGAAGCTGAT-3’; #2 5’-GAATTTGACCCTCCAAAGGTT-3’); DNMT3B (#1 5’-GGTTTGGCGATGGCAAGTTCT-3’; #2 5’-CGAGAACAAATGGCTTCAGAT-3’); TET1 (#1 5’-CATGCAAGGCCTTCCAGATTA-3’; #2 5’-AGAGAACAGCCAGTTTGCTTA-3’); TET2 (#1 5’-GTGTAGGTAAGTGCCAGAAAT-3’; #2 5’-CATGGCGTTTATCCAGAATTA-3’); TET3 (#1 5’-CCTTTATGACTTCCCTCAGCG-3’; #2 5’-CCAGTTGATGGACCTGTTCCA-3’). For overexpression, coding sequence of target genes were cloned into pcDNA3.1 vector (Invitrogen; catalog number: V795-20). Vectors were transfected into Hep3B cells with ViaFect Transfection Reagent (Promega, Madison, WI; catalog number: E4982; lot number: 0000251076, 0000136819). 48 hr later, gene expression was determined with q-PCR.
For Cas9-mediated knockout (Ran et al., 2013), targeting sequences corresponding to sgRNAs were synthesized (GENEWIZ), and cloned into pSpCas9(BB)−2A-Puro (PX459) v2.0 vector (Addgene, Cambridge, MA; catalog number: 62988). The targeting sequences were: DNMT3A (#1 5’-GGACCTCTTGGTGGGGCCGG-3’ against exon 14; #2 5’-GGAAGGTGGGGCGGCCTGGG-3’ against exon 2); TET2 (#1 5’-GGGAGATGTGAACTCTGGGA-3’ against exon 3; #2 5’-GGAGAACTTGCGCCTGTCAG-3’ against exon 7). Gene expression was determined with q-PCR. In some experiments, single clones of DNMT3A knockout cells were further selected with puromycin (Corning, NY; catalog number: 58-58-2; lot number: 61385051).
For dCas9-mediated targeting (Hilton et al., 2015; Kabadi et al., 2014), targeting sequences corresponding to sgRNAs were synthesized (GENEWIZ), and cloned into phU6-gRNA vector (Addgene; catalog number: 53188). The targeting sequences for CRP promoter were: #1 5’-GGGGACTGTTGTGGGGTGGG-3’; #2 5’-GAAGCTCTGACACCTGCCCC-3’. The catalytic domains of DNMT3A and TET2 were cloned into pcDNA-dCas9-p300 Core vector (Addgene, Cambridge, MA; catalog number: 61357). sgRNA vector and DNMT3A or TET2 vector were co-transfected into Hep3B cells. 48 hr later, gene expression was determined with q-PCR.
To prepare Hep3B cells stably expressing Cas9 (Koike-Yusa et al., 2014), pspax2, pMD2G and pLentiCas9-BFP were co-transfected into HEK293T cells. Lentivirus particles were harvested 48 hr later and were used to infect Hep3B cells. Stable cell line was selected with Blasticidine (Sigma-Aldrich; catalog number: 15205; lot number: BCBM5270V). Targeting sequences corresponding to sgRNAs were synthesized (GENEWIZ), cloned into pKLV-U6gRNA(BbsI)-PGKpuro2ABFP vector (Addgene; catalog number: 50946), and packed into lentivirus particles to infect Hep3B cells stably expressing Cas9. Stable cell lines of C/EBP-β knockout were further selected with puromycin (Corning, NY; catalog number: 58-58-2; lot number: 61385051). The targeting sequences for C/EBP-β were: #1 5’-GGGCGCCTGGGGGCCGCCAA-3’; #2 5’-GGCGGCGGCGGCGGCGGGGG-3’.
Luciferase reporter assay
Request a detailed protocolThe promoter fragment of CRP (−533 ~ +103 bp) was cloned into PGL4.10 (luc2) vector (Promega, Madison, WI; catalog number: E6651). Hep3B cells were transfected with 1.5 μg of PGL4.10 CRP reporter vector and 0.075 μg of phRL-TK (Promega; catalog number: E6241) using X-tremeGENE 9 DNA Transfection Reagent (Roche, Basel, Schweiz; catalog number: 06365787001; lot number: 23644700). After 48 hr of transfection, luciferase activities were measured using Dual-Luciferase Reporter Assay System (Promega; catalog number: E1960; lot number: 0000201344) on a Synergy HTX Multi-Mode Microplate Reader (BioTek, Winooski, VT). Activities of firefly luciferase were normalized with that of co-transfected Renilla luciferase.
Chromatin immunoprecipitation (ChIP)
Request a detailed protocolChIP experiments were performed as described (Nelson et al., 2006). Briefly, Hep3B cells with or without transfected PGL4.10 vector containing CRP promoter were cross-linked with 1.42% formaldehyde at room temperature for 15 min. The reaction was stopped by addition of glycine to a final concentration of 125 mM. Cells were then sonicated in IP buffer (150 mM NaCl, 50 mM Tris, pH 7.5, 5 mM EDTA, 0.5 % NP-40, 1.0% Triton X-100) at 4°C for 10 min, followed by addition of anti-STAT3 (Santa Cruz, Dallas, TX; catalog number: sc-482X; lot number: B0615), anti-p50 (Santa Cruz; catalog number: sc-7178X; lot number: C0314) or anti-C/EBP-β (Santa Cruz; catalog number: sc-150X; lot number: J2215) for 15 min in ice/water bath with sonification. Protein-DNA complexes were isolated with nProtein A Sepharose 4 Fast Flow (GE Healthcare, Chicago, IL; catalog number: 17-5280-01; lot number: 10235150), and eluted with 10% Chelex 100 (Sigma-Aldrich; catalog number: C7901; lot number: SLBM2735V). The eluates were treated with proteinase K (BioFroxx, Hesse Einhausen, Germany; catalog number:1124MG100; lot number: 86081) and subjected to DNA purification, and the crosslinking was reversed by heating at 55°C for 30 min and boiling for 10 min. DNA was then purified and analyzed with q-PCR. The primer sequences for human CRP used were: genomic binding (Forward: 5’-CTCTTCCCGAAGCTCTGACACCT-3’; Reverse: 5’-AACAGCTTCTCCATGGTCACGTC-3’); vector binding (Forward: 5’-CTCTTCCCGAAGCTCTGACACCT-3’; Reverse: 5’-TGGCTTTACCAACAGTACCGGAT-3’).
In some experiments, vectors were either entirely methylated with CpG methyltransferase (NEB, Ipswich, MA; catalog number: M0226L; lot number: 0311608) or site-specifically methylated at −53 or −108 CpG sites of CRP promoter through vector PCR using appropriately methylated primers before transfection.
Statistical analysis
Request a detailed protocolData were presented as mean ± SEM. Statistical analysis was performed by the two-tailed Student’s t-test, one-way ANOVA with Tukey post hoc or K-S tests as appropriate. Values of p<0.05 were considered significant.
Data availability
Sequencing data have been deposited in GEO under accession code GSE146797.
-
NCBI Gene Expression OmnibusID GSE146797. WGBS and RNA-seq of mouse livers and human Hep3B cells.
-
NCBI Gene Expression OmnibusID GSM916049. Bisulfite-Seq analysis of WGBS_Lib 11 derived from human liver cells.
-
NCBI Gene Expression OmnibusID GSM1716965. liver_N3_BS.
-
NCBI Gene Expression OmnibusID GSM1120331. Whole Genome Shotgun Bisulfite Sequencing of Fat Cells from Human STL003.
-
NCBI Gene Expression OmnibusID GSM1120325. Whole Genome Shotgun Bisulfite Sequencing of Adrenal Cells from Human STL003.
-
NCBI Gene Expression OmnibusID GSM1120329. Whole Genome Shotgun Bisulfite Sequencing of Aorta Cells from Human STL003.
-
NCBI Gene Expression OmnibusID GSM983649. Whole Genome Shotgun Bisulfite Sequencing of Esophagus Cells from Human STL003.
-
NCBI Gene Expression OmnibusID GSM1120333. Whole Genome Shotgun Bisulfite Sequencing of Gastric Cells from Human STL003.
-
NCBI Gene Expression OmnibusID GSM983647. Whole Genome Shotgun Bisulfite Sequencing of Lung Cells from Human STL002.
-
NCBI Gene Expression OmnibusID GSM1120323. Whole Genome Shotgun Bisulfite Sequencing of Ovary Cells from Human STL002.
-
NCBI Gene Expression OmnibusID GSM1010986. Whole Genome Shotgun Bisulfite Sequencing of Psoas Cells from Human STL003.
-
NCBI Gene Expression OmnibusID GSM1120335. Whole Genome Shotgun Bisulfite Sequencing of Right Atrium Cells from Human STL003.
-
NCBI Gene Expression OmnibusID GSM983645. Whole Genome Shotgun Bisulfite Sequencing of Sigmoid Colon Cells from Human STL001.
-
NCBI Gene Expression OmnibusID GSM983652. Whole Genome Shotgun Bisulfite Sequencing of Spleen Cells from Human STL003.
-
NCBI Gene Expression OmnibusID GSM1120322. Whole Genome Shotgun Bisulfite Sequencing of Thymus Cells from Human STL001.
References
-
C-Reactive protein and the risk of Cancer: a mendelian randomization studyJNCI: Journal of the National Cancer Institute 102:202–206.https://doi.org/10.1093/jnci/djp459
-
Cross-talk between site-specific transcription factors and DNA methylation statesJournal of Biological Chemistry 288:34287–34294.https://doi.org/10.1074/jbc.R113.512517
-
An integrated view of humoral innate immunity: pentraxins as a paradigmAnnual Review of Immunology 28:157–183.https://doi.org/10.1146/annurev-immunol-030409-101305
-
The rel family member P50 mediates cytokine-induced C-reactive protein expression by a novel mechanismThe Journal of Immunology 165:4592–4597.https://doi.org/10.4049/jimmunol.165.8.4592
-
Pentraxins: structure, function, and role in inflammationISRN Inflammation 2013:1–22.https://doi.org/10.1155/2013/379040
-
An interaction between MKL1, BRG1, and C/EBPβ mediates palmitate induced CRP transcription in hepatocytesBiochimica Et Biophysica Acta (BBA) - Gene Regulatory Mechanisms 1862:194412.https://doi.org/10.1016/j.bbagrm.2019.194412
-
Acute-phase proteins and other systemic responses to inflammationNew England Journal of Medicine 340:448–454.https://doi.org/10.1056/NEJM199902113400607
-
Heterogeneous nature of the acute phase response. Differential regulation of human serum amyloid A, C-reactive protein, and other acute phase proteins by cytokines in hep 3B cellsJournal of Immunology 141:564–569.
-
Effect of combinations of cytokines and hormones on synthesis of serum amyloid A and C-reactive protein in hep 3B cellsJournal of Immunology 147:1261–1265.
-
Neuronal activity modifies the DNA methylation landscape in the adult brainNature Neuroscience 14:1345–1351.https://doi.org/10.1038/nn.2900
-
DNA methylation-based biomarkers and the epigenetic clock theory of ageingNature Reviews Genetics 19:371–384.https://doi.org/10.1038/s41576-018-0004-3
-
Locus-Specific reversible DNA methylation regulates transient IL-10 expression in Th1 cellsThe Journal of Immunology 200:1865–1875.https://doi.org/10.4049/jimmunol.1701162
-
NF-κB mediates Gadd45β expression and DNA demethylation in the Hippocampus during fear memory formationFrontiers in Molecular Neuroscience 8:54.https://doi.org/10.3389/fnmol.2015.00054
-
Functions of DNA methylation: islands, start sites, gene bodies and beyondNature Reviews Genetics 13:484–492.https://doi.org/10.1038/nrg3230
-
Multiplex CRISPR/Cas9-based genome engineering from a single lentiviral vectorNucleic Acids Research 42:e147.https://doi.org/10.1093/nar/gku749
-
Analysis of DNA methylation in Cancer: location revisitedNature Reviews Clinical Oncology 15:459–466.https://doi.org/10.1038/s41571-018-0004-4
-
Protocol for the fast chromatin immunoprecipitation (ChIP) methodNature Protocols 1:179–185.https://doi.org/10.1038/nprot.2006.27
-
Evolution of C-Reactive proteinFrontiers in Immunology 10:943.https://doi.org/10.3389/fimmu.2019.00943
-
C-reactive protein: a critical updateJournal of Clinical Investigation 111:1805–1812.https://doi.org/10.1172/JCI200318921
-
The role of C/EBP isoforms in the control of inflammatory and native immunity functionsJournal of Biological Chemistry 273:29279–29282.https://doi.org/10.1074/jbc.273.45.29279
-
Hepatocyte-specific mutation of both NF-κB RelA and STAT3 abrogates the acute phase response in miceJournal of Clinical Investigation 122:1758–1763.https://doi.org/10.1172/JCI59408
-
Genome engineering using the CRISPR-Cas9 systemNature Protocols 8:2281–2308.https://doi.org/10.1038/nprot.2013.143
-
Conserved intergenic elements and DNA methylation cooperate to regulate transcription at the il17 locusJournal of Biological Chemistry 287:25049–25059.https://doi.org/10.1074/jbc.M112.351916
-
Genetically elevated C-reactive protein and ischemic vascular diseaseNew England Journal of Medicine 359:1897–1908.https://doi.org/10.1056/NEJMoa0707402
Article and author information
Author details
Funding
National Natural Science Foundation of China (31671339)
- Yi Wu
National Natural Science Foundation of China (31870767)
- Yi Wu
National Natural Science Foundation of China (31570749)
- Shang-Rong Ji
National Natural Science Foundation of China (31770819)
- Shang-Rong Ji
The funders had no role in study design, data collection and interpretation, or the decision to submit the work for publication.
Acknowledgements
We thank the Core Facility of School of Life Sciences, Lanzhou University for technical and instrumental support.
Ethics
Animal experimentation: The experiments conformed to the Guide for the Care and Use of Laboratory Animals published by NIH, and were conducted according to the protocols approved by the Ethics Committee of Animal Experiments of Xi'an Jiaotong University and Lanzhou University.
Copyright
© 2020, Zhang et al.
This article is distributed under the terms of the Creative Commons Attribution License, which permits unrestricted use and redistribution provided that the original author and source are credited.
Metrics
-
- 1,662
- views
-
- 205
- downloads
-
- 21
- citations
Views, downloads and citations are aggregated across all versions of this paper published by eLife.
Citations by DOI
-
- 21
- citations for umbrella DOI https://doi.org/10.7554/eLife.51317
Download links
A two-part list of links to download the article, or parts of the article, in various formats.
Downloads (link to download the article as PDF)
Open citations (links to open the citations from this article in various online reference manager services)
Cite this article (links to download the citations from this article in formats compatible with various reference manager tools)
Reversible promoter methylation determines fluctuating expression of acute phase proteins
eLife 9:e51317.
https://doi.org/10.7554/eLife.51317


