AR phosphorylation and CHK2 kinase activity regulates IR-stabilized AR–CHK2 interaction and prostate cancer survival
- Department of Microbiology, Immunology, and Cancer Biology, University of Virginia, United States
- Cancer Center Member, University of Virginia, United States
Figures
Figure 1 with 1 supplement
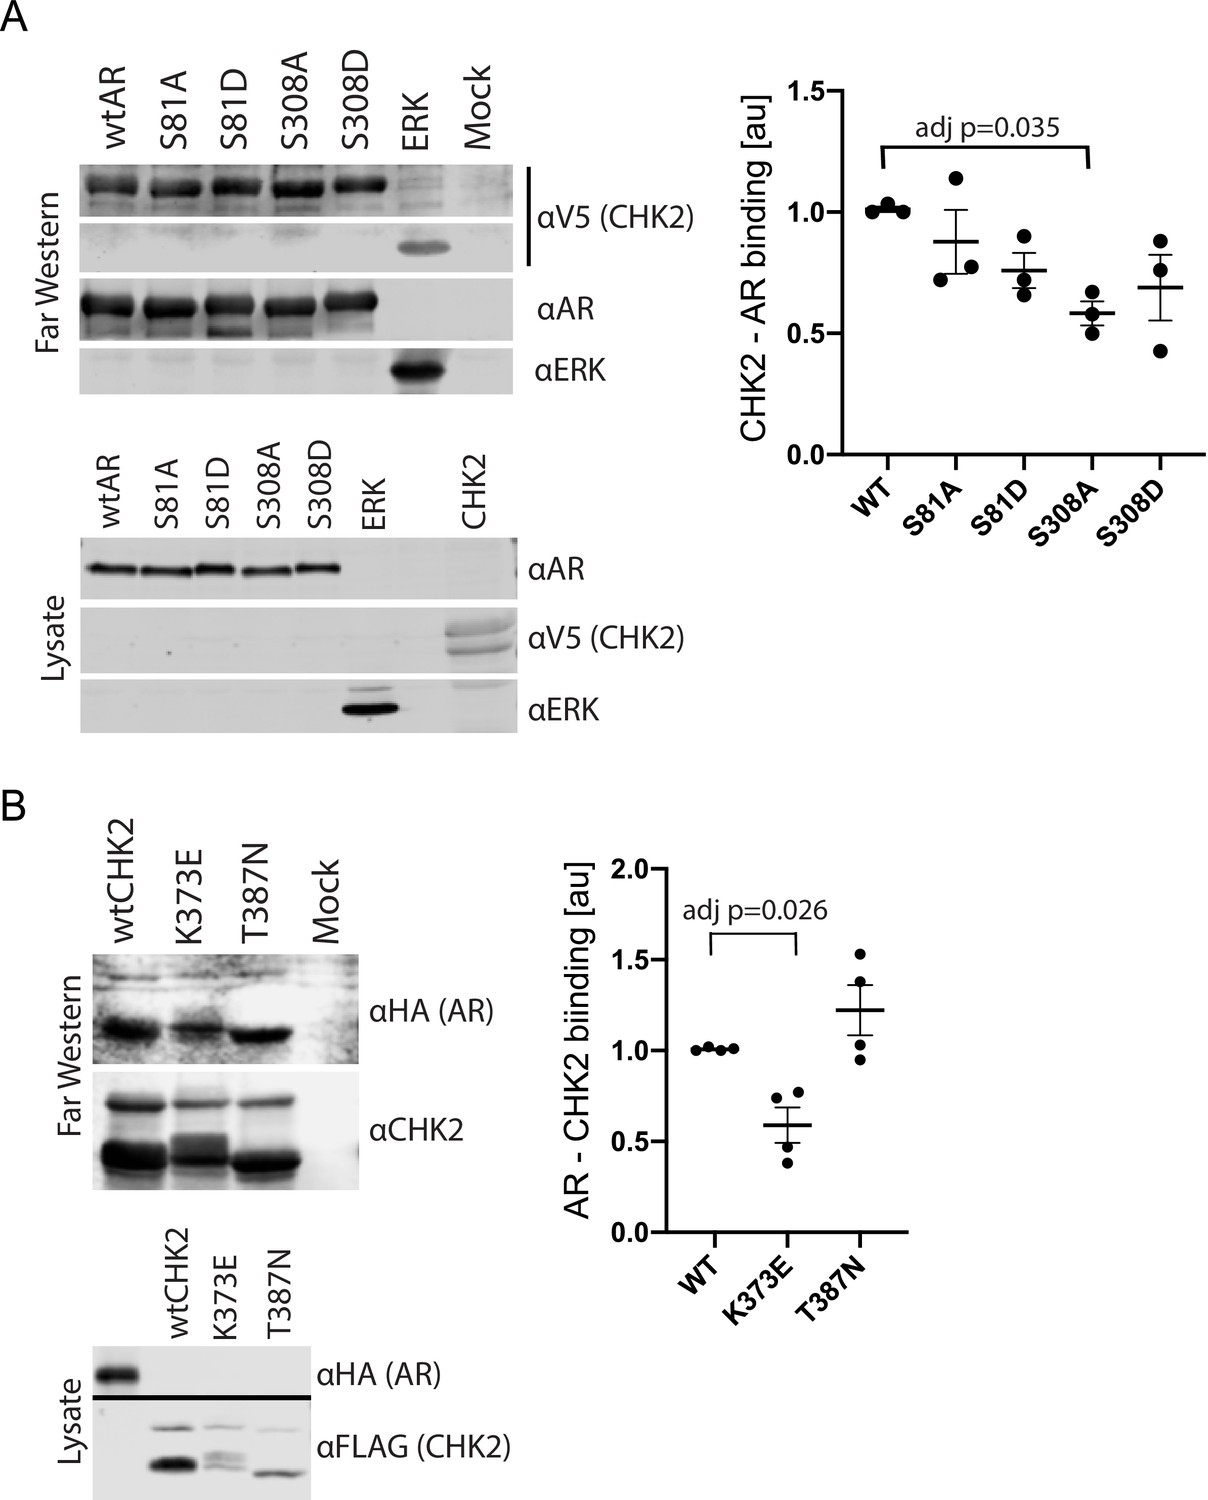
CHK2 directly binds AR.
293 T cells were transfected with Vector, FLAG-wtAR, or the FLAG-AR mutants S81A, S81D, S308A, or S308D, FLAG-wtCHK2, FLAG-CHK2 mutants K373E or T387N, FLAG-ERK2, HA-wtAR, or V5-wtCHK2 using Fugene 6. 48 hr following transfection, FLAG, HA, and V5 were immunoprecipitated, and far western blotting was performed. Membranes were blotted with the following antibodies: FLAG, HA, V5, AR, CHK2, and ERK2. Blots were visualized using the Odyssey CLx. (A) Probe = V5 wild-type CHK2; Targets = FLAG wtAR, or the FLAG-AR mutants S81A, S81D, S308A, or S308D, and FLAG-ERK2. Representative blots are shown, n = 3. (B) Probe = HA wtAR; Targets = FLAG-wtCHK2, FLAG-CHK2 mutants K373E or T387N. Representative blots are shown, n = 4. For (A) and (B), graphs are of relative AR – CHK2 binding. Error bars, SEM. Statistical differences were tested for using ANOVA with Dunnett’s multiple comparisons test.
Figure 1—figure supplement 1
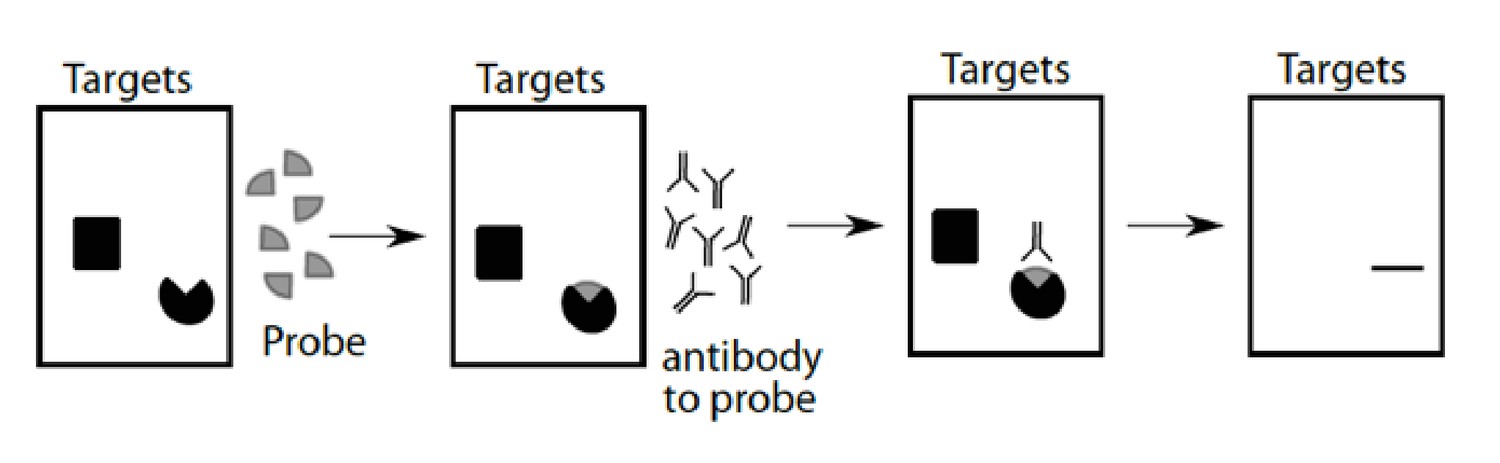
Far western blot schematic.
Purified proteins are separated by SDS-PAGE (target proteins) and then transferred to a membrane. Proteins on the membrane are renatured and then probed with purified proteins (probe), cross-linked, and subsequently detected with antibodies.
Figure 2 with 1 supplement
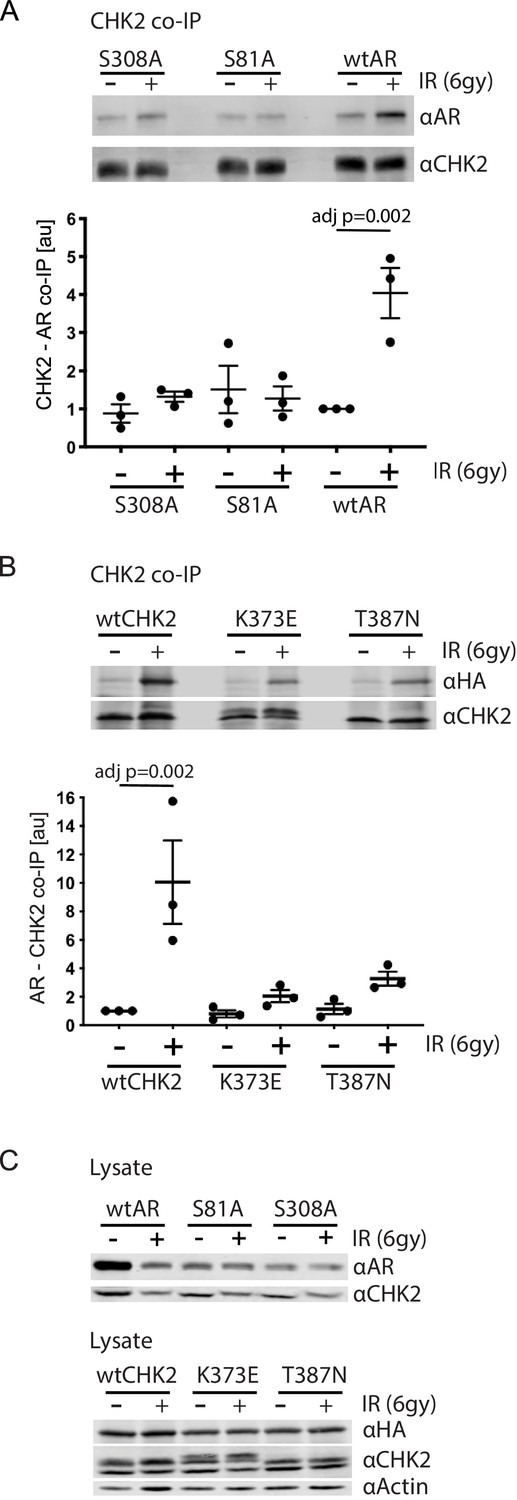
AR phosphorylation and CHK kinase activity regulates AR – CHK2 association.
(A) AR – CHK2 interactions requires AR phosphorylation on S81 and S308. LNCaP cells were transduced with lentiviral particles expressing wtAR, S81A, or S308A for 48 hr. Cells were irradiated with 6Gy, and CHK2 was immunoprecipitated one hour after IR. Representative blots are shown. Blots were quantitated on Odyssey LICOR imaging system. Plotted is the AR signal normalized to total CHK2 and compared to untreated cells, n = 3. Error bars, SEM. Statistical differences were tested for using ANOVA with Sidak’s multiple comparisons test. (B) Expression of CHK2 variants with reduced kinase activity inhibits the radiation-induced increase in AR – CHK2 interactions. LNCaP cells were transfected with HA-wtAR, HA-S81A, or HA-S308 in combination with FLAG-wtCHK2 for 48 hr using TransIT-2020 (Mirus). Cells were irradiated with 6Gy, and FLAG was immunoprecipitated using a magnetic bead system one hour after IR. Representative blots are shown. Plotted is the HA-AR signal normalized to total FLAG-CHK2 and compared to untreated cells. Error bars, SEM. Blots were quantitated on Odyssey LICOR imaging system. Statistical differences were tested for using ANOVA with Sidak’s multiple comparisons test. (C) Control immunoblots of lysate from (A) and (B).
Figure 2—figure supplement 1
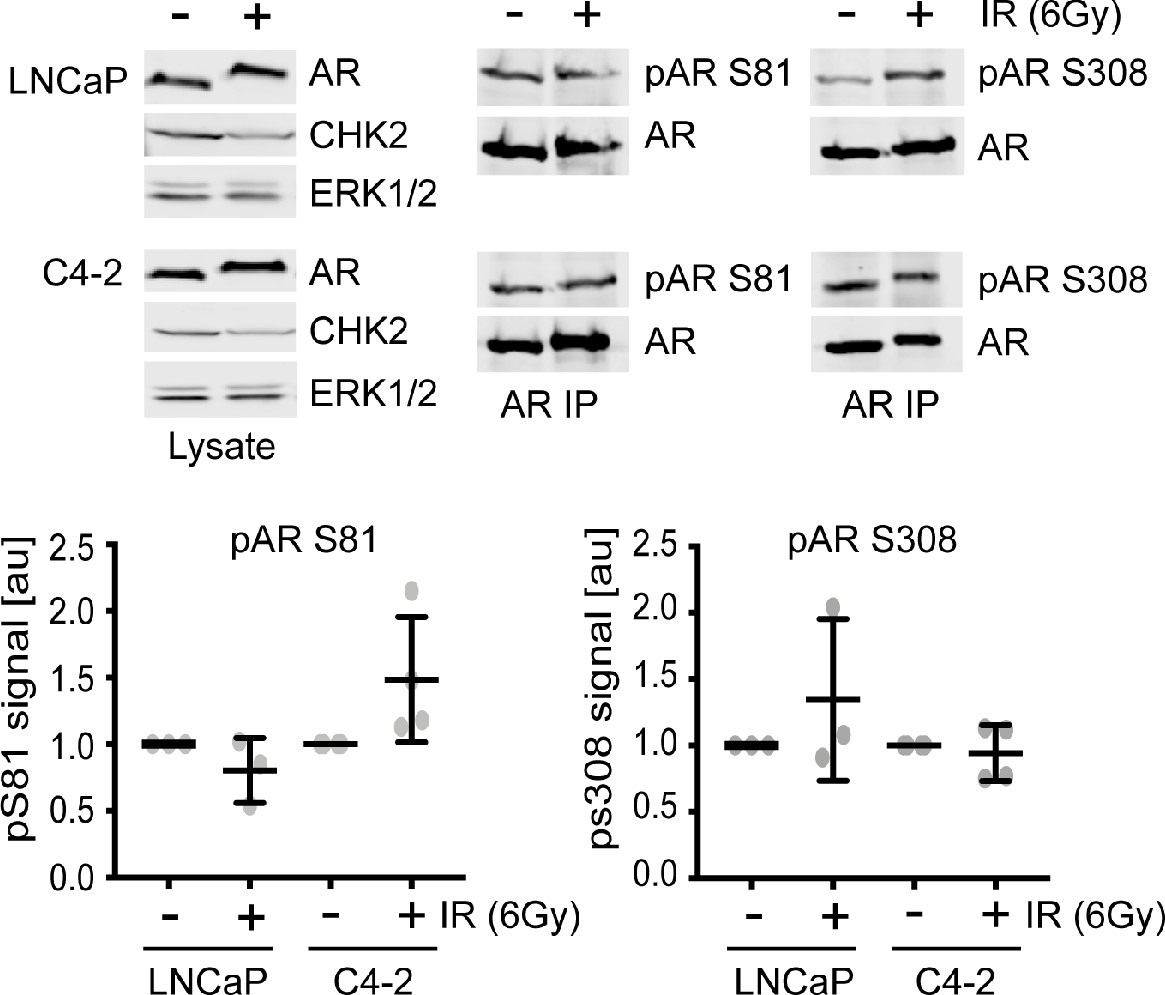
AR S81 and S308 phosphorylation are not altered with radiation.
LNCaP and C4-2 cells were seeded in serum-supplemented growth media for 48 hr, exposed to 6Gy IR, and AR was immunoprecipitated using a magnetic bead system 1 hr after radiation from 1 mg cell extracts. Proteins were separated by 7.5% SDS-PAGE, and blotted with AR, pAR S81, pAR S308, CHK2, and ERK1/2. Representative blots are shown. Plotted is the pAR signal normalized to total AR and compared to untreated cells, n = 3, no statistical difference between the groups by ANOVA. Blots were quantitated on Odyssey LICOR imaging system.
Figure 3 with 1 supplement
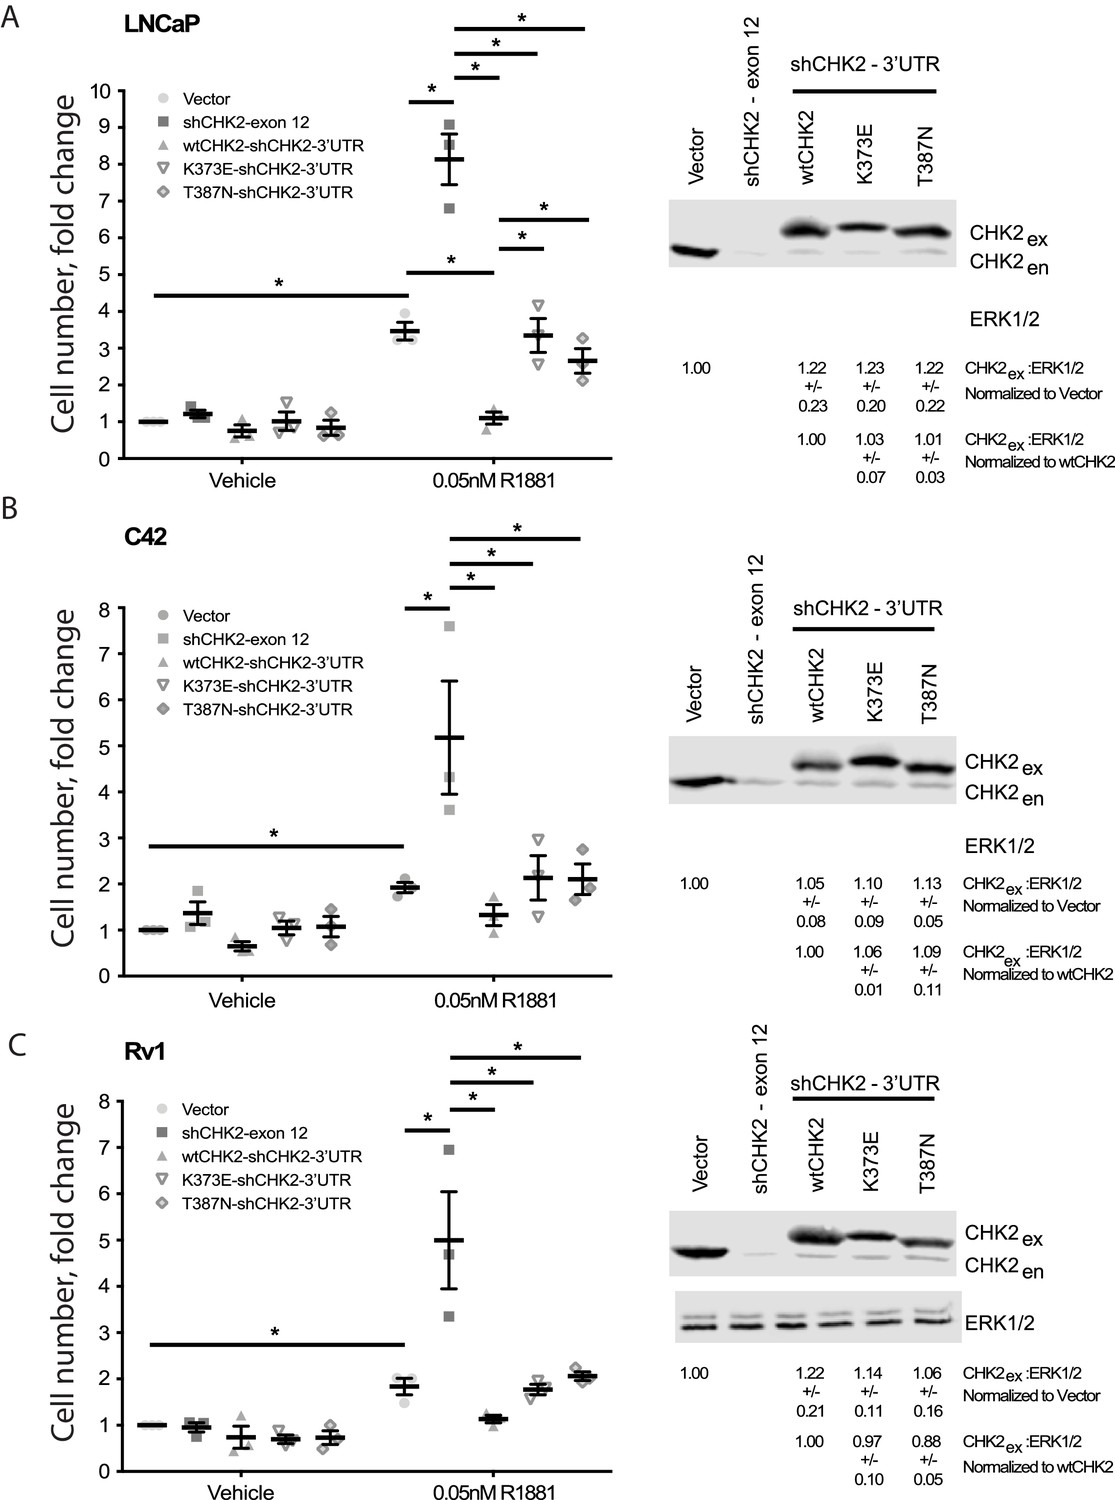
Wild-type CHK2 negatively regulates prostate cancer cell growth.
(A) LNCaP, (B) C4-2, and (C) Rv-1 cells were transduced with lentiviral particles expressing vector, shCHK2-exon 12, or shCHK2-3’UTR in combination with wtCHK2, K373E, or T387N in the presence or absence of 0.05nM R1881. CyQuant assay was performed 7 days after transduction. Cell growth was compared with untreated vector control and the values were averaged across biological replicates. Error bars, SEM, n = 3. Statistical analysis was performed using ANOVA and Tukey test, *=p < 0.01. Representative blots of CHK2 expression are shown with ERK as a loading control.
Figure 3—figure supplement 1

Non-cropped images of western blots shown in the manuscript.
Figure 4
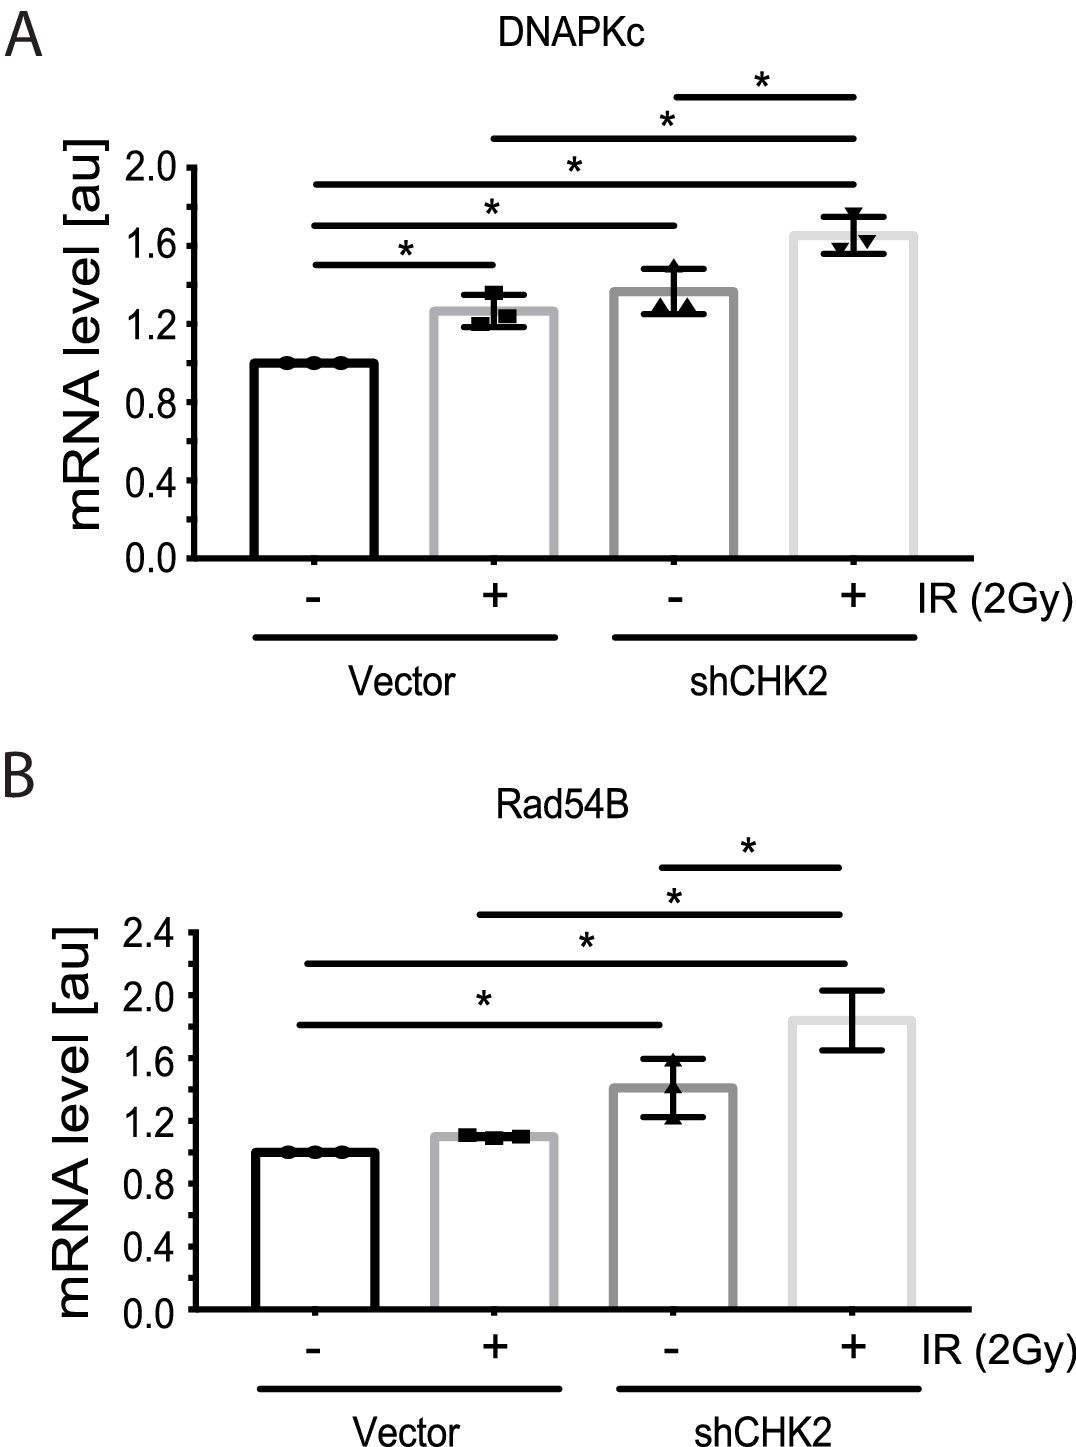
CHK2 knockdown increases the transcription of DDR genes in the presence and absence of radiation.
Transcript levels of DDR genes in LNCaP cells transduced with CHK2 shRNAs and pLKO vector control and grown in CSS supplemented with 1 nM DHT were measured by qPCR. 48 hr following transduction, cells were exposed to 2Gy ionizing radiation and RNA was isolated 6 hr later. SQ means were determined using standard curves, normalized to the reference gene PSMB6, with the untreated pLKO condition set to 1x. Values were averaged across biological replicates +/- standard error of the mean, n = 3. Shown are the histograms for (A) DNAPKc and (B) Rad54B in LNCaP cells. Statistical analysis was performed using one-way ANOVA and Tukey’s test. *=p < 0.02.
Figure 5 with 1 supplement
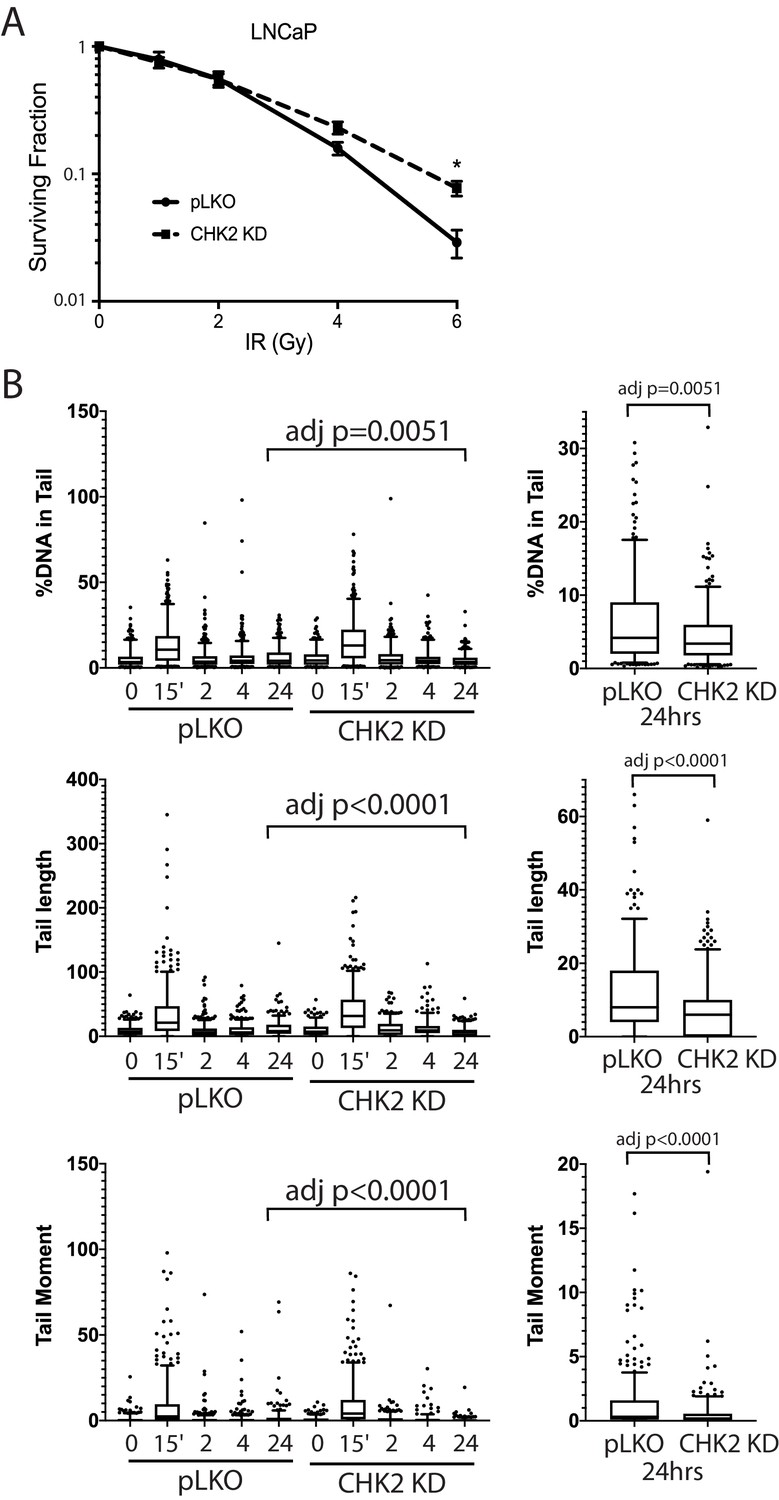
CHK2-depleted cells show increased survival and reduced DNA damage following radiation.
(A) Knockdown of CHK2 desensitizes cells to IR. LNCaP cells were transduced with lentiviral particles expressing pLKO or CHK2 shRNAs for 48 hr, treated with 0-6Gy IR, and seeded at the appropriate cell number for colony survival assays. Results were normalized to untreated pLKO control and fitted to a standard linear quadratic model. Error bars, SEM. Statistical analysis was performed using the Student’s t-test, n = 4–8, p<0.01. (B) LNCaP cells were transduced with lentiviral particles expressing pLKO or CHK2 shRNAs for 48 hr, irradiated at the indicated doses at the specified times and processed for comet assays. Shown is the %DNA in the comet tail, comet tail length, and tail moment (% DNA x tail length), n = 3 (209–592 cells measured per condition), 5–95% confidence intervals. Right most plots are of pLKO and CHK2 KD at 24 hr to illustrate the statistical difference marked on the graphs. Statistical differences were tested for using Kruskal-Wallis test followed by Dunn’s multiple comparisons test.
Figure 5—figure supplement 1
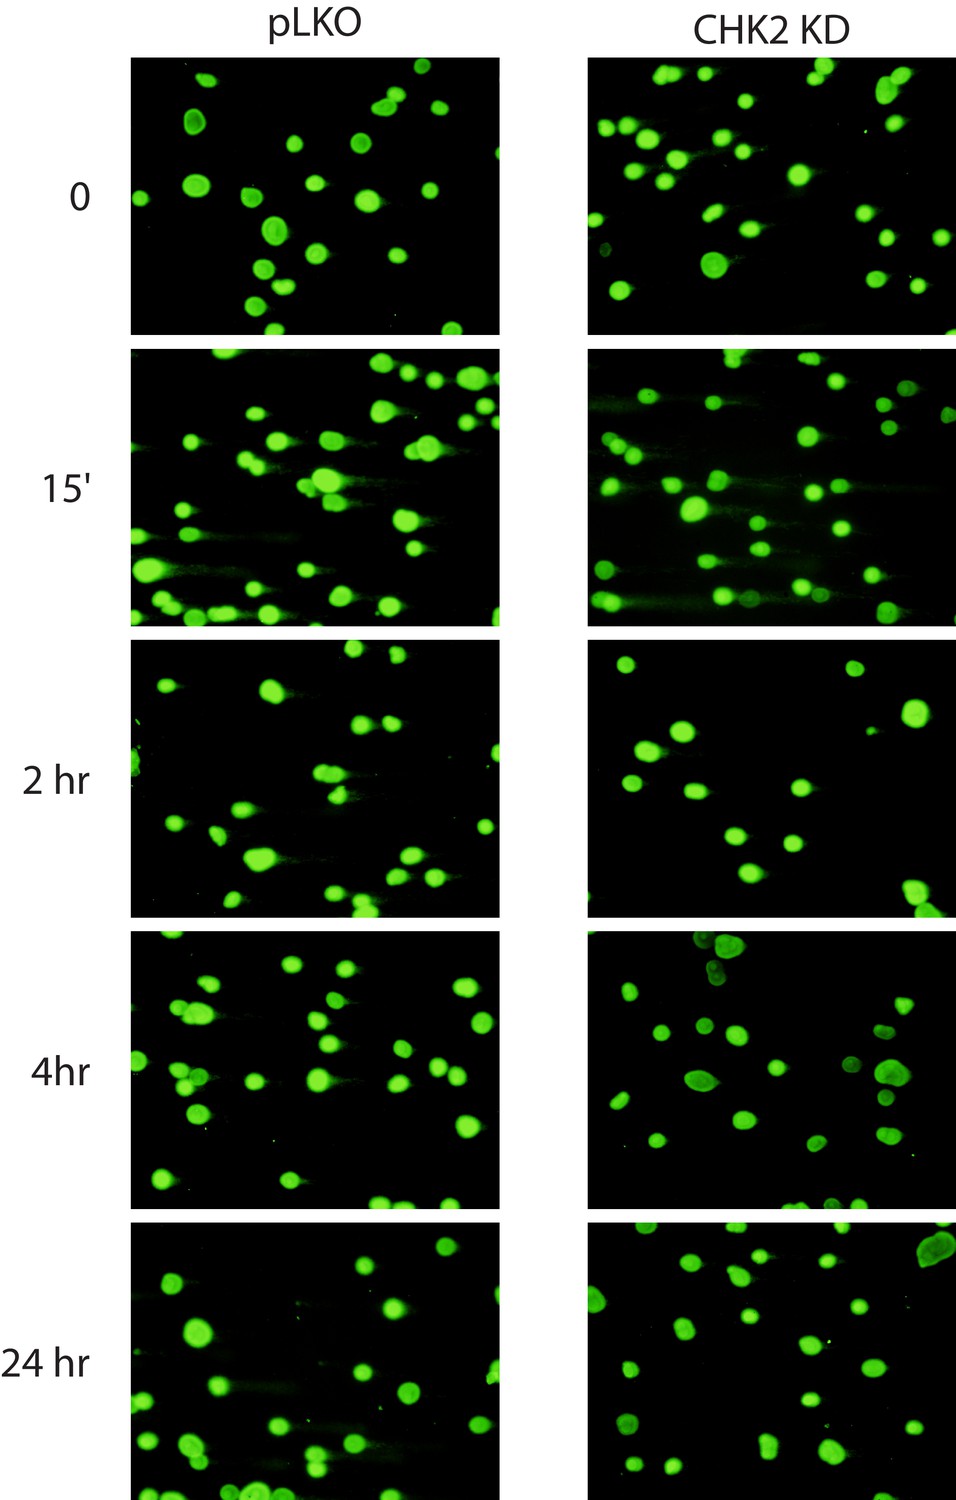
LNCaP cells were transduced with lentiviral particles expressing pLKO or CHK2 shRNAs for 48 hr, irradiated at the indicated doses at the specified times and processed for comet assays.
Shown are representative images of quantitation shown in Figure 5B.
Figure 6 with 2 supplements

CHK2-depleted cells show altered γH2AX foci kinetics.
(A) Representative images of γH2AX, CHK2, and AR immunostaining quantified in (B and C). (B) Rv1 cells were transduced with lentiviral particles expressing empty vector or CHK2 shRNAs on fibronectin-coated coverslips in the appropriate growth media. Cells were irradiated with 6Gy after 48 hr. Coverslips were processed for IF at 0, 15 min, 2, 4, and 24 hr following IR. Plotted is the (B) γH2AX signal and (C) 53BP1 signal, which equals the mean grey value intensity x number of foci per nucleus, n = 3 (378–565 nuclei measured per condition), 5–95% confidence intervals. Statistical differences were tested for using Kruskal-Wallis test followed by Dunn’s multiple comparisons test.
Figure 6—figure supplement 1
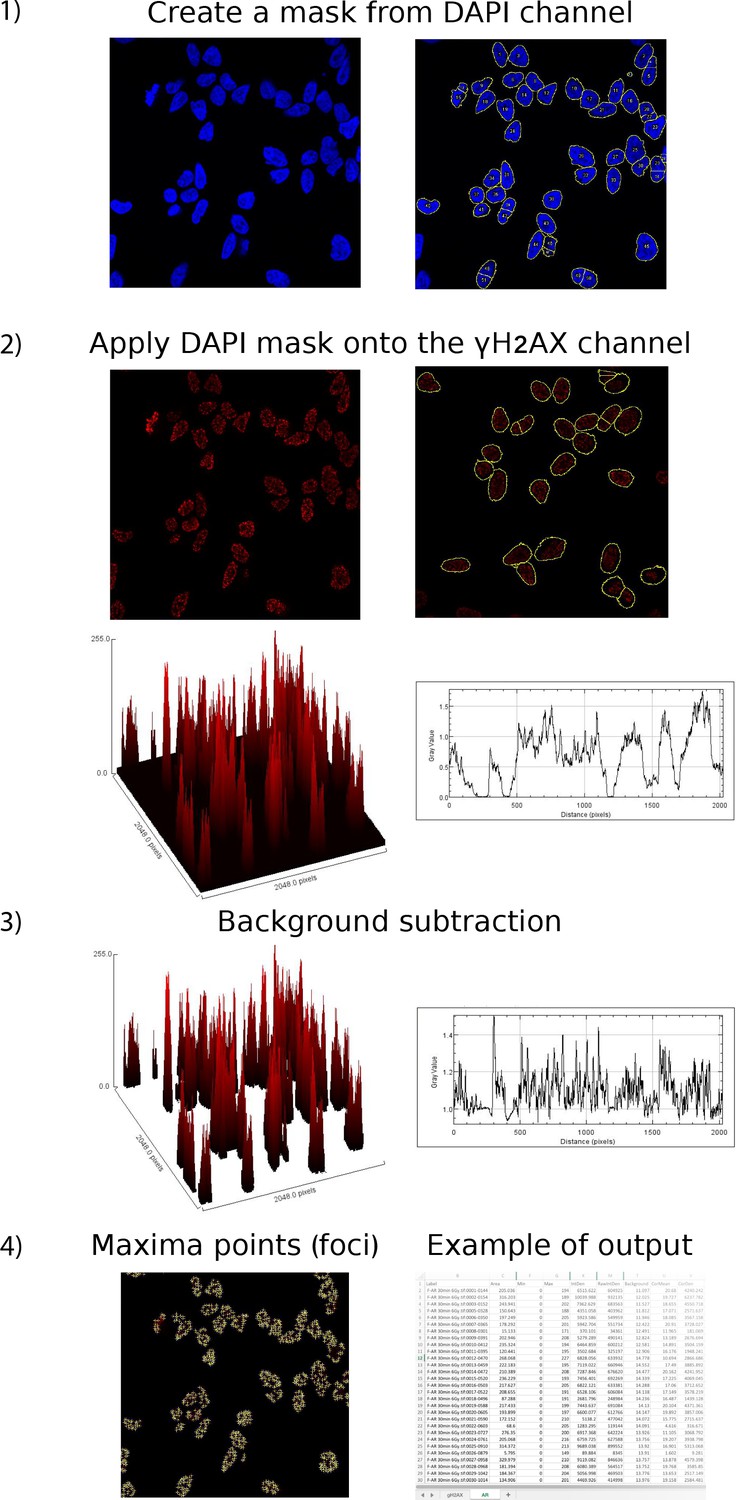
Automated quantitation of foci.
Confocal images are captured on a Zeiss LSM 880 at 40x oil using Zeiss Zen digital imaging software and processed into individual TIFF files for each fluorescence channel using ImageJ. An outline of nuclei (mask) from DAPI channel is created and applied to all channels. Macro-enabled image processing to measure multiple fluorescence parameters with background subtraction using the following parameters: area, IntDen, RawIntDen, Min and Max, fluorescence, background, foci count, CorDen, CorMean. γH2AX signal is the product of foci number per nuclei and mean grey value (IntDen/area).
Figure 6—figure supplement 2
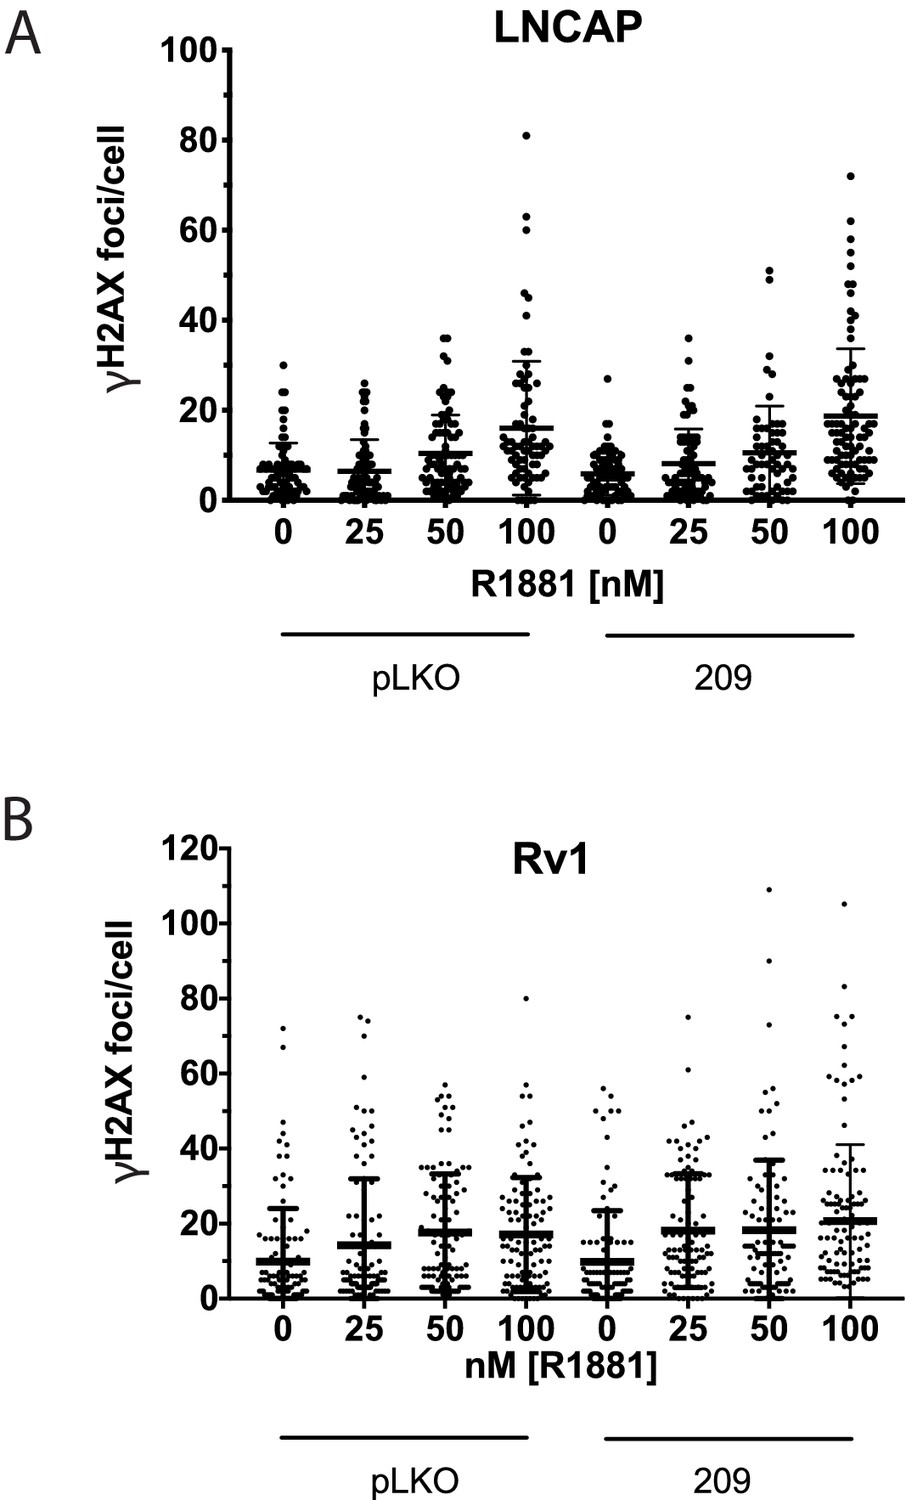
CHK2 Knockdown does not alter hormone induced γH2AX foci.
LNCaP and Rv1 cells were transduced with lentiviral particles expressing empty vector or CHK2 shRNA on fibronectin-coated coverslips in whole media for 48 hr. Media was changed to CSS overnight and cells were treated with hormone for 6 hr. Plotted is the number of γH2AX foci per cell. n = 3 for LNCaP and n = 2 for Rv1. At the same dose of hormone there was no statistical difference between vector control and CHK2 knockdown by Kruskal-Wallis test followed by Dunn’s multiple comparisons test.
Figure 7
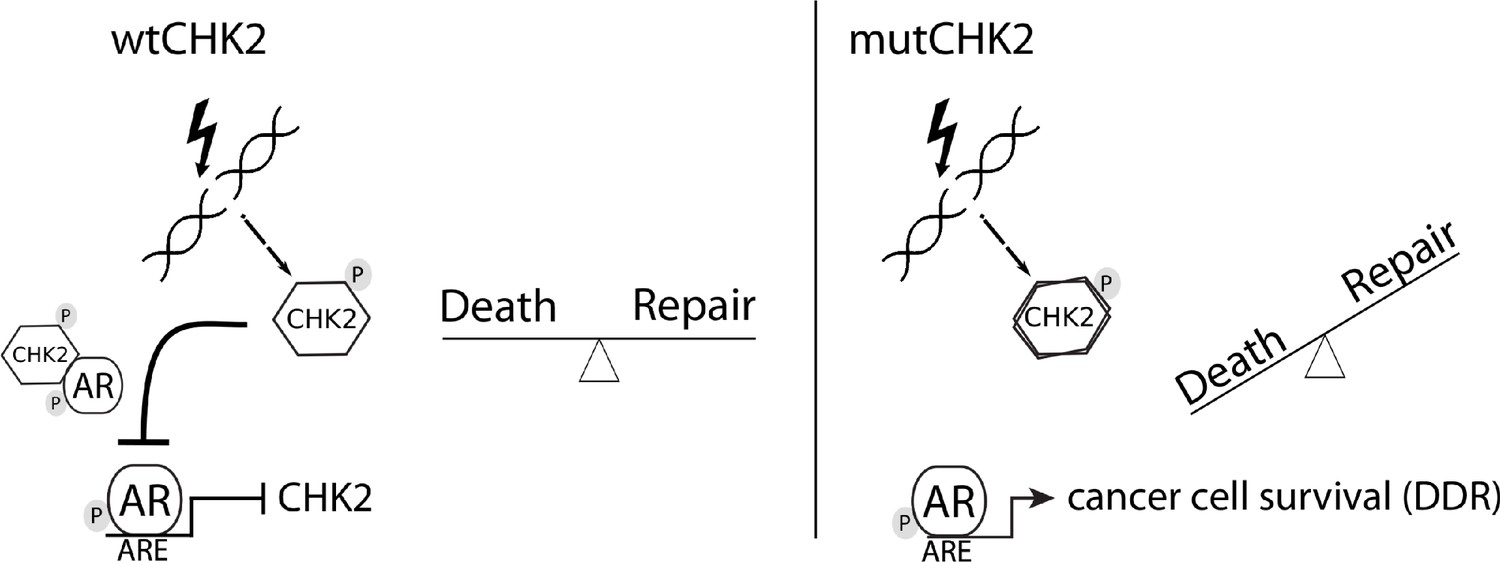
Model of CHK2-AR.
We hypothesize the following model. In response to IR, CHK2 activation antagonizes AR through direct binding and inhibition of transcription of AR targets. CHK2 mutation or loss of expression that occurs in PCa leads to sustained AR transcriptional activity, an increase in DDR gene transcripts, and survival in response to DNA damage.
Additional files
Download links
A two-part list of links to download the article, or parts of the article, in various formats.
Downloads (link to download the article as PDF)
Open citations (links to open the citations from this article in various online reference manager services)
Cite this article (links to download the citations from this article in formats compatible with various reference manager tools)
AR phosphorylation and CHK2 kinase activity regulates IR-stabilized AR–CHK2 interaction and prostate cancer survival
eLife 9:e51378.
https://doi.org/10.7554/eLife.51378


