A stochastic framework of neurogenesis underlies the assembly of neocortical cytoarchitecture
- King’s College London, United Kingdom
- Institute of Science and Technology Austria, Austria
- University of Freiburg, Germany
- University of Sussex, United Kingdom
Figures
Figure 1 with 1 supplement
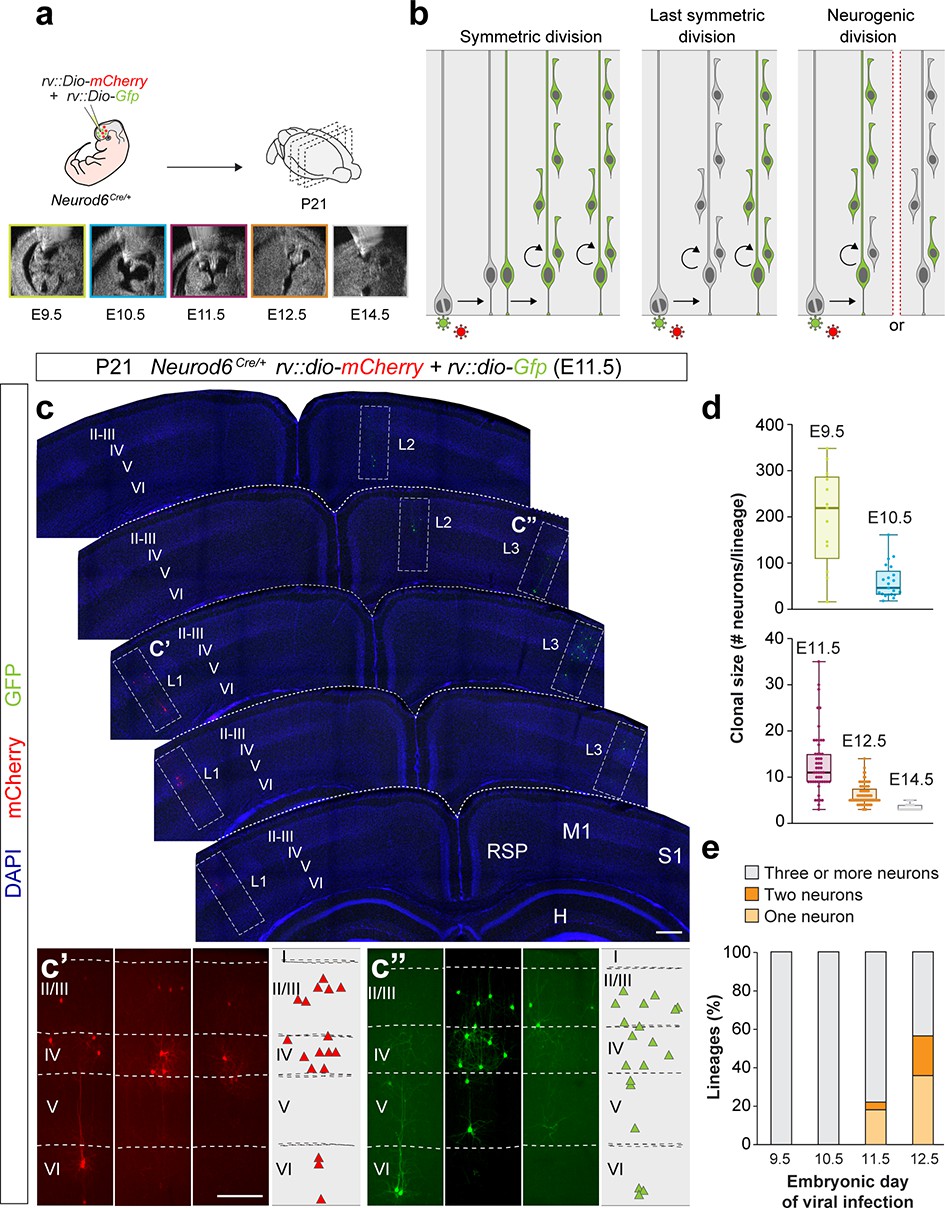
Identification of pyramidal cell lineages with low-titer conditional reporter retroviruses.
(a) Experimental paradigm. (b) Schematic representation of the expected labeling outcomes in retroviral lineage tracing experiments. (c–c’) Serial 100 μm coronal sections through the telencephalon of a P21 Neurod6Cre/+ mouse infected with low-titer conditional reporter retroviruses at E11.5. Lineages (L) 1 and 3 are shown at high magnification in c’ and c’’, respectively. Dashed lines define external brain boundaries and cortical layers. The schemas collapse lineages spanning across several sections into a single diagram. (d) Quantification of the number of PCs per lineage in P21 Neurod6Cre/+ mice infected with conditional reporter retroviruses at different embryonic stages. Lineages smaller than three cells were excluded. Boxes show median and inter-quartile distance, whiskers correspond to minimum and maximum values. Colored dots show individual clonal size values. (e) Quantification of the fraction of cortical lineages containing one, two or three or more neurons in P21 Neurod6Cre/+ mice infected with conditional reporter retroviruses at different embryonic stages. n = 13 lineages in three animals at E9.5; 21 lineages in three animals at E10.5; 64 lineages in five animals at E11.5; 166 lineages in seven animals at E12.5; 32 lineages in four animals at E14.5. I–VI, cortical layers I to VI; H, hippocampus area; M1, primary motor cortex; RSD, retrosplenial cortex; S1, primary somatosensory cortex. Scale bars equal 100 µm (c) and 300 µm (c’ and c”). Data used for quantitative analyses as well as the numerical data that are represented in graphs are available in Figure 1—source data 1 and Figure 1—source data 2. See also Figure 1—figure supplement 1.
-
Figure 1—source data 1
E9.5-E14.5 Neurod6Cre/+ retroviral lineages analyzed at P21.
- https://cdn.elifesciences.org/articles/51381/elife-51381-fig1-data1-v2.xlsx
-
Figure 1—source data 2
Summary of numerical data that are represented in graphs.
- https://cdn.elifesciences.org/articles/51381/elife-51381-fig1-data2-v2.xlsx
Figure 1—figure supplement 1
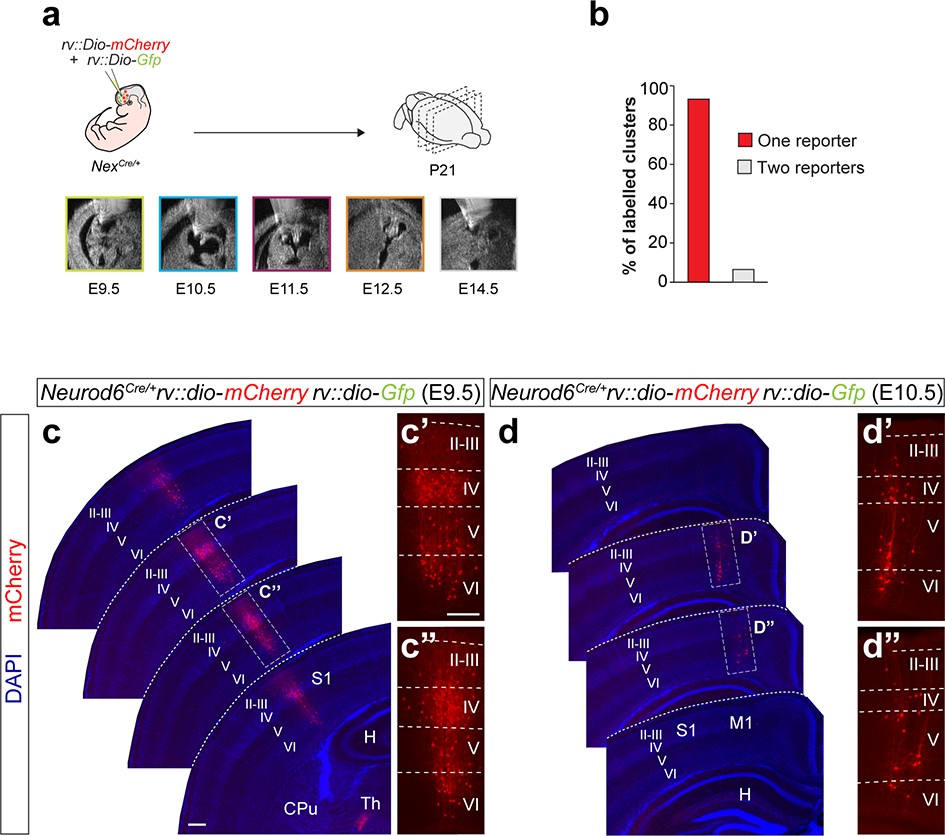
Sparse labeling of neuronal clones with low-titer retroviral infection.
(a) Experimental paradigm. (b) Fraction of neuron clusters containing cells labeled with one or two reporters. (c,d) Serial 100 μm coronal sections through the telencephalon of P21 Neurod6Cre/+ mice infected with low-titer conditional reporter retroviruses at E9.5 (c) and E10.5 (d). Example images illustrating each lineage correspond to sequential sections of the same brain. The high-magnification pictures shown in (c’ and c”) and (d’ and d”) correspond to the clones shown in (c) and (d), respectively. n = 296 lineages in 19 animals across all ages. Scale bars equal 100 µm (c and d) and 300 µm (c’, c”, d’ and d”). Data used for quantitative analyses as well as the numerical data that are represented in graphs are available in Figure 1—source data 1 and Figure 1—source data 2.
Figure 2 with 1 supplement
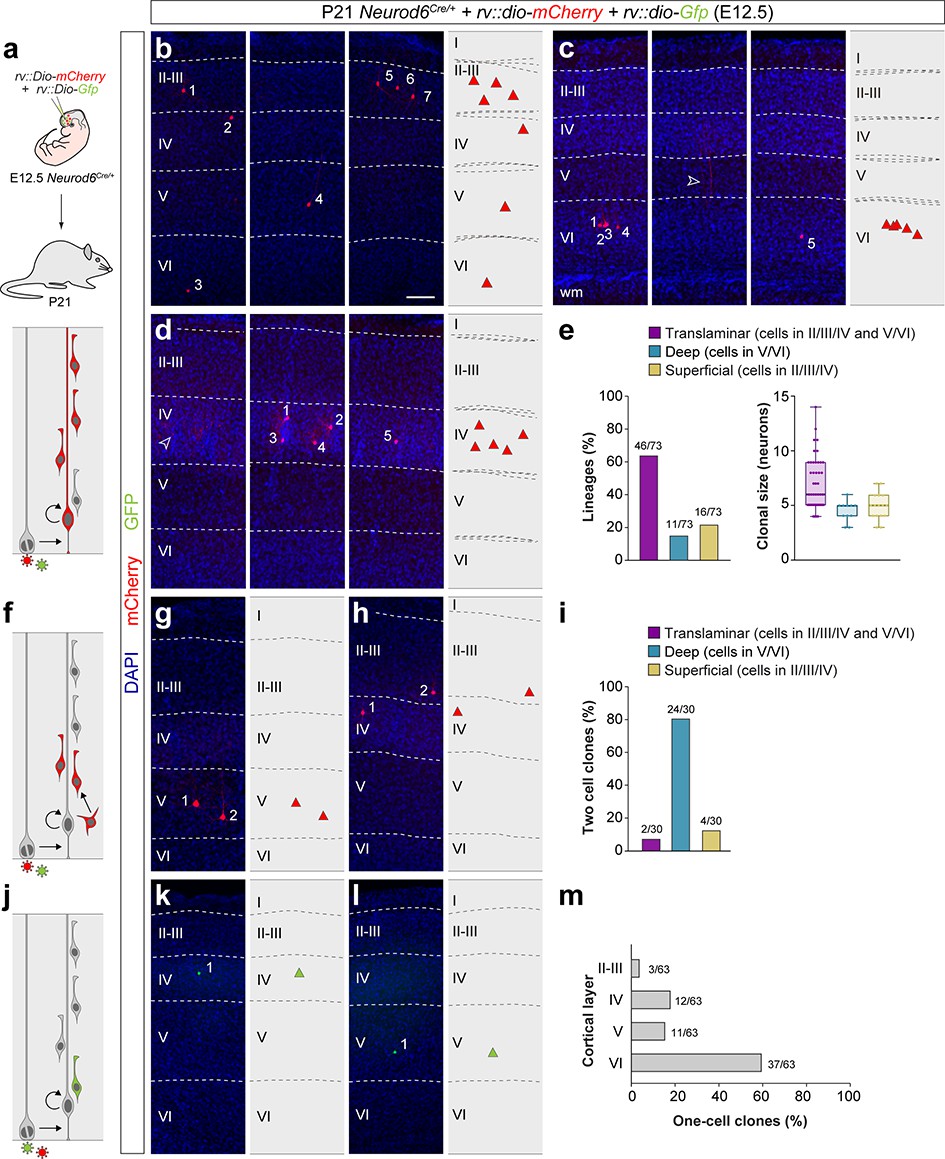
Retroviral-based lineage tracing reveals diverse lineage outcomes.
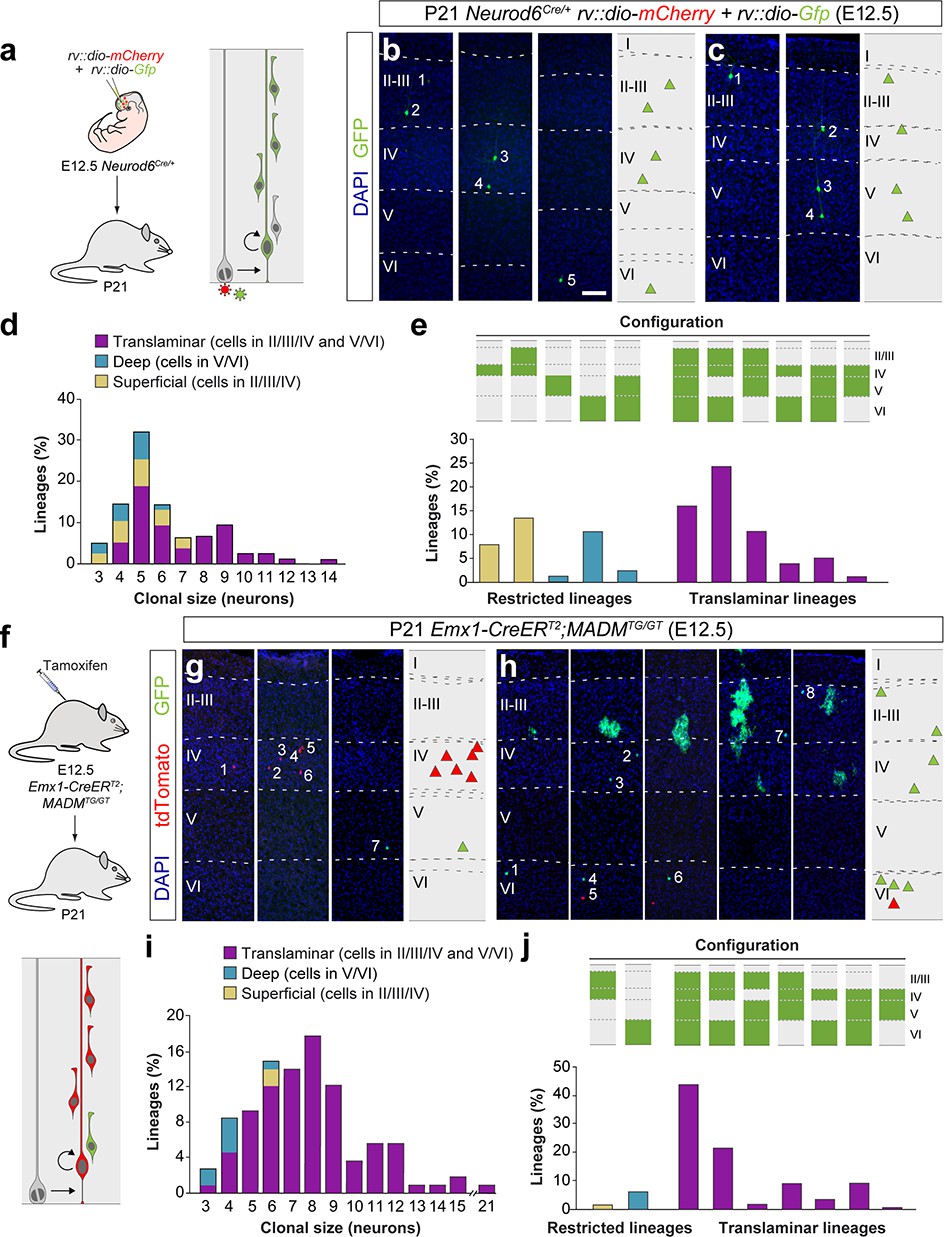
(a) Experimental paradigm. The bottom panel illustrates the expected labeling outcome following retroviral infection of an RGC undergoing a neurogenic cell division in which the viral integration occurs in the self-renewing RGC. (b–d) Serial 100 μm coronal sections through the cortex of P21 Neurod6Cre/+ mice infected with low-titer conditional reporter retroviruses at E12.5. The images show examples of translaminar (b), deep-layer restricted (c) and superficial-layer restricted (d) lineages containing three or more cells. Dashed lines define external brain boundaries and cortical layers. The schemas collapse lineages spanning across several sections into a single diagram. Example images illustrating each lineage correspond to sequential sections of the same brain. (e) Quantification of the fraction of translaminar, deep- and superficial-layer restricted lineages containing three or more cells, and clonal size. Boxes show median and inter-quartile distance, whiskers correspond to minimum and maximum values. Colored dots show individual clonal size values. (f) Expected labeling outcome following retroviral infection of an RGC undergoing a neurogenic cell division in which the viral integration occurs in an IPC (indirect neurogenesis). (g,h) Coronal sections through the cortex of P21 Neurod6Cre/+ mice infected with low-titer conditional reporter retroviruses at E12.5. The images show examples of superficial and deep layer-restricted two-cell clones. (i) Quantification of the fraction of translaminar, deep and superficial layer-restricted two-cell lineages. (j) Expected labeling outcome following retroviral infection of an RGC undergoing a neurogenic cell division in which the viral integration occurs in a postmitotic neuron (direct neurogenesis). (k,l) Coronal sections through the cortex of P21 Neurod6Cre/+mice infected with low-titer conditional reporter retroviruses at E12.5. The images show examples of superficial and deep layer-restricted single-cell clones. (m) Laminar distribution of single-cell clones. n = 166 lineages in seven animals. Scale bar equals 100 µm. Data used for quantitative analyses as well as the numerical data that are represented in graphs are available in Figure 2—source data 1 and Figure 1—source data 2. See also Figure 2—figure supplement 1.
-
Figure 2—source data 1
E12.5 Neurod6Cre/+ retroviral lineages analyzed at P21.
- https://cdn.elifesciences.org/articles/51381/elife-51381-fig2-data1-v2.xlsx
Figure 2—figure supplement 1
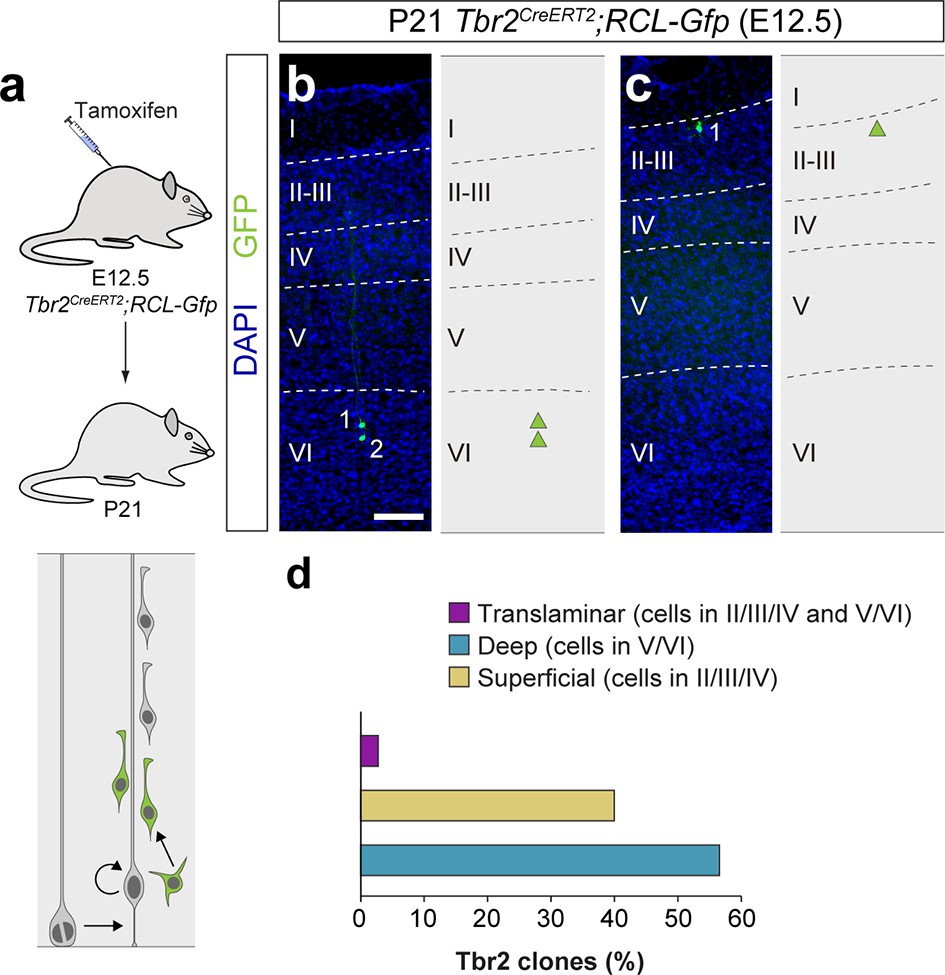
Lineage tracing of Tbr2+ intermediate progenitor cells.
(a) Experimental paradigm. The bottom panel illustrates the expected labeling outcome of the division of a Tbr2+ intermediate progenitor cell. (b,c) 100 μm coronal sections through the cortex of P21 Tbr2CreERT2/+;RCL-Gfp mice treated with low-dose tamoxifen at E12.5. The images show examples of deep and superficial layer-restricted Tbr2-derived lineages. The schemas collapse lineages spanning across several sections into a single diagram. (d) Laminar fraction of translaminar, deep and superficial layer-restricted Tbr2-derived lineages. n = 72 lineages in 12 animals. Scale bar equals 100 µm. Data used for quantitative analyses as well as the numerical data that are represented in graphs are available in Figure 2—figure supplement 1—source data 1 and Figure 1—source data 2.
-
Figure 2—figure supplement 1—source data 1
E12.5 Tbr2CreERT2/+;RCL-Gfp lineages analyzed at P21.
- https://cdn.elifesciences.org/articles/51381/elife-51381-fig2-figsupp1-data1-v2.xlsx
Figure 3 with 1 supplement

Lineage tracing using MADM identifies a small fraction of deep layer-restricted cortical lineages.
(a) Experimental paradigm. The bottom panel illustrates the expected labeling outcome of a neurogenic RGC division following inducible MADM-based lineage tracing in which two subclones are labeled with different reporters. (b,c) Serial 100 µm coronal sections through the cortex of P21 Emx1-CreERT2;MADMTG/GT mice treated with tamoxifen at E12.5. The images show examples of translaminar (b) and deep layer-restricted (c) lineages. The schemas collapse lineages spanning across several sections into a single diagram. Example images illustrating each lineage correspond to sequential sections of the same brain. (d) Quantification of the fraction of translaminar, deep and superficial layer-restricted lineages, and clonal size in MADM lineages derived from a neurogenic (asymmetric) RGC division. Boxes show median and inter-quartile distance, whiskers correspond to minimum and maximum values. Colored dots show individual clonal size values. n = 106 neurogenic lineages in 28 animals. Scale bar equals 100 µm. Data used for quantitative analyses as well as the numerical data that are represented in graphs are available in Figure 3—source data 1 and Figure 1—source data 2. See also Figure 3—figure supplement 1.
-
Figure 3—source data 1
E12.5 Emx1-CreERT2;MADMTG/GT lineages analyzed at P21.
- https://cdn.elifesciences.org/articles/51381/elife-51381-fig3-data1-v2.xlsx
Figure 3—figure supplement 1
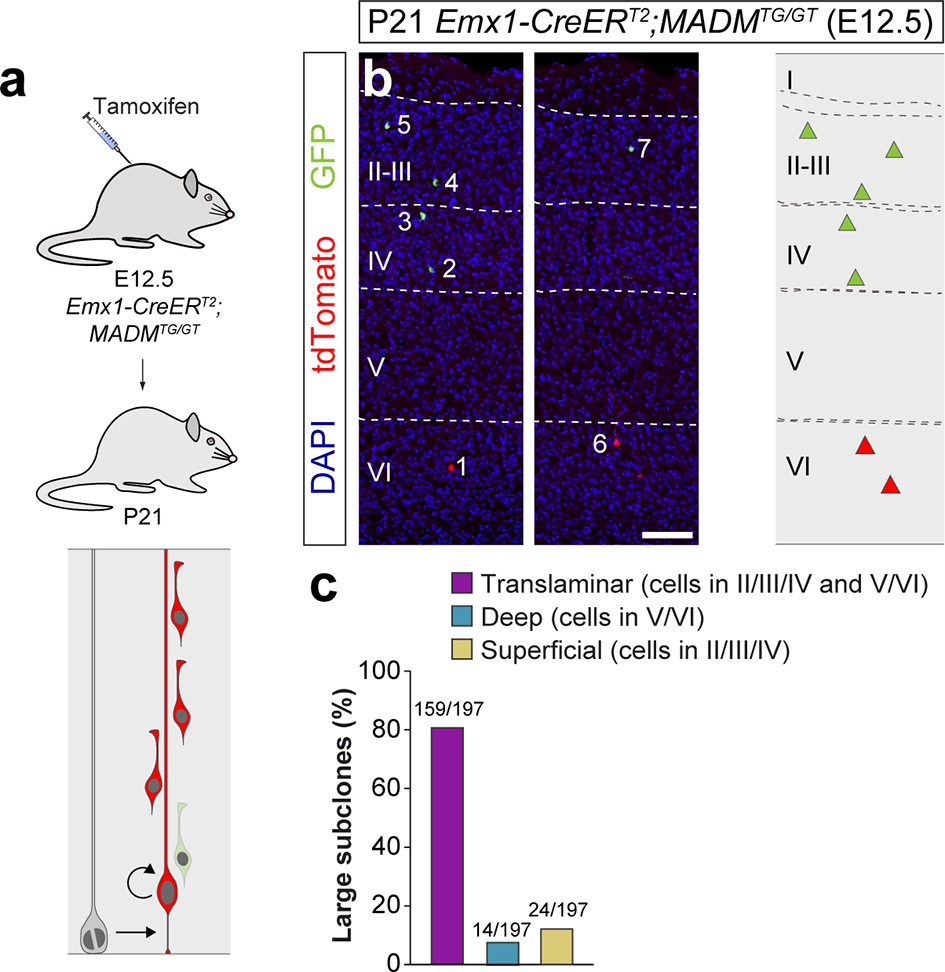
Large MADM subclones reveal a small fraction of artifactual superficial layer-restricted lineages in the retroviral experiments.
(a) Experimental paradigm. The bottom panel illustrates the expected labeling outcome of a neurogenic RGC division following inducible MADM-based lineage tracing in which two subclones are labeled with different reporters. (b) Serial 100 μm coronal sections through the cortex of a P21 Emx1-CreERT2;MADMTG/GT mouse treated with tamoxifen at E12.5. The images show an example of a translaminar lineage containing a large superficial layer-restricted sub-clone. The schemas collapse lineages spanning across several sections into a single diagram. Example images correspond to sequential sections of the same brain. (c) Relative fraction of translaminar, deep and superficial layer restricted MADM large sub-clones. n = 196 sub-lineages in 28 animals. Scale bar equals 100 µm. Data used for quantitative analyses as well as the numerical data that are represented in graphs are available in Figure 3—source data 1 and Figure 1—source data 2.
Figure 4 with 1 supplement
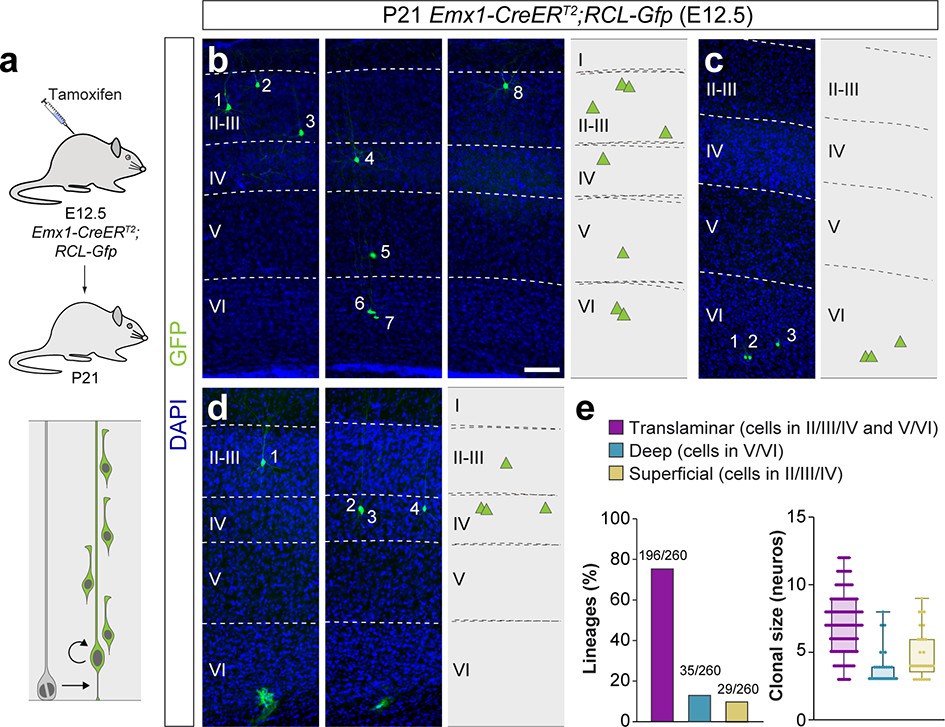
A fraction of early-quiescent cortical progenitors generates superficial layer-restricted lineages.
(a) Experimental paradigm. The bottom panel illustrates the expected labeling outcome of a neurogenic RGC division following inducible conditional reporter lineage tracing in Emx1-CreERT2;RCL-Gfp mice. (b–d) Serial 100 μm coronal sections through the cortex of P21 Emx1-CreERT2;RCL-Gfp mice treated with low-dose tamoxifen at E12.5. The images show examples of translaminar (b), deep layer-restricted (c) and superficial layer-restricted (d) lineages. The schemas collapse lineages spanning across several sections in a single diagram. Example images illustrating each lineage correspond to sequential sections of the same brain. (e) Quantification of the fraction of translaminar, deep and superficial layer-restricted lineages, and clonal size in inducible conditional reporter lineage-tracing experiments. Boxes show median and inter-quartile distance, whiskers correspond to minimum and maximum values. Colored dots show individual clonal size values. n = 260 neurogenic lineages in 25 animals. Scale bar equals 100 µm. Data used for quantitative analyses as well as the numerical data that are represented in graphs are available in Figure 4—source data 1 and Figure 1—source data 2. See also Figure 4—figure supplement 1.
-
Figure 4—source data 1
E12.5 Emx1-CreERT2;RCL-Gfp lineages analyzed at P21.
- https://cdn.elifesciences.org/articles/51381/elife-51381-fig4-data1-v2.xlsx
Figure 4—figure supplement 1
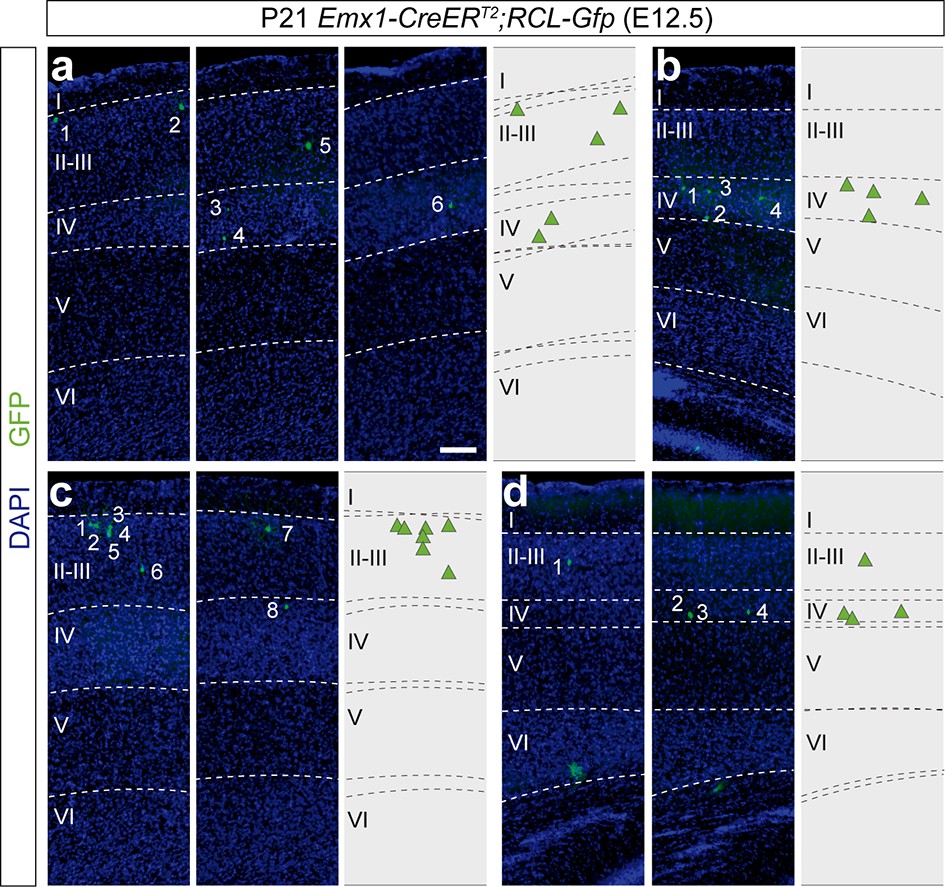
Superficial layer-restricted lineages in the murine cerebral cortex.
(a–d) Serial 100 µm coronal sections through the cortex of P21 Emx1-CreERT2; RCL-Gfp mice treated with tamoxifen at E12.5. The images show examples of superficial lineages. The schemas collapse lineages spanning across several sections into a single diagram. Example images illustrating each lineage correspond to sequential sections of the same brain. Scale bar equals 150 µm.
Figure 5 with 3 supplements
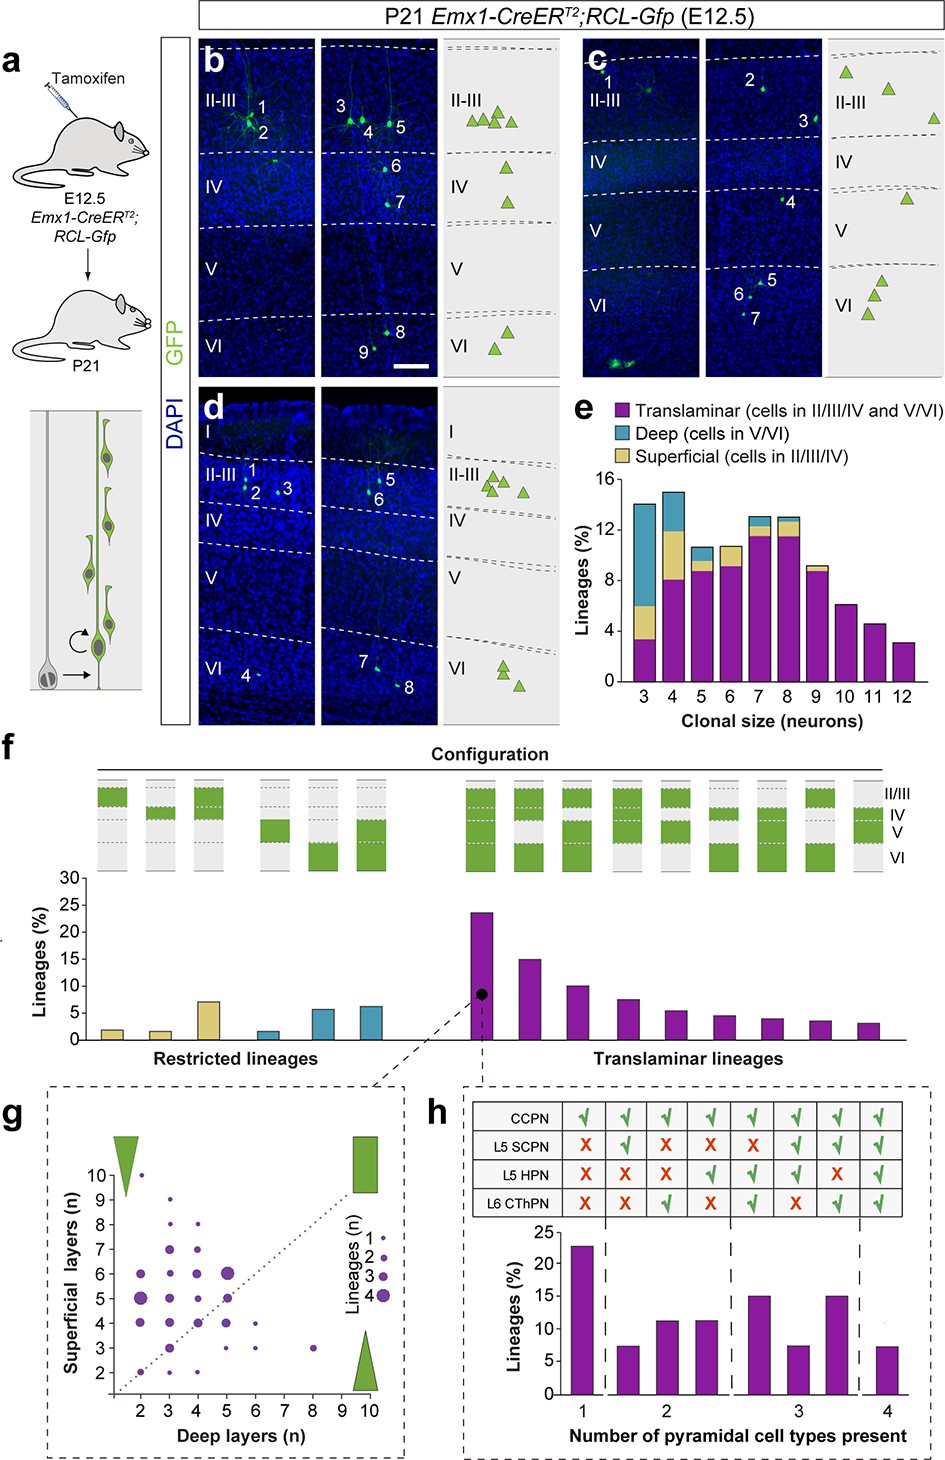
Translaminar lineages adopt very heterogeneous configurations.
(a) Experimental paradigm. The bottom panel illustrates the expected labeling outcome of a neurogenic RGC division following inducible conditional reporter lineage tracing in Emx1-CreERT2;RCL-Gfp mice. (b–d) Serial 100 µm coronal sections through the cortex of P21 Emx1-CreERT2;RCL-Gfp mice treated with low-dose tamoxifen at E12.5. The images show examples of translaminar lineages with various laminar configurations observed in the somatosensory (b and c) and visual cortex (d).The schemas collapse lineages spanning across several sections into a single diagram. Example images illustrating each lineage correspond to sequential sections of the same brain. (e) Clonal size distribution of translaminar, deep and superficial layer-restricted lineages. (f) Relative frequency (expressed as percentage over the total number of lineages) of the different laminar configurations (green and gray schemas) in inducible conditional reporter lineage tracing experiments. (g) Relative abundance of PCs in superficial and deep layers from translaminar lineages containing cells in every layer. Lineages are represented as circles in a bi-dimensional space, indicating the number of cells in superficial versus deep layers. The size of the circle indicates the number of lineages that shown a particular configuration. Green shapes schematically represent lineage configurations. A rectangular shape illustrates lineages with a balanced number of superficial and deep PCs; triangular shapes represent configurations of lineages biased towards superficial or deep layer neurons. (h) Fraction of translaminar lineages with neurons in every layer containing one, two, three or four subclasses of PCs. n = 260 neurogenic lineages in 25 animals. CCPN, cortico-cortical projection neuron; SCPN, subcortical projection neuron; HPN, heterogeneous projection neuron; CThPN, cortico-thalamic projection neuron. Scale bar equals 100 µm. Data used for quantitative analyses as well as the numerical data that are represented in graphs are available in Figure 4—source data 1, Figure 5—source data 1 and Figure 1—source data 2. See also Figure 5—figure supplements 1–3.
-
Figure 5—source data 1
Projection neuron markers in E12.5 Emx1-CreERT2;RCL-Gfp all-layer lineages analyzed at P21.
- https://cdn.elifesciences.org/articles/51381/elife-51381-fig5-data1-v2.xlsx
Figure 5—figure supplement 1
Retrovirus and MADM labeled lineages exhibit a diversity of laminar configurations.
(a) Experimental paradigm. The right panel illustrates the expected labeling outcome following retroviral infection of an RGC undergoing a neurogenic cell division in which the viral integration occurs in the self-renewing RGC. (b,c) Serial 100 μm coronal sections through the cortex of P21 Neurod6Cre/+ mice infected with low-titer conditional reporter retroviruses at E12.5. The images show examples of layer V (b) and layer VI (c) skipping lineages. Dashed lines define cortical layers. The schemas collapse lineages spanning across several sections into a single diagram. Example images illustrating each lineage correspond to sequential sections of the same brain. (d) Clonal size distribution of translaminar, deep and superficial layer-restricted lineages in retroviral experiments. (e) Relative frequency (expressed as percentage over the total number of lineages) of the different laminar configurations (green and gray schemas) in retroviral labeling experiments. (f) Experimental paradigm. The bottom panel illustrates the expected labeling outcome of a neurogenic RGC division following inducible MADM-based lineage tracing in which two subclones are labeled with different reporters. (g,h) Serial 100 μm coronal sections through the cortex of P21 Emx1-CreERT2;MADMTG/GT mice treated with tamoxifen at E12.5. The images show examples of layer IV and V restricted (g) and layer V skipping (h) lineages. The schemas collapse lineages spanning across several sections into a single diagram. Example images illustrating each lineage correspond to sequential sections of the same brain. (i) Clonal size distribution of translaminar, deep and superficial layer-restricted lineages in MADM experiments. (j) Relative frequency (expressed as percentage over the total number of lineages) of the different laminar configurations (green and gray schemas) in MADM experiments. n = 73 lineages in seven animals in retrovirus experiments (d and e); 106 neurogenic lineages in 28 animals in MADM experiments (I and j). Scale bar equals 100 µm. Data used for quantitative analyses as well as the numerical data that are represented in graphs are available in Figure 2—source data 1, Figure 3—source data 1 and Figure 1—source data 2.
Figure 5—figure supplement 2
Identification of pyramidal cell subclasses.
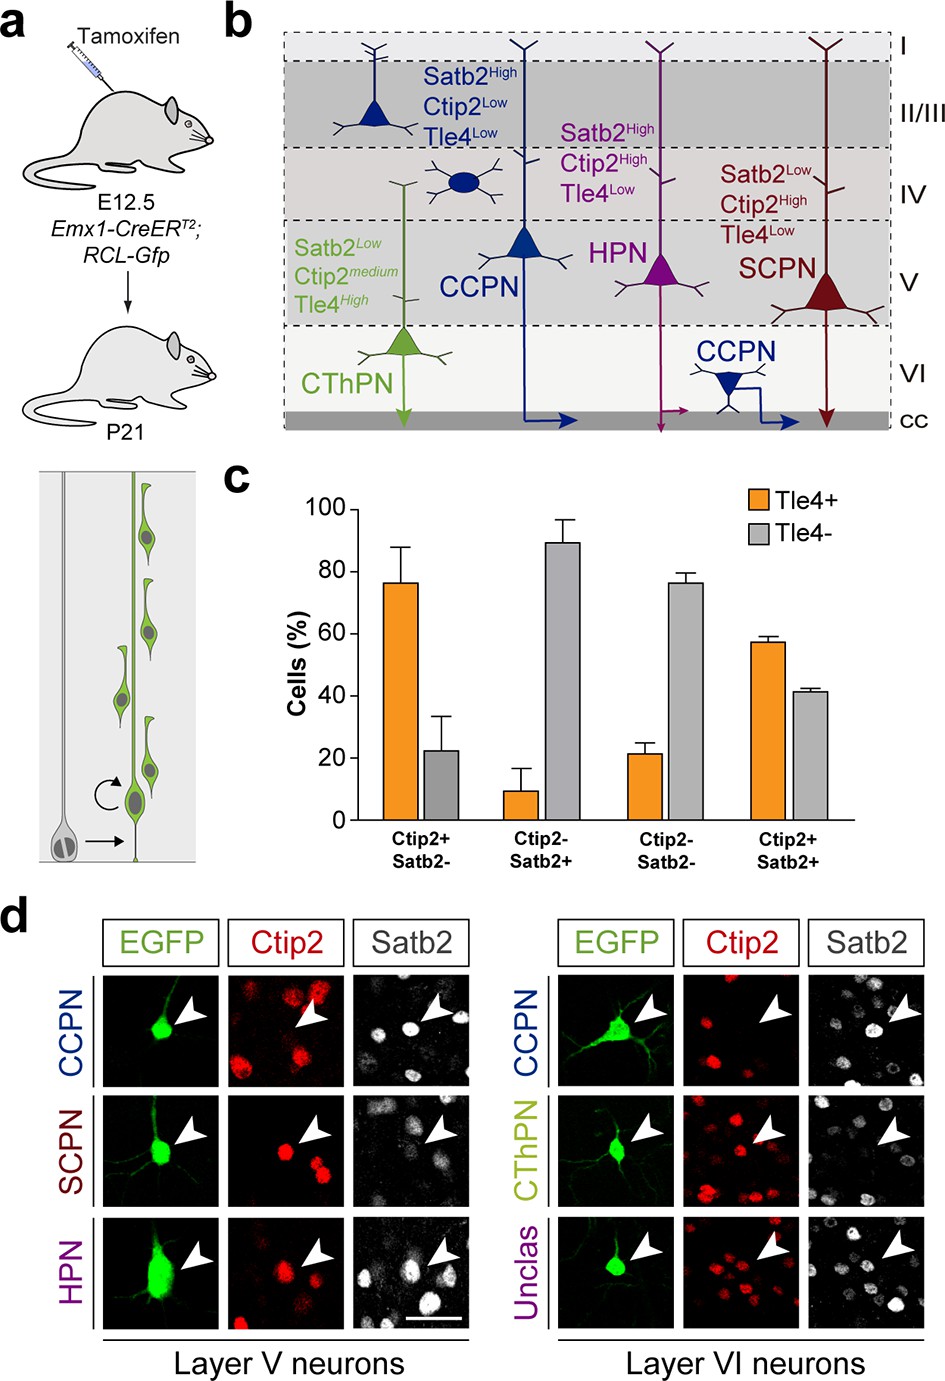
(a) Experimental paradigm. The bottom panel illustrates the expected labeling outcome of a neurogenic RGC division following inducible conditional reporter lineage tracing in Emx1-CreERT2;RCL-Gfp mice. (b) Schematic of PC subclasses based on their laminar distribution and expression of specific markers.(c), Fraction of Tle4+ and Tle4- layer VI PCs that express the transcription factors Satb2 and Ctip2. Data are represented as mean ± standard deviation. (d) Pyramidal cell subclasses in lineages traced in Emx1-CreERT2;RCL-Gfp mice. Neurons are classified according to their laminar allocation and expression of Satb2 and Ctip2. n = 1.123 cells in two brains. CCPN, cortico-cortical projection neuron; SCPN, subcortical projection neuron; HPN, heterogeneous projection neuron; CThPN, cortico-thalamic projection neuron. Scale bar equals 35 µm. Data used for quantitative analyses as well as the numerical data that are represented in graphs are available in Figure 5—figure supplement 2—source data 1 and Figure 1—source data 2.
-
Figure 5—figure supplement 2—source data 1
Projection neuron marker colocalization.
- https://cdn.elifesciences.org/articles/51381/elife-51381-fig5-figsupp2-data1-v2.xlsx
Figure 5—figure supplement 3
Subtle impact of pyramidal neuron cell death in final configurations of cortical neuron lineages.
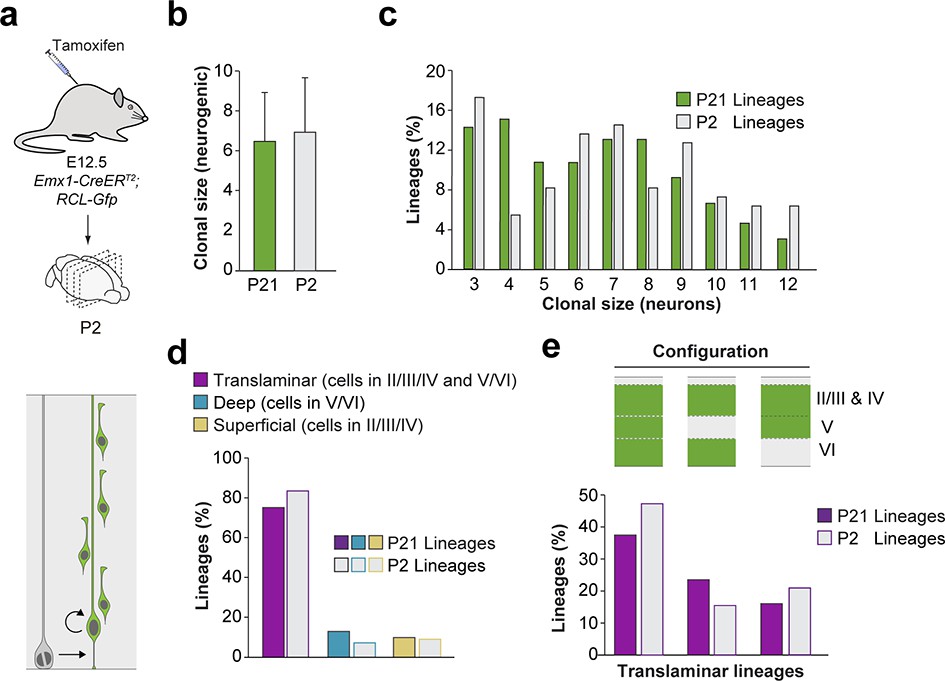
(a) Experimental paradigm. The bottom panel illustrates the expected labeling outcome of a neurogenic RGC division following inducible conditional reporter lineage tracing in Emx1-CreERT2;RCL-Gfp mice. (b) Clonal size of cortical lineages at P2 and P21 following low-dose tamoxifen in Emx1-CreERT2;RCL-Gfp mice at E12.5. Data are represented as mean ± standard deviation. (c) Clonal size distribution of cortical lineages at P2 and P21 in inducible conditional reporter lineage-tracing experiments. (d) Quantification of the fraction of translaminar, deep and superficial layer-restricted lineages at P2 and P21 in inducible conditional reporter lineage tracing experiments. (e) Relative frequency (expressed as percentage over the total number of lineages) of the different laminar configurations (green and gray schemas) in inducible conditional reporter lineage-tracing experiments at P2 and P21. At this age, layers II/II and IV cannot be reliably distinguished and are consequently considered as a single cortical layer. n = 110 neurogenic lineages in 11 animals. Data used for quantitative analyses as well as the numerical data that are represented in graphs are available in Figure 4—source data 1, Figure 5—figure supplement 3—source data 1 and Figure 1—source data 2.
-
Figure 5—figure supplement 3—source data 1
E12.5 Emx1-CreERT2;RCL-Gfp lineages analyzed at P2.
- https://cdn.elifesciences.org/articles/51381/elife-51381-fig5-figsupp3-data1-v2.xlsx
Figure 6 with 1 supplement

A stochastic model of cortical neurogenesis.
(a) Number of progenitor identities required to reproduce experimental lineage configurations inferred by Bayesian modeling. The y axis represents the fraction of simulations from a total of 4000 that demand a particular minimum number of progenitors. (b) Fraction of cells in each cortical layer (expressed as percentage of total) in experimental and modeled lineages. (c) Clonal size distribution in experimental and modeled lineages. (d) Spearman correlation (r) values for the fraction of superficial and deep layer neurons in modeled lineages. Each dot represents an r value for one simulation. The green line shows the experimental value; the shadow area around the experimental data represents a 95% confidence interval for the experimental value. (e) Fraction of translaminar, deep and superficial layer-restricted lineages found experimentally and predicted by the model (expressed as percentage of all modeled lineages within a single simulation). Gray boxes represent variability among 4000 simulations; colored stars and lines show experimental values and 95% confidence intervals for experimental values (p=0.036, Chi-square test). (f) Relative frequency (expressed as percentage over all modeled translaminar lineages within a single simulation) of laminar configurations in experimental and modeled translaminar lineages. Gray boxes represent variability among 4000 simulations; colored stars and lines show experimental values and 95% confidence intervals for experimental values (p=0.11, Chi-square test). Histograms represent mean ± standard deviation. Z-scores represent the distance between experimental and simulated results for each parameter, which is calculated as the difference between the averages of model and experimental data divided by the standard deviation within model simulations (see Materials and methods for details). n = 103 neurogenic lineages in the primary somatosensory cortex of 25 animals. Data used for quantitative analyses as well as the numerical data that are represented in graphs are available in Figure 4—source data 1 and Figure 1—source data 2. See also Figure 6—figure supplement 1.
Figure 6—figure supplement 1
Laminar densities of pyramidal neurons do not predict lineage structure.
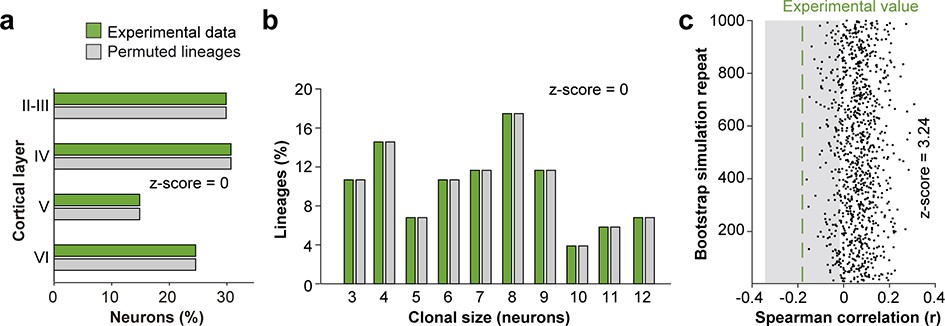
(a) Fraction of cells in each cortical layer (expressed as percentage of total) in experimental and permuted lineages. (b) Clonal size distribution in experimental and permuted lineages. (c) Spearman correlation (r) values for the fraction of superficial and deep layer neurons in permuted lineages. Each dot represents an r value for one simulation. The green line shows the experimental value; the shadow area around the experimental data represents a 95% confidence interval for the experimental value. Histograms represent mean ± standard deviation. Z-scores represent the distance between experimental and simulated results for each parameter, which is calculated as the difference between the averages of model and experimental data divided by the standard deviation within simulations (see Materials and methods for details). n = 103 neurogenic lineages in the primary somatosensory cortex of 25 animals. Data used for quantitative analyses as well as the numerical data that are represented in graphs are available in Figure 4—source data 1 and Figure 1—source data 2.
Figure 7 with 1 supplement
A small number of progenitor identities underlie lineage diversity.
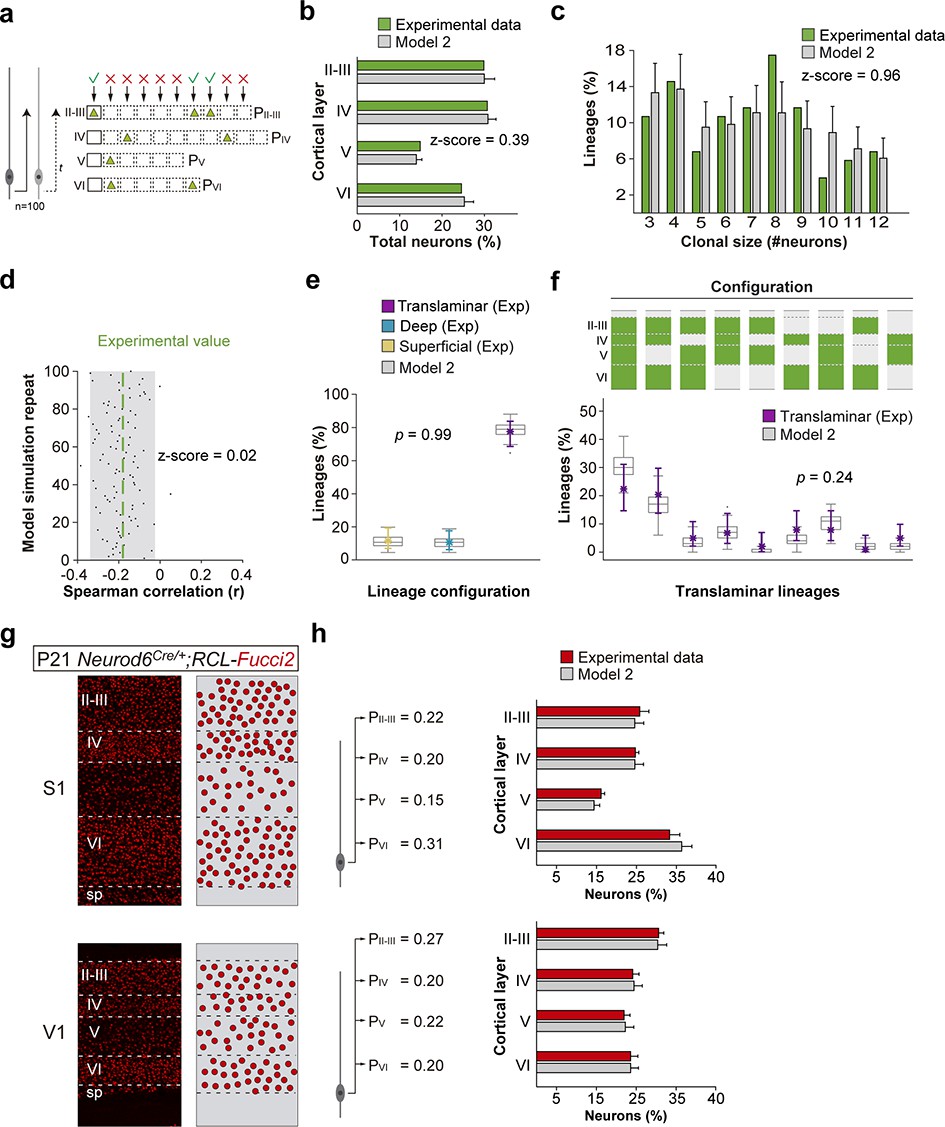
(a) Schematic representation of a mathematical model of cortical neurogenesis in which two different progenitor identities are modeled (Model 2). Squares represent the maximum number of stochastic decisions performed by each progenitor for each cortical layer during in silico simulations. The odds of generating neurons for each chance are given by a probability value (P), which is unique for each layer and progenitor identity. The model runs 100 simulations with 100 progenitors. (b) Fraction of cells in each cortical layer (expressed as percentage of total) in experimental and modeled lineages. (c) Clonal size distribution in experimental and modeled lineages. (d) Spearman correlation (r) values for the fraction of superficial and deep layer neurons in modeled lineages. Each dot represents an r value for one simulation. The green line shows the experimental value; the shadow area around the experimental data represents a 95% confidence interval for the experimental value. (e) Fraction of translaminar, deep and superficial layer-restricted lineages found experimentally and predicted by the model (expressed as percentage of all modeled lineages within a single simulation). Gray boxes represent variability among 100 simulations; colored stars and lines show experimental values and 95% confidence intervals for experimental values (p=0.99, Fisher’s exact test). (f) Relative frequency (expressed as percentage over all modeled translaminar lineages within a single simulation) of laminar configurations in experimental and modeled translaminar lineages. Gray boxes represent variability among 100 simulations; colored stars and lines show experimental values and 95% confidence intervals for experimental values (p=0.24, Chi-square test). (g) 60 µm coronal sections through the primary somatosensory (S1) and visual (V1) cortex of P21 Neurod6Cre/+;RCL-Fucci2 mice. The schemas on the right illustrate PC densities per layer. (h) Fraction of PCs per layer (expressed as percentage of total neurons) generated with two sets of laminar probability factors using Model two compared to the experimental data. Histograms represent mean ± standard deviation. Z-scores represent the distance between experimental and simulated results for each parameter, which is calculated as the difference between the averages of model and experimental data divided by the standard deviation within model simulations (see Materials and methods for details). n = 103 neurogenic lineages in the primary somatosensory cortex of 25 animals. Data used for quantitative analyses as well as the numerical data that are represented in graphs are available in Figure 4—source data 1, Figure 7—source data 1 and Figure 1—source data 2. The code for the generation of lineages can be found in Figure 7—source code 1. See also Figure 7—figure supplement 1.
-
Figure 7—source data 1
Laminar densities in Neurod6Cre/+;RCL-Fucci2 mice analyzed at P21.
- https://cdn.elifesciences.org/articles/51381/elife-51381-fig7-data1-v2.xlsx
-
Figure 7—source code 1
Lineage generation simulator.
- https://cdn.elifesciences.org/articles/51381/elife-51381-fig7-code1-v2.m
Figure 7—figure supplement 1
Stochastic models considering single and multiple programs corroborate Bayesian inference.
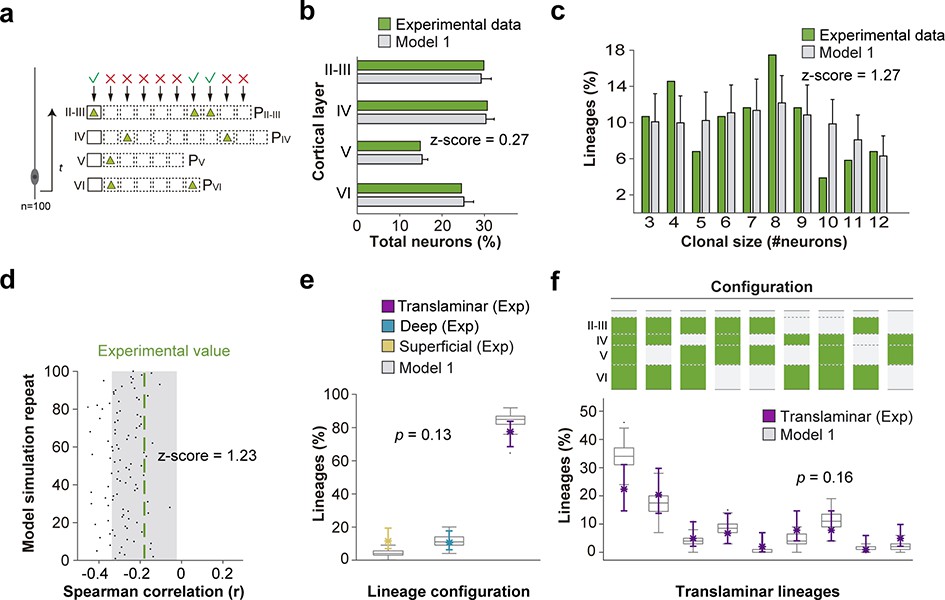
(a) Schematic representation of a mathematical model of cortical neurogenesis in which a unique progenitor identity is modeled (Model 1). Squares represent the maximum number of stochastic decisions performed by each progenitor for each cortical layer during in silico simulations. The odds of generating neurons for each chance are given by a probability value (P), which is unique for each layer and progenitor identity. The model runs 100 simulations with 100 progenitors. (b) Fraction of cells in each cortical layer (expressed as percentage of total) in experimental and modeled lineages. (c) Clonal size distribution in experimental and modeled lineages. (d) Spearman correlation (r) values for the fraction of superficial and deep layer neurons in modeled lineages. Each dot represents an r value for one simulation. The green line shows the experimental value; the shadow area around the experimental data represents a 95% confidence interval for the experimental value. (e) Fraction of translaminar, deep and superficial layer-restricted lineages found experimentally and predicted by the model (expressed as percentage of all modeled lineages within a single simulation). Gray boxes represent variability among 100 simulations; colored stars and lines show experimental values and 95% confidence intervals for experimental values (p=0.13, Fisher’s exact test). (f) Relative frequency (expressed as percentage over all modeled translaminar lineages within a single simulation) of laminar configurations in experimental and modeled translaminar lineages. Gray boxes represent variability among 100 simulations; colored stars and lines show experimental values and 95% confidence intervals for experimental values (p=0.16, Chi-square test). Histograms represent mean ± standard deviation. Z-scores represent the distance between experimental and simulated results for each parameter, which is calculated as the difference between the averages of model and experimental data divided by the standard deviation within model simulations (see Materials and methods for details). n = 103 neurogenic lineages in the primary somatosensory cortex of 25 animals. Data used for quantitative analyses as well as the numerical data that are represented in graphs are available in Figure 4—source data 1 and Figure 1—source data 2.
Tables
Key resources table
| Reagent type (species) or resource | Designation | Source or reference | Identifiers | Additional information |
|---|---|---|---|---|
| Genetic reagent (M. musculus) | Neurod6Cre | PMID: 17146780 | RRID: MGI:4429427 | Dr Klaus Nave (MPI-EM) |
| Genetic reagent (M. musculus) | Emx1-CreERT2 | PMID: 16388308 Jackson laboratory | Stock: 027784 RRID: IMSR_JAX:027784 | |
| Genetic reagent (M. musculus) | Tbr2CreERT2 | PMID: 23897762 | RRID:MGI:5499789 | Dr Sebastian J Arnold (University of Freiburg) |
| Genetic reagent (M. musculus) | RCL-Gfp, RCE | PMID: 19363146 Jackson laboratory | Stock: 32037 RRID: MGI:4420759 | |
| Genetic reagent (M. musculus) | MADMTG | PMID: 21092859 Jackson laboratory | Stock: 013751 RRID:IMSR_JAX:013751 | |
| Genetic reagent (M. musculus) | MADMGT | PMID: 21092859 Jackson laboratory | Stock: 013749 RRID:IMSR_JAX:013749 | |
| Genetic reagent (M. musculus) | RCL-Fucci2a | PMID: 25486356 | RRID:IMSR_HAR:6899 | Dr Richard Mort (Lancaster University) |
| Cell line (Homo sapiens) | HEK293FT | Invitrogen | Cat: R700-07 RRID: CVCL_6911 | |
| Transfected construct (M. musculus) | rv::dio-eGFP | PMID: 23933753 Addgene | ID: 87662 | |
| Transfected construct (M. musculus) | rv::dio-mCherry | PMID: 23933753 Addgene | ID: 87664 | |
| Antibody | Anti-GFP (chicken polyclonal) | Aves Lab | Cat: GFP-1020 RRID: AB_10000240 | IF(1:2000) |
| Antibody | Anti-DsRed (rabbit polyclonal) | Clonetech | Cat: 632496 RRID: AB_10013483 | IF(1:500) |
| Antibody | Anti-mCherry (goat polyclonal) | Antibodies online | Cat: ABIN1440057 RRID: AB_11208222 | IF(1:500) |
| Antibody | Anti-Ctip2 (rat monoclonal) | Abcam | Cat: AB18465 RRID: AB_2064130 | IF(1:500) |
| Antibody | Anti-Satb2 (mouse monoclonal) | Abcam | Cat: AB51502 RRID: AB_882455 | IF(1:500) |
| Antibody | Anti-Satb2 (rabbit polyclonal) | Abcam | Cat: AB34735 RRID: AB_2301417 | IF(1:1000) |
| Antibody | Anti-Tle4 (goat polyclonal) | Gift from Dr Stefano Stifani (McGill University) | IF(1:200) | |
| Antibody | Anti-chicken IgY-Alexa fluor 488 (goat polyclonal) | TermoFisher | Cat: A-11039 RRID: AB_2534096 | IF(1:400) |
| Antibody | Anti-mouse IgG-Alexa fluor 647 (goat polyclonal) | TermoFisher | Cat: A-21240 RRID: AB_2535809 | IF(1:400) |
| Antibody | Anti-mouse IgG-biotinilated (Horse polyclonal) | Vector Labs | Cat: BA2000 RRID: AB_2313581 | IF(1:400) |
| Antibody | Anti-rat IgG-Alexa fluor 555 (goat polyclonal) | TermoFisher | Cat: A-21434 RRID: AB_2535855 | IF(1:400) |
| Antibody | Anti-goat IgG-Alexa fluor 555 (donkey polyclonal) | TermoFisher | Cat: A-21432 RRID: AB_2535853 | IF(1:400) |
| Antibody | Anti-rabbit IgG-Alexa fluor 488 (donkey polyclonal) | TermoFisher | Cat: A-21432 RRID: AB_2535853 | IF(1:400) |
| Chemical compound, drug | Tamoxifen | Sigma-Aldrich | Cat: 85256 | |
| Software, algorithm | Prism 8 | GraphPad | RRID: SCR_002798 | |
| Software, algorithm | MATLAB | Mathworks | RRID: SCR_001622 | |
| Software, algorithm | RStudio | RStudio | RRID: SCR_000432 | |
| Software, algorithm | Imaris 8 | Bitplane | RRID: SCR_007370 |
Additional files
Download links
A two-part list of links to download the article, or parts of the article, in various formats.
Downloads (link to download the article as PDF)
Open citations (links to open the citations from this article in various online reference manager services)
Cite this article (links to download the citations from this article in formats compatible with various reference manager tools)
A stochastic framework of neurogenesis underlies the assembly of neocortical cytoarchitecture
eLife 8:e51381.
https://doi.org/10.7554/eLife.51381


