MeCP2 nuclear dynamics in live neurons results from low and high affinity chromatin interactions
- Howard Hughes Medical Institute, The Rockefeller University, United States
- Howard Hughes Medical Institute, United States
- La Jolla Institute for Allergy and Immunology, United States
- Li Ka Shing Center for Biomedical and Health Sciences, CIRM Center of Excellence, University of California, Howard Hughes Medical Institute, United States
Figures
Figure 1 with 3 supplements

Analysis of single molecule kinetics reveals unique the slow diffusive behavior of MeCP2.
(A) Schematic representation of the experimental strategy used. Cerebellar granule cells (GC) from 6 to 8 day old pups were transfected with constructs expressing the HaloTag domain in frame to MeCP2 coding sequence, or other control proteins. For MeCP2 endogenous expression, 6–8 day old MeCP2-HaloTag knock-in pups were used for granule cell culture under the same experimental conditions. Single MeCP2 molecules were imaged in live GC cultures by (B) specifically labeling MeCP2-HaloTag proteins with JF549-HaloLigand, (C) photo-bleaching at high laser power to gain sparse labeling and single molecule images were recorded at 100 Hz. (D) Representative single molecule tracks obtained from live granule cells nuclei for the different proteins at 100 Hz. (E) Distribution of diffusion coefficients (D’, μm2/s) calculated for individual molecules assuming Brownian motion. H2b (~20,000 molecules, blue), NLS (~10,000 molecules, tourquise), Sox2 (~15,000 molecules, green), TBP (~8000 molecules, dark green), H1.0 (~50,000 molecules, orange), Exogenous MeCP2 (~20,000 molecules, red), and Endogenous MeCP2 (~28,000 molecules, orange). The curves were plot stacked on a joy plot and the origins of the y axis for each curve are displaced for clarity (F) Fraction (Left) of bound molecules and average diffusion coefficient (Right) of the unbound molecules calculated for individual cell by fitting the SpotOn 2-state model to the distribution of translocations for individual molecules of H2b (9 cells, blue), NLS (19 cells, turquoise), Sox2 (25 cells, green), TBP (16 cells, dark green), H1.0 (19 cells, orange), Exogenous MeCP2 (20 cells, red) and Endogenous MeCP2 (23 cells, orange). Graphs show mean and standard deviation of single cell value (gray dots) and compare Exogenous MeCP2 to each of other nuclear factors by one-way ANOVA with Bonferroni’s multiple comparison test: **** (p<0.0001), *(p<0.05,>0.01).
Figure 1—figure supplement 1
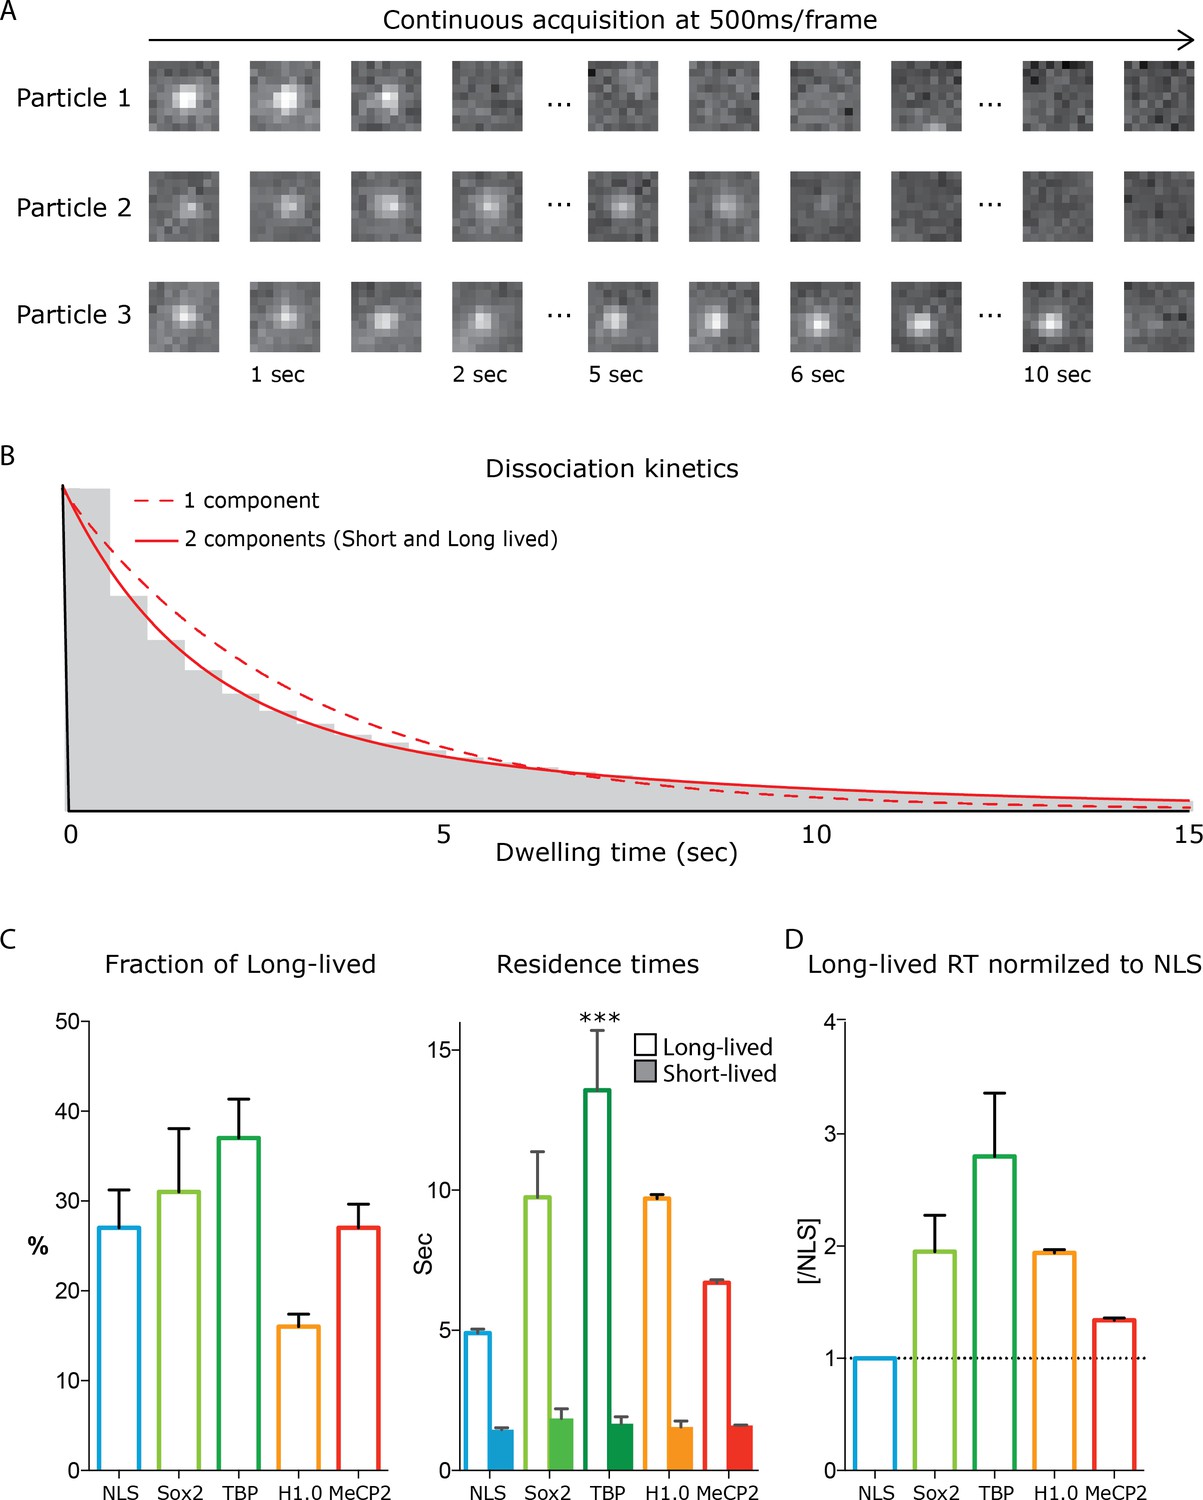
Dwell time analysis of stable single molecules MeCP2 in living neurons reveals highly dynamic interactions with chromatin.
Acquisition of stable single MeCP2 molecules in culture GC neurons is achieved by specific labelling MeCP2-HaloTag with JF549 haloligand, photobleached at high laser power to attain single molecule resolution and acquired continuously at low laser power every 0.5 s to selectively detect stable MeCP2 molecules. (A) 0.5 s/frame images of representative stable MeCP2 molecules. (B) Long and Short-lived resident times of stable molecules was determined by fitting a double exponential decay (two components) for their dwell time distribution. (C) The fraction of the molecules that display long-lived dwell times and the Resident Time (RT) of short and long-lived molecules were calculated for individual experiments. Granule cell cultures from wild type animals transfected with construct expressing NLS-HaloTag (turquoise), HaloTag-Sox2 (green), TBP-HaloTag (dark green) and H1.0 (orange) were used as control. Histograms display mean and standard deviation of individual experimental replicates and compare MeCP2 long-lived RT to other nuclear factors by one-way ANOVA with Bonferroni’s multiple comparison test: ** (p<0.005). (D) The long-lived RT for the different proteins normalized to NLS, used as a control protein that engages in no interactions with chromatin.
Figure 1—figure supplement 2
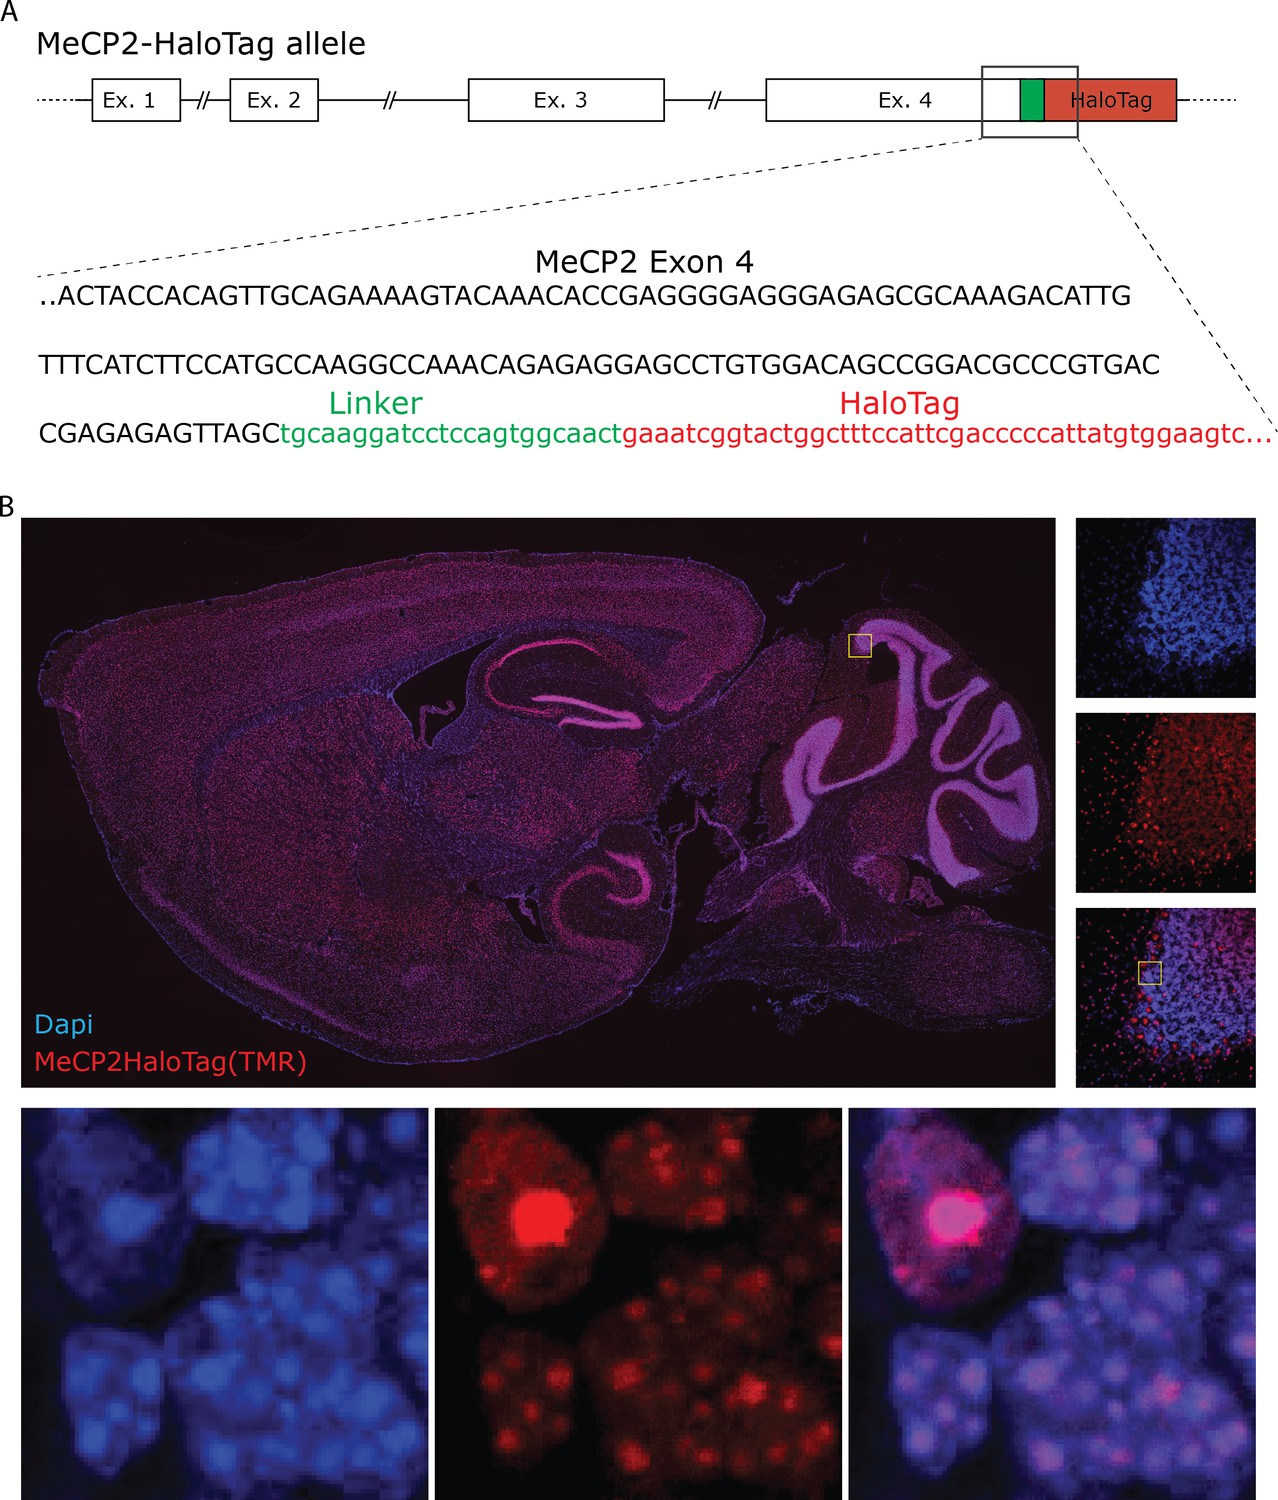
Generation of MeCP2-HaloTag knock-in animals.
(A) Genetic sequence encoding for HaloTag was inserted in frame at the 3’ of the last exon of Mecp2 gene to generate an allele that expresses a chimeric molecule with the HaloTag peptide linked to the C-terminus domain of MeCP2 endogenous protein. (B) A sagittal brain slice from MeCP2 HaloTag adult mouse stained with TMR Halo-Ligand. MeCP2-HaloTag recapitulates the expression pattern of MeCP2 in the brain and, at higher magnifications, its nuclear distribution.
Figure 1—figure supplement 3
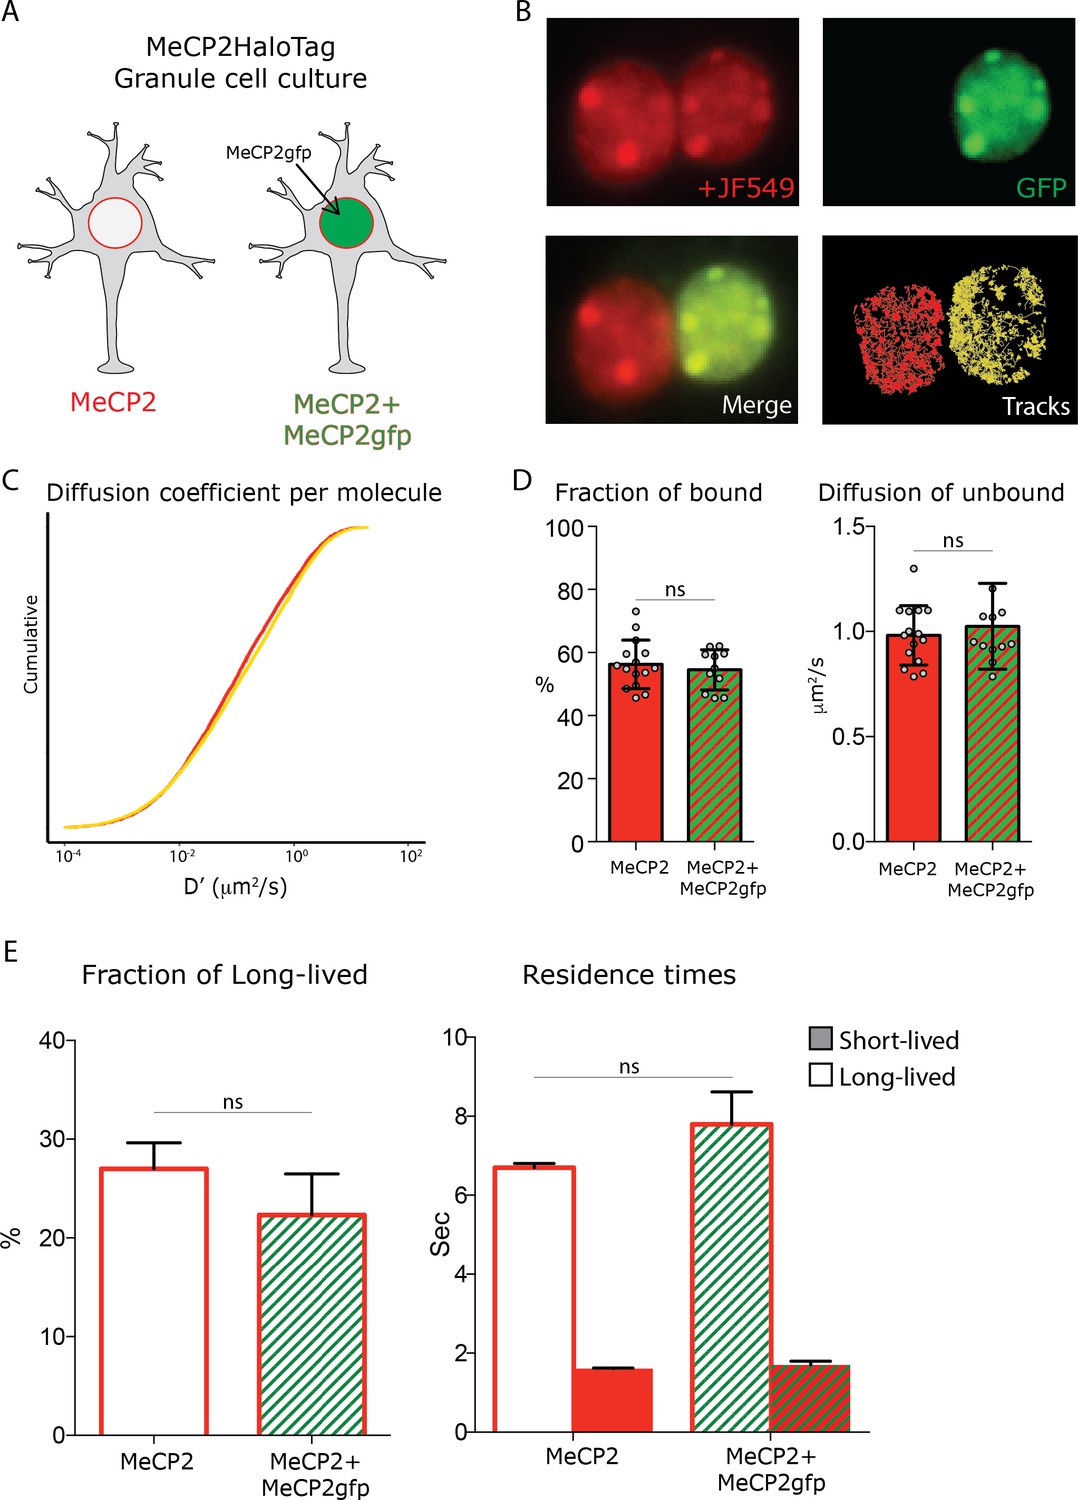
MeCP2 overexpression does not affect its nuclear kinetics.
A schematic representation of the experimental design. Granule cells from MeCP2-HaloTag animals transfected with a construct expressing MeCP2-GFP fusion protein were co-cultured with untransfected MeCP2-HaloTag Granule cells. (B) Representative images of cultured MeCP2-HaloTag Granule cell nuclei labeled with the Halo-ligand JF549 (red), where a fraction of the cells also express an exogenous MeCP2-GFP protein (green). Live single molecule tracks were recorded from the two co-cultured conditions in parallel. (C) Cumulative distribution of diffusion coefficient (D’, μm2/s) calculated for individual molecules of MeCP2-HaloTag in wild type Granule cells (~15,000 molecules, red) or co-cultured cells overexpressing MeCP2 (MeCP2+MeCP2gfp,~10,000 molecules, yellow). (D) Fraction of bound molecules and average diffusion coefficient of the unbound molecules calculated in each cell by SpotOn for endogenous MeCP2 in wild type cells (15 cells) and in co-cultured granule cells overexpressing MeCP2 (12 cells). Graphs show mean and standard deviation of single cell values (gray dots) and compare the two conditions by two-tailed unpaired t-test: ns (p>0.05) (E) Dwell time analysis was performed on the two conditions similarly to what is shown in Figure 1—figure supplement 2. The fraction of the molecules that display long-lived dwell time and the Resident Time (RT) of short and long-lived molecules were calculated for individual experiments and plotted as histograms displaying mean and standard deviation. Two-tailed unpaired t-test shows no significant changes between the two MeCP2 expression levels (ns, p>0.05).
Figure 2 with 1 supplement
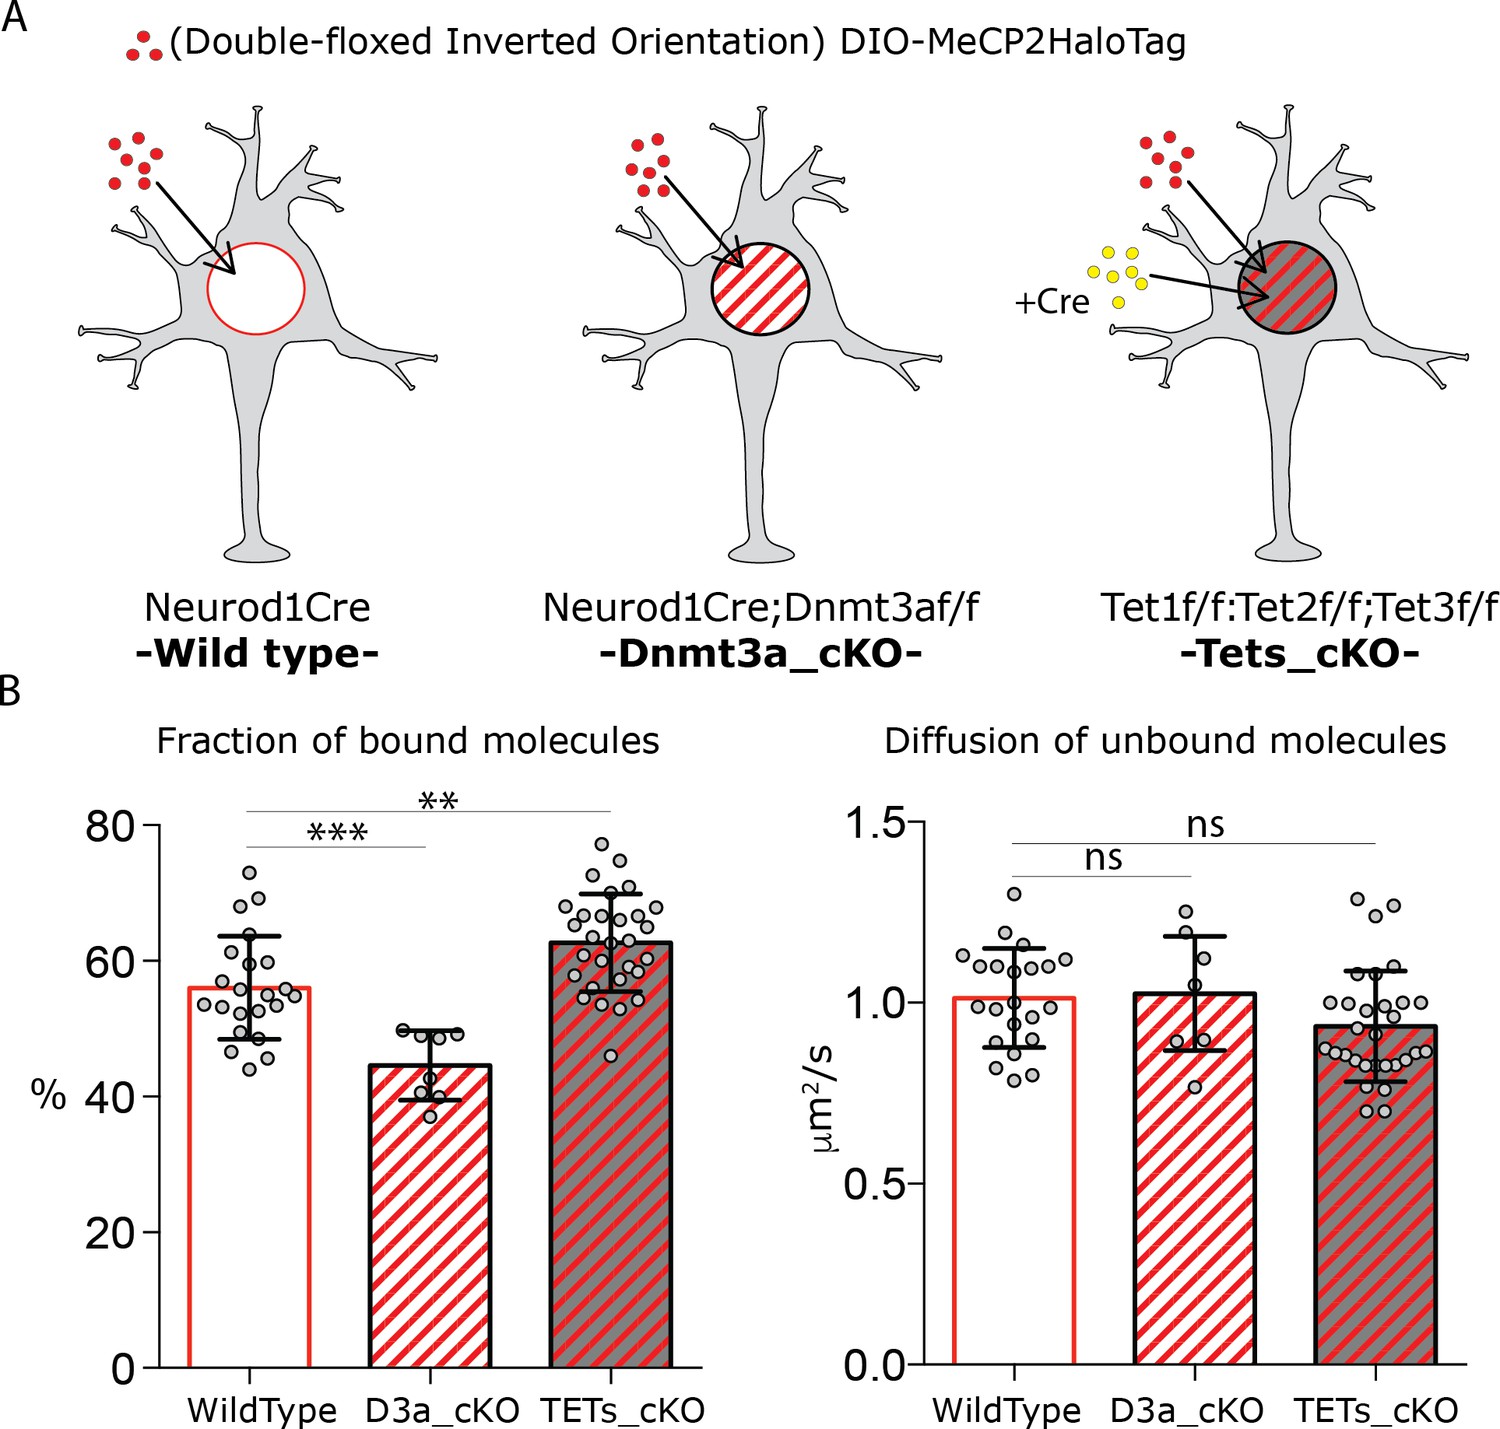
DNA modifications regulate MeCP2 binding without affecting its nuclear diffusion.
(A) Schematic representation of the experimental design. Cre-dependent expression vector carrying DIO-MeCP2-HaloTag was transfected in GC cultures from Neurod1-cre (wild type) or Neurod1-cre;Dnmt3aflox/flox (Dnmt3a_cKO) animals. Cre-expressing vector was co-transfected with DIO-MeCP2-HaloTag construct in GC culture from Tet1flox/flox;Tet2flox/flox; Tet3flox/flox animals (Tets_cKO (B) Fraction of bound molecules and diffusion coefficient of the unbound molecules calculated for individual cells by SpotOn in wild type (22 cells), Dnmt3a depleted (7 cells) and Tet1, 2 and 3 triple knock-out (29 cells) GCs. Graphs show mean and standard deviation of single cell values (gray dots) and compare wild type neurons to mutants by one-way ANOVA with Bonferroni’s multiple comparison test: ** (p<0.005); *** (p<0.0005).
Figure 2—figure supplement 1
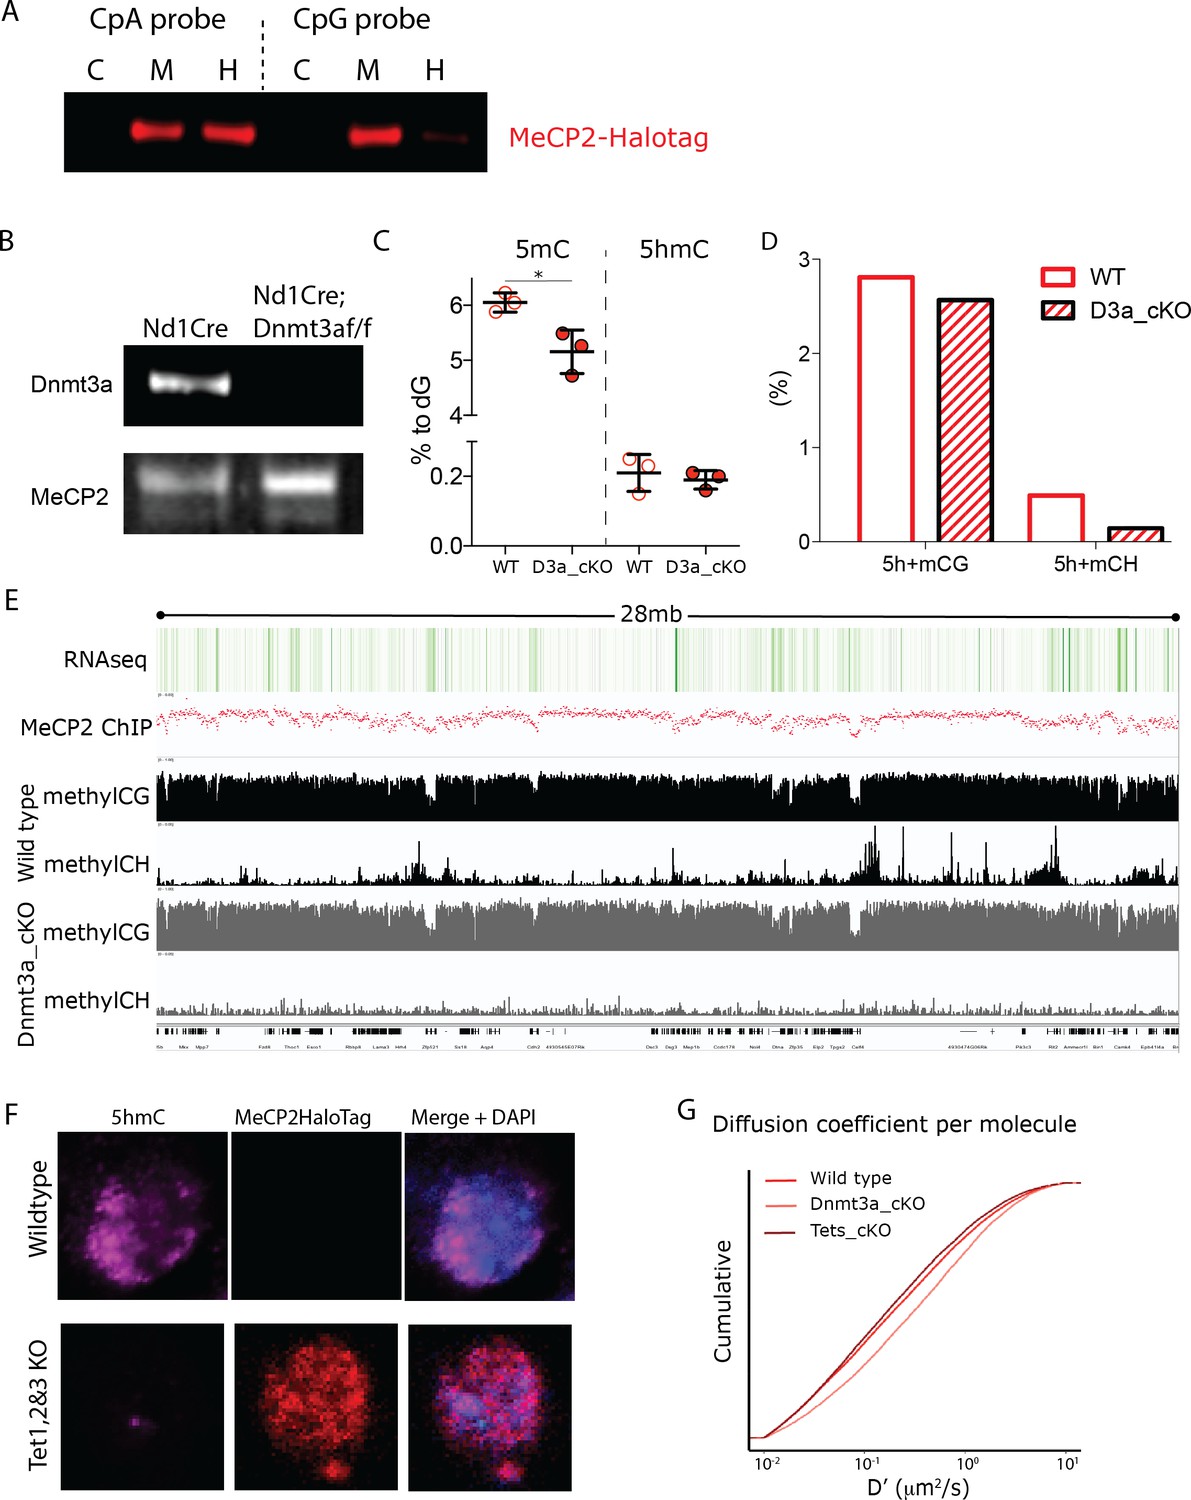
Cerebellar Granule cells lacking Dnmt3a or Tet1, Tet2 and Tet3 expression result in altered DNA methylations levels.
Dnmt3a-flox animals were crossed with Neurod1-cre animals to conditionally deplete Dnmt3a from cerebellar granule cells. (A) Western blot of MeCP2-HaloTag following DNA pull-down of whole protein nuclear extracts from transfected 293 cells. CpA and CpG synthetic DNA probes were designed to carry Cs only in CA or CG contexts, respectively. C, DNA probe is unmodified; M, 5mC in DNA probe; H, 5hmC in DNA probe. (B) Western blot for Dnmat3a of protein extraction from Granule cell nuclei isolated from adults (~3 months old) Neurod1-cre (Wild-type) or Neurod1-cre; Dnmt3aflox/flox Dnmt3a conditional Knockout). MeCP2 was used as a loading control. (C) Mass spectrometry analysis of genomic DNA from Granule cell nuclei isolated from adults (~3 months old) Nurod1-cre (WT) or Neurod1-cre;Dnmt3aflox/flox (D3a_cKO), where 5-methylCytosines (5mC) and 5hydroxyMethylaCytosines (5hmC) were quantified as proportion to Guanosines (% to dG). (D) Whole-genome bisulfite (WGB) sequence of genomic DNA was used to quantify the cytosine modifications (5-methyl-cytosine or 5-hydroxy-methyl-cytosine, 5h+m) in its different sequence context (CG or CH – where H = A, T or C-) in wild type (WT) or Dnmt3a depleted Granule cells (D3a_cKO). (E) A snapshot of the IGV viewer displaying RNA-seq and MeCP2 ChIP-seq in adult cerebellar Granule cells (top) and WGB-seq traces of CG and CH loci in Wild-type or Dnmt3a depleted granule cells (Dnmt3a_cKO). (F) Immunostaining for 5hmC in Tet1flox/flox;Tet2flox/flox; Tet3flox/flox GC culture co-transfected with Cre-expressing and DIO-MeCP2-HaloTag constructs. HaloTag positive cells (red) were successfully transfected with the Cre expressing construct and are therefore devoid of 5hmC (purple). (G) Cumulative distribution of diffusion coefficient (D’, μm2/s) calculated for individual molecules of MeCP2 in wild type (~25,000 molecules, solid red), Dnmt3a depleted (~12,000 molecules, light red) or lacking Tet1, 2 and 3 granule cells (~14,000 molecules, dark red).
Figure 3
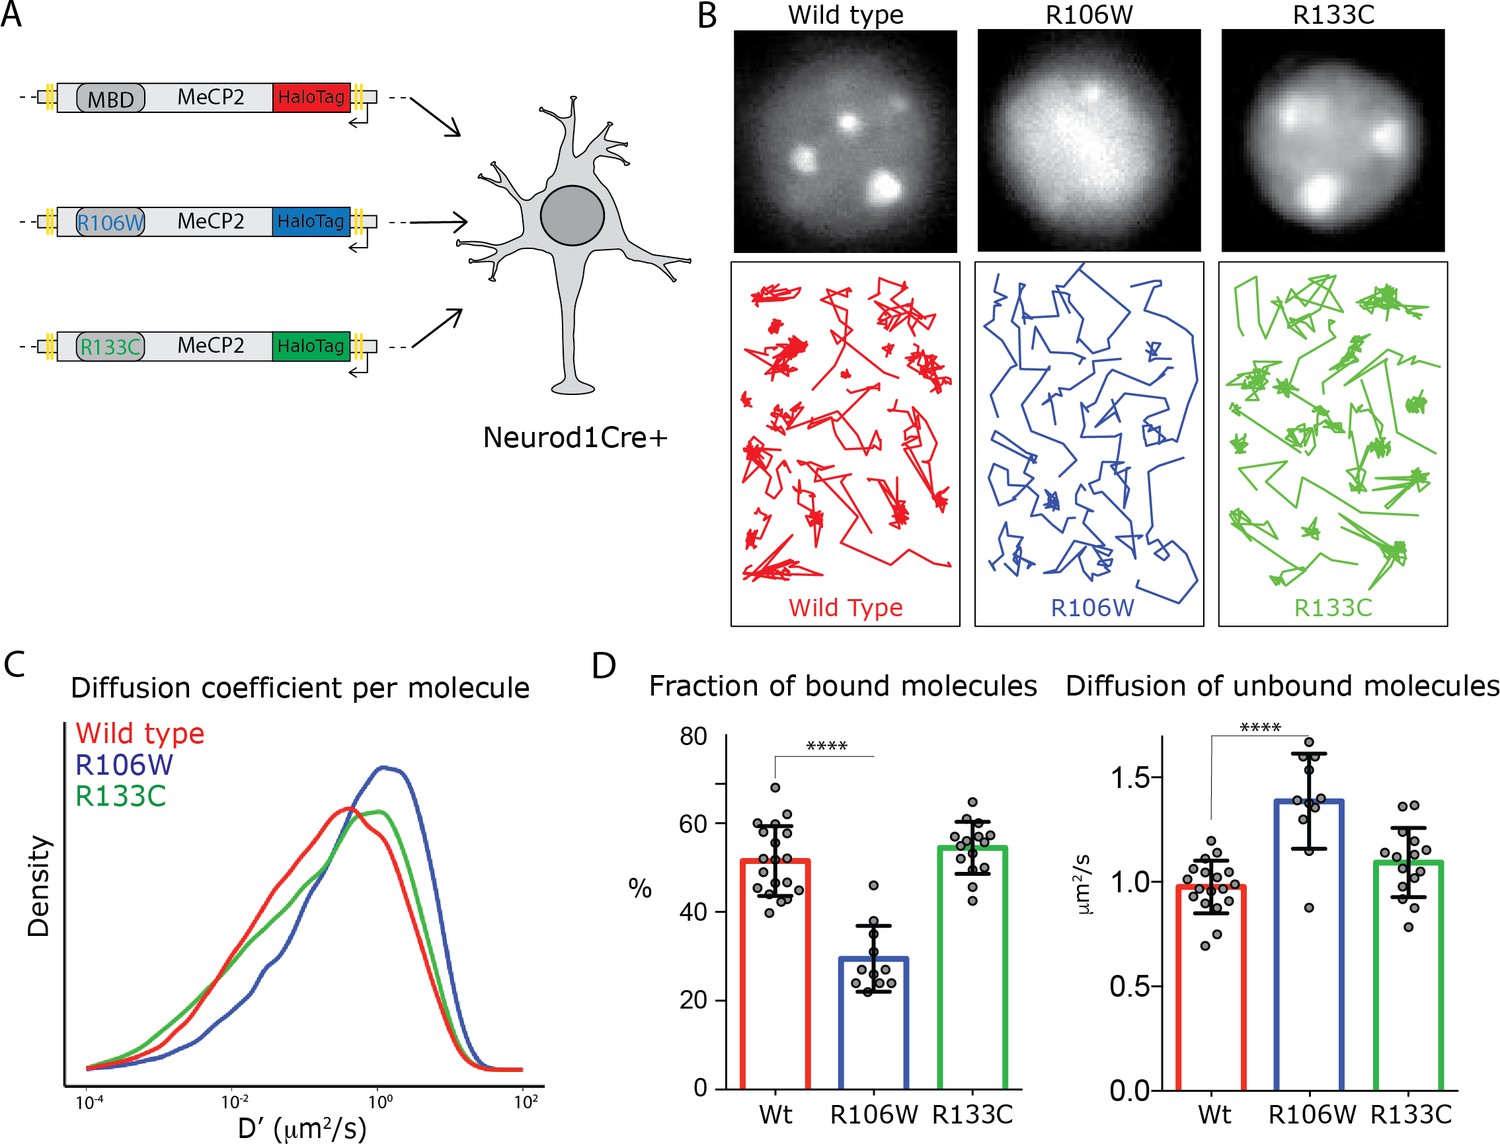
Rett-syndrome mutations within the MBD domain disrupt MeCP2 nuclear kinetics.
(A) Schematic representation of the experimental design. GC culture of Neurod1-cre animals were transfected with DIO constructs carrying wild type MeCP2-HaloTag (red) or bearing the Rett-syndrome mutations Arginine 133 to Cysteine (R133C, green) or Arginine 106 to Tryptophan (R106W, blue). (B) Cells labeled with JF549- HaloLigand show the nuclear distribution of wild type MeCP2HaloTag and its mutants (top panels). Representative single molecule tracks of wild type (red) R133C (green) and R106W (blue) in wild type granule cell nuclei. (C) Distribution of diffusion coefficients (D’, μm2/s) calculated for individual molecules of wild type MeCP2 (~18,000 molecules, red), R133C (~16,000 molecules, green) and R106W (~20,000 molecules, blue). Two-sample Kolmogorov-Smirnov test was used to compare wild type MeCP2 with R106W (p-value<9.7e−70) and R133C molecules (p-value=9.7e−29). (D) Fraction of bound molecules and average diffusion coefficient of the unbound molecules calculated in individual cells for wild type MeCP2 (5 cells, red), R1033C (19 cells, green) and R106W (20 cells, blue). Graphs show mean and standard deviation of single cell values (gray dots) and compare wild type MeCP2 to Rett-syndrome mutants by one-way ANOVA with Bonferroni’s multiple comparison test: * (p<0.05), **** (p<0.0001).
Figure 4 with 1 supplement
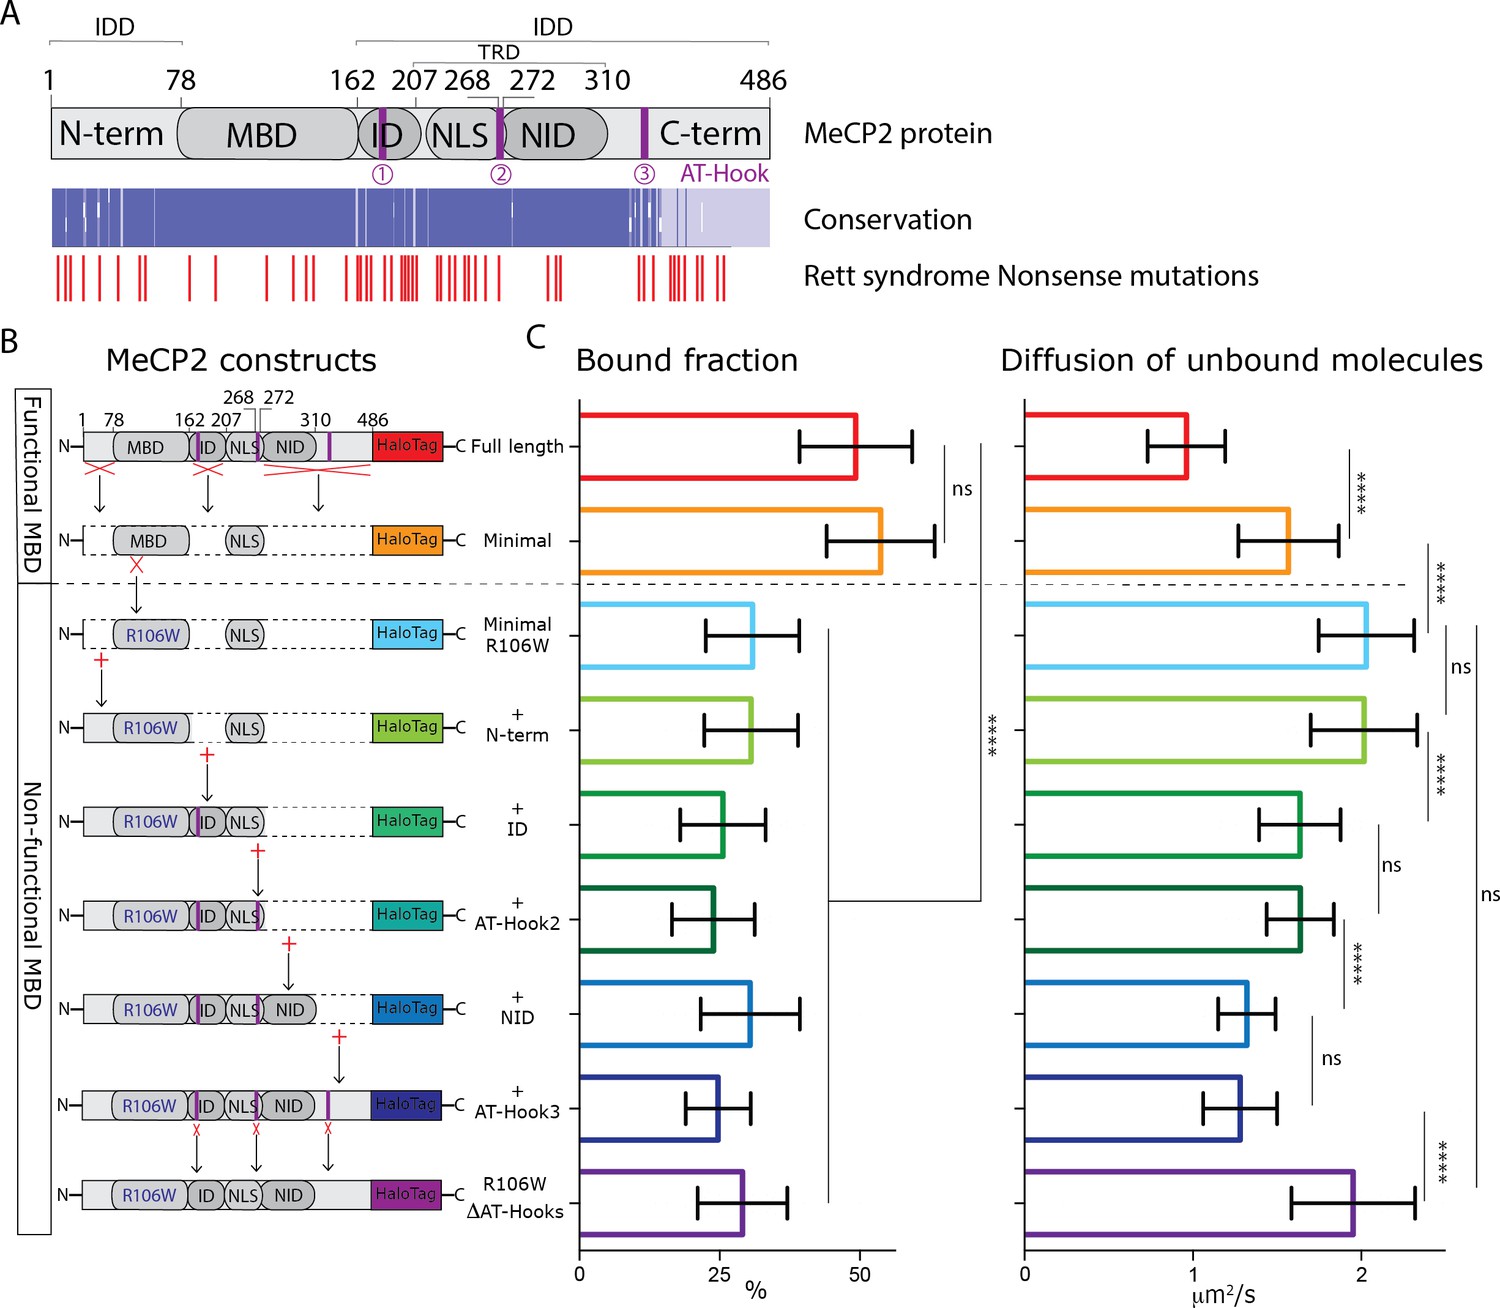
MeCP2 AT-Hook Domains hinder its nuclear diffusion without affecting its binding.
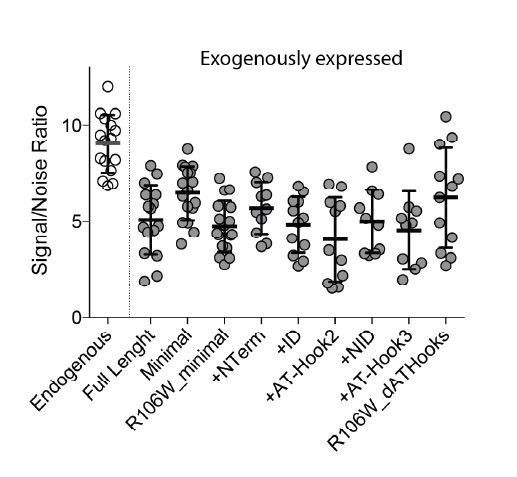
(A) (Top) Schematic representation of full-length MeCP2 protein where known domains are annotated and the 3 AT-Hook domains are highlighted in purple. (Middle) Heat map representing protein sequence identity (from blue, high identity score, to white, no identity) between Human, Mouse, Rat and Dog MeCP2. (Bottom) Missense and nonsense Rett-syndrome causing mutation from RettBASE are annotated in red. (B) Diagrams of different DIO constructs used in the experiment, where MeCP2 was sequentially mutated. (C) Fraction of bound molecules and average diffusion coefficient of the unbound molecules calculated in individual cells by SpotOn for the different MeCP2 constructs. Full-length (red, 29 cells), Minimal (orange, 31 cells), Minimal R106W (cyan, 25 cells), +N-term (light green, 17 cells), +ID (green, 32 cells), + AT-Hook 2 (dark green, 27 cells), +NID (blue, 26 cells), +AT-Hook3 (dark blue, 11 cells), R106W-ΔAT-Hooks (purple, 32 cells). Graphs show mean and standard deviation of single cell values and compare the different constructs by two-tailed unpaired t-test: **** (p<0.0001).
Figure 4—figure supplement 1
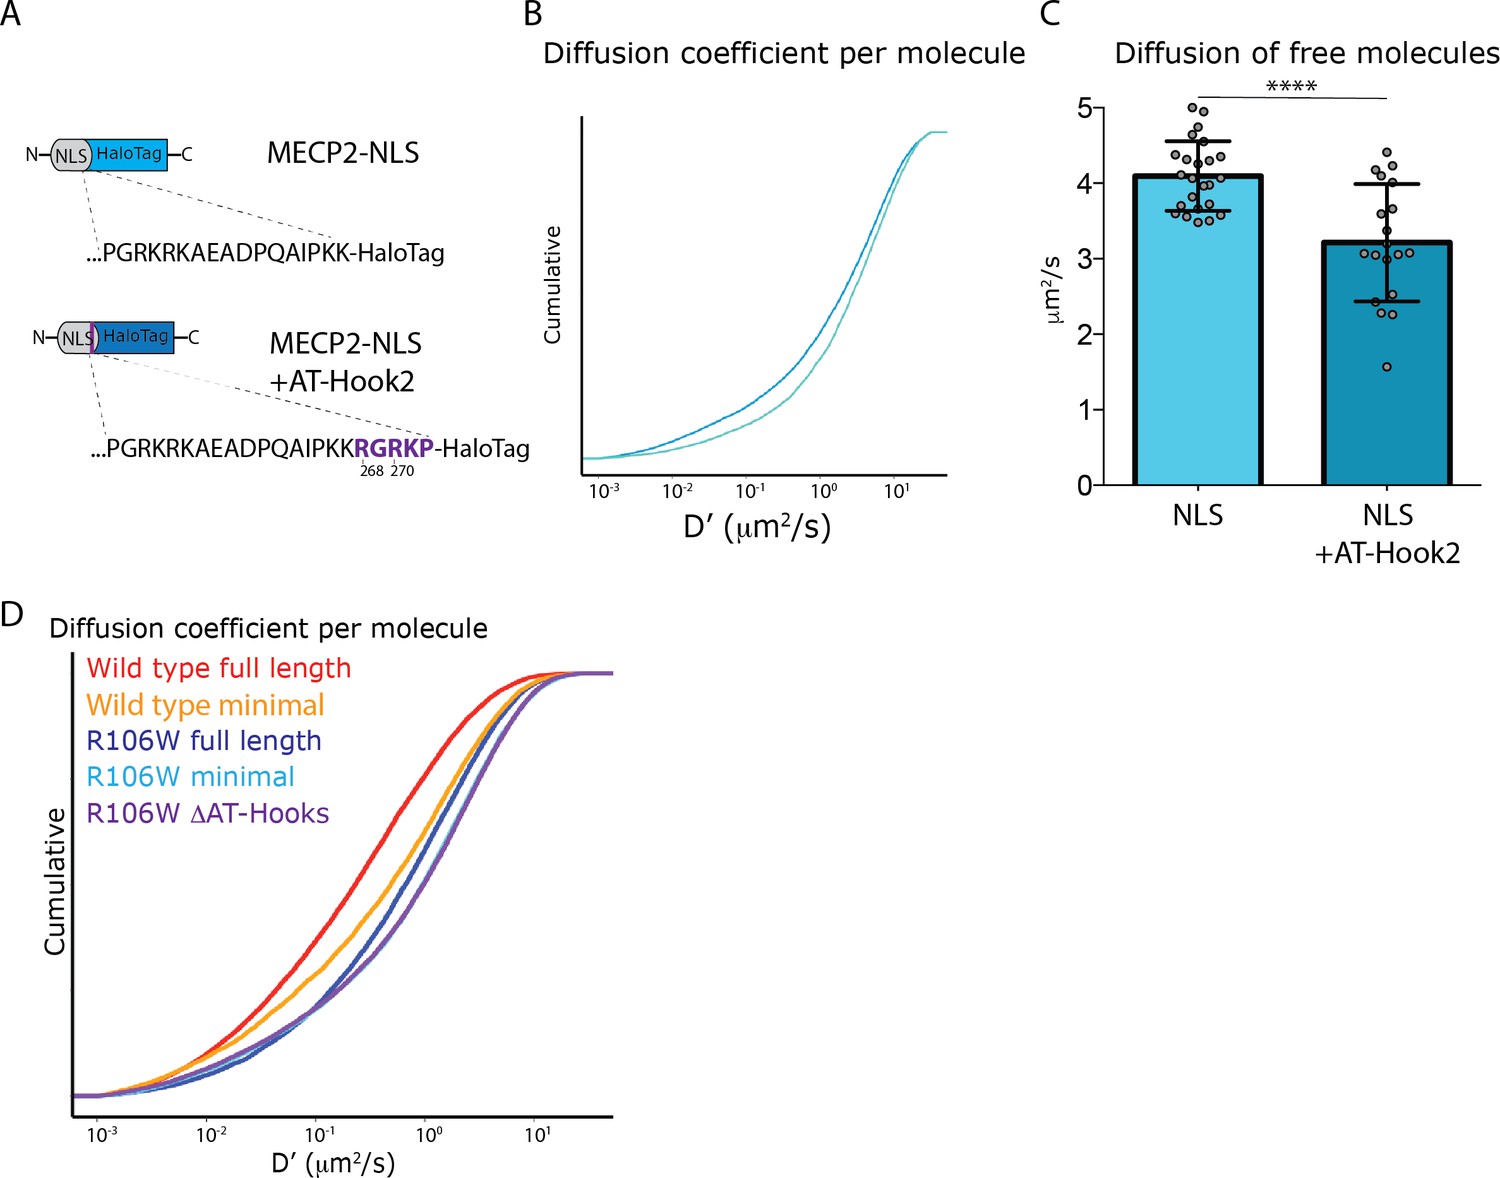
MeCP2 AT-Hook two domain hinders free diffusion of NLS molecules in the nucleus.
(A) MeCP2 nuclear localization signal (MeCP2-NLS) was expressed in frame with the HaloTag peptide or with a peptide linker that reconstitutes MeCP2 AT-Hook two domain (from R268 to P272) in culture granule cells. (B) Cumulative distribution of diffusion coefficient (D’, μm2/s) calculated for individual molecules of NLS-HaloTag (~7000 molecules, cyan) or NLS+ATHook2-HaloTag (~7000 molecules, blue). (C) Diffusion coefficient of the unbound molecules calculated in each cell by SpotOn for NLS (24 cells, cyan) or NLS+ATHook2 (19 cells, blue). Graphs show mean and standard deviation of single cell values (gray dots) and compare the two NLS sequences by two-tailed unpaired t-test: **** (p<0.0001). (D) Cumulative distribution of diffusion coefficient (D’, μm2/s) calculated for individual molecules of full-length wild type MeCP2 (~20,000 molecules, red), Minimal (~10’000 molecules, orange), R106W full length (~20,000 molecules, dark blue), Minimal R106W (12,000 molecules, cyan), R106W-ΔAT-Hooks (~30,000 molecules, purple).
Figure 5

MeCP2 diffusion in euchromatin and heterochromatin regions.
(A) GC culture of MeCP2HaloTag animals was transfected with a construct expressing HP1αBFP (blue) and labeled with JF549-HaloLigand (red). (B) Nuclear single molecule tracks are spatially filtered through masks generated from whole MeCP2HaloTag-JF549 fluorescence signal to separate them into euchromatin (green) and heterochromatin (red). (C) Distribution of diffusion coefficients (D’, μm2/s) calculated for individual MeCP2 molecules in euchromatin (~22,000 molecules, green) or in heterochromatin (9000 molecules, red) of live granule cell nuclei. Two-sample Kolmogorov-Smirnov test was used to compare MeCP2 molecules in euchromatin and heterochromatin p-value=4.6e−22 (D) Scatter dot plot of Diffusion coefficients (D’, μm2/s) for inidvidual molecules in euchromatin (green) and heterochromatin (red) within the same cells. Two-sample Kolmogorov-Smirnov test was used to compare MeCP2 molecules in euchromatin and heterochromatin: * (p<0.05), ** (p<0.005). (E) Bound fraction and average diffusion coefficients of the unbound molecules calculated in each cell by SpotOn for MeCP2 in euchromatin (E, green) and heterochromatin (H, red) for 15 cells. Graphs show mean and standard deviation of single cell values (gray dots) and compare MeCP2 euchromatin and heterochromatin regions by two-tailed unpaired t-test: ns (p>0.05). (F) Dwell time analysis of stable MeCP2 particles as described in Figure 1—figure supplement 2 in euchromatic and heterochromatic nuclear sub-regions. Graph show Long-lived fraction (left) and resident time of the Long-lived molecules (right) of stable MeCP2 for three independent replicates. Graphs show mean and standard deviation and compare Heterochromatin and Euchromatin by two-tailed unpaired t-test: * (p<0.05).
Figure 6 with 2 supplements
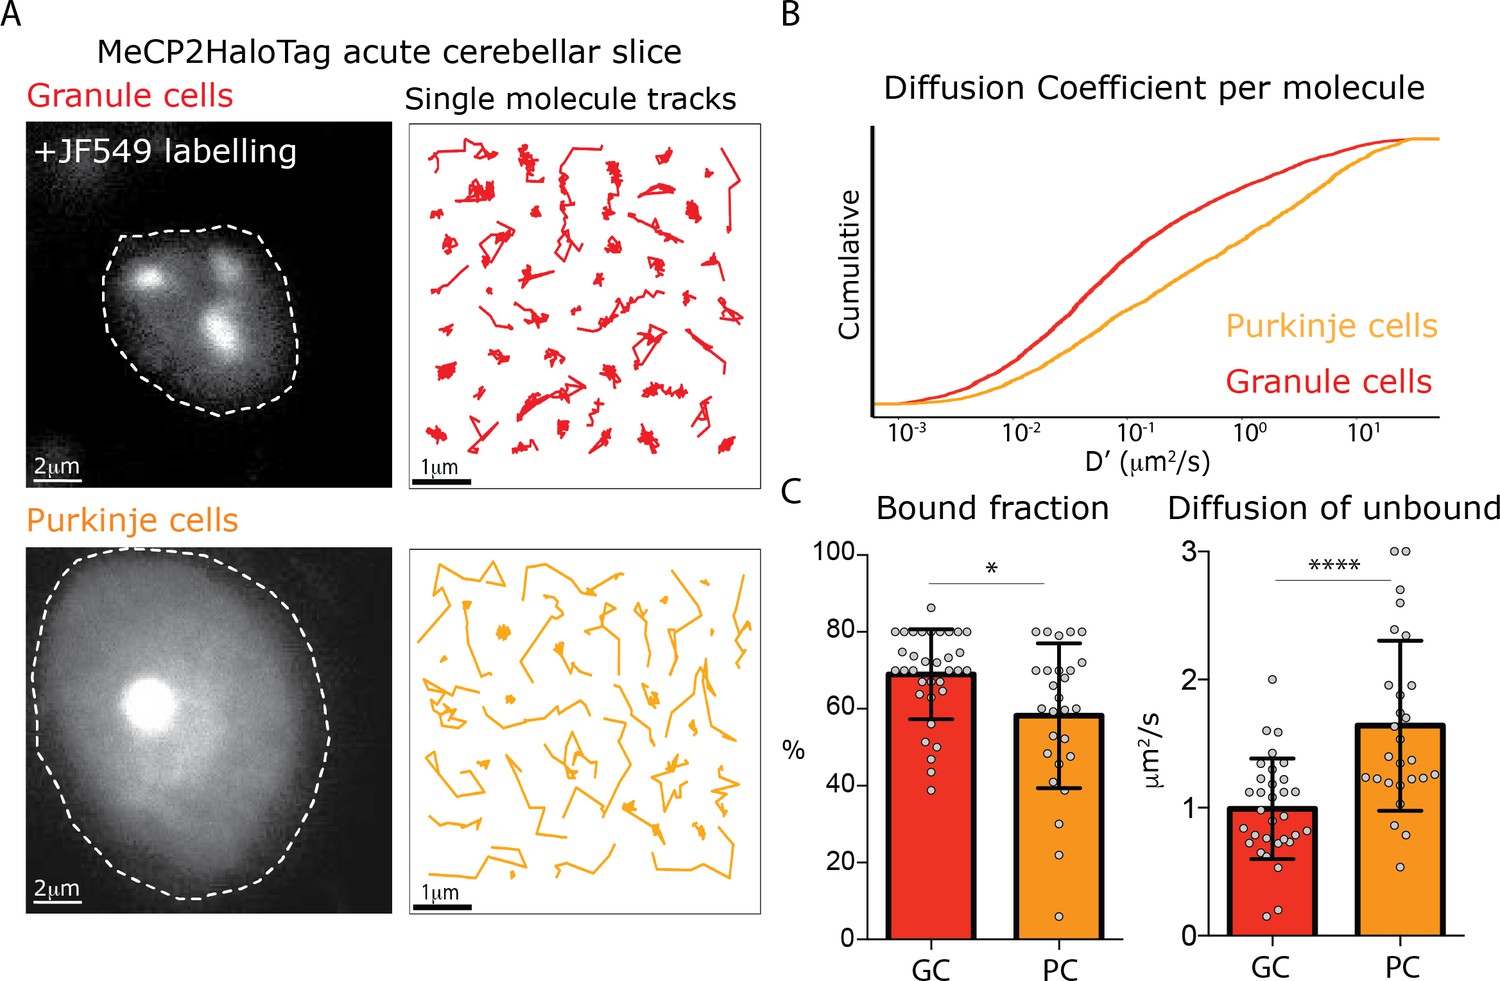
Different MeCP2 dynamic behavior in Granule and Purkinje cells from acute brain slices.
(A) Representative Granule and Purkinje cell nuclei in acute cerebellar brain slices from MeCP2-HaloTag adult mice labeled with JF549-HaloLigand. (B) Cumulative distribution of diffusion coefficients in the logarithmic scale (D’, μm2/s) calculated for individual MeCP2 molecules in Granule (red) and Purkinje nuclei (orange) from acute cerebellar brain slice. Two-sample Kolmogorov-Smirnov test was used to compare the Diffusion Coefficient calculated for individual MeCP2 molecules in Purkinje and Granule cells. p-value 4.79e−68 (C) Fraction of bound molecules and average diffusion coefficient of the unbound molecules of MeCP2 determined in individual granule cells (GC) and Purkinje cells (PC). Graphs show mean and standard deviation of single cell values (gray dots) comparing the two cell types by two-tailed unpaired t-test: * (p<0.05), **** (p<0.0001).
Figure 6—figure supplement 1
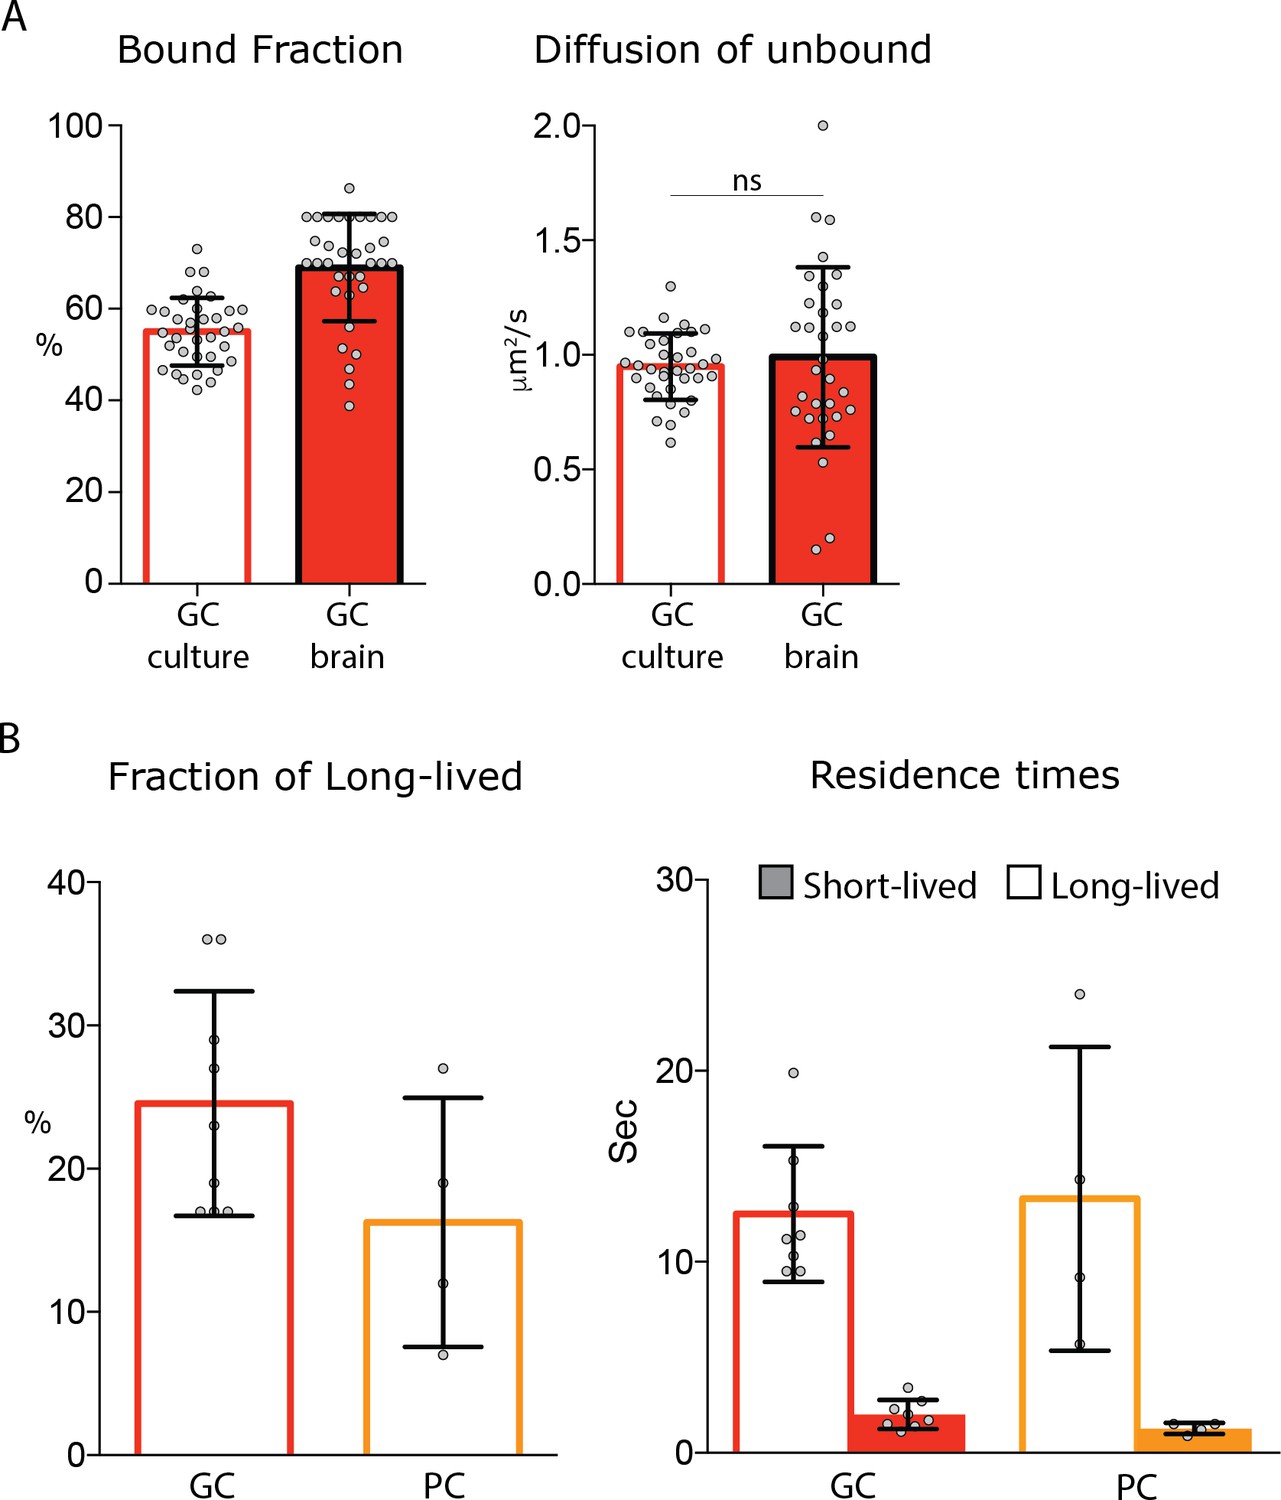
Single molecule analysis of MeCP2 in acute brain slices.
(A) Fraction of bound molecules and average diffusion coefficient of the unbound molecules calculated in each cell by SpotOn for MeCP2 in granule cell culture (34 cells) and acute brain slice (33 cells). Graphs show mean and standard deviation of single cell values (gray dots) and compare the two conditions by two-tailed unpaired t-test: ns (p>0.05). (B) Dwell time analysis of stable MeCP2 molecules in granule (GC) or Purkinje cells (PC) from acute brain slices.
Figure 6—figure supplement 2
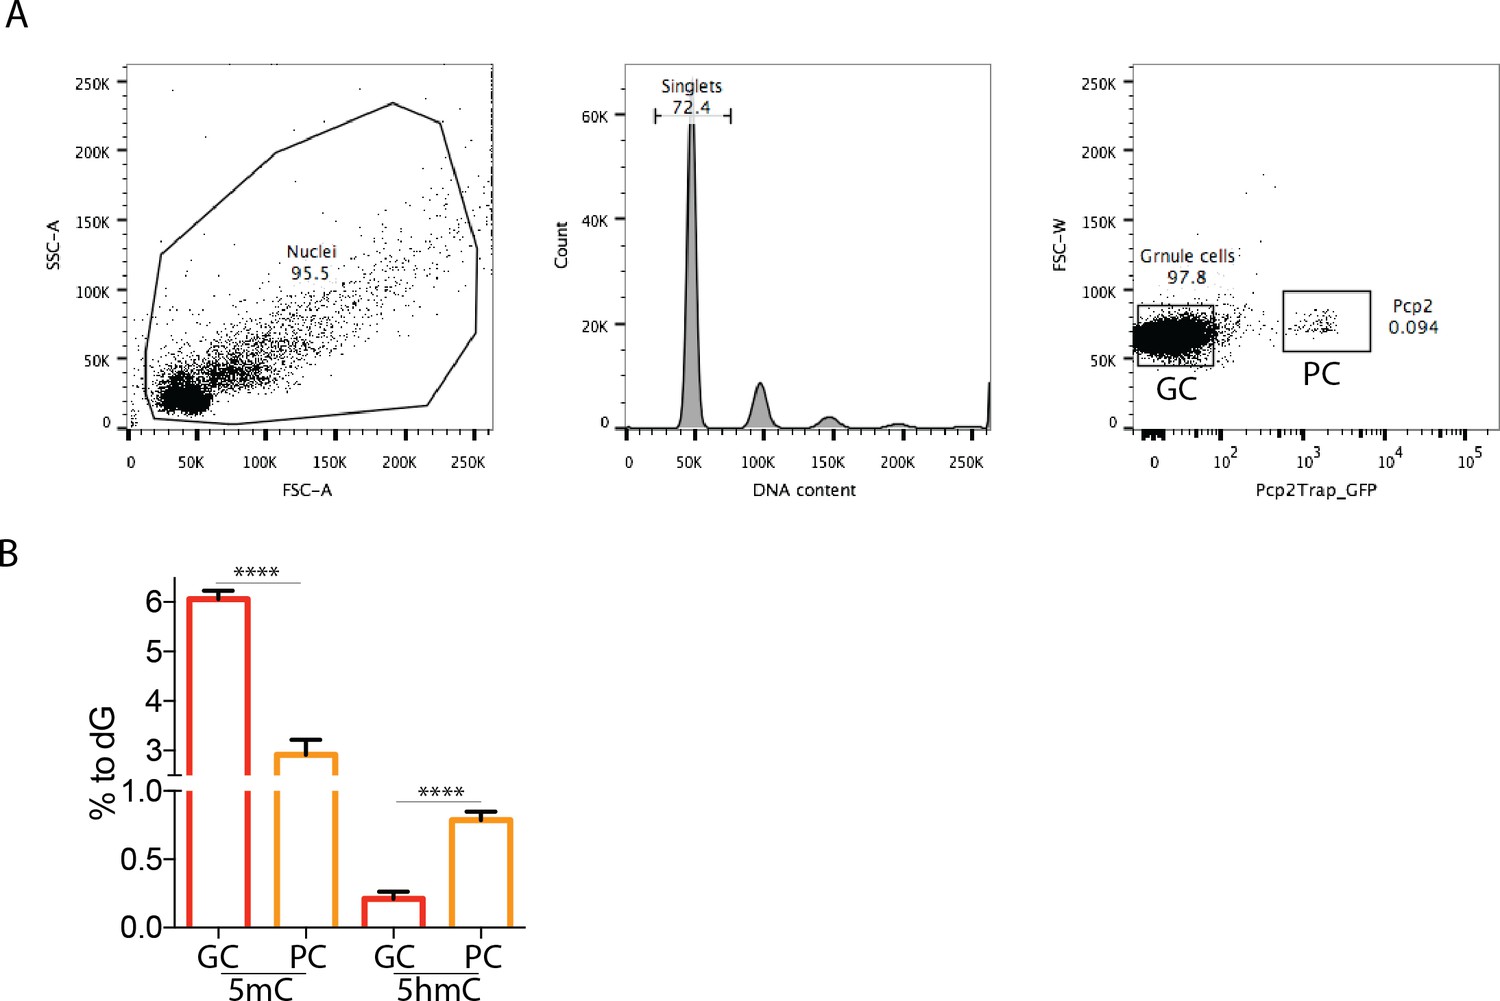
Different amounts of DNA modification in Granule and Purkinje cells of the mouse cerebellum.
(A) FACs-sorting purification of Granule and Purkinje cells from total mouse cerebellum. Purkinje nuclei were selected for the expression of Pcp2 BAC transgenic construct carrying L10a-GFP fusion protein. GFP negative nuclei were collected as Granule cells. (B) Genomic DNA obtained from purified nuclei from the two cell types were analyzed with mass spectrometry to quantify cytosine modifications (5mC and 5hmC) relative to Guanosine (% of dG). DNA modification levels were compared between Granule and Purkinje cells by two-tailed unpaired t-test: **** (p<0.0001).
Author response image 1
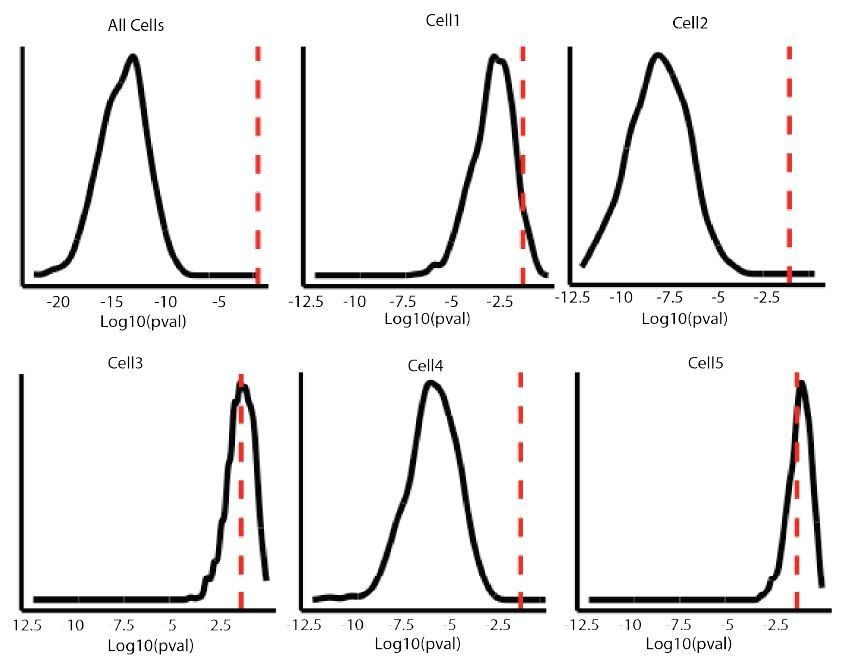
Author response image 2
Additional files
Download links
A two-part list of links to download the article, or parts of the article, in various formats.
Downloads (link to download the article as PDF)
Open citations (links to open the citations from this article in various online reference manager services)
Cite this article (links to download the citations from this article in formats compatible with various reference manager tools)
MeCP2 nuclear dynamics in live neurons results from low and high affinity chromatin interactions
eLife 8:e51449.
https://doi.org/10.7554/eLife.51449


