Mycobacterium tuberculosis exploits host ATM kinase for survival advantage through SecA2 secretome
- National Institute of Immunology, India
- Department of Zoology, University of Delhi, India
Figures
Figure 1 with 1 supplement
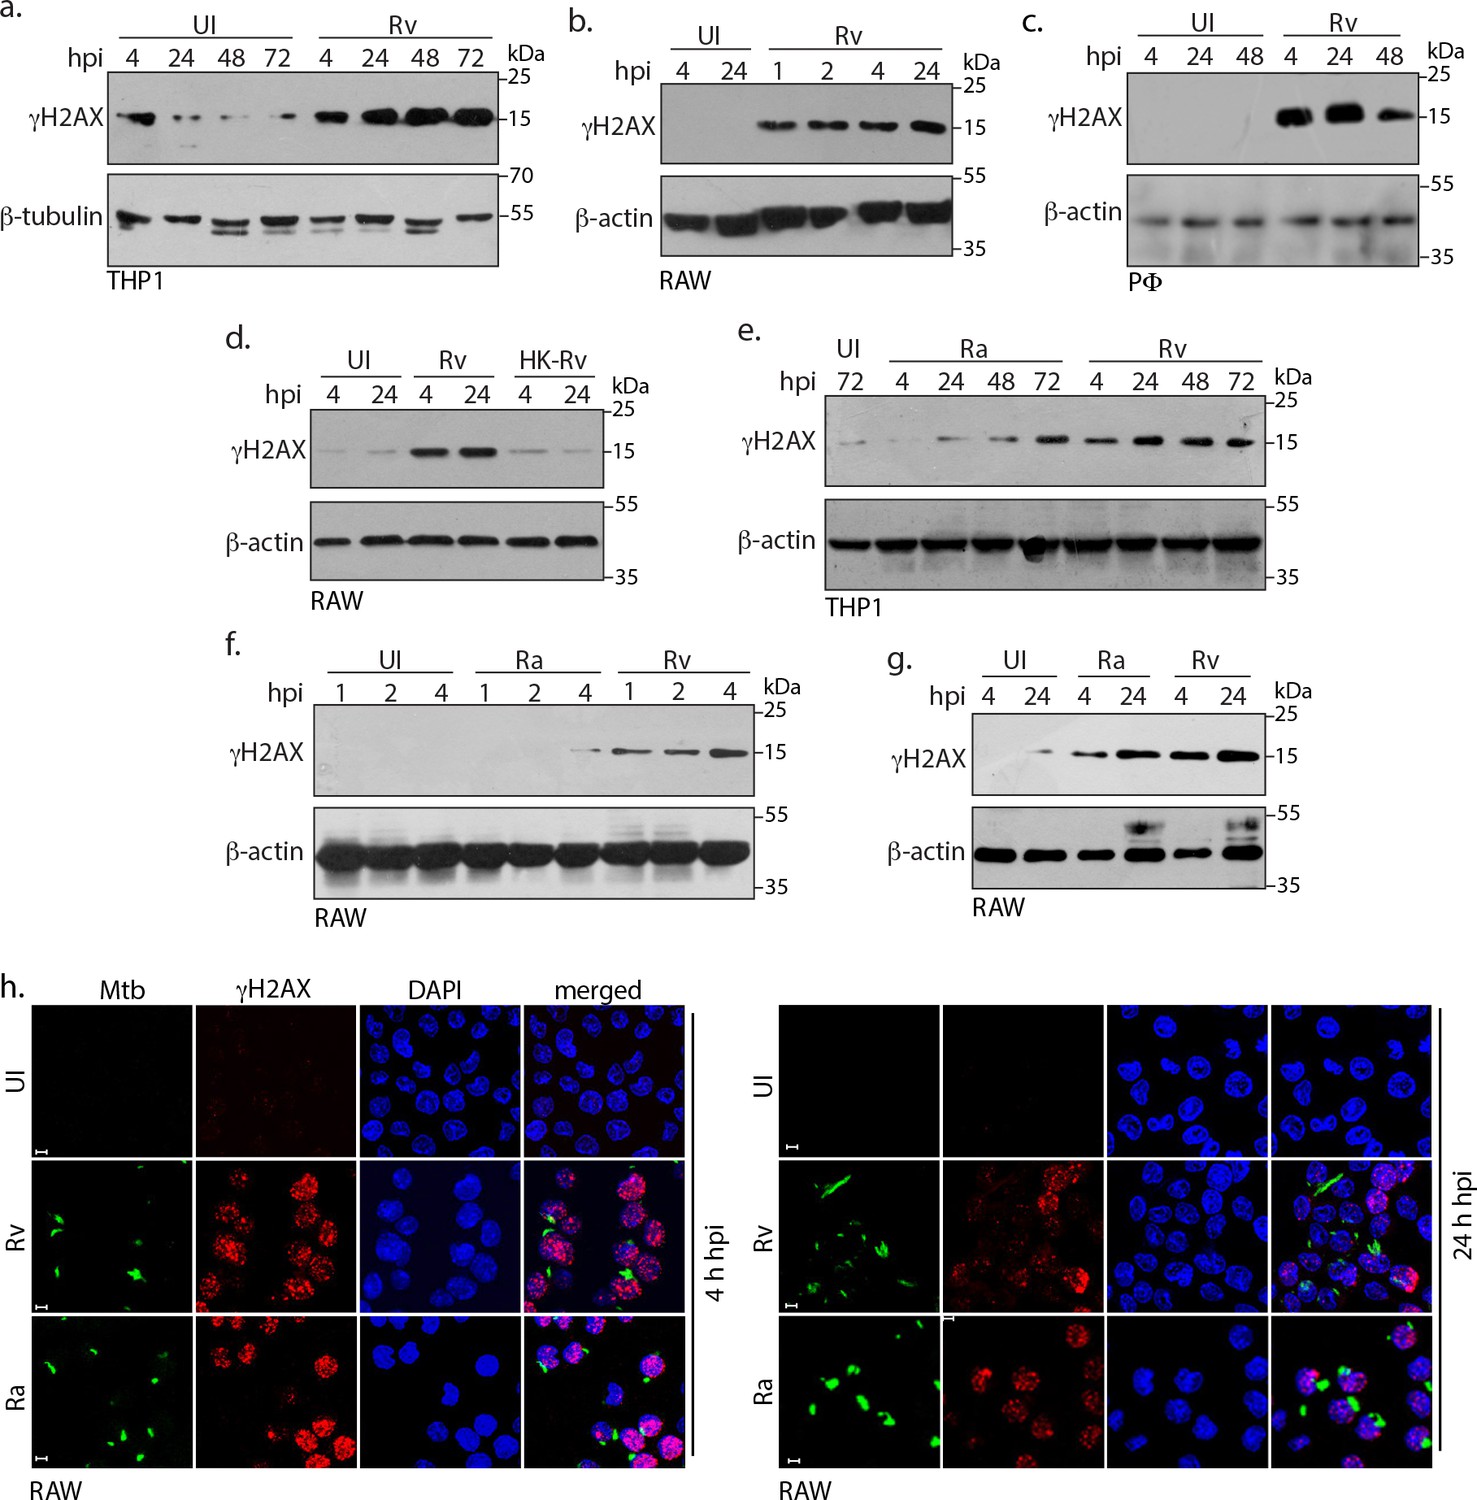
Mtb inflicts DNA damage in the host cell.
(a) PMA differentiated THP-1 cells were infected with Rv for 4 hr. Cells were washed thrice with 1XPBS to remove extracellular bacilli and supplemented with fresh media for further time points which were calculated with respect to 4 hr point. (b and c) RAW264.7 macrophages (RAW) (b) and murine peritoneal macrophages (PΦ) (c) were infected with Rv as described in (a) except that the extracellular bacilli were washed off after 1 and 2 hr post-infection (p.i) For the remaining time points, 4 hr serves as the reference point. (d) RAW264.7 macrophages were infected with Rv or heat-killed Rv (HK-Rv) and cell lysates were prepared at 4 and 24 hr p.i (e–g) THP-1 or RAW264.7 cells were infected with Rv and Ra. Cell lysates were prepared as indicated above after 1, 2, 4, 24, 48 or 72 hr p.i. (a–g) Whole cell lysates (WCL) were resolved on SDS-PAGE, transferred to nitrocellulose membrane and probed with α-γH2AX(S139) and α-β-actin/α-β-tubulin antibodies. (h) Representative immunofluorescence image showing γH2AX foci (AlexaFluor594-Red) and nucleus (DAPI-blue) in RAW264.7 infected with GFP expressing Rv and Ra (Green) independently at 4 and 24 hr p.i. Images were captured at 63X magnification with scale bar of 5 µm.
Figure 1—figure supplement 1
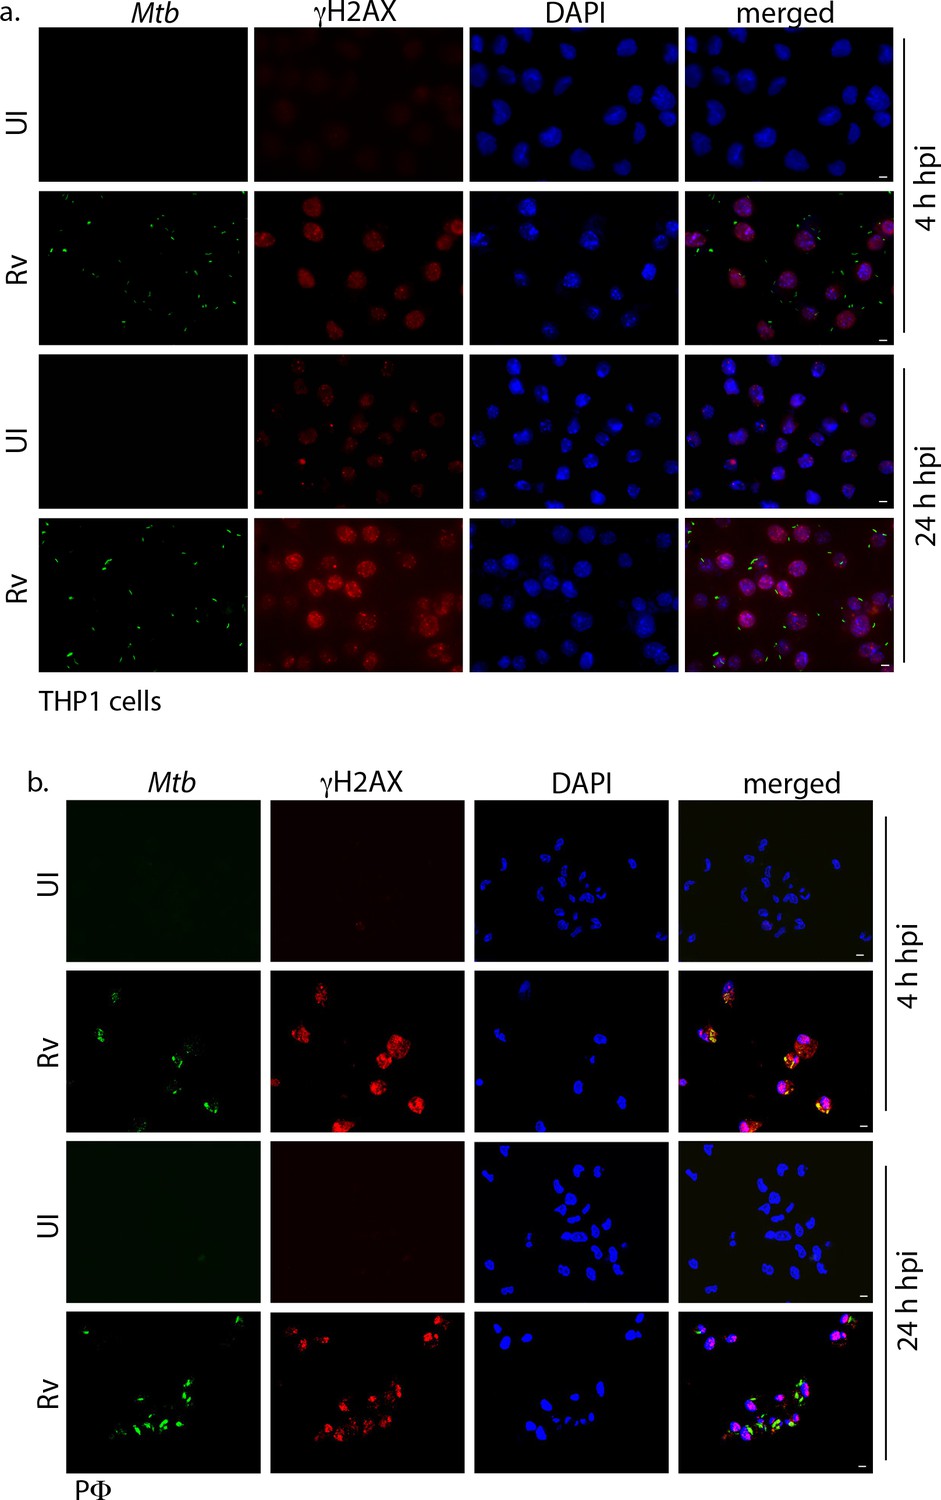
Mtb inflicts DNA damage in the host cell.
Representative immunofluorescence image showing γH2AX foci (AlexaFluor594-Red) and nucleus (DAPI-blue). (a) THP1 cells infected with GFP expressing Rv (Green) independently at 4 and 24 hr p.i. Images were captured in Carl Zeiss epifluorescence microscope under 63X magnification with scale bar of 5 µm. (b) PΦ were infected with GFP expressing Rv (Green) independently at 4 and 24 hr p.i. Images were captured using Zeiss meta 510 Confocal microscope under 63X magnification with scale bar of 5 µm.
Figure 2 with 1 supplement
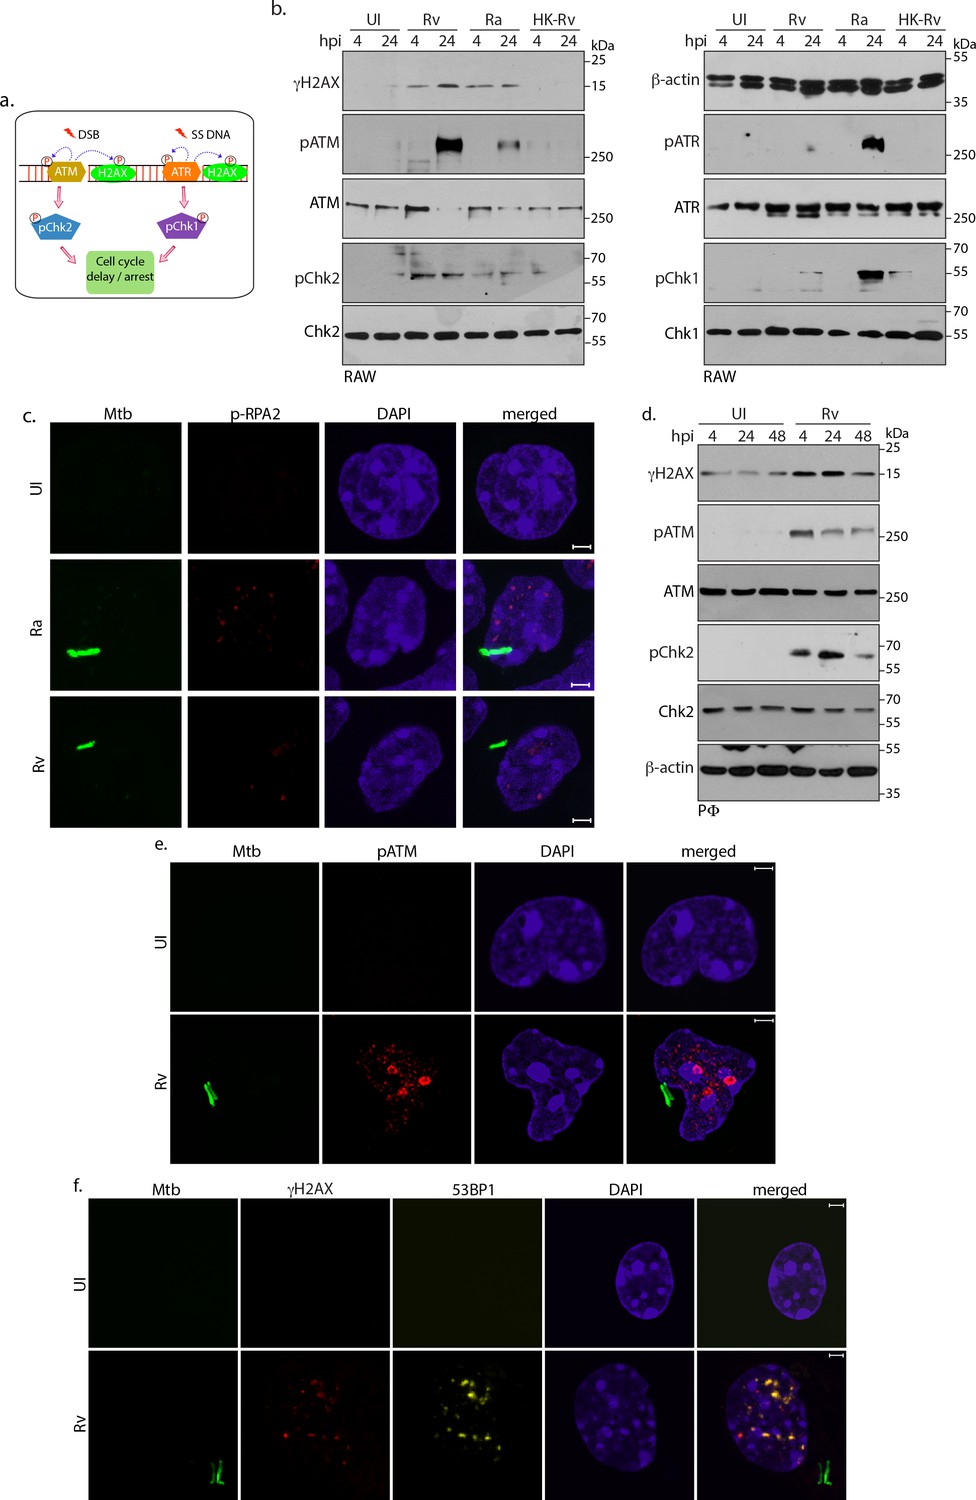
Host cell activates DNA damage response.
(a) Schematic outline of ATM-Chk2 and ATR-Chk1 DDRs. Double strand breaks (DSBs) mediate the activation of ATM and its corresponding effector, Chk2 whereas ssDNA originated due to replication stalling leads to the activation of ATR and the downstream effector Chk1. Chk2 and Chk1 further activate cell cycle checkpoints to delay or arrest cell cycle progression. Cells with extensive DNA damage exit the route of cell cycle and undergo apoptosis. Phosphorylation status of proteins is depicted with P in a circle (b) To determine the signalling cascade coordinating the DNA damage, RAW264.7 macrophages infected with Rv, Ra or HK-Rv. WCL prepared at 4 and 24 h p.i. were subjected to immunoblotting with α-γH2AX, α-pATM(S1981), α-ATM, α-pCHK2(T68), α-CHK2 (left panel) and α-β-actin, α-ATR(S428), α-ATR, α-pCHK1(S345), α-CHK1 (right panel) antibodies. (c) Representative immunofluorescence showing presence of pRPA2-S4/8 foci (AlexaFluor594-Red) in uninfected or GFP-Rv/GFP Ra (Green) infected RAW264.7 macrophages at 24 hr (d) WCL prepared from PΦ infected with Rv for 4 and 24 hr were immunoblotted with α-γH2AX, α- pATM(S1981), α-ATM, α-pCHK2(T68), α-CHK2 and α-β-actin antibodies. (e–f). Representative images of immunofluorescence showing (e) pATM(S1981) (AlexaFluor594-Red) and (f) γH2AX, 53BP1 foci formation (AlexaFluor594-Red and AlexaFluor647-yellow) in PΦ infected with GFP expressing Rv (Green) for 24 hr. Nuclei were stained with DAPI. Images were captured at 100X magnification with 2.9 X optical zoom in LSM510 Meta System (Zeiss, Germany) confocal microscope. Scale bar: 2 µm.
Figure 2—figure supplement 1
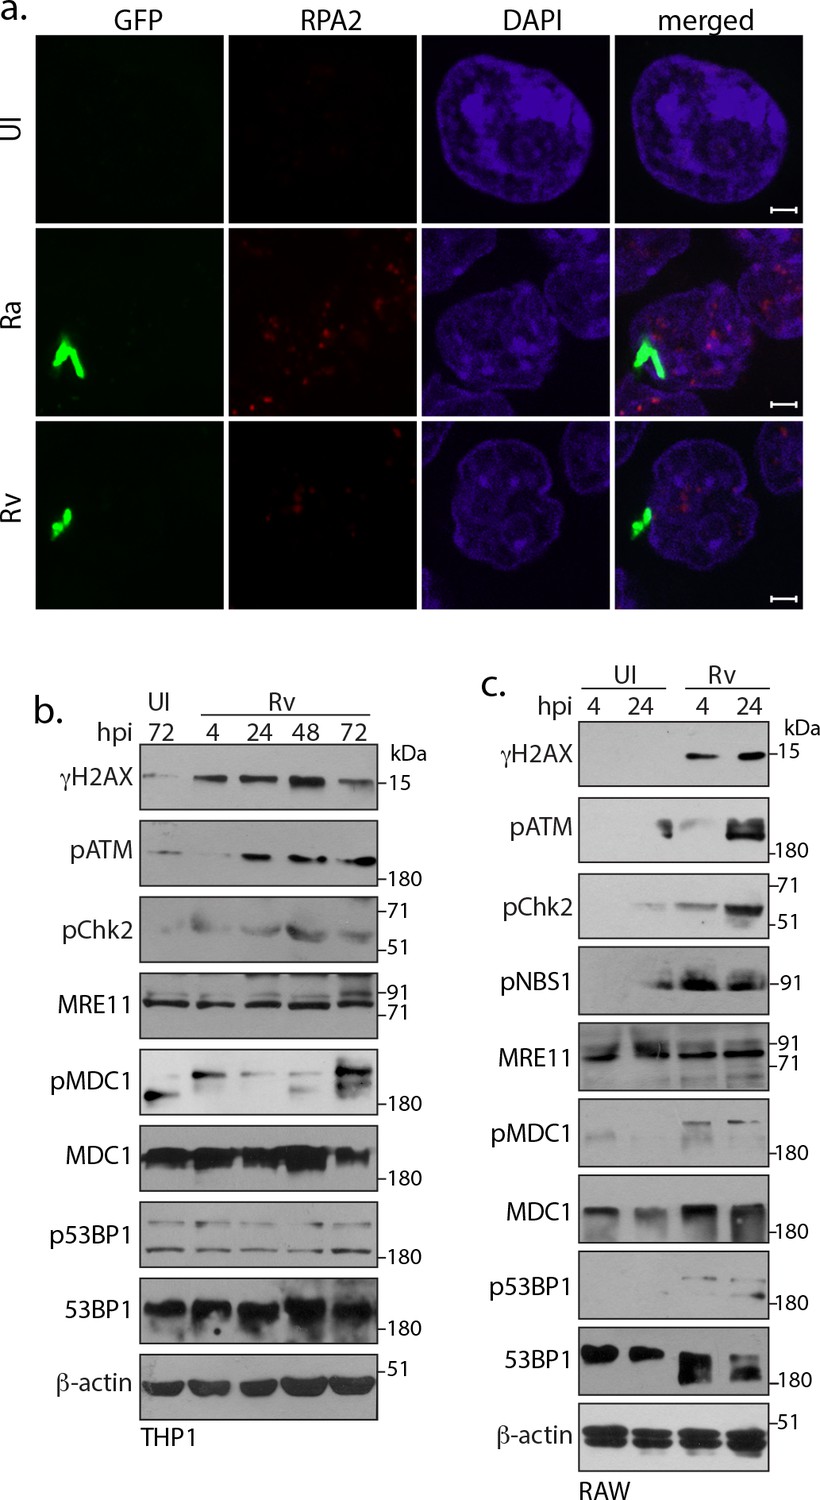
Host cell activates DNA damage response.
(a) Representative images of immunofluorescence showing RPA2 foci (AlexaFluor594-Red) in RAW264.7 macrophages infected with GFP expressing Rv, Ra (Green) at 24 h p.i. (b and c) We assessed the activation of various DDR proteins activated in response to DSBs mediated through Rv infection in THP-1 (b) and RAW264.7 (c) cells. WCL prepared at indicated h.p.i. were subjected to immunoblotting with α-γH2AX, α-pATM(S1981), α-pCHK2(T68), α-p53BP1-T543, α-MRE11, α-pNbs1-S343, α−53BP1, α-pMDC1, α-pMDC1-T4 and α-β-actin antibodies.
Figure 3

Intracellular Mtb causes continuous DSBs.
(a) Left panel: RAW264.7 cells were infected with Rv. Cells were harvested at indicated time points to prepare WCLs which were then probed with α-γH2AX and α-β-actin antibodies. Right panel: RAW cells were treated with 1 µg/mL (7.3 µM) INH for indicated time points. WCL were prepared and immunoblotted with α-γH2AX and α-β-actin. (b and c) RAW264.7 cells were infected with Rv. After 4 hr, extracellular Rv were washed with PBS and supplemented with fresh media with or without 7.3 μM isoniazid (INH) (b). Cells at indicated time points were lysed with 0.05% SDS, serially diluted and plated on 7H11 plates to enumerate bacillary load. Bar graph on y-axis represents Mean CFU (log10) ± SD of one of the three independent experiments performed in triplicates. **p≤0.005, ***p≤0.0005, (c). WCL were prepared at indicated time points were probed with α-γH2AX, α-pATM(S1981), α-ATM, α-pChk2(T68), α-Chk2 and α-β-actin antibodies. (d) Schematic diagram illustrating the experimental approach for the cell cycle analysis using flow cytometry. RAW264.7 cells were infected with GFP expressing Rv. FACS profile showing GFP+ve population containing Rv and GFP-ve population that lacks intracellular Rv (bystander uninfected cells). Uninfected control cells are GFP-ve. (e) Pie chart showing percentage of uninfected and GFP+ve infected cells in different phases of cell cycle. Infection was performed at the indicated timepoints. (f) Schematic representation of signaling activated due to DSB occurrence in the host cell. ATM phosphorylates its self and H2AX. Subsequently it activates the downstream effector, Chk2 at T68. Activated Chk2 stabilizes p53 which in turn elevates p21 levels. Upregulation of p53 can divert cells toward apoptosis while p21 leads to cell cycle arrest (g). WCLs prepared from RAW264.7 infected with GFP expressing Rv for indicated time points were subjected to immunoblotting with α-γH2AX, α-p21, α-p53, α-pChk2(T68), α-Chk2 and α-β-actin antibodies.
-
Figure 3—source data 1
Intracellular Mtb causes continuous DSBs.
Source data for Figure 3b.
- https://cdn.elifesciences.org/articles/51466/elife-51466-fig3-data1-v2.xlsx
Figure 4

Mtb SecA2 secretome is necessary and sufficient for DNA damage.
(a) Schematic depiction of culture filtrate (CF) preparation (described in Materials and methods). (b) RAW264.7 cells were either uninfected or infected with Rv or treated with 20 µg/ml of CF obtained from Rv (Rv-CF). (c) RAW264.7 cells were either left untreated or treated with 1 µg/ml of Rv-CF for 4, 24 and 48 hr. (d and e) RAW264.7 cells were infected with Rv or (d) RvΔRD1 (deletion mutant of RD1 region) or (e) RvΔsecA2 (deletion mutant of SecA2) for indicated time points. (f) PΦ cells were infected with Rv or RvΔCE or RvΔsecA2 for indicated time points (g and h). 1 µg/ml of CF obtained from Rv (Rv-CF) or RvΔRD1 (ΔRD1-CF) or RvΔsecA2 (ΔsecA2-CF) was used to treat (g) RAW264.7 or (h) PΦ for indicated time points. (b–h) WCL from all the above conditions were subjected to immunoblotting with indicated antibodies.
Figure 5 with 1 supplement

ATM activation provides survival advantages to Mtb.
(a) PΦ were pre-treated with 10 µM of KU55933 (ATM-I) for 1 hr prior to Rv infection. 4 h p.i, extracellular bacilli were washed off and cells were replenished with fresh media containing ATM-I for 24 or 48 hr. Cells were lysed with RIPA to prepare WCL which were then subjected to immunoblotting against indicated antibodies. (b) Representative images of immunofluorescence showing pATM(S1981) foci formation (AlexaFluor594-Red) in PΦ infected with GFP-Rv (Green) in the presence or absence of ATM-I for 24 hr p.i. Nuclei were stained with DAPI. Images were captured at 100X magnification. Scale bar: 2 µm. (c) PΦ were infected with Rv and treated with 1, 5 or 10 µM of ATM-I as described above. Cells were lysed with 0.05% SDS to release the intracellular Mtb bacilli and CFUs were enumerated. (d–e) PΦ were pre-treated with 10 µM ATM-I or Chk1/2 inhibitor (Chk2-I) or DMSO (vehicle). Cells were lysed either with RIPA or 0.05% SDS. (d) RIPA WCL were subjected to immunoblotting using α-pATM, α-ATM, α-pChk2(T68), α-Chk2 and α-GAPDH antibodies. (e) SDS lysates were serially diluted and plated on 7H11 plates to determine CFUs.
-
Figure 5—source data 1
ATM activation provides survival advantages to Mtb.
Source Data for Figure 5c and e.
- https://cdn.elifesciences.org/articles/51466/elife-51466-fig5-data1-v2.xlsx
Figure 5—figure supplement 1
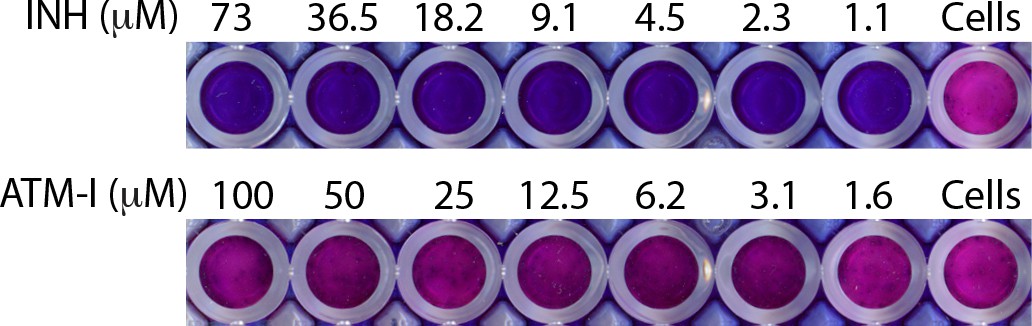
Minimum inhibitory concentration (MIC).
MIC was determined with resazurin addition to Rv cultures treated with indicated concentrations of ATM-I and Isoniazid (INH) in microplate. Blue color indicates dead bacilli, while conversion of blue color of resazurin into pink indicate viable cells. Cells alone serve as the control for the assay.
Figure 6 with 2 supplements

Inhibition of ATM-Akt axis hypersensitizes host cells to apoptosis.
(a) To determine the activation of DNA-PKcs upon Rv infection, PΦ were infected with Rv as indicated and WCL were immunoblotted with α-pDNA-PKcs-S2056, α-DNA-PKcs, α- pATM(S1981), α-ATM, and α-β-actin. WCLs prepared from PΦ irradiated at 2Gy was used as positive control. (b) PΦ were pre-treated with 10 µM ATM-I or 10 µM ATM-I + 1 µM DNA-PK-I or 10 µM ATM-I + 10 µM ATR-I for 1 hr prior to Rv infection. 4 h p.i, extracellular bacilli were washed off and cells were replenished with fresh media containing above inhibitors with indicated combinations for 24 and 48 hr. Cells were lysed with RIPA to prepare WCL which were then subjected to immunoblotting against α-γH2AX and α-β-actin antibodies. (c) PΦ were infected with Rv and treated with DMSO or 10 µM ATM-I or 1 µM DNA-PK-I or 10 µM ATR-I individually as described above. Cells were harvested at indicated time points and CFUs were enumerated as described previously. (d) WCL from PΦ infected with Rv for indicated time points were immunoblotted with α-pAkt (S473), α-Akt antibodies (e–f) PΦ were pre-treated with either 10 µM of ATM-I or Akt inhibitor (Akt-I) or ATM-I + Akt-I for 1 hr prior to Rv infection. 4 hr p.i., extracellular bacilli were washed off and cells were replenished with fresh media containing inhibitors. At defined time points, cells were lysed either with RIPA or 0.05% SDS. (e) WCL were subjected to immunoblotting with α-pATM(S1981), α-ATM, α-pAkt (S473), α-Akt and α-β-actin antibodies. (f) Serially diluted SDS lysates were plated on 7H11 to determine CFU. (g) At 48 hr time point cells were scraped in PBS and subsequently stained with Annexin V-FITC and 7AAD. Cells were analyzed by flow cytometry to determine the percentage of live cells (upper panel) or cells undergoing early/late apoptosis (lower panel). Inhibitor treatments were as described above. Readings are average of three biological replicates. Error bar, SD. *, p≤0.05; **, p≤0.005; ***, p≤0.0005. Significance was calculated with respect to Rv.
-
Figure 6—source data 1
ATM inhibition hypersensitizes host cells to apoptosis.
Source Data for Figure 6c, f and g.
- https://cdn.elifesciences.org/articles/51466/elife-51466-fig6-data1-v2.xlsx
Figure 6—figure supplement 1
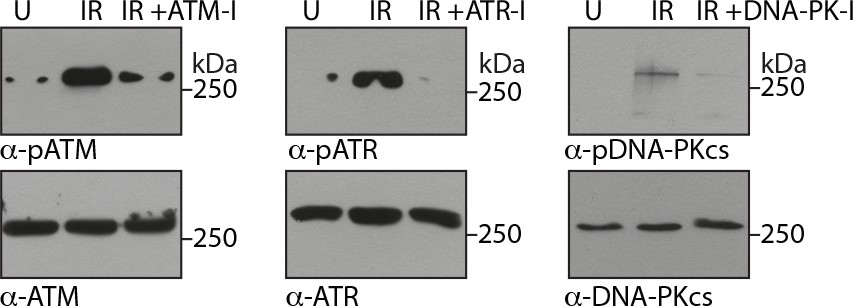
Confirming the activity of inhibitors.
PΦ were either untreated or treated with 10 µM ATM-I or 1 µM DNA-PK-I or 10 µM ATR-I for 1 hr followed by exposure to irradiation at 2Gy.
Cells were then allowed to rest for 2 hr and WCL were sujected to immunoblotting with indicated antibodies.
Figure 6—figure supplement 2
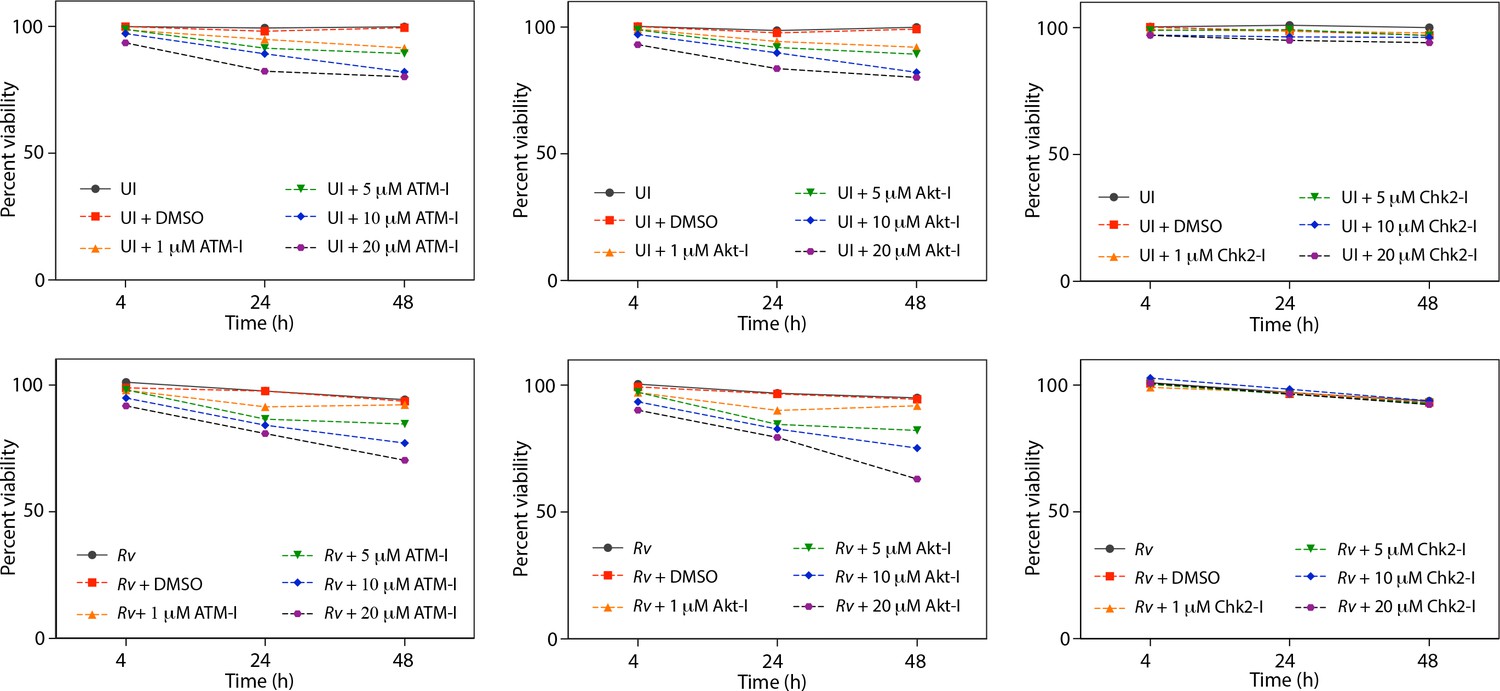
Cell viability upon treatment with inhibitors.
(a) Cell viability of infected (Rv) and uninfected PΦ was determined upon treatment with ATM-I, Akt inhibitor (Akt-I) and Chk2 inhibitor (Chk2-I) using MTT assay.
Figure 7 with 2 supplements
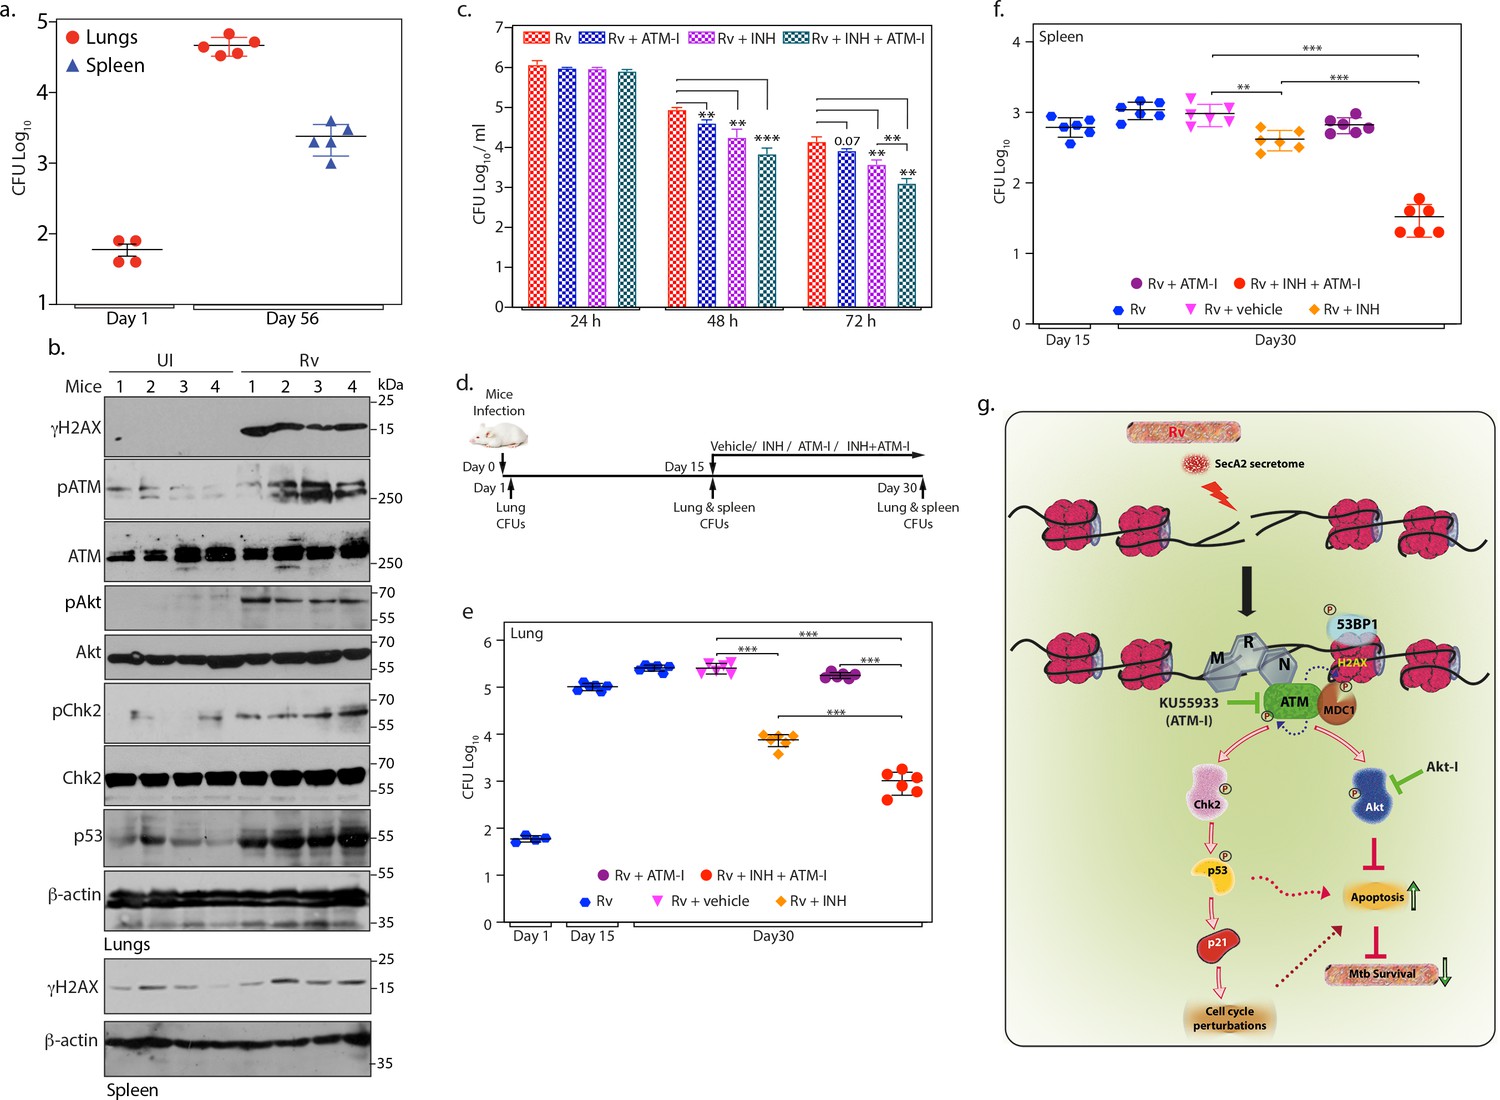
ATM kinase is a potential therapeutic target for host directed TB therapy.
(a) Graphical representation depicting Rv load at day 1 (n = 4) and day 56 (n = 5) of infection in lungs and spleen of mice. Lung homogenates prepared at indicated time points were plated on 7H11 plates to enumerate CFU per lung or per spleen (b) Lung and spleen lysates were prepared from uninfected and Rv infected mice 56 days p.i. 100 µg lung lysates were subjected to immunoblotting with α-γH2AX, α-pATM(S1981) α-ATM, α-pCHK2(T68), α-CHK2, α-pAkt (S473), α-Akt, α-p53 and α-β-actin antibodies. (c) PΦ were infected with Rv at high MOI (1:10) as described above. 24 h p.i, cells were treated with either 3.6 µM isoniazid (INH) or 10 µM ATM-I alone or INH + ATM-I together. CFUs were enumerated at 24, 48 and 72 hr post treatment. (d) Schematic representation of the mice infection and drug treatment protocol used. (e–f) CFUs were enumerated in lungs of mice at Day 1, and in the lungs (e) and spleen (f) on day 15 and 30 of infection. Number of mice in each batch was 6 (n = 6) except in Rv at Day 1(n = 5). Error bar, SD. *, p≤0.05; **, p≤0.005; ***, p≤0.0005. (g) Model depicting the findings. Rv induces genotoxicity and causes deleterious DSBs in the host genome through SecA2 secretome. Host cell in response to the occurrence of DSBs activate ATM kinase and is recruited at the site of damage by the sensor, MRN complex. Activated ATM autophosphorylates itself and phosphorylates H2AX in the chromatin flanking the sites of DNA damage, which becomes the foundation for the recruitment of mediator protein MDC1, thus amplifying DDR. pATM promote recruitment of 53BP1 at the damage site. pATM as a part of DDR also activates downstream effectors, Chk2 and p53, which are responsible for alterations in the host cell cycle. pATM in a parallel pathway also activates Akt, which is known inhibit apoptosis and promote cell survival. Activation of ATM and Akt and subsequent inhibition of apoptosis provides survival advantage to Rv. Inhibition of ATM or Akt activation through inhibitors, ATM-I or Akt-I, respectively, promote host cell apoptosis, which impedes the bacilli growth. Phosphorylation status of proteins is depicted with a P in a circle.
-
Figure 7—source data 1
ATM kinase is a potential therapeutic target for host directed TB therapy.
Source Data for Figure 7a, c, e and f.
- https://cdn.elifesciences.org/articles/51466/elife-51466-fig7-data1-v2.xlsx
Figure 7—figure supplement 1
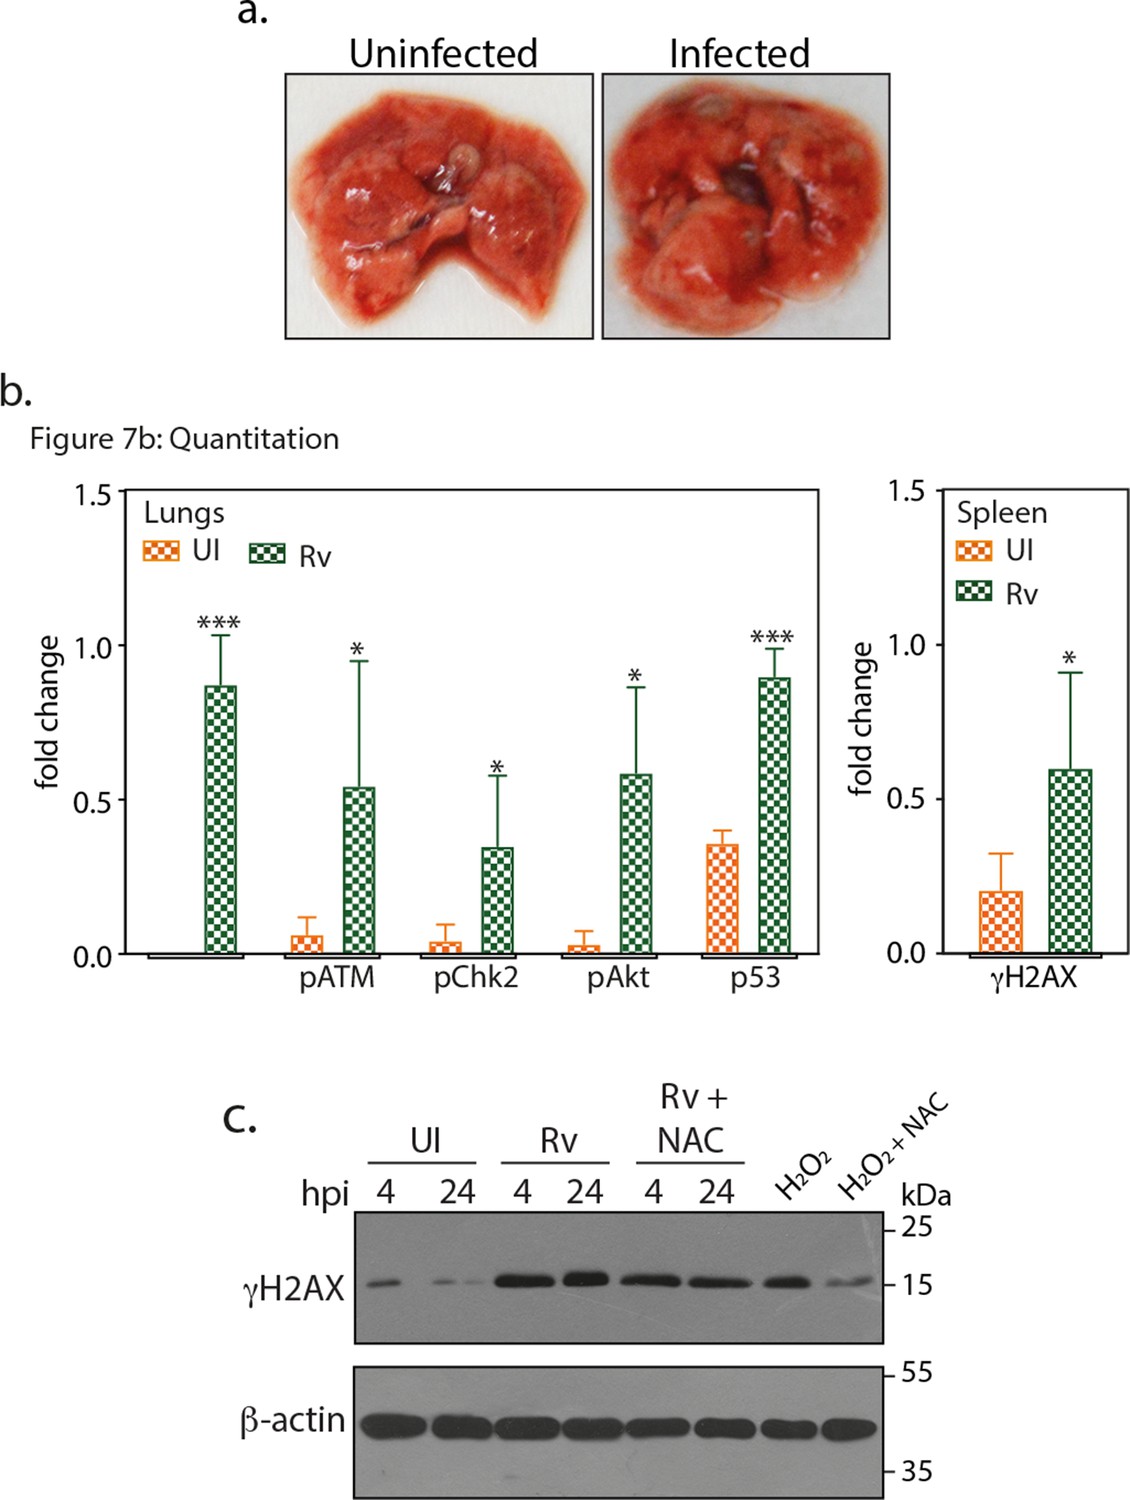
Gross pathology and fold change in the expression of host proteins.
(a) Images showing representative lungs of uninfected and Rv infected mice at 56th day p.i. (b) Densitometric analysis of immunoblots obtained from the lung/spleen lysates of four different mice (representative blot shown in Figure 7b). Data showing the fold change in the expression of indicated protein in uninfected (UI) and Rv infected lungs/spleen. Significance is calculated with respect to their corresponding UI sample (c) RAW264.7 cells were either untreated or treated with 5 mM of N-acetyl cysteine (NAC) for 4 hr prior to infection with Rv for 4 and 24 hr. 100 µM H2O2 treatment is considered as the positive control for ROS induced DNA damage. WCL were subjected to immunoblotting using α-γH2AX and α-β-actin antibodies.
Figure 7—figure supplement 2
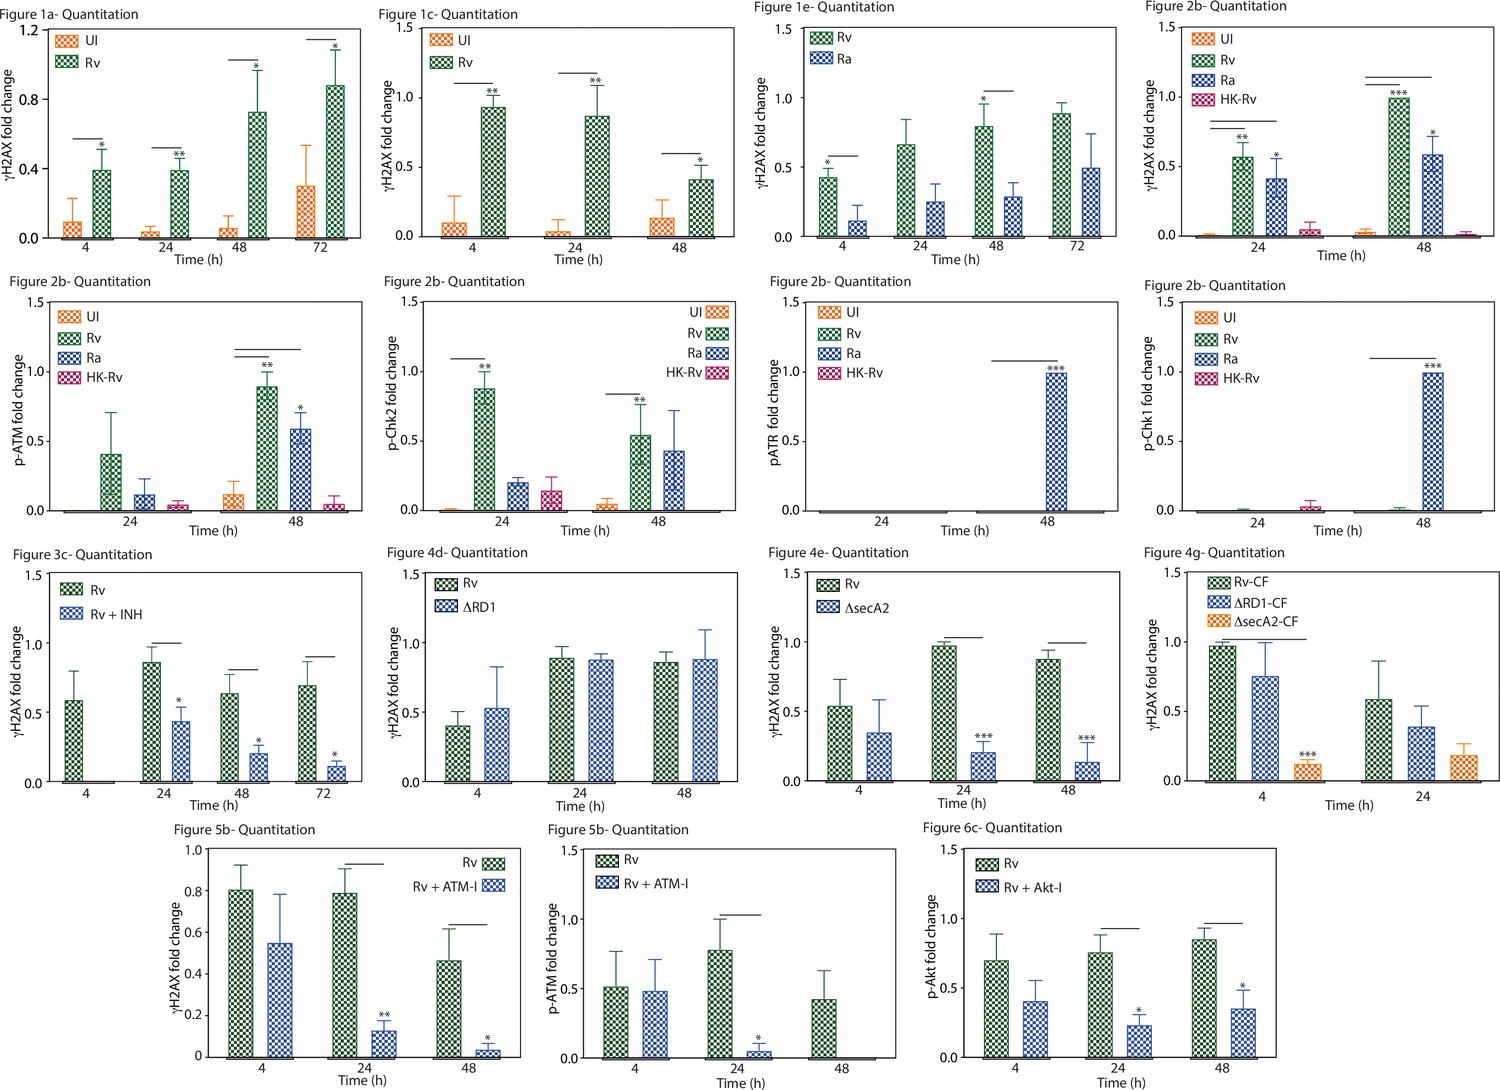
Graphical representation showing the fold change expression of the indicated protein.
The statistical significance of was calculated by considering the densitometric analysis from three biological replicates. Densitometry was performed using ImageJ software. The figure numbers of the corresponding western blot, which is a representative blot of one of the replicates, is given above each graph.
Author response image 1
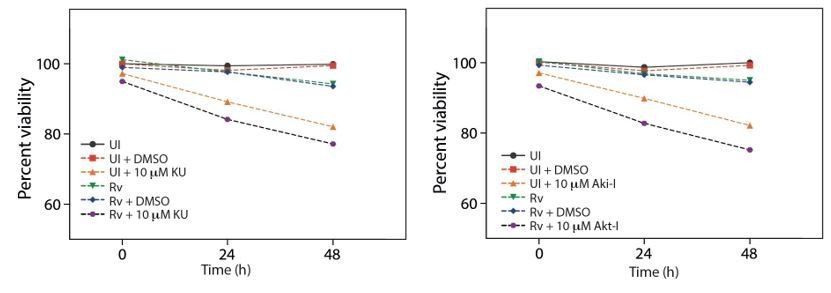
Cell viability upon treatment with inhibitors.
Author response image 2
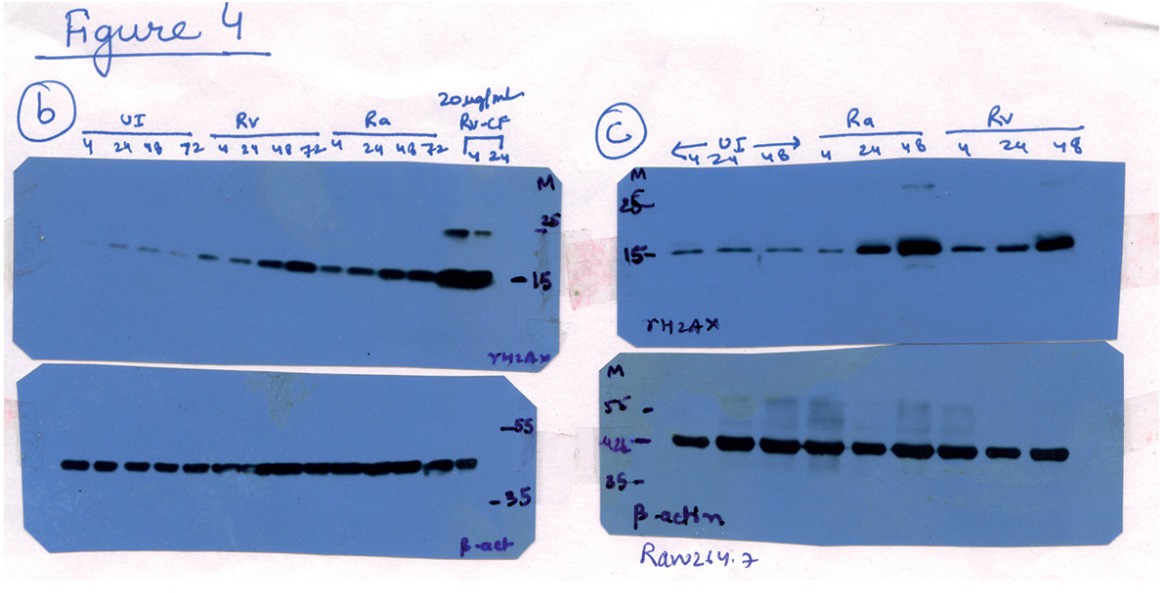
Raw data for Figure 4B and C.
Lanes corresponding to Ra (lanes 9-12 in 4B and lanes 4-6 in 4C) have been spliced out. The splice junctions are indicated in the figure.
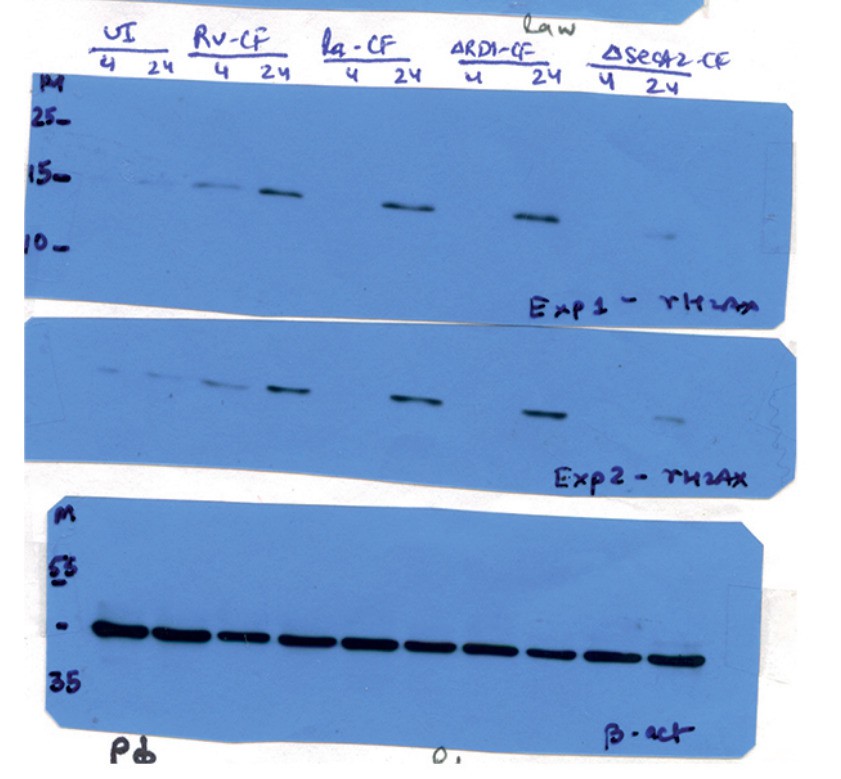
Author response image 3

Raw data for Figure 4G.
Lanes corresponding to Ra (lanes 5 and 6) have been spliced out. The splice junctions are indicated in the figure.
Author response image 4
Raw data for Figure 4H.
Lanes corresponding to Ra (lanes 5 and 6) have been spliced out. The splice junctions are indicated in the figure.
Additional files
Download links
A two-part list of links to download the article, or parts of the article, in various formats.
Downloads (link to download the article as PDF)
Open citations (links to open the citations from this article in various online reference manager services)
Cite this article (links to download the citations from this article in formats compatible with various reference manager tools)
Mycobacterium tuberculosis exploits host ATM kinase for survival advantage through SecA2 secretome
eLife 9:e51466.
https://doi.org/10.7554/eLife.51466


