Evolutionary stability of collateral sensitivity to antibiotics in the model pathogen Pseudomonas aeruginosa
- University of Kiel, Germany
- Max Planck Institute for Evolutionary Biology, Germany
- UKSH, Germany
Figures
Figure 1
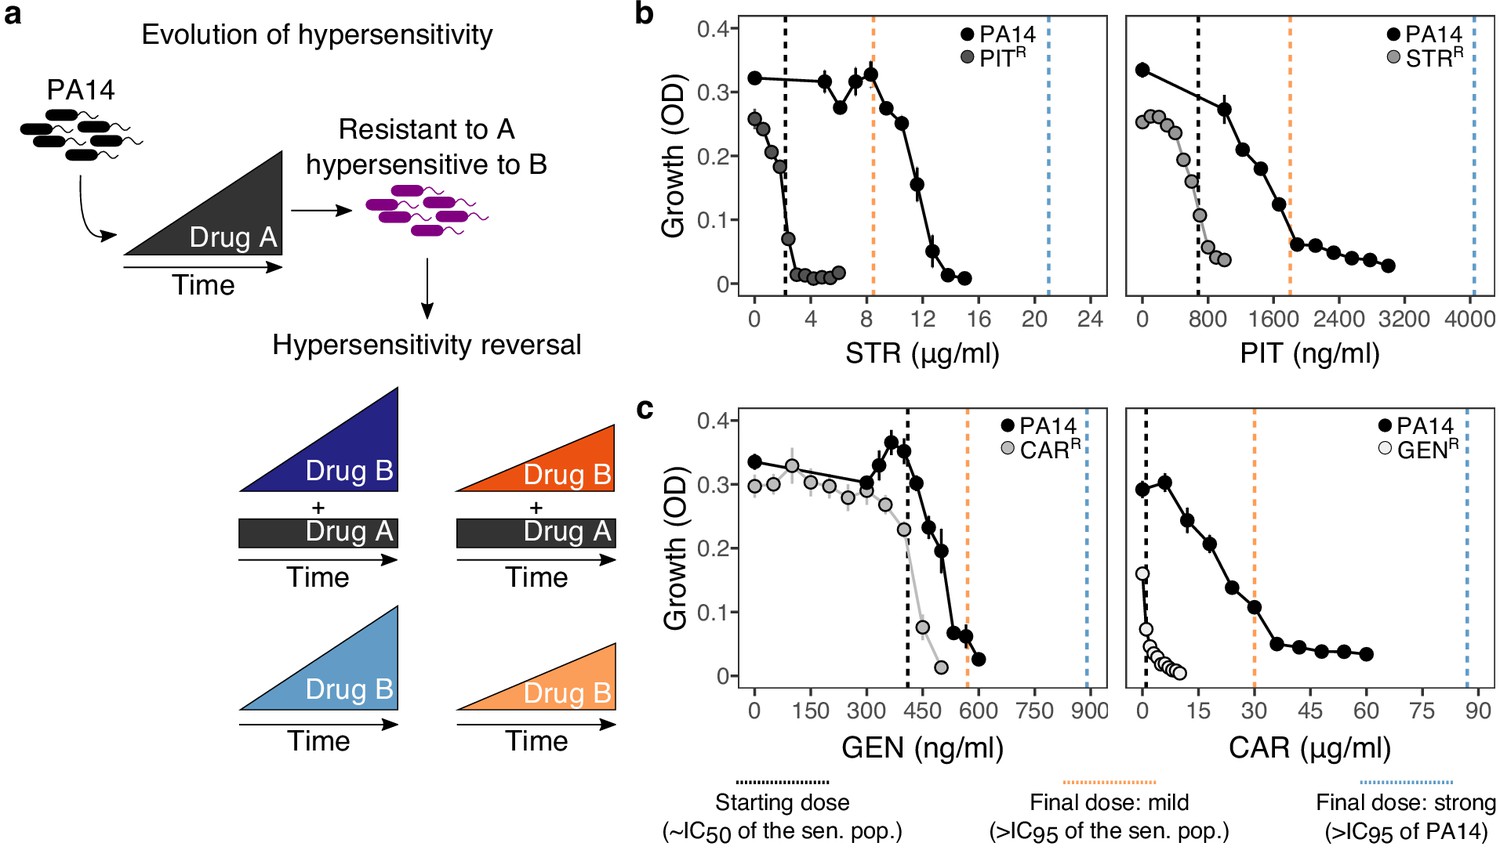
Reciprocal collateral sensitivity and experimental design.
(a) Two-step experimental evolution: resistant populations of P. aeruginosa PA14 were previously experimentally evolved (Barbosa et al., 2017) with increasing concentrations of a particular drug (here labeled A), resulting in bacteria becoming hypersensitive to other drugs (here labeled B). In a second step, A-resistant clones were experimentally evolved in the presence of drug B, using four selection regimes: (i) strong dose increase of drug B in the presence of a constant high dose of drug A; (ii) mild dose increase of B in the presence of A; (iii) strong dose increases of B in the absence of A; and (iv) mild dose increase of B in the absence of A. Concentrations of B were increased using linear ramps starting at IC50 (dashed black lines) and ending at levels above the IC95 of the collaterally sensitive clone (mild increases, dashed orange line), or that of the PA14 wild type strain (strong increases, dashed black lines; detailed information on concentrations in Supplementary Table 1). (b) Validated reciprocity of collateral sensitivity for the isolated resistant clones and drug pair PIT/STR, and (c) CAR/GEN. Mean ±CI95, n = 8. Vertical dashed lines indicate the starting (black) and final doses of the mild (light orange) and strong drug increases (light blue). CAR, carbenicillin; GEN, gentamicin; STR, streptomycin; PIT, piperacillin with tazobactam; superscript R denotes resistance against the particular drug. The following supplementary table and source data are available for Figure 1b and c: Supplementary file 1-Figure 1-supplementary table 1 and Figure 1—source data 1.
-
Figure 1—source data 1
Mean optical density and CI95 values obtained after 12 hr of growth in minimal media and different antibiotics as reported in Figure 1.
The populations tested here include the PA14 wild type, and four resistant populations. Each value is the average of 8 technical replicates per bacterial population.
- https://cdn.elifesciences.org/articles/51481/elife-51481-fig1-data1-v2.txt
Figure 2
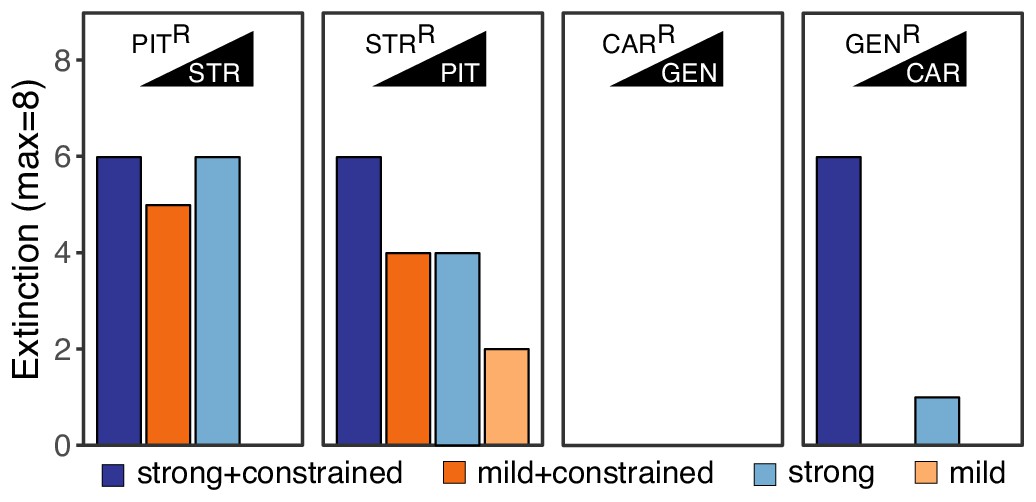
Extinction events during second step of experimental evolution.
From left to right, extinction events for PITR-clones challenged with STR, STRR-clones challenged with PIT, CARR-clones challenged with GEN, and GENR-clones challenged with CAR. Superscript R indicates resistance against the particular antibiotic, as evolved during the first step of the evolution experiment. The following source data is available for Figure 2: Figure 2—source data 1.
-
Figure 2—source data 1
Count data of extinction events as reported in Figure 2.
Extinct populations were determined by their inability to grow in rich media after 24 hr of incubation at 37 °C.
- https://cdn.elifesciences.org/articles/51481/elife-51481-fig2-data1-v2.txt
Figure 3 with 2 supplements
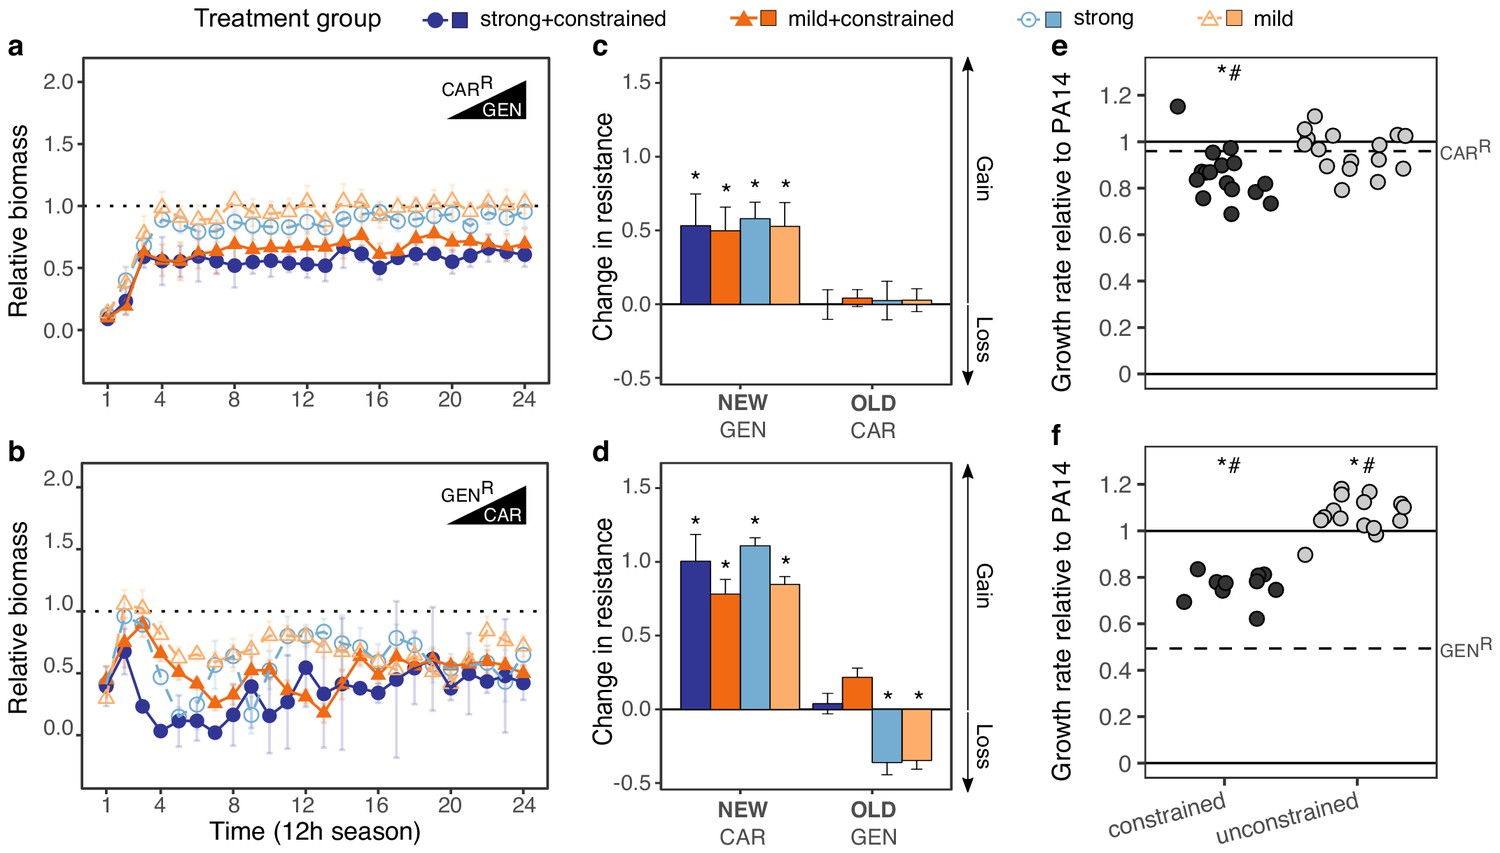
Contrasting evolutionary stability of collateral sensitivity for CAR>GEN and GEN>CAR switches.
Evolutionary dynamics of surviving populations expressed as relative biomass for (a) CARR-populations during selection with GEN, and (b) GENR-populations during selection with CAR. The dotted horizontal line indicates growth equal to untreated controls. Mean ±CI95, number of biological replicates differs due to extinction (n = 2–8). Changes in antibiotic resistance at the end of the second-step evolution experiment for (c) CARR-populations after selection with GEN and (d) GENR-populations after selection with CAR. Resistance was tested either against the drug towards which bacteria initially showed resistance after the first evolution experiment (indicated as OLD), or the drug used during the second experiment (indicated as NEW). The change is measured by cumulative differences in dose-response before and after the second evolution experiment (i.e., the original antibiotic resistant clone versus its evolved descendants). Mean ±CI95, n = 2–8 biological replicates (differences due to extinction). Asterisks indicate significant changes in resistance (one-sample t-test, µ = 0, FDR-adjusted probabilities). Change of maximum exponential growth rate in drug-free conditions for the evolved lineages, relative to wild type PA14 for (e) CARR>GEN lineages and, (f) GENR>CAR lineages. This measure is used to explore the presence of a general adaptation trade-off. The evolved lineages were grouped by whether experimental evolution was performed under constrained conditions (i.e., presence of drug A and B; dark gray circles) or not (i.e., only presence of drug B; light gray circles). The dashed line in each panel then indicates relative growth rate of the starting resistant population. Asterisks show significant increases or decreases in growth rate relative to the wild type PA14 (One-sample t-test, µ = 1, p<0.004), while numerals indicate significant increases or decreases relative to the starting population (dashed lines in each panel, One-sample t-test, µ = GENR or CARR, p<0.004). Number of populations per group and experiment vary due to extinction (min = 10, max = 16). The following supplementary figures, tables and source data is available for Figure 3: Figure 3—figure supplement 1, Figure 3—figure supplement 2, Supplementary file 1-Figure 3-supplementary tables 1-3, and Figure 3—source data 1; Figure 3—source data 2; Figure 3—source data 3.
-
Figure 3—source data 1
Evolutionary dynamics summarized by the area under the curve (AUC) across experimental seasons relative to the reference treatment with no drugs.
Data is shown for all following experiments: CARR>GEN, GENR>CAR, PITR>STR and STRR>PIT, as reported in Figure 3a and b and Figure 3—figure supplement 1a and b.
- https://cdn.elifesciences.org/articles/51481/elife-51481-fig3-data1-v2.txt
-
Figure 3—source data 2
Dose-response curves data of surviving populations challenged with CAR, GEN, STR and PIT.
Data is shown in Figure 3c and d, and Figure 3—figure supplement 1c and d. Optical density values were recorded after 12 hr of incubation at 37 °C.
- https://cdn.elifesciences.org/articles/51481/elife-51481-fig3-data2-v2.txt
-
Figure 3—source data 3
Growth rate estimates of the surviving population challenged with CAR or GEN, as reported in Figure 3.
Growth rate was calculated as specified in the Materials and methods section.
- https://cdn.elifesciences.org/articles/51481/elife-51481-fig3-data3-v2.txt
Figure 3—figure supplement 1
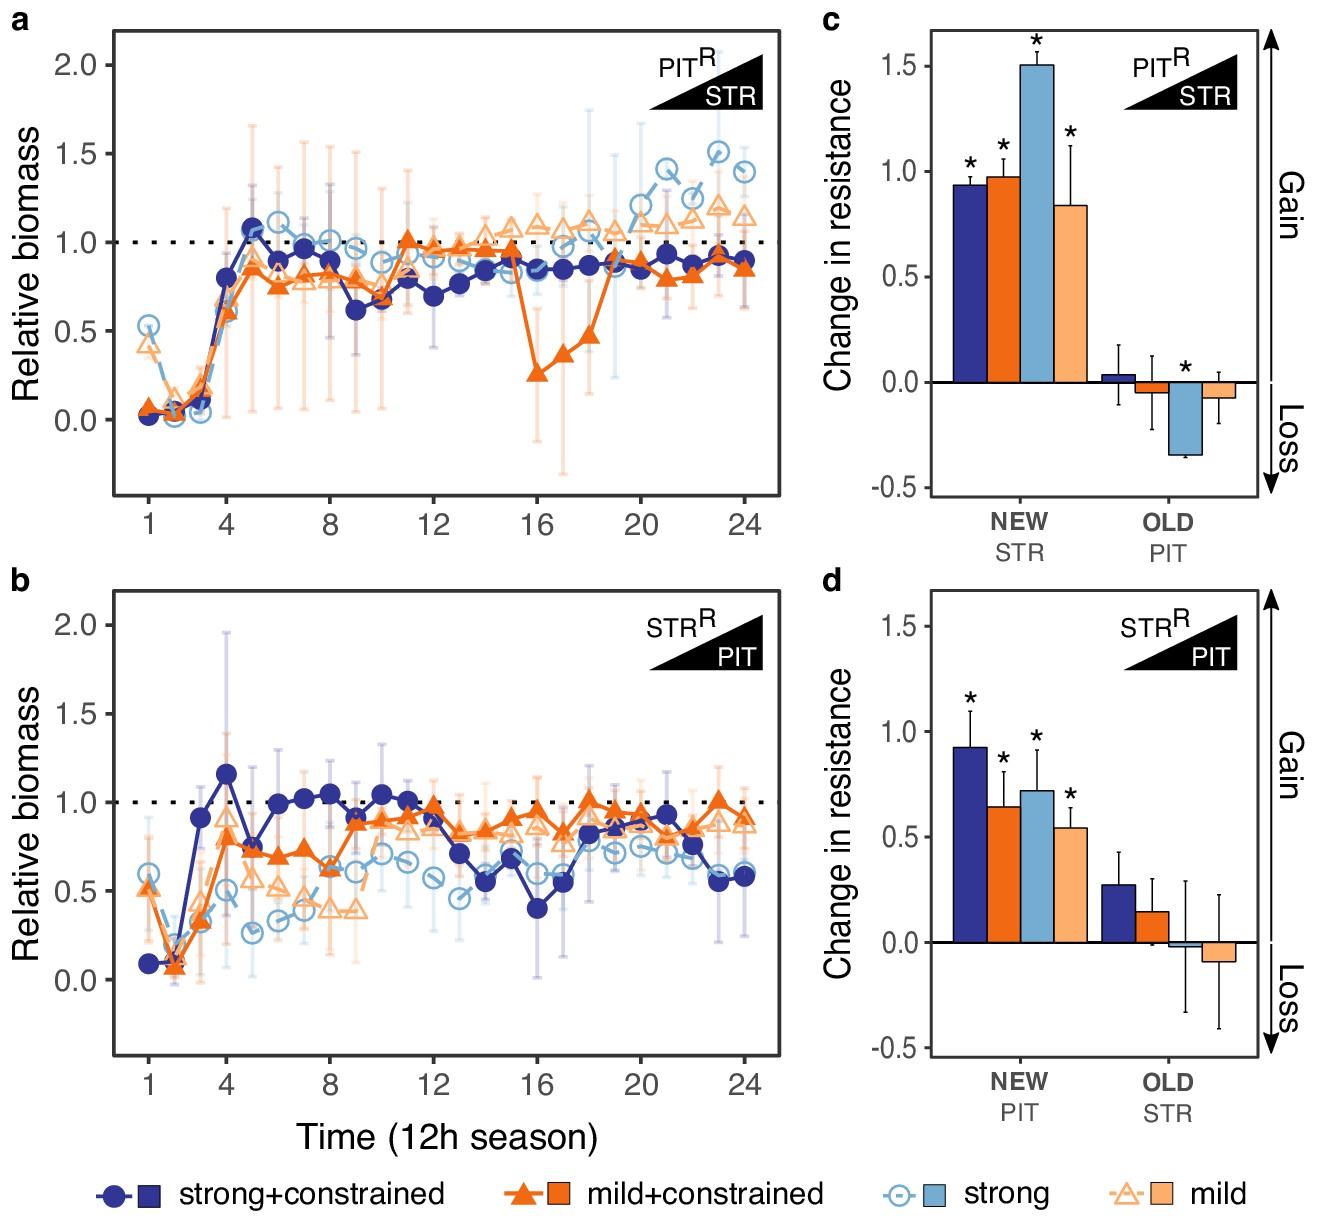
Evolutionary stability of collateral sensitivity for PITR>STR and STRR>PIT switches.
Evolutionary dynamics of surviving populations expressed as relative biomass for (a) PITR-populations during selection with STR, and (b) STRR-populations during selection with PIT. The dotted horizontal line indicates growth equal to untreated controls. Mean ±CI95, number of biological replicates differs due to extinction (min = 2, max = 8). Changes in antibiotic resistance at the end of the second-step evolution experiment for (c) PITR-populations after selection with STR and (d) STRR-populations after selection with PIT. Resistance was tested either against the drug towards which bacteria initially showed resistance after the first evolution experiment (indicated as OLD), or the drug used during the second experiment (indicated as NEW). The change is measured by cumulative differences in dose-response before and after the second evolution experiment (i.e., the original antibiotic resistant clone versus its evolved descendants). Mean ±CI95, n = 2–8 biological replicates (differences due to extinction). Asterisks indicate significant changes in resistance (one-sample t-test, µ = 0, FDR-adjusted probabilities). Superscript R denotes resistance against the particular drug. The data for this figure is provided in Figure 3—source data 1 and Figure 3—source data 2.
Figure 3—figure supplement 2
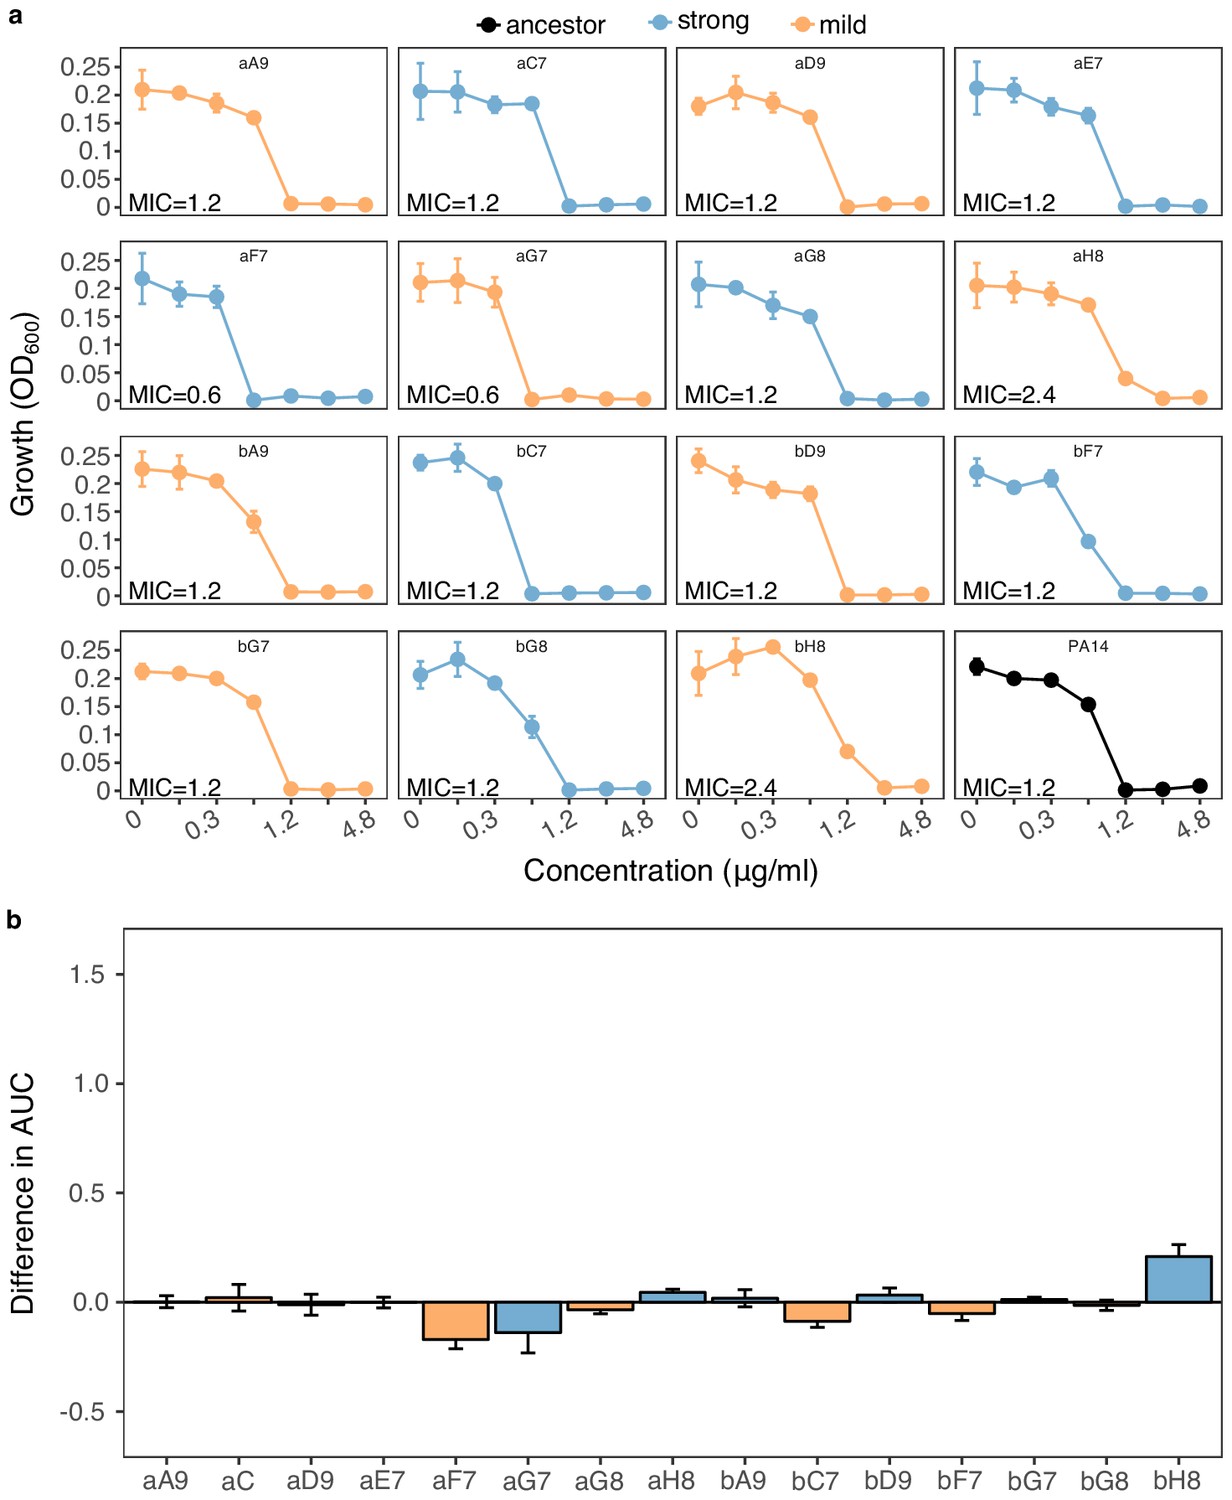
Re-sensitization to gentamicin (GEN) upon adaptation to carbenicillin (CAR).
We calculated (a) dose-response relationships against GEN of 15 populations adapted to strong (n = 7, light blue) and mild (n = 8, light orange) drug increases compared to the PA14 ancestor (black, bottom-right panel). Mean ±CI95, n = 3 technical replicates. In most cases, the evolved population had the same MIC as PA14. Two populations (aF7 and aG7) showed lower MICs than PA14, while two (aH8 and bH8) showed slightly higher ones. The labels within each graph correspond to the code used during experimental evolution. Data from Source Data 4 (b) Difference in the area under the curve (AUC) between each evaluated population and the PA14 ancestor. Scaling of the y-axis is equivalent to Figure 3d. None of the populations was significantly different from the ancestor (Wilcoxon’s test, n = 3, adjusted P values min > 0.4, and max <0.9). The data for this figure are provided in Figure 3—figure supplement 2—source data 1; Figure 3—figure supplement 2—source data 2.
-
Figure 3—figure supplement 2—source data 1
Dose-response curves data of surviving populations adapted to unconstrained environments (strong and mild), as well as the PA14 wild type against GEN.
The data is shown in Figure 3—figure supplement 2. Each population-drug concentration was evaluated in triplicate.
- https://cdn.elifesciences.org/articles/51481/elife-51481-fig3-figsupp2-data1-v2.txt
-
Figure 3—figure supplement 2—source data 2
Change in resistance of populations adapted to unconstrained environments (strong and mild) relative to the PA14 wild type against GEN.
The data is shown in Figure 3—figure supplement 2. The resistance change was inferred by calculating the difference between the evolved populations and the PA14 wild type in the AUC across drug concentrations.
- https://cdn.elifesciences.org/articles/51481/elife-51481-fig3-figsupp2-data2-v2.txt
Figure 4
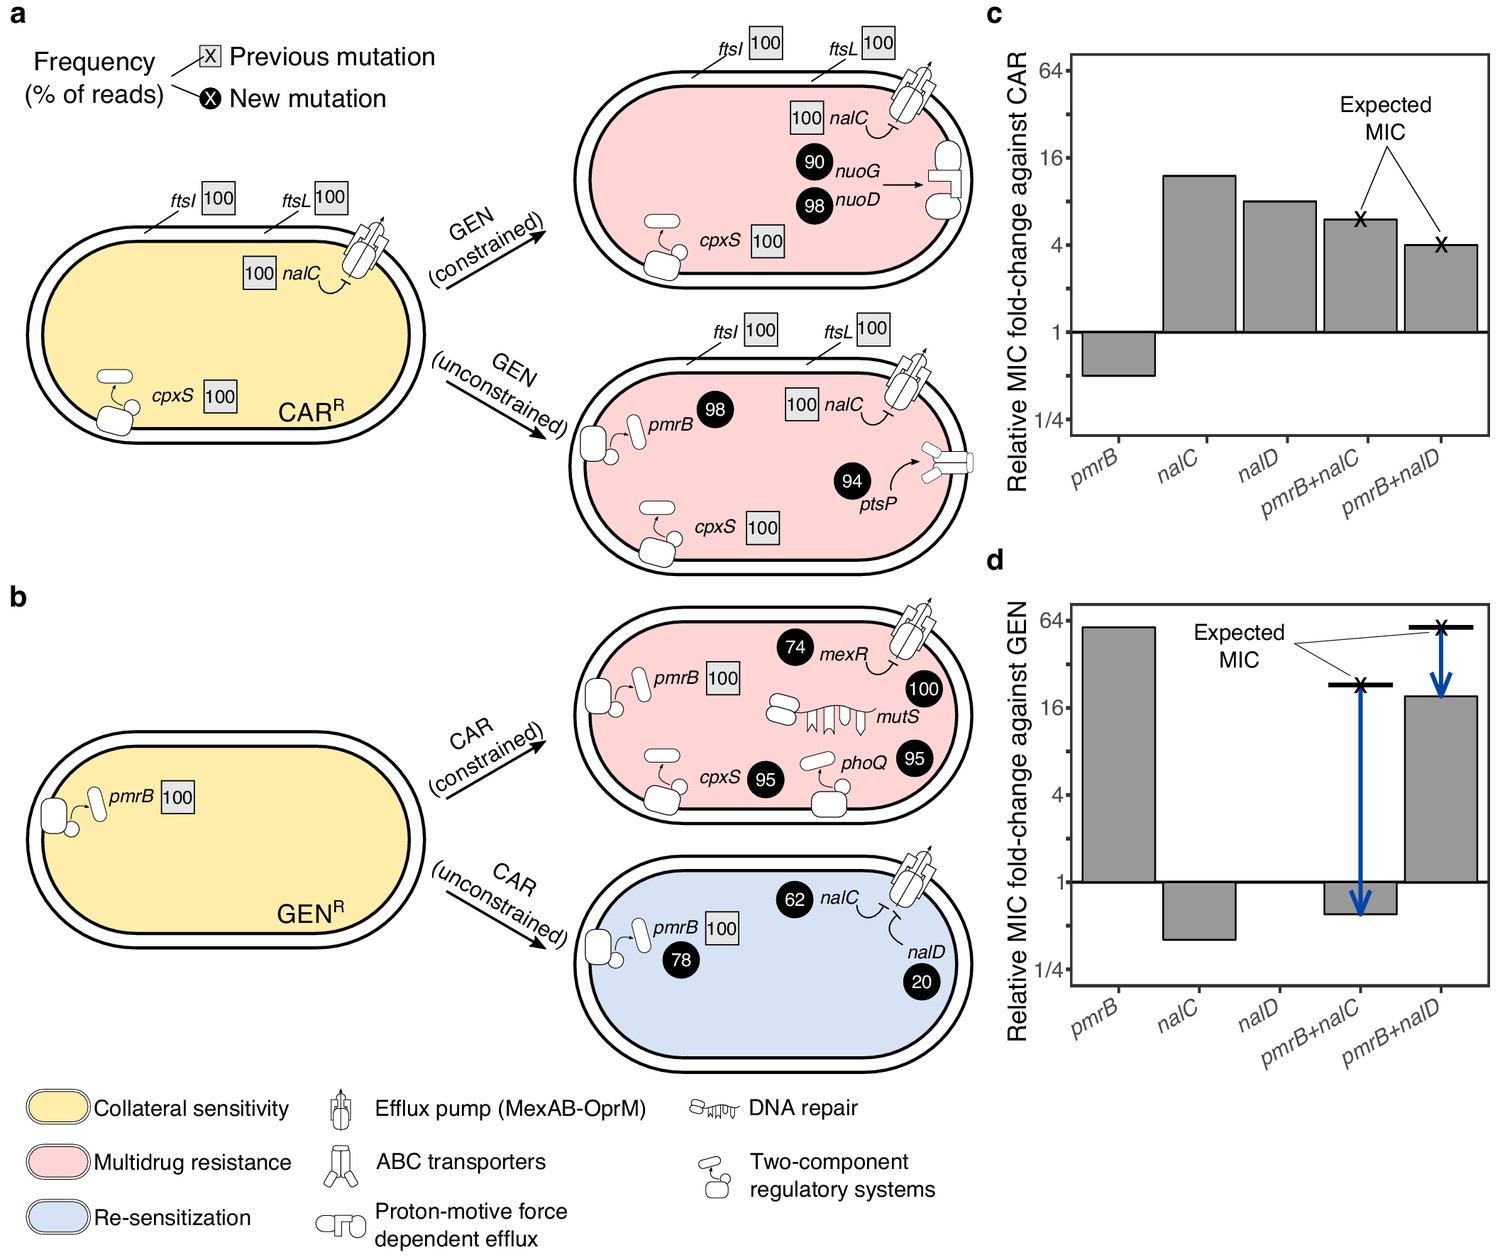
Genomics of experimental evolution for the CAR/GEN drug pair.
(a) Most relevant genomic changes in CAR-resistant populations selected with GEN, and (b) GEN-resistant populations selected with CAR. Square symbols next to gene names indicate ancestral resistance mutations (obtained from Barbosa et al., 2017), and circles indicate newly acquired mutations. The numbers inside these symbols indicate variant frequencies (as inferred by the percentage of reads in population genomics data) and correspond to the lowest frequency found among the sequenced populations from the respective treatment. The evolved resistance phenotype is highlighted by color shading (see legend in bottom left). (c) MIC relative to PA14 against CAR and (d) GEN, of single and double mutant strains. The cross and bold horizontal lines indicate the MIC as expected by addition of the individual effects. Blue arrows highlight epistatic effects. The following supplementary source data is available for Figure 4: Figure 4—source data 1; Figure 4—source data 2.
-
Figure 4—source data 1
Genetic changes compared to Pseudomonas aeruginosa PA14 wild type strain as determined by whole-genome resequencing.
Sequencing was performed with Illumina MiSeq2 × 150 bp PE, Nextera libraries. The data is shown in Figure 4. Isolates are coded with AA-BB-CC-: AA, antibiotic to which they are originally resistant; BB, antibiotic to which the clone shows collateral sensitivity; CC, well in the plate during experimental evolution.
- https://cdn.elifesciences.org/articles/51481/elife-51481-fig4-data1-v2.txt
-
Figure 4—source data 2
MIC values for several constructed mutants against CAR and GEN, as reported in Figure 4.
- https://cdn.elifesciences.org/articles/51481/elife-51481-fig4-data2-v2.txt
Figure 5 with 1 supplement

Evolutionary stability of collateral sensitivity in a larger set of drug switches.
(a) Fourteen collateral sensitivity treatments were tested using 38 distinct resistant populations as starting points. The resistant populations differed with respect to the effect size of collateral sensitivity. The left panel illustrates the treatment directions and effect size variation in different shades of purple, while the right panel shows a quantitative presentation of effect size variation. (b) Total extinction events, and endpoint resistance changes to drug A (here labeled OLD) and B (here labeled NEW) after treatment with drug B using strong concentration increases in the absence (strong) or the presence of drug A (strong + constrained). Mean ±CI95, n = 1–6 biological replicates (differences due to extinction). Asterisks indicate significant changes in resistance (one-sample t-test, µ = 0, FDR-adjusted probabilities). CS, collateral sensitivity; CAR, carbenicillin; GEN, gentamicin; PIT, piperacillin with tazobactam; STR, streptomycin; CIP, ciprofloxacin; CEF, cefsulodin; superscript R denotes resistance. The following supplementary figure, tables and source data are available for Figure 5: Figure 5—figure supplement 1, Supplementary file 1-Figure 5–supplementary tables 1-2, Figure 5—source data 1, Figure 5—source data 2, Figure 5—source data 3, and Figure 5—figure supplement 1—source data 1.
-
Figure 5—source data 1
Effect size of tested collateral sensitivities.
- https://cdn.elifesciences.org/articles/51481/elife-51481-fig5-data1-v2.txt
-
Figure 5—source data 2
Extinction of experimentally evolved populations.
- https://cdn.elifesciences.org/articles/51481/elife-51481-fig5-data2-v2.txt
-
Figure 5—source data 3
Evolved resistance changes of experimentally evolved populations.
- https://cdn.elifesciences.org/articles/51481/elife-51481-fig5-data3-v2.txt
Figure 5—figure supplement 1
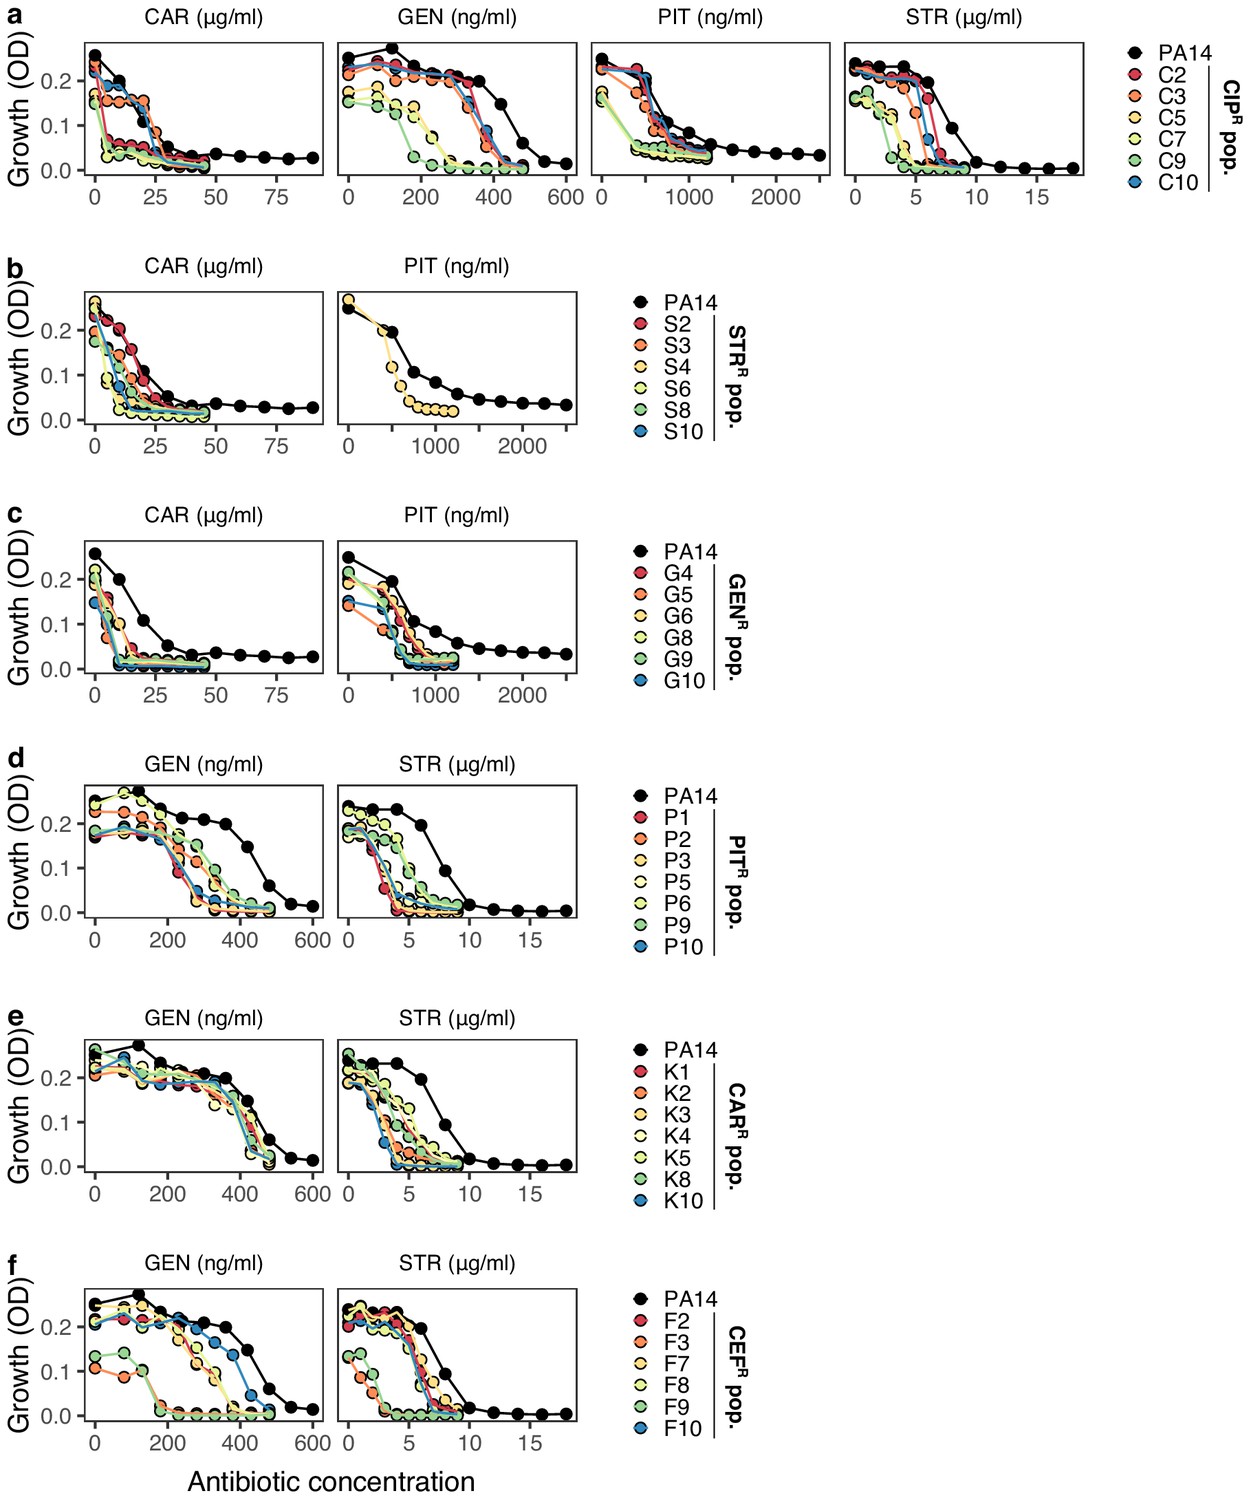
Collateral sensitivity.
Validated collateral sensitivity for 38 distinct populations obtained from Barbosa et al. (2017). Six to seven populations resistant to CIP, (a); STR, (b); GEN, (c); PIT, (d); CAR, (e); and CEF, (f), were tested for collaterals sensitivity against 2 or four drugs, indicated above each of the panels. The ancestor PA14 is shown in black and the various populations in distinct colors. Points indicate averages of 3 technical replicates per population and drug concentration. CAR, carbenicillin; GEN, gentamicin; STR, streptomycin; PIT, piperacillin with tazobactam; CIP, ciprofloxacin; and CEF, cefsulodin; superscript R denotes resistance against the particular drug. The data for this figure is provided in Figure 5—figure supplement 1—source data 1.
-
Figure 5—figure supplement 1—source data 1
Dose-response curves data of surviving populations in the generalized experiment.
The data is shown in Figure 5—figure supplement 1 and summarized in Figure 5. Optical density values were recorded after 12 hr of incubation at 37 °C.
- https://cdn.elifesciences.org/articles/51481/elife-51481-fig5-figsupp1-data1-v2.txt
Figure 6
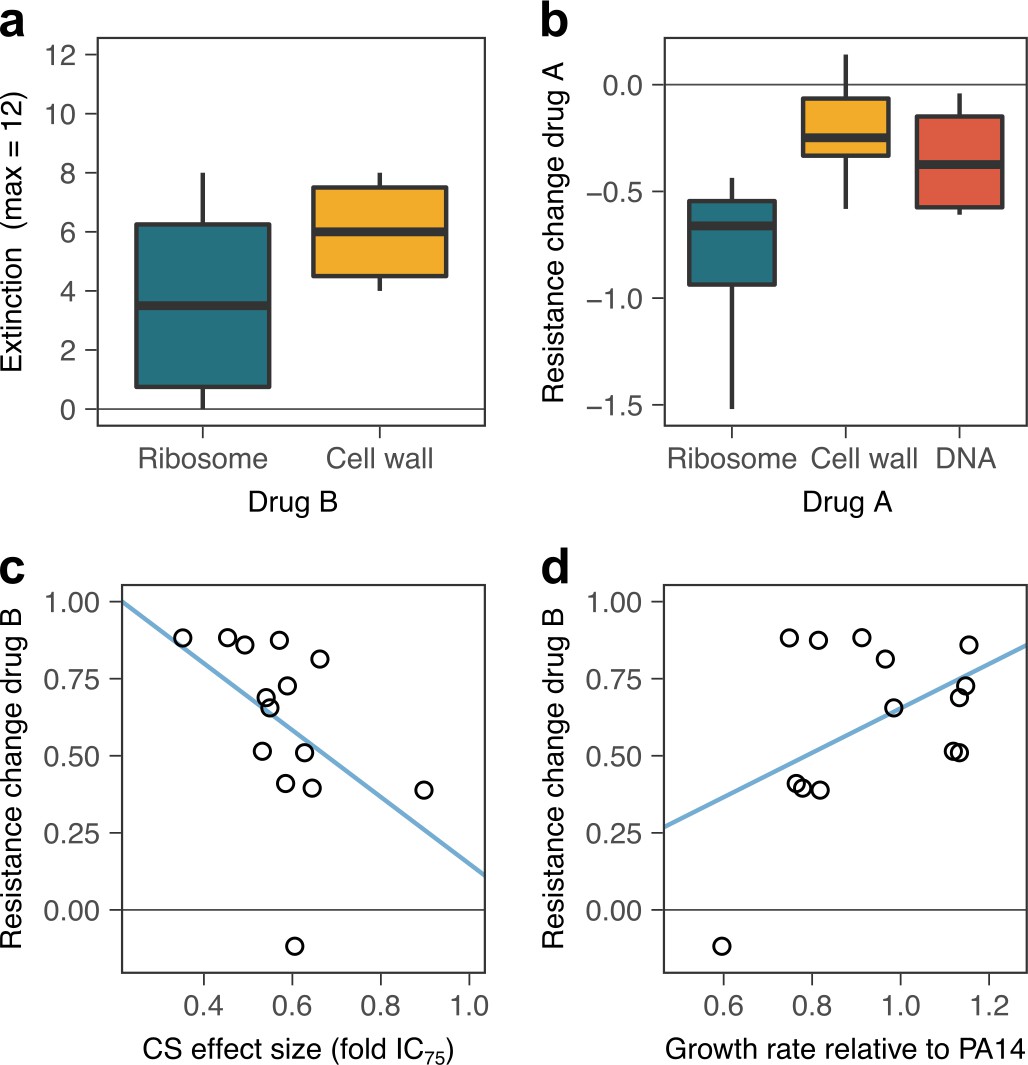
Predictors of evolutionary stability of collateral sensitivity in a larger set of drug switches.
(a) Extinction was more likely when treatment was switched to β-lactam antibiotics that target the cell wall, as compared to aminoglycoside antibiotics that target ribosomes (box plot, n = 6 drug switches for ribosome, n = 8 treatments for the cell wall). Combined extinction events from both treatment groups are reported. (b) Surviving, evolved lineages showed stronger re-sensitization when the first antibiotic targeted the ribosome (box plot, n = 4 drug switches starting with ribosome inhibition, n = 4 drug switches starting with cell-wall inhibition, and n = 6 drug switches starting with DNA gyrase inhibition). (c) Evolution of new resistance was significantly positively associated with the average effect size of collateral sensitivity, as measured by fold-change of IC75. Values of sensitivity increase to the left. (d) Average initial growth rate were significantly associated with the resistance gains, with low resistance gains associated with large general adaptation trade-offs. CS, collateral sensitivity. Blue lines in c and d provide an illustration of the linear association between the respective variables. The following supplementary tables and source data are available for (Figure 6: Supplementary file 1-Figure 6-supplementary tables 1-2, and Figure 6—source data 1; Figure 6—source data 2).
-
Figure 6—source data 1
Summary of total extinction in the generalized experiment in relation to average initial collateral sensitivity effects and average growth rate.
Average collateral sensitivity effects are given as fold change IC75, fold change IC90, and AUC relative to PA14. The data is derived from that shown in Figure 5.
- https://cdn.elifesciences.org/articles/51481/elife-51481-fig6-data1-v2.txt
-
Figure 6—source data 2
Summary of average resistance changes in the generalized experiment in relation to average initial collateral sensitivity effects and average growth rate.
Average initial collateral sensitivity effects are given as fold change IC75, fold change IC90, and AUC relative to PA14). The data is derived from that shown in Figure 5.
- https://cdn.elifesciences.org/articles/51481/elife-51481-fig6-data2-v2.txt
Additional files
-
Supplementary file 1
File with all supplementary tables.
- https://cdn.elifesciences.org/articles/51481/elife-51481-supp1-v2.docx
-
Transparent reporting form
- https://cdn.elifesciences.org/articles/51481/elife-51481-transrepform-v2.docx
Download links
A two-part list of links to download the article, or parts of the article, in various formats.
Downloads (link to download the article as PDF)
Open citations (links to open the citations from this article in various online reference manager services)
Cite this article (links to download the citations from this article in formats compatible with various reference manager tools)
Evolutionary stability of collateral sensitivity to antibiotics in the model pathogen Pseudomonas aeruginosa
eLife 8:e51481.
https://doi.org/10.7554/eLife.51481


