Modulation of the Erwinia ligand-gated ion channel (ELIC) and the 5-HT3 receptor via a common vestibule site
- Laboratory of Structural Neurobiology, Department of Cellular and Molecular Medicine, Faculty of Medicine, KU Leuven, Belgium
- Laboratory for the Structure and Function of Biological Membranes, Center for Structural Biology and Bioinformatics, Université libre de Bruxelles, Belgium
- HiQscreen, Switzerland
- Department of Biochemistry, University of Cambridge, United Kingdom
- Department of Neuroscience, University of Texas Southwestern Medical Center, United States
- Department of Biophysics, University of Texas Southwestern Medical Center, United States
- Structural Biology Brussels, Vrije Universiteit Brussel, Belgium
- VIB-VUB Center for Structural Biology, VIB, Belgium
Figures
Figure 1 with 3 supplements
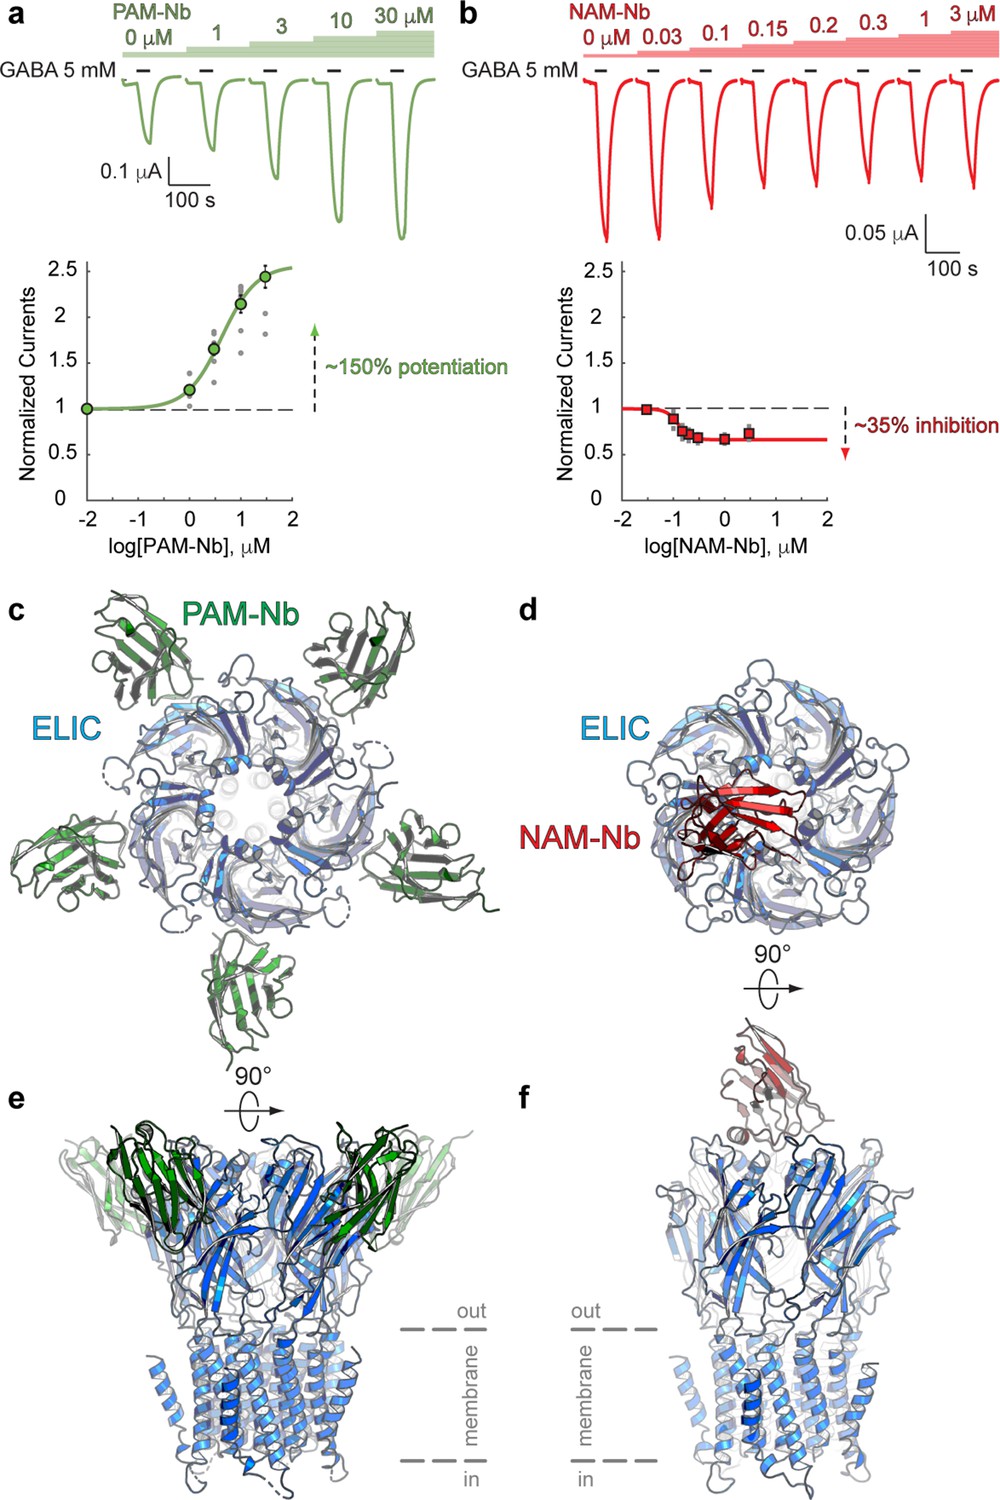
Nanobodies active as allosteric modulators and structures bound to the ELIC channel.
(a, b) Electrophysiological recordings of ELIC activated by the agonist GABA and in the presence of increasing concentrations of PAM-Nb (a, green) or NAM-Nb (b, red). The curve represents a fit to the Hill equation to the normalized current responses. Circles represent averaged data with standard errors. (c,d) X-ray crystal structures of ELIC bound by PAM-Nb (c) or NAM-Nb (d). The cartoon representation shows a top-down view onto the ELIC pentamer along the fivefold axis (blue). (e,f) Side views from c,d). The dashed lines indicate the presumed location of the membrane boundaries.
-
Figure 1—source data 1
Electrophysiological recordings of ELIC with PAM-Nb and NAM-Nb.
- https://cdn.elifesciences.org/articles/51511/elife-51511-fig1-data1-v2.xlsx
Figure 1—figure supplement 1
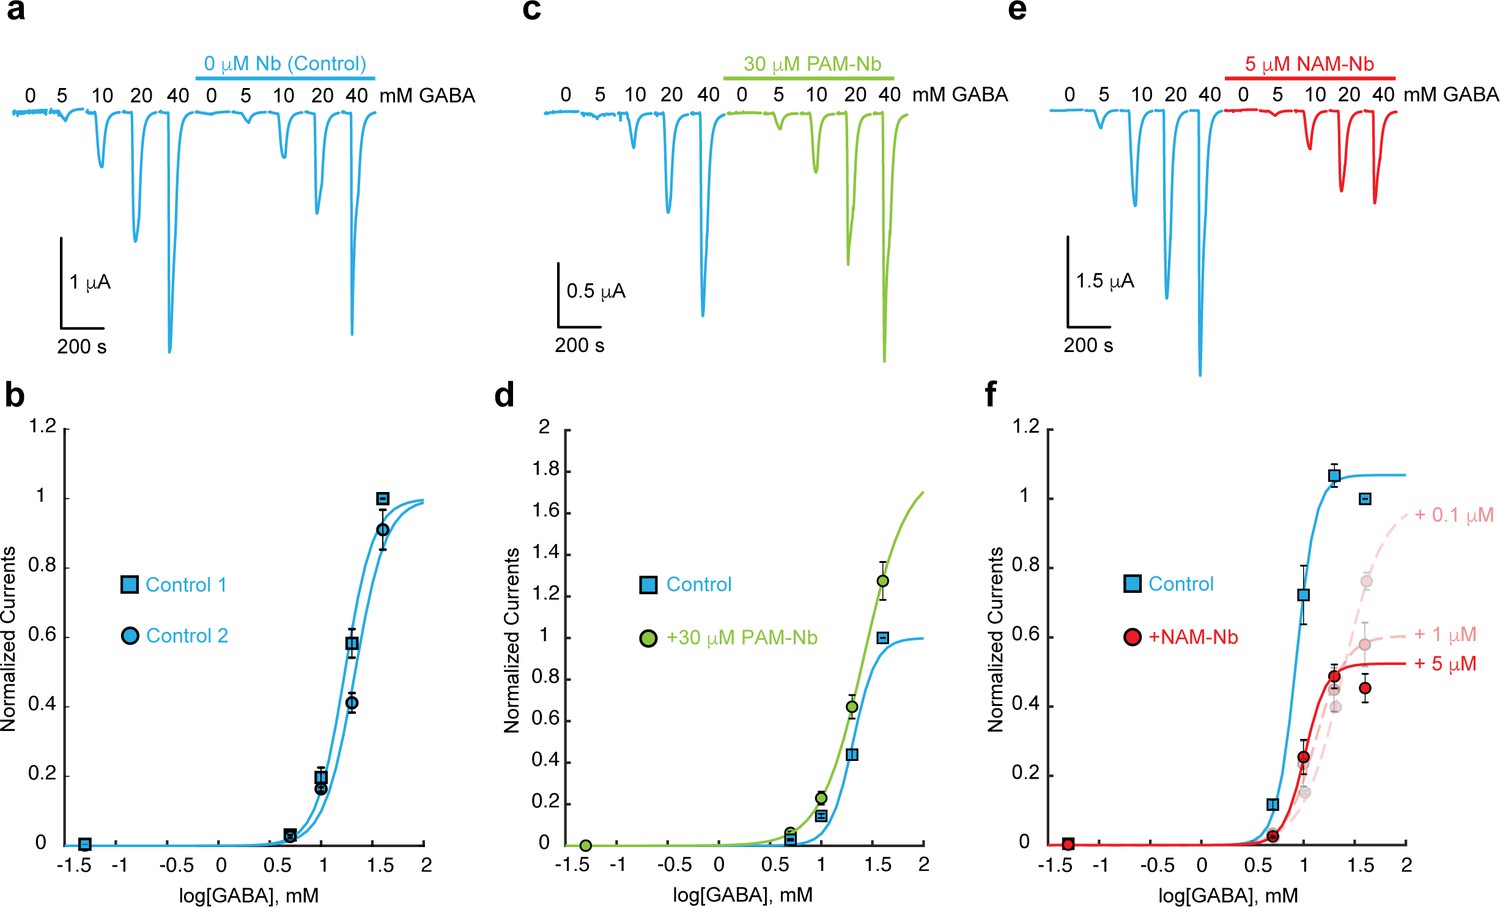
The effect of PAM-Nb and NAM-Nb on the GABA concentration-activation curve.
(a) An example control experiment with two consecutive applications of a series of GABA concentrations (5–40 mM). ELIC is prone to desensitization, but this effect can be minimized by excluding GABA concentrations > 40 mM. (b) Concentration-response curves for three such experiments are similar. (c,d) 30 μM PAM-Nb shows potentiation at all GABA concentrations (example traces in c), consistent with a leftward shift of the concentration-activation curve and/or increase of the maximal current (curves in d), n = 3). By excluding saturating concentrations of GABA we cannot accurately calculate EC50-values, but we can determine nanobody potentiation or inhibition at each GABA concentration under conditions with minimal channel desensitization. Here, currents in the presence and absence of 30 μM PAM-Nb were significantly different (t-test) with p-values of 0.0081 (5 mM), 0.0495 (10 mM), 0.0193 (20 mM) and 0.0455 (40 mM) (n = 3). Under control conditions p-values were 0.0012 (5 mM), 0.0013 (10 mM), <0.0001 (20 mM) and <0.0001 (40 mM) (n = 3). (e,f) Increasing concentrations of NAM-Nb (0.1, 1, 5 μM, example traces in e) show inhibition at all GABA concentrations, consistent with a rightward shift of the concentration-activation curve and/or decrease of the maximal current (curves in f), n = 5). Currents in the presence and absence of 5 mM NAM-Nb were significantly different (t-test) with p-values of 0.0012 (5 mM), 0.0013 (10 mM), <0.0001 (20 mM) and <0.0001 (40 mM) (n = 5).
-
Figure 1—figure supplement 1—source data 1
ELIC concentration-activation curves in the presence of PAM-Nb and NAM-Nb.
- https://cdn.elifesciences.org/articles/51511/elife-51511-fig1-figsupp1-data1-v2.xlsx
Figure 1—figure supplement 2
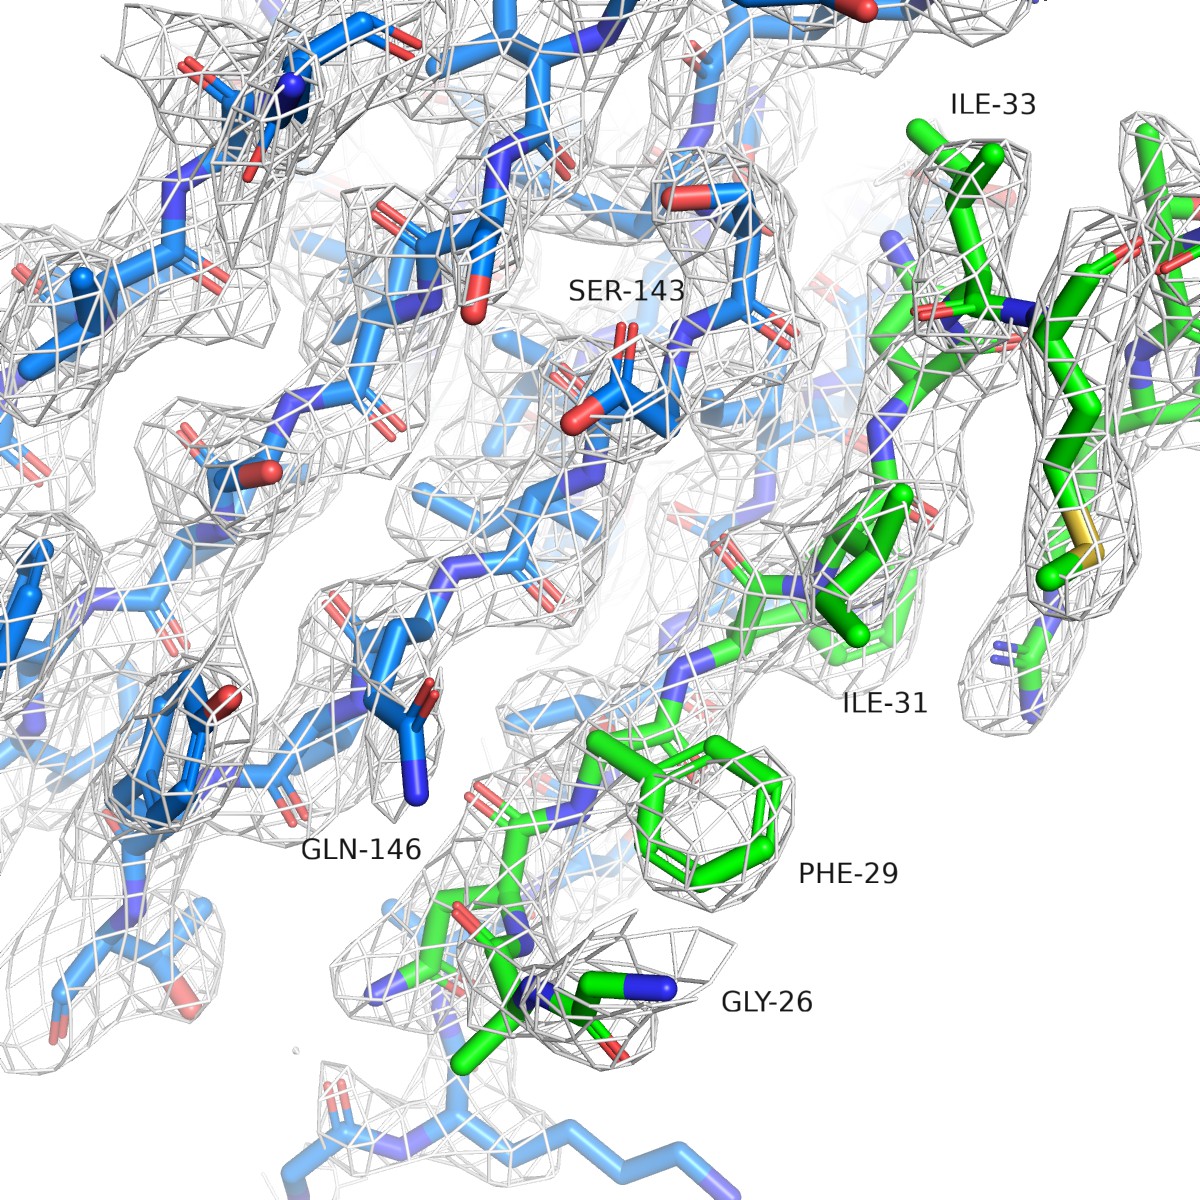
Simulated annealing omit map for PAM-Nb ELIC structure.
The white mesh shows a simulated annealing omit map calculated in PHENIX and contoured at a sigma level of 1.0 around a 12 Å sphere zoom of the ELIC-Nb interface. In the omit calculation an omit box around the entire chain F (green) of the PAM-Nb was selected. ELIC is shown in blue and selected residues of the interaction interface are indicated.
Figure 1—figure supplement 3
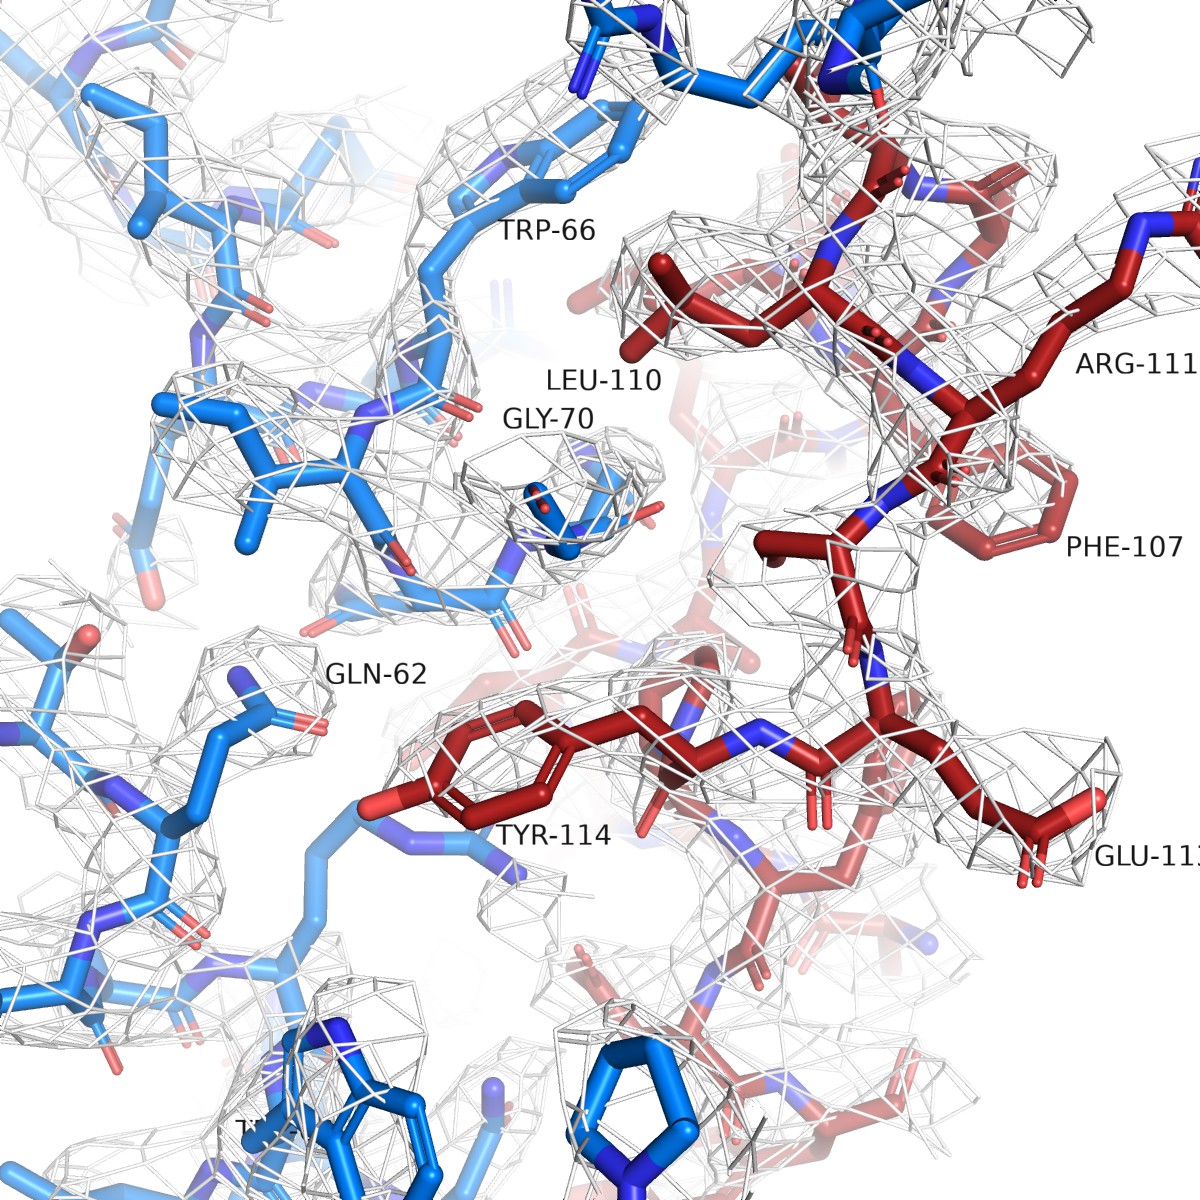
Simulated annealing omit map for NAM-Nb ELIC structure.
The white mesh shows a simulated annealing omit map calculated in PHENIX and contoured at a sigma level of 1.0 around a 12 Å sphere zoom of the ELIC-Nb interface. In the omit calculation, an omit box around the entire chain K (red) of the PAM-Nb was selected. ELIC is shown in blue and selected residues of the interaction interface are indicated.
Figure 2 with 3 supplements
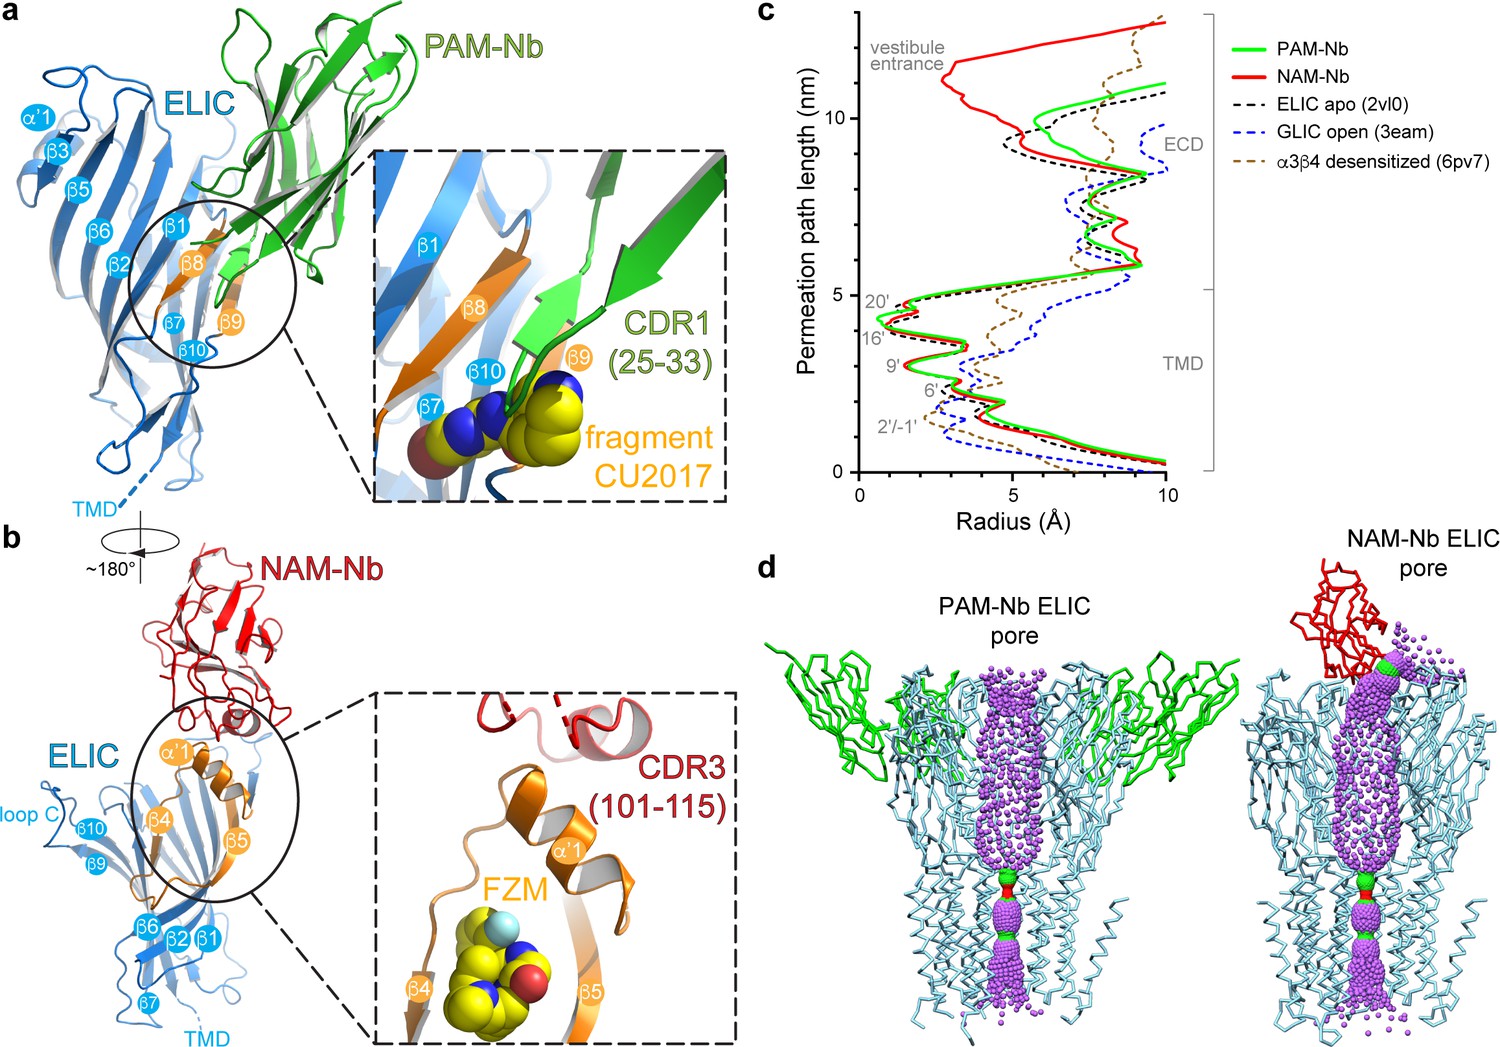
Detailed nanobody interaction sites in ELIC and channel pore analysis.
(a) A detailed view of the interaction between PAM-Nb (green) and a single ELIC subunit (blue). The binding site for PAM-Nb overlaps with a known allosteric binding site, in a related pLGIC, for a small molecule fragment called CU2017, shown as spheres (carbon yellow, nitrogen blue) (Delbart et al., 2018; pdb code 5oui). (b) Detailed view of the interaction between NAM-Nb (red) and a single ELIC subunit (blue). The binding site for NAM-Nb involves a region which borders a known allosteric binding site for flurazepam in ELIC (Spurny et al., 2012; pdb code 2yoe). (c,d) Analysis of the ELIC channel pore radius for PAM-Nb, NAM-Nb bound structures and references structures.
-
Figure 2—source data 1
Analysis of pore radius profiles.
- https://cdn.elifesciences.org/articles/51511/elife-51511-fig2-data1-v2.xlsx
Figure 2—figure supplement 1
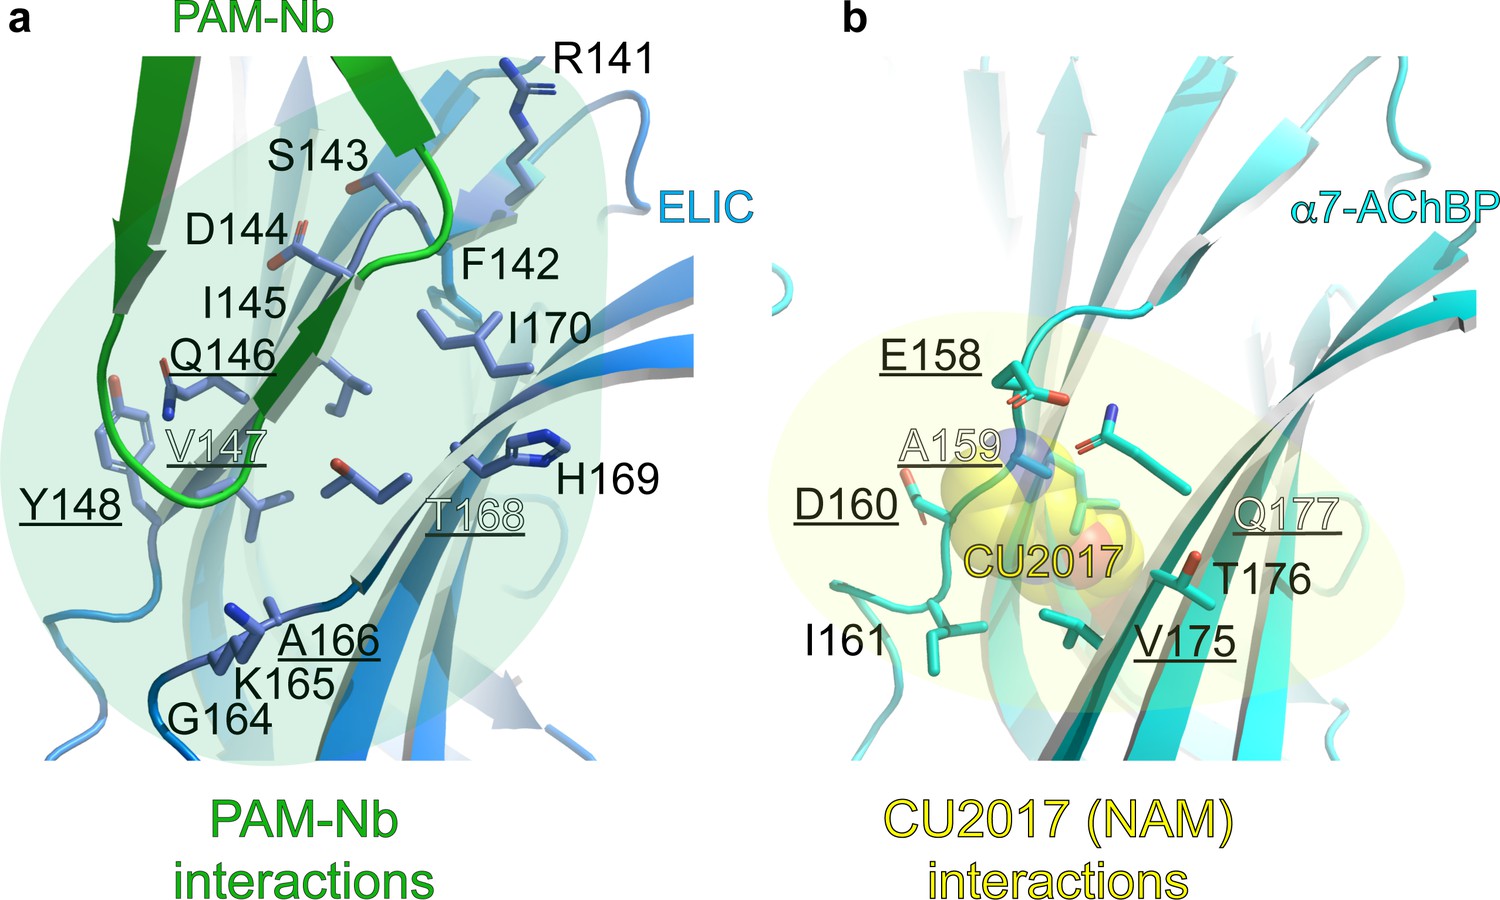
Detailed atomic interactions between PAM-Nb and ELIC, compared to those between CU2017 (a NAM molecule) and α7-AChBP (Delbart et al., 2018).
(a–b) The cartoon shows that the binding site of the PAM-Nb (green) in ELIC (blue) (a) is homologous to the CU2017 (yellow spheres) site in α7-AChBP (cyan) (b). For clarity, only residues at the receptor site are shown as sticks. Residues that are commonly targeted in both structures are underlined: Q146, V147, Y148 (in ELIC) corresponds to E158, A159, D160 (in α7-AChBP) and A166, T168 (in ELIC) corresponds to V175, Q177 (in α7-AChBP). ELIC residues involved in unique interactions with PAM-Nb are: R141, F142, S143, D144, I145, G164, K165, H169, I170 and these could possibly mediate positive allosteric modulation. α7-AChBP residues involved in unique interactions with NAM-Nb are: I161 and T176, and these could possibly mediate negative allosteric modulation. See Figure 2—figure supplement 1—source data 1 for list of detailed atomic interactions. 3.8 Å was used as a distance cutoff for interactions. H-bond interactions are shown in bold in the associated source file.
-
Figure 2—figure supplement 1—source data 1
List of amino acid interactions in the PAM-Nb bound ELIC structure versus CU2017 bound alpha7-AChBP structure.
- https://cdn.elifesciences.org/articles/51511/elife-51511-fig2-figsupp1-data1-v2.xlsx
Figure 2—figure supplement 2
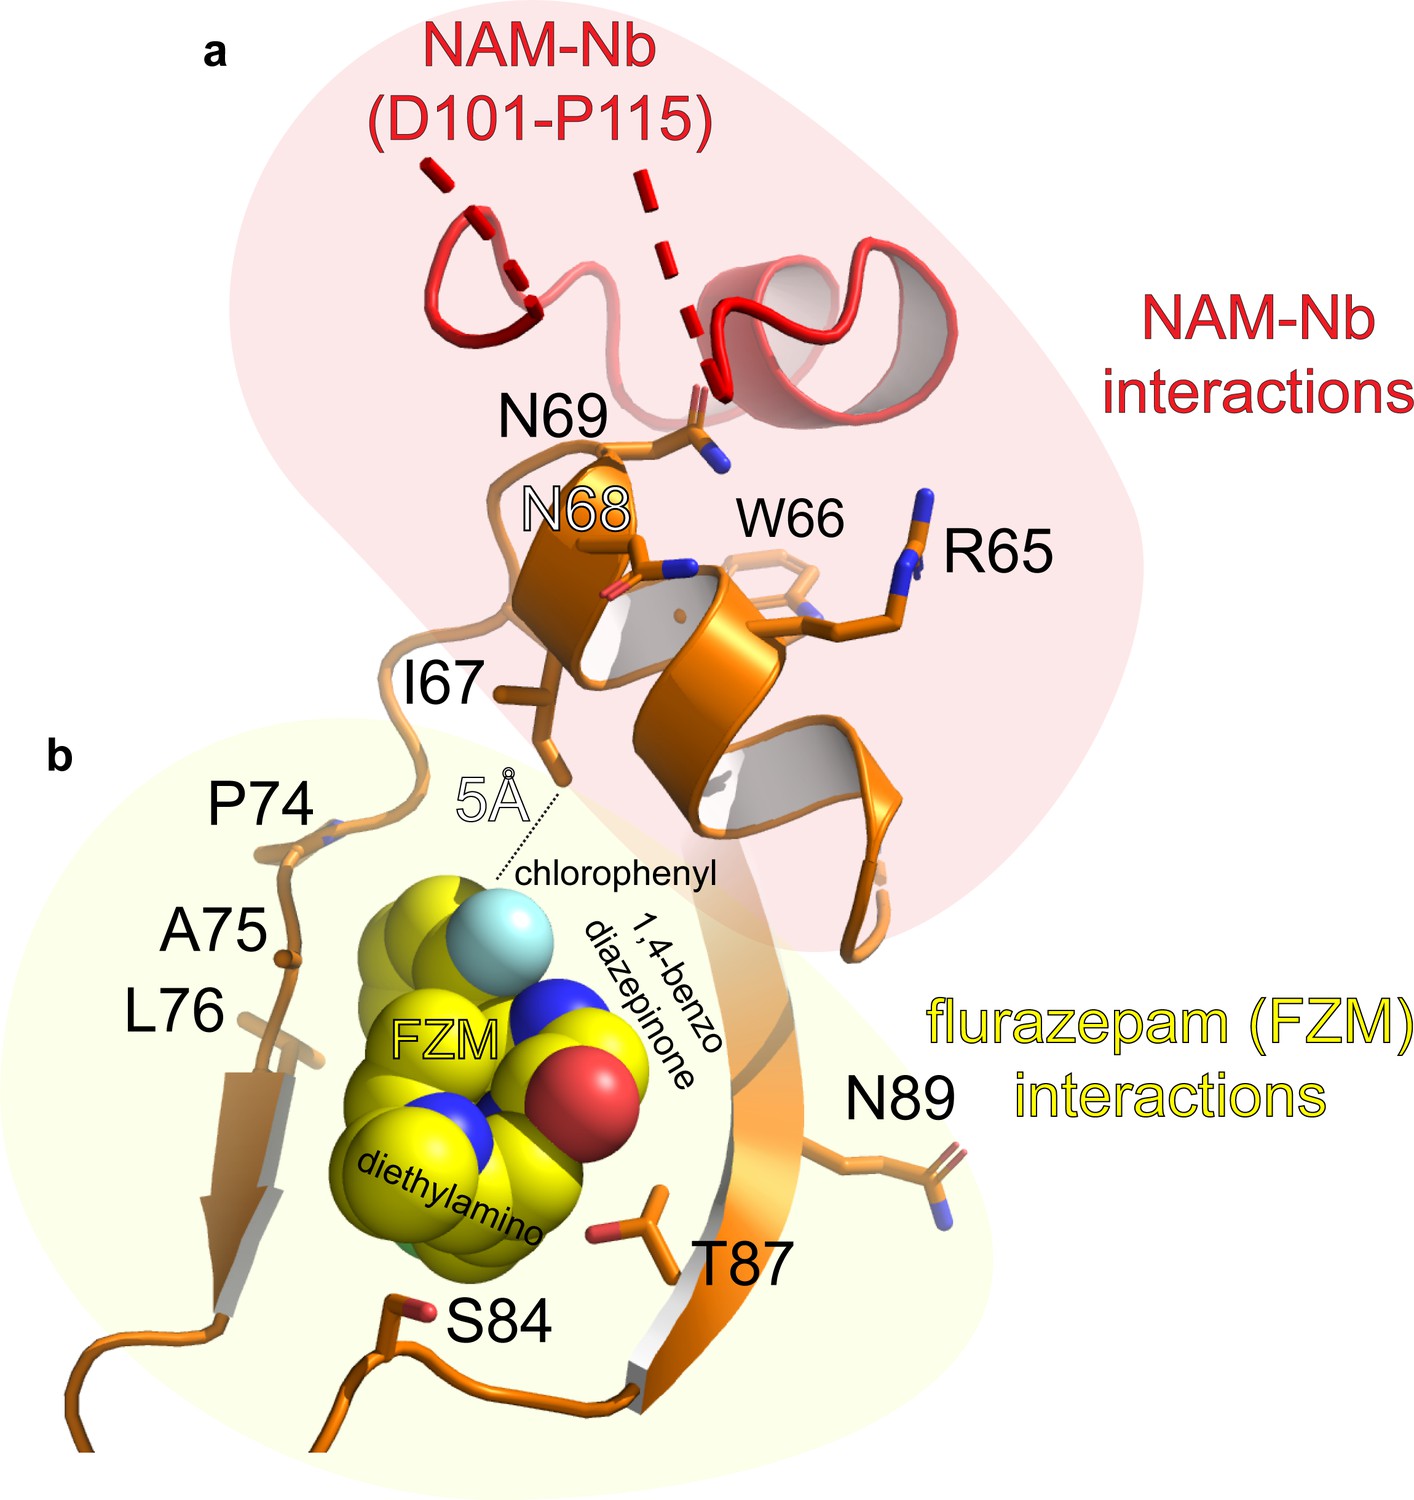
Detailed atomic interactions between NAM-Nb and ELIC, compared to those between flurazepam (a PAM molecule) and ELIC (Spurny et al., 2012).
(a) The cartoon shows that the binding site of the NAM-Nb (red) is adjacent to the flurazepam site (yellow spheres) in the vestibule of ELIC (orange). For clarity, only residues at the receptor site are shown as orange sticks. (b) See Figure 2—figure supplement 2—source data 1 for list of detailed atomic interactions. 3.8 Å was used as a distance cutoff for interactions. H-bonds and electrostatic interactions are shown in bold in the associated source file. The residues in the α’1-helix in ELIC (R65–N69) could be involved in negative allosteric modulation whereas P74-N89 in ELIC could be involved in positive allosteric modulation.
-
Figure 2—figure supplement 2—source data 1
List of amino acid interactions in the NAM-Nb bound ELIC structure versus flurazepam bound ELIC structure.
- https://cdn.elifesciences.org/articles/51511/elife-51511-fig2-figsupp2-data1-v2.xlsx
Figure 2—figure supplement 3
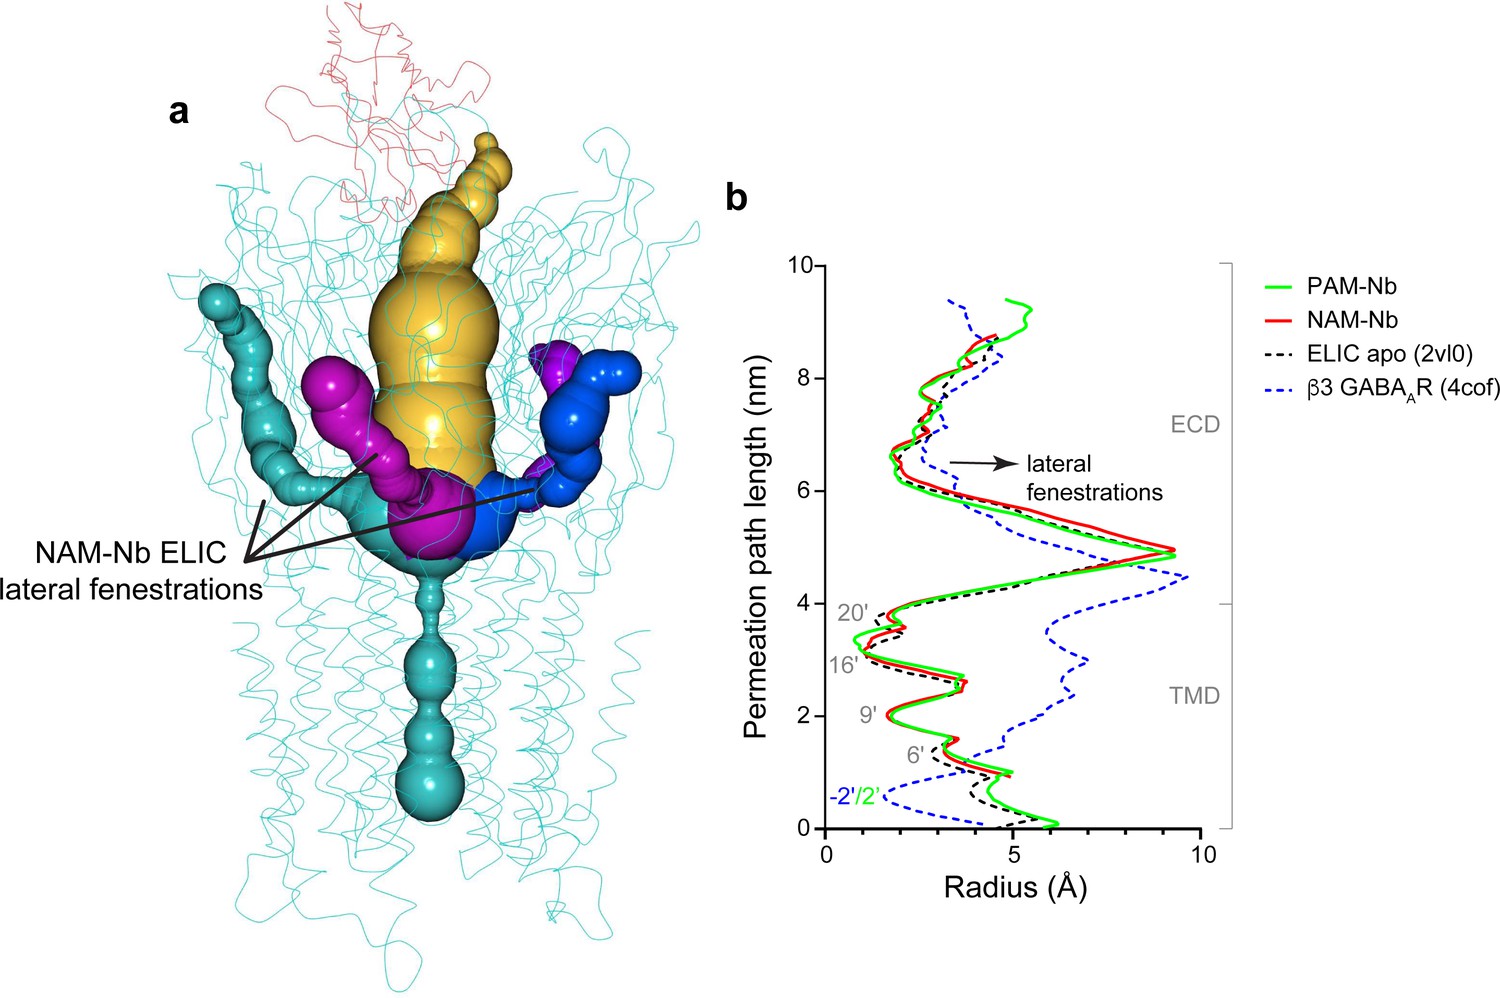
Analysis of pore radius profiles through lateral fenestrations located at subunit interfaces in ELIC and the β3 GABAAR (Miller and Aricescu, 2014).
(a) Pore radius profiles extending into lateral fenestrations (green, magenta, blue) at subunit interfaces or the extracellular vestibule entrance (amber) in the NAM-Nb bound structure. (b) Pore radius plotted along the permeation path and compared for ELIC apo (black), PAM-Nb bound ELIC structure (green), NAM-Nb bound ELIC structure (red) and β3 GABAAR (blue).
Figure 3 with 1 supplement
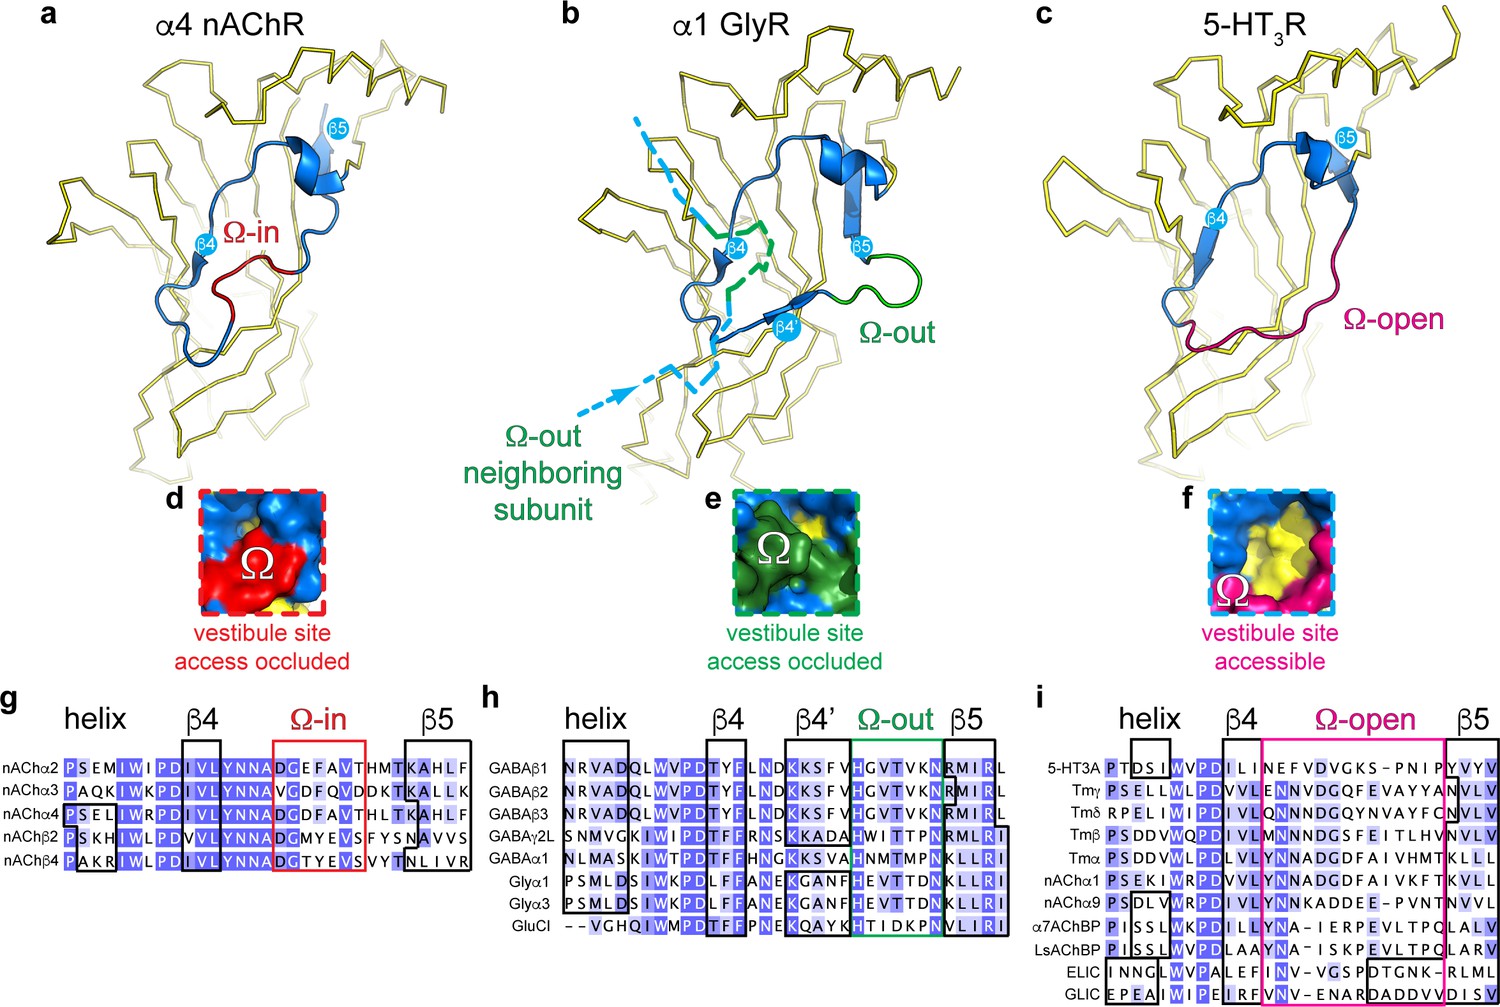
Distinct conformations of the vestibule site in pentameric ligand-gated ion channels.
(a–c) Yellow ribbon representation of a single subunit ligand binding domain. Part of the vestibule site (shown in blue cartoon), called the Ω-loop, adopts three distinct conformations in different pLGICs: the Ω-in (red, (a), Ω-out (green, (b) and Ω-open conformation (magenta, (c). (d-f) Insets show a zoom of the Ω-loop in surface representation to illustrate occluded vestibule site access in the Ω-in and Ω-out conformations, compared to an accessible vestibule site in the Ω-open conformation. (g–i). Sequence alignment of the Ω-loop and neighboring residues in pLGICs for which structures have been elucidated.
Figure 3—figure supplement 1
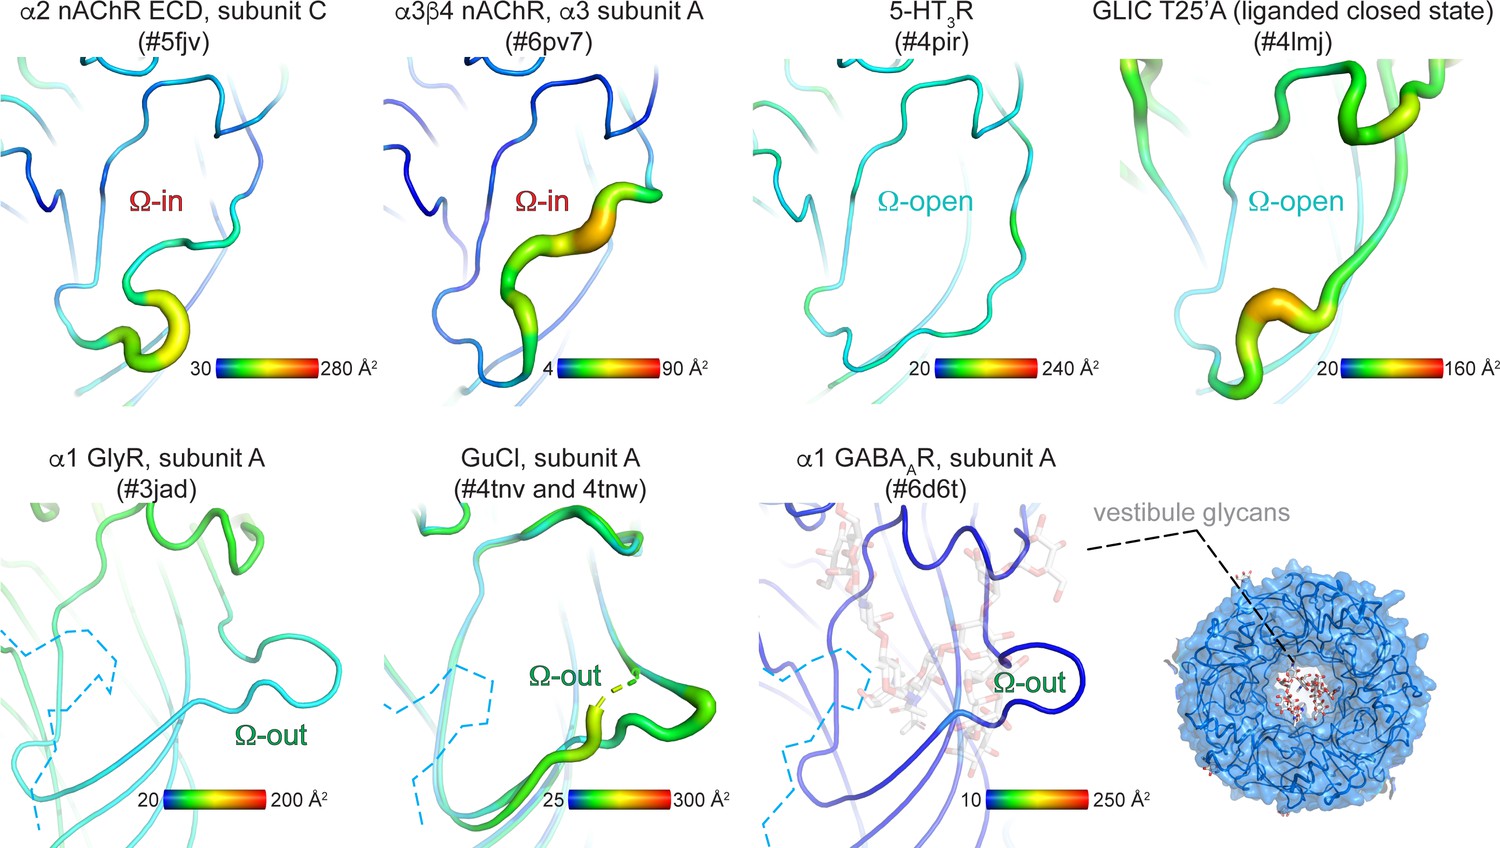
B-factor analysis of the Ω-loop compared to other regions within each structure.
The vestibule site is depicted in the ‘putty’ cartoon presentation. Yellow-red regions indicate example structures with higher average B-factors per residue compared to cyan-blue regions. B-factors are an indicator of vibrational movement. Enhanced B-factors were not identified in any 5-HT3R (Ω-open), GlyR (Ω-out) or GABAAR (Ω-out) structures determined to date. In GABAAR structures the vestibule access is additionally restricted by N-linked glycans.
Figure 4
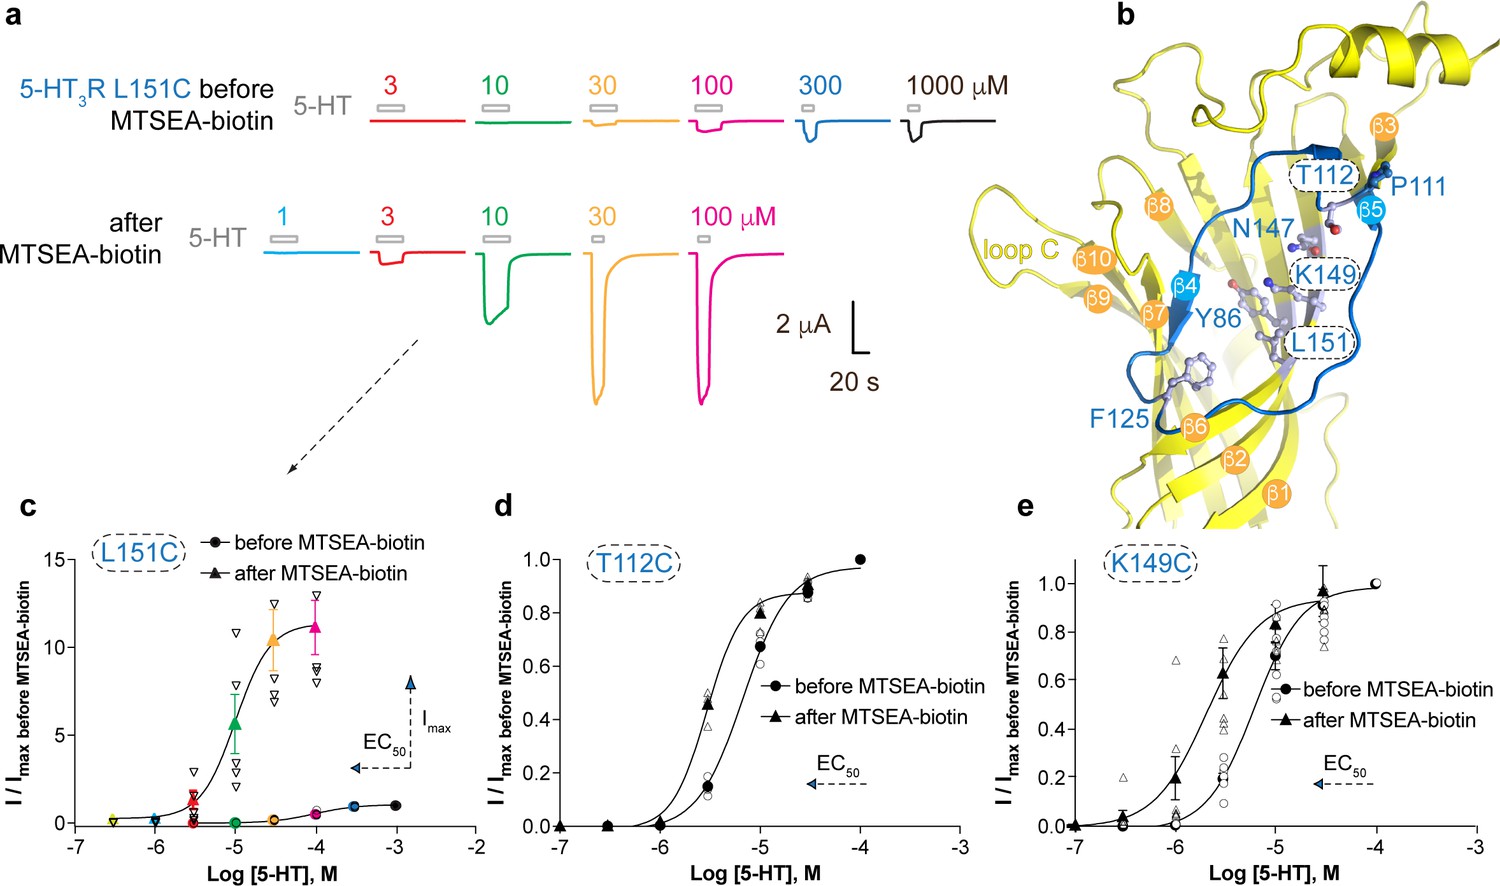
Allosteric modulation of the 5-HT3A receptor through chemical modification of engineered cysteines in the vestibule site.
(a) Example traces of agonist-evoked channel responses of the L151C 5-HT3AR mutant before and after modification with MTSEA-biotin show potentiation after cysteine modification. (b) Location of L151C and other engineered cysteine mutants in this study, shown in ball and stick representation. (c) Concentration-activation curves before and after modification with MTSEA-biotin are a Hill curve fit for the recordings shown in (a) as well as additional data for T112C (d) and K149C. (c–e) Each of these three mutants reveal a leftward shift of the curve upon cysteine modification, consistent with a positive allosteric effect. In the case of L151C, this effect is combined with a large increase of the maximal current response.
-
Figure 4—source data 1
Electrophysiological recordings of 5-HT3R mutants before and after treatment with MTSEA-biotin.
- https://cdn.elifesciences.org/articles/51511/elife-51511-fig4-data1-v2.xlsx
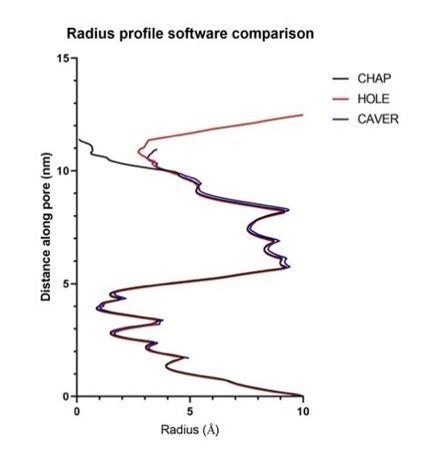
Author response image 1
Tables
Key resources table
| Reagent type (species) or resource | Designation | Source or reference | Identifiers | Additional information |
|---|---|---|---|---|
| Gene | Erwinia ligand-gated ion channel (ELIC) | Synthetic gene from Genscript | UniProt P0C7B7 | |
| Gene | Human 5-hydroxytryptamine receptor 3A (5-HT3A R) | John Peters laboratory (Belelli et al., 1995) | GenBank NM_000869 | |
| Cell line | C43 E. coli strain | Lucigen | #60446 | |
| Cell line | WK6 E. coli strain | Zell and Fritz, 1987 | ||
| Cell line | TG1 E. coli strain | Lucigen | #60502 | |
| Antibody | PAM-Nb | Nanobody obtained by immunizing an adult llama glama with recombinant ELIC protein. PAM-Nb was used at 1–30 μM concentration in electrophysiology experiments. In protein crystals the PAM-Nb concentration is > 1 mM. | ||
| Antibody | NAM-Nb | Nanobody obtained by immunizing an adult llama glama with recombinant ELIC protein. NAM-Nb was used at 0.03–3 μM concentration in electrophysiology experiments. In protein crystals the NAM-Nb concentration is > 1 mM. | ||
| Recombinant DNA reagent | pGEM-HE | Liman et al. (1992) | ||
| Recombinant DNA reagent | pMESy4 | GenBank KF415192 | ||
| Sequence-based reagent | P111C oligonucleotide forward and reverse | 5’-caccaagttgtccatcTGcacggacagcatctgg-3’ 5’-ccagatgctgtccgtgCAgatggacaacttggtg- 3’ | ||
| Sequence-based reagent | T112C oligonucleotide forward and reverse | 5’-caagttgtccatccccTGCgacagcatctgggtcc-3’ 5’-ggacccagatgctgtcGCAggggatggacaacttg-3’ | ||
| Sequence-based reagent | N147C oligonucleotide forward and reverse | 5’-caaggcgaagttcagTGctacaagccccttcagg-3’ 5’-cctgaaggggcttgtagCActgaacttcgccttg-3’ | ||
| Sequence-based reagent | K149C oligonucleotide forward and reverse | 5’-ggcgaagttcagaactacTGCccccttcaggtggtga-3’ 5’- tcaccacctgaaggggGCAgtagttctgaacttcgcc-3’ | ||
| Sequence-based reagent | L151C oligonucleotide forward and reverse | 5’- gttcagaactacaagcccTGtcaggtggtgactgc-3’ 5’-gcagtcaccacctgaCAgggcttgtagttctgaac-3’ | ||
| Sequence-based reagent | Y86C oligonucleotide forward and reverse | 5’- ctggtaccggcagtGctggactgatgag-3’ 5’-ctcatcagtccagCactgccggtaccag-3’ | ||
| Sequence-based reagent | F125C oligonucleotide forward and reverse | 5’-ggacattctcatcaatgagtGcgtggatgtggg-3’ 5’-cccacatccacgCactcattgatgagaatgtcc-3’ | ||
| Sequence-based reagent | Primer for nanobody library generation CALL001 | Pardon et al. (2014) | 5′-GTCCTGGCTGCTCTTCTACAAGG-3′ | |
| Sequence-based reagent | Primer for nanobody library generation CALL002 | Pardon et al. (2014) | 5′-GGT ACGTGCTGTTGAACTGTTCC-3′ | |
| Sequence-based reagent | Primer for nanobody library generation VHH-Back | Pardon et al. (2014) | 5′-GATGTGCAGCTGCAG GAGTCTGGRGGAGG-3′(PstI) | |
| Sequence-based reagent | Primer for nanobody library generation VHH-For | Pardon et al. (2014) | 5′-CTAGTGCGGCCGCTGG AGACGGTGACCTGGGT-3′(Eco91I) | |
| Sequence-based reagent | Primer for nanobody library analysis MP57 | Pardon et al. (2014) | 5′-TTATGCTTCCGGCTC GTATG-3′ | |
| Peptide, recombinant protein | Primer for nanobody library analysis GIII | Pardon et al. (2014) | 5′-CCACAGACAGCCCTCATAG-3′ | |
| Commercial assay or kit | mMessage mMachine T7 Transcription kit | ThermoFisher Scientific | #AM1344 | |
| Commercial assay or kit | Ni Sepharose 6 Fast Flow resin | GE Healthcare | #17531802 | |
| Commercial assay or kit | Superdex 75 10/300 GL column | GE Healthcare | # 17-5174-01 | |
| Commercial assay or kit | Superdex 200 Increase 10/300 GL | GE Healthcare | # 28990944 | |
| Commercial assay or kit | QuikChange Site-Directed Mutagenesis Kit | Agilent | # 200518 | |
| Chemical compound, drug | 5-HT creatinine sulphate | Sigma-Aldrich | #S2805 | |
| Chemical compound, drug | MTSEA-biotin | Biotium | #90064 | |
| Chemical compound, drug | GABA | Sigma-Aldrich | #A2129 | |
| Chemical compound, drug | E. coli total lipid extract | Avanti Polar Lipids | #100500P | |
| Chemical compound, drug | Anagrade n-undecyl-β-D-maltoside (UDM) | Anatrace | #U300 | |
| Software, algorithm | GraphPad Prism Software v4.03 | RRID:SCR_002798 | ||
| Software, algorithm | CCP4 | Winn et al., 2011 | ||
| Software, algorithm | STARANISO | Tickle et al., 2018 http://staraniso.globalphasing.org | ||
| Software, algorithm | XDS | Kabsch, 2010 | ||
| Software, algorithm | Coot | Emsley et al. (2010) | ||
| Software, algorithm | Buster | Smart et al. (2012) | ||
| Software, algorithm | PDB-REDO | Joosten et al. (2014) | ||
| Software, algorithm | MolProbity | Chen et al. (2010) | ||
| Software, algorithm | PyMOL v2.3.0 | Schrödinger | RRID:SCR_000305 | |
| Software, algorithm | HOLE | Smart et al. (1996) | ||
| Software, algorithm | CAVER | Jurcik et al. (2018) | ||
| Software, algorithm | PHENIX | Adams et al. (2010) | ||
| Software, algorithm | HiClamp | Multi Channel Systems |
Additional files
-
Supplementary file 1
Crystallographic and refinement statistics.
- https://cdn.elifesciences.org/articles/51511/elife-51511-supp1-v2.docx
-
Supplementary file 2
Structures used for structure-based superposition and Ω-loop analysis.
- https://cdn.elifesciences.org/articles/51511/elife-51511-supp2-v2.docx
-
Supplementary file 3
Effects of MTSEA-biotin (MB) application on WT and mutant 5-HT3R.
- https://cdn.elifesciences.org/articles/51511/elife-51511-supp3-v2.docx
-
Transparent reporting form
- https://cdn.elifesciences.org/articles/51511/elife-51511-transrepform-v2.docx
Download links
A two-part list of links to download the article, or parts of the article, in various formats.
Downloads (link to download the article as PDF)
Open citations (links to open the citations from this article in various online reference manager services)
Cite this article (links to download the citations from this article in formats compatible with various reference manager tools)
Modulation of the Erwinia ligand-gated ion channel (ELIC) and the 5-HT3 receptor via a common vestibule site
eLife 9:e51511.
https://doi.org/10.7554/eLife.51511


