C9orf72 arginine-rich dipeptide repeat proteins disrupt karyopherin-mediated nuclear import
- Department of Neurology, Johns Hopkins University School of Medicine, United States
- Brain Science Institute, Johns Hopkins University School of Medicine, United States
- Department of Psychological and Brain Sciences, Krieger School of Arts and Sciences, Johns Hopkins University, United States
- Department of Chemical and Biomolecular Engineering, Whiting School of Engineering, Johns Hopkins University, United States
Figures
Figure 1 with 2 supplements
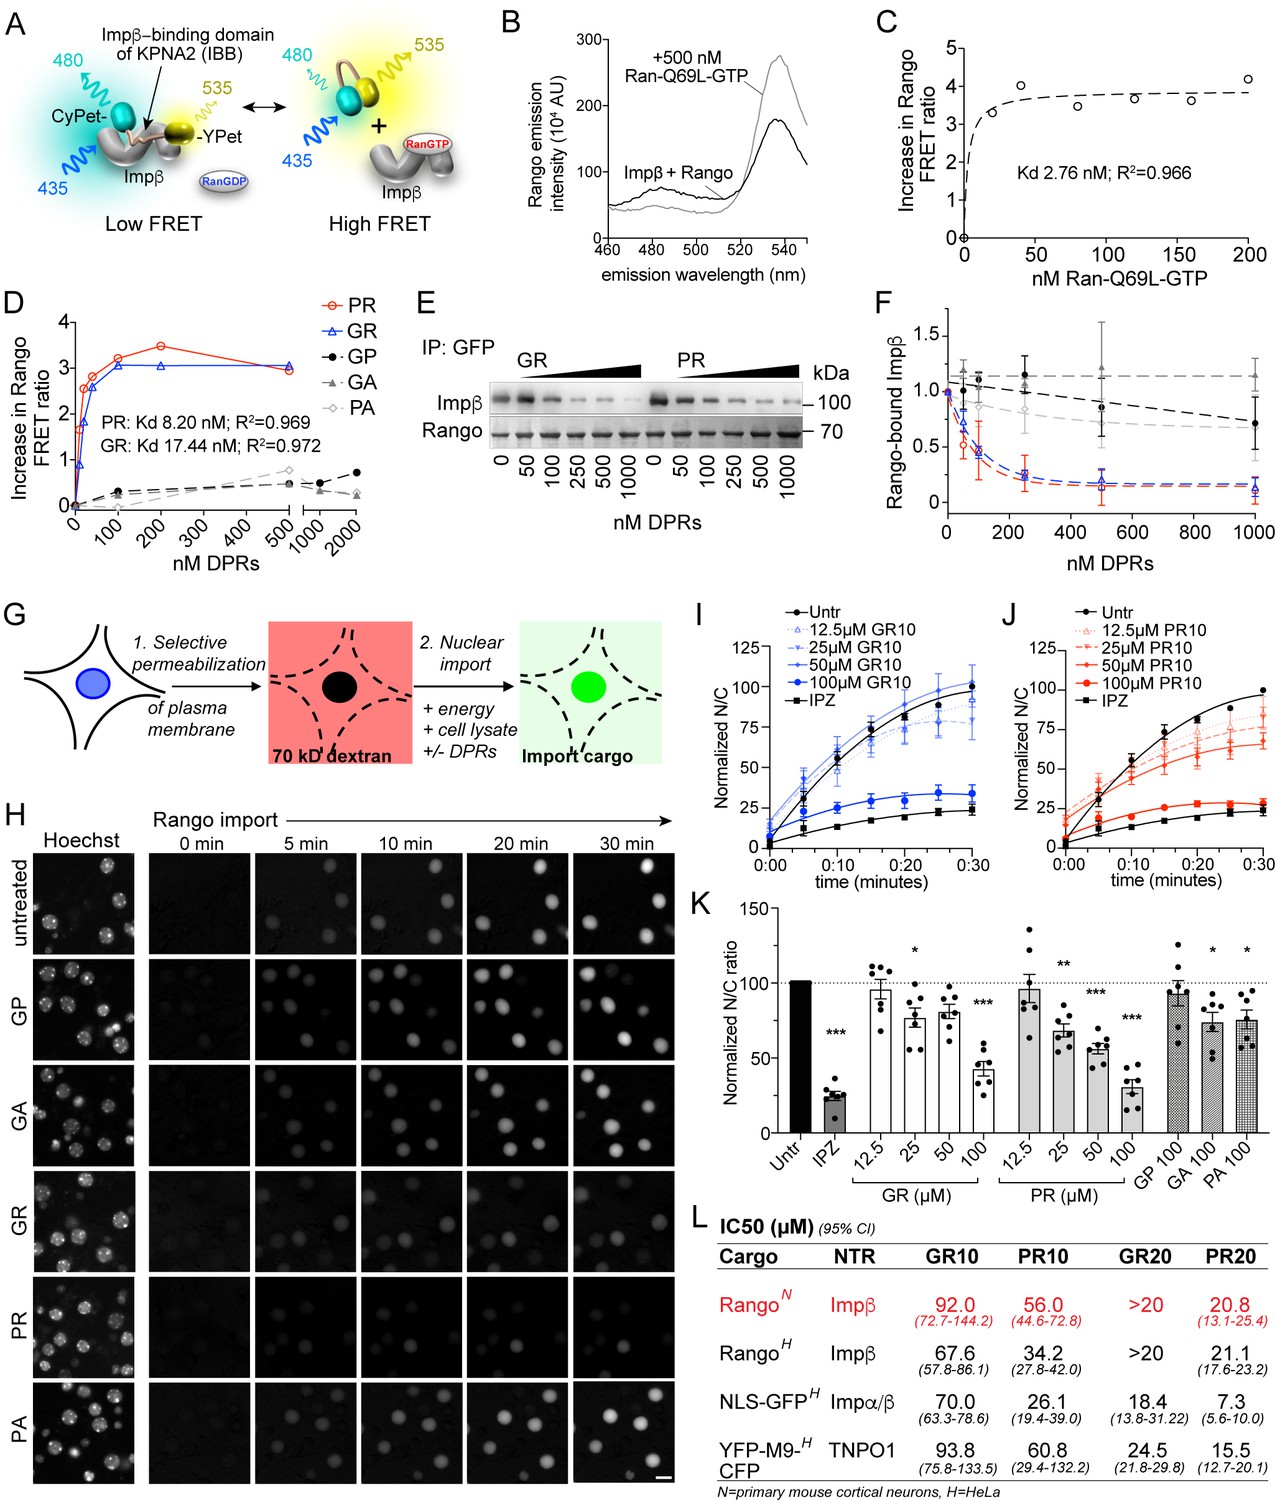
R-DPRs bind importin β and inhibit nuclear import.
(A) Schematic of Rango FRET sensor, consisting of the importin β-binding domain (IBB) of importin α1 (KPNA2), flanked by CyPET (donor) and YPet (acceptor). (B–C) Rango spectral profile (B) and FRET ratio (C) demonstrating increase in FRET by adding hydrolysis-deficient Ran-Q69L-GTP to importin β-bound Rango (representative of three experiments). (D) Change in Rango FRET ratio induced by adding DPRs (10-mers) to importin β-bound Rango (representative of five experiments, data in C-D fit to non-linear model with one binding site). (E) GFP-trap co-immunoprecipitation of importin β by Rango in the presence of GR10 and PR10. (F) Quantification of Rango-bound importin β in (E), normalized to Rango and expressed as a fraction of untreated lysate (mean ± SD, three technical replicates, legend as in D). (G) Diagram of permeabilized cell nuclear import assay, which was adapted and validated for primary neurons (Figure 1—figure supplement 1). (H) Longitudinal wide-field images of Rango import in permeabilized mouse primary cortical neurons. Scale bar = 10 µm. (I–J) Nuclear to cytoplasmic (N/C) ratio of Rango import in (H), calculated by automated high content analysis. GR and PR graphs are separated for clarity; the control values are identical. All data are normalized to cells lacking energy/lysate and expressed as percent untreated controls (mean ± SEM of n = 4 biological replicates, 189 ± 125 cells per data point). (K) Steady state N/C ratio of Rango in primary neurons fixed after 2 hr (mean ± SEM of n = 7 biological replicates, 409 ± 202 cells per data point, *p<0.05, **p<0.01, ****p<0.001 vs. untreated cells, one-way ANOVA with Dunnett’s post hoc test). (L) IC50 of R-DPRs for inhibition of nuclear import of designated cargoes, from (K) and Figure 1—figure supplement 2. 95% confidence intervals are shown (n = 3–6 biological replicates/condition, 409 ± 202 cells/ replicate for neurons, 1290 ± 305 cells/replicate for HeLa).>20 denotes conditions for which the IC50 was not reached up to the highest dose tested (20 µM). See source file for raw data and exact p values.
-
Figure 1—source data 1
Raw data and p values for data in Figure 1 and supplements.
- https://cdn.elifesciences.org/articles/51685/elife-51685-fig1-data1-v1.xlsx
Figure 1—figure supplement 1
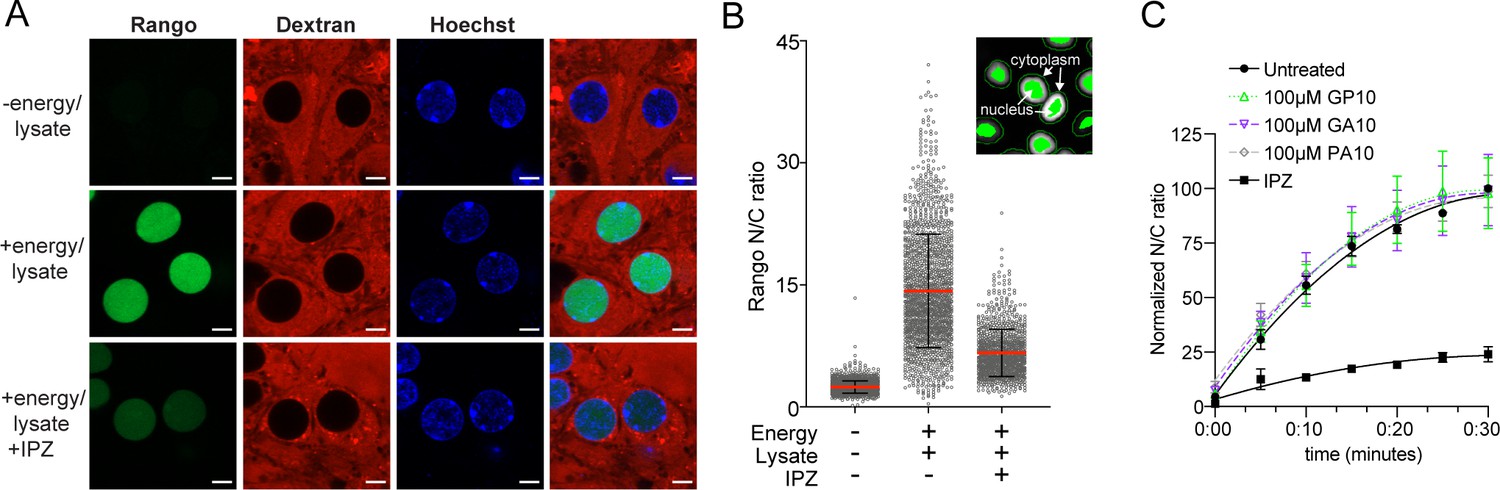
Neuron permeabilized cell assay validation.
(A) Mouse primary cortical neurons were permeabilized with hypotonic buffer + BSA cushion, and incubated for 2 hr with 200 nM Rango and 70 kD Texas Red dextran in the indicated conditions. Scale bar = 5 µm. (B) The automated method for N/C ratio determination calculates the mean intensity at a defined distance inside and outside the nuclear rim (inset; nuclear boundaries determined by Hoechst signal). Representative raw data are shown for conditions in (A), from a single well of a 96-well plate. (C) N/C ratio of Rango import in neurons treated with 100 µM GP10, GA10, PA10, or importazole (IPZ). All data are normalized to cells lacking energy/lysate and expressed as percent untreated controls (mean ± SEM of n = 4 biological replicates, 278 ± 238 cells per data point). See source file for raw data.
Figure 1—figure supplement 2
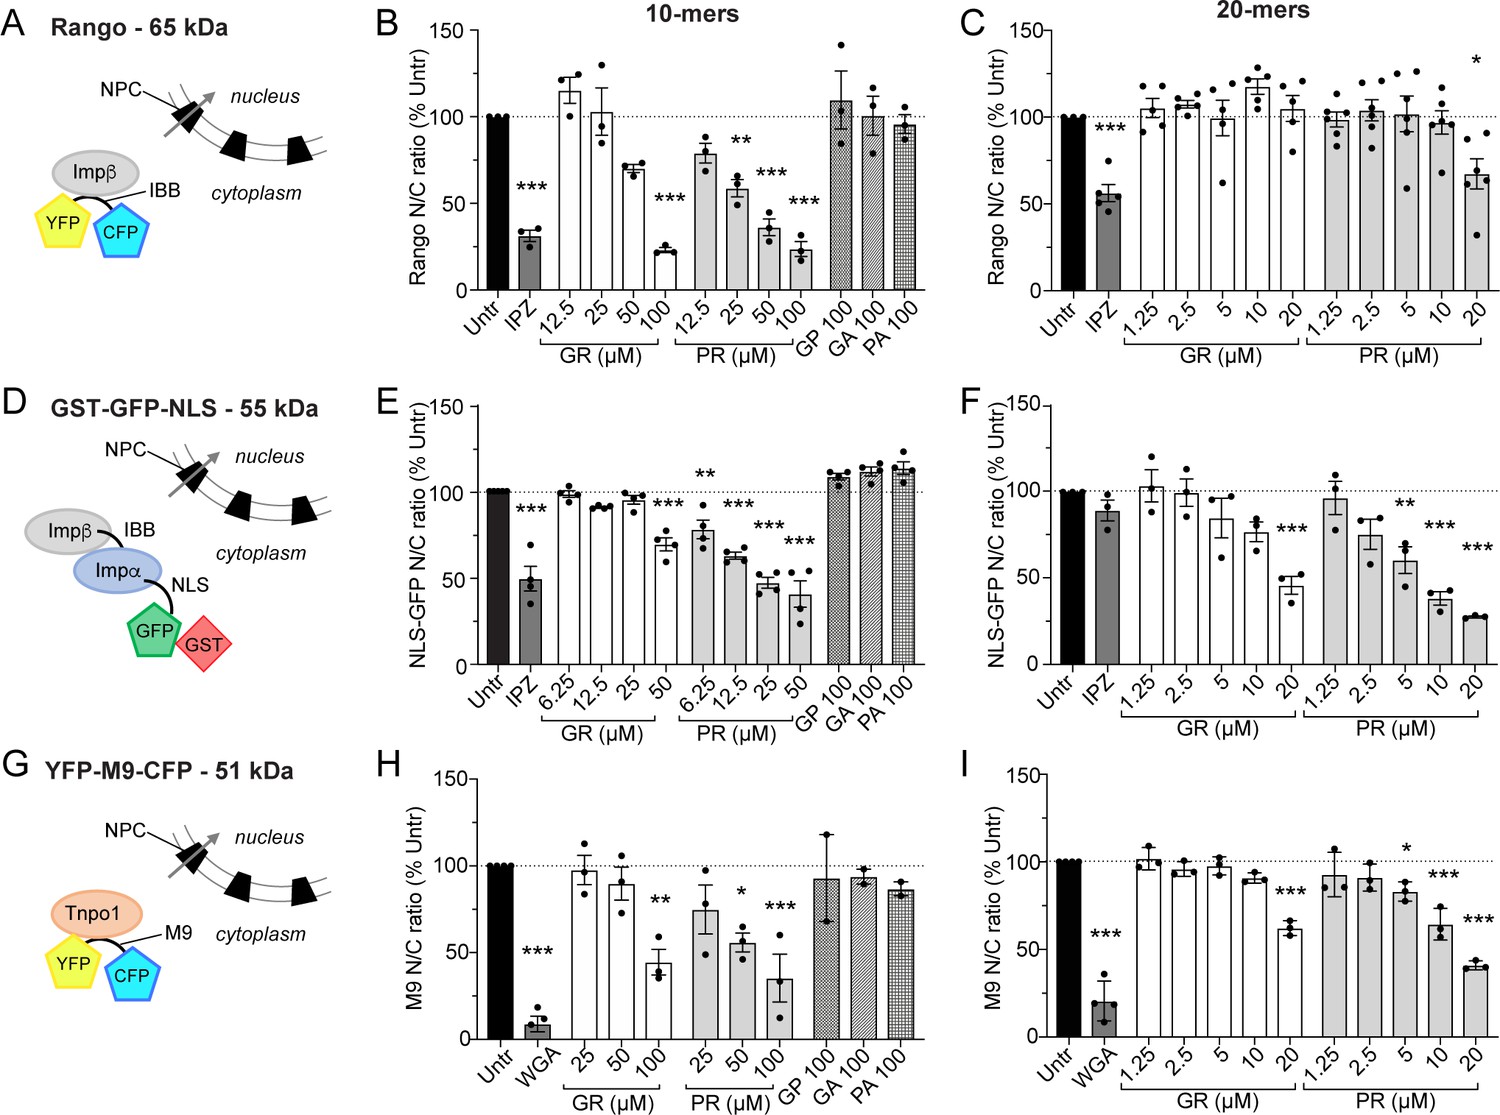
Extended HeLa nuclear import data.
Diagram of cargo import mechanisms and HeLa nuclear import data in the presence of increasing concentrations of DPR 10- and 20-mers, at steady state (2 hr for Rango (A–C), 4 hr for NLS-GFP (D–F), and 2 hr for M9 (G–I)). These data correspond to those summarized in the table in Figure 1L. Mean ± SEM is shown, n ≥ 3 biological replicates for R-DPRs, n ≥ 2 biological replicates for GP, GA, and PA. 1209 ± 305 cells per replicate, *p<0.05, **p<0.01, ***p<0.001 vs. untreated cells, one-way ANOVA with Dunnett’s post-hoc test. See source file for raw data and exact p values.
Figure 2 with 2 supplements
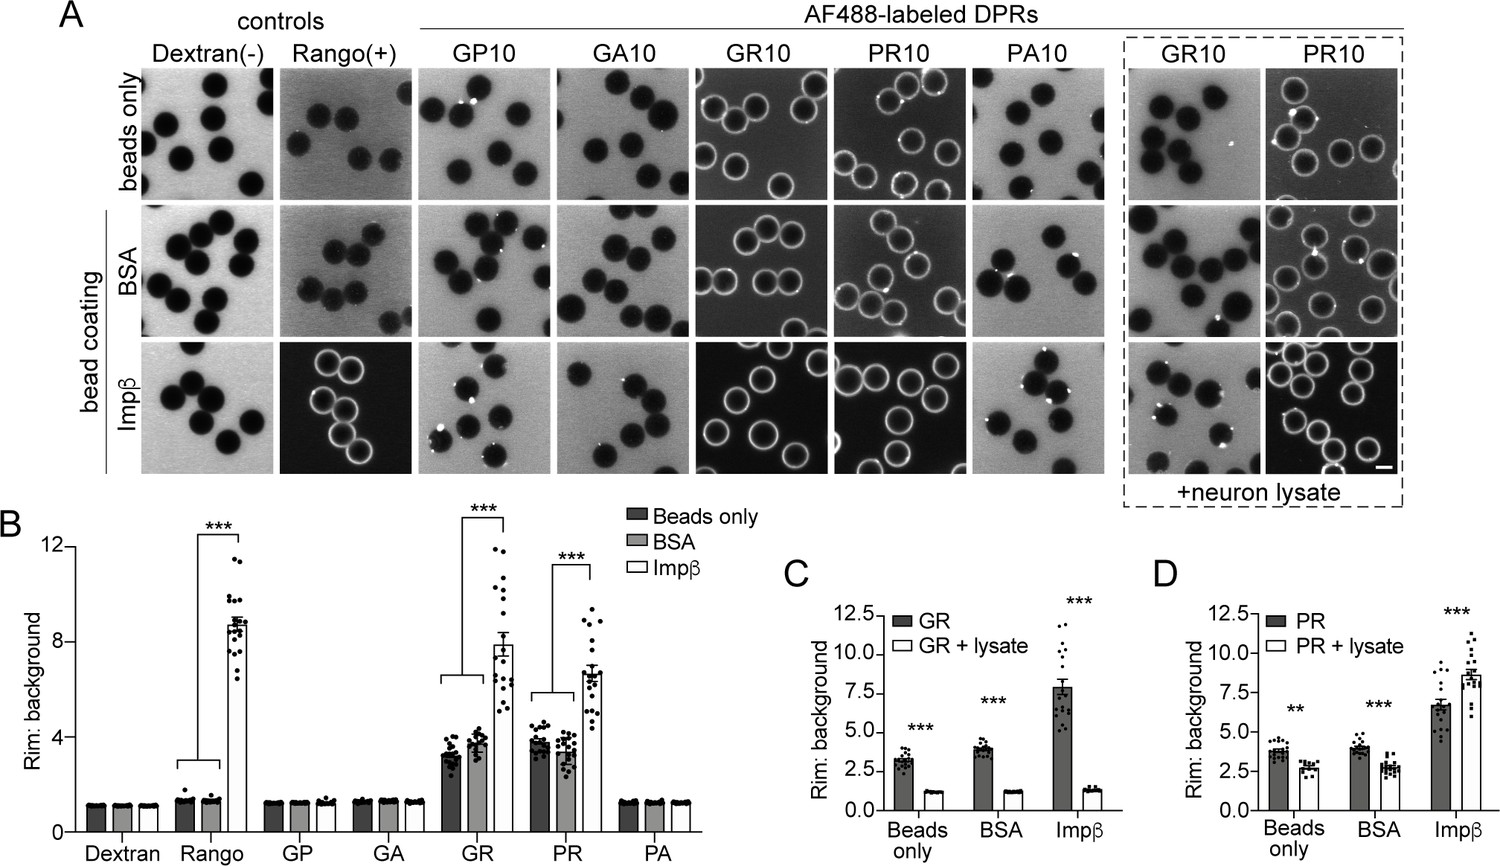
R-DPRs bind importin β in the bead halo assay.
(A) Confocal images of AF488-labeled C9orf72 DPRs added to neutravidin beads coated with biotinylated ‘bait’ proteins, in binding buffer or in the presence of 1 mg/ml neuron lysate (at right). FITC-dextran = negative control (-), Rango sensor = positive control (+). Scale bar = 4 µm. B Rim vs. background ratio in binding buffer (see Figure 2—figure supplement 1 for quantification method). (C–D) Rim vs. background ratio for GR10 (C) and PR10 (D) in 1 mg/ml neuron lysate. In B–D, mean ± SEM is shown for n = 20 beads (5 intensity profiles/bead). **p<0.01, ***p<0.001 vs. control beads by two-way ANOVA with Tukey post-hoc test. See source file for raw data and exact p values.
-
Figure 2—source data 1
Raw data and p values for data in Figure 2 and supplements.
- https://cdn.elifesciences.org/articles/51685/elife-51685-fig2-data1-v1.xlsx
Figure 2—figure supplement 1
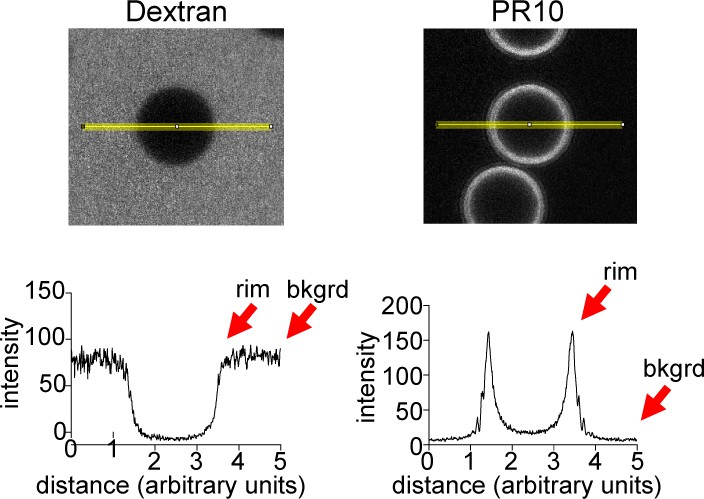
Quantification method for bead halo assay.
Examples of line intensity profiles for control versus PR10 beads (Fiji), with rim vs. background levels indicated.
Figure 2—figure supplement 2
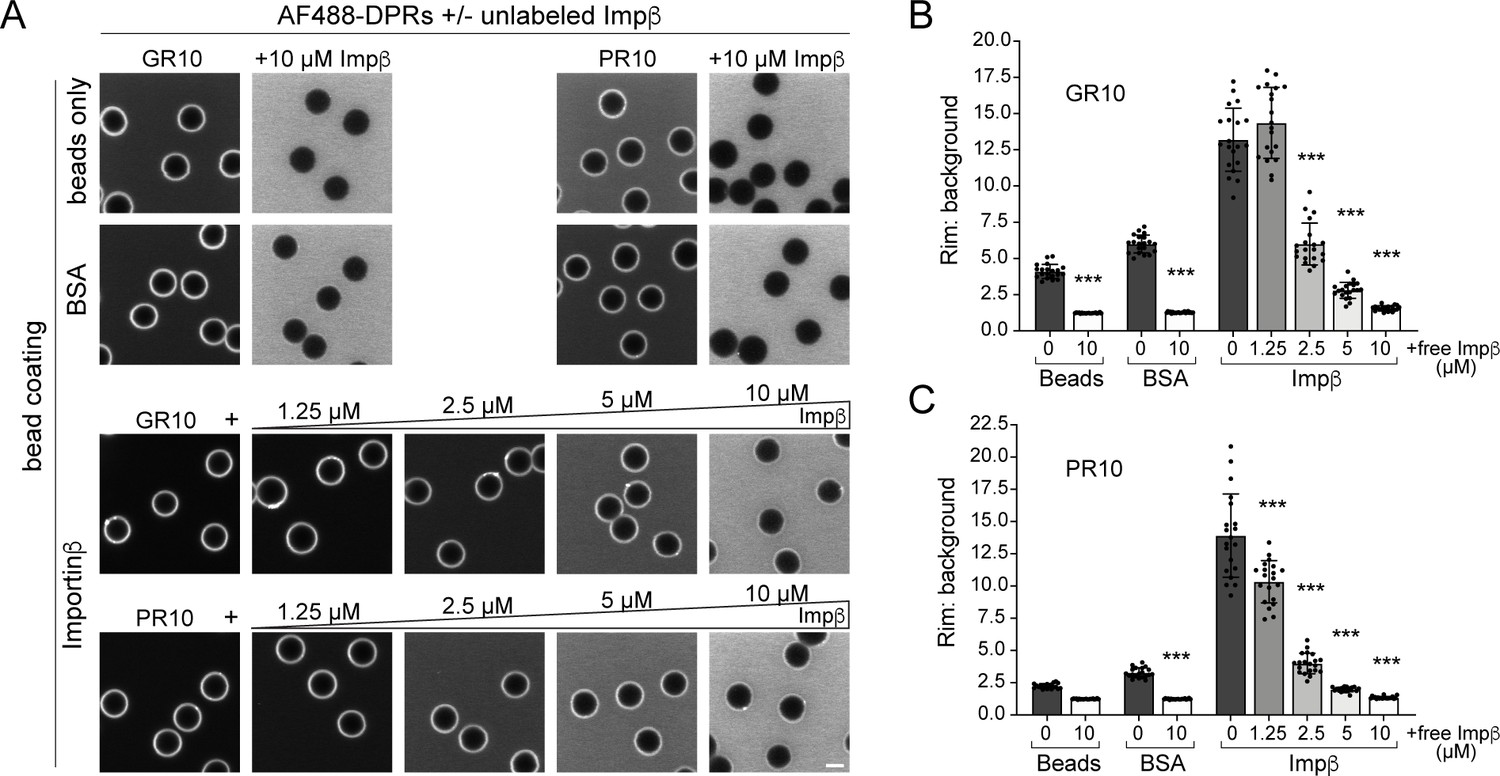
Free importin β competes for R-DPR binding to importin β-coated beads.
(A) Confocal images of AF488-labeled GR10 and PR10 added to neutravidin beads coated with biotinylated proteins as indicated, in assay buffer or in the presence of increasing concentrations of free (unlabeled) importin β. Scale bar = 4 µm. (B–C) Rim vs. background ratio in binding buffer for GR10 (B) and PR10 (C) ± free importin β. In B-C, mean ± SEM is shown for n = 20 beads (5 intensity profiles/bead). ***p<0.001 (vs. no importin β) by one-way ANOVA with Tukey post-hoc test. See source file for raw data and exact p values.
Figure 3 with 2 supplements
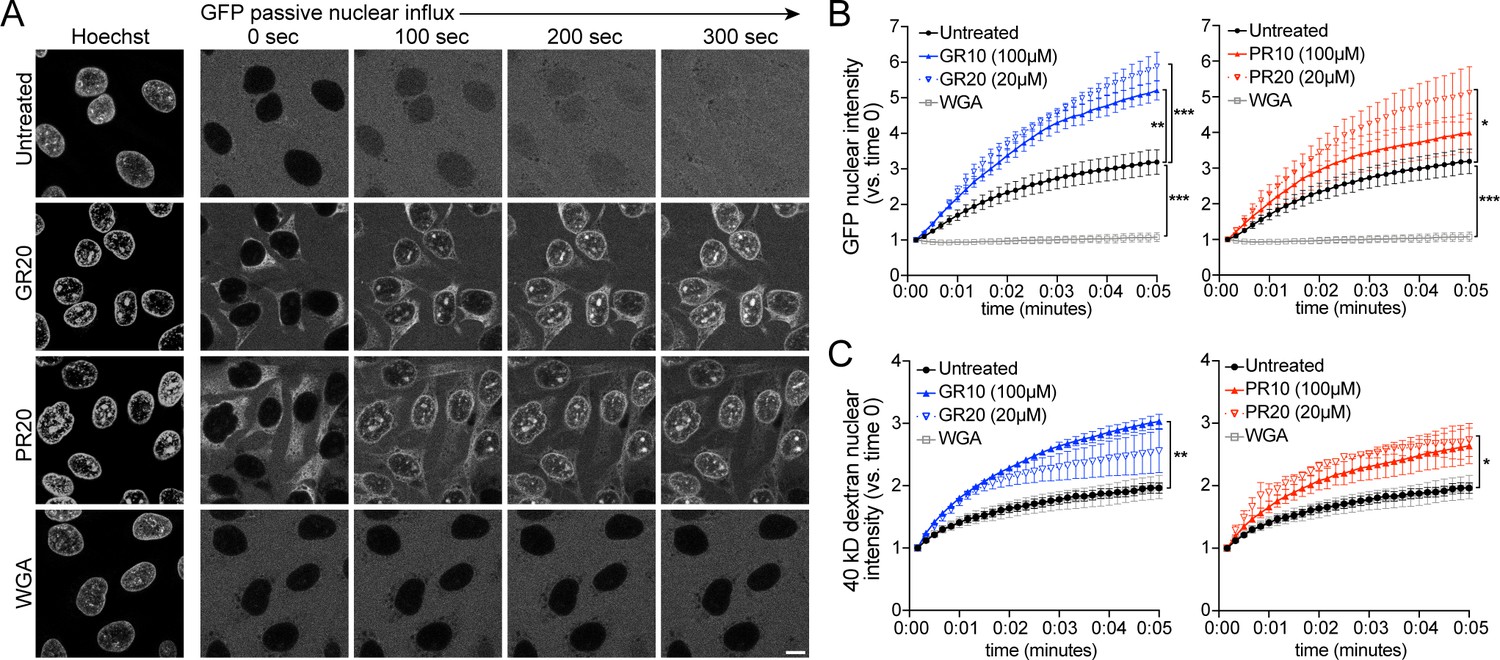
PR and GR accelerate passive nuclear influx.
(A) Confocal time-lapse imaging of GFP nuclear influx in permeabilized HeLa cells following ≥ 30 min. incubation with buffer (untreated), 20 µM GR20, 20 µM PR20, or 0.8 mg/ml wheat germ agglutinin (WGA, positive control). Scale bar = 10 µm. (B–C) Nuclear GFP (B) and 40 kD dextran (C) intensity normalized to background fluorescence, expressed vs. time 0 (no influx = 1). GR and PR are separated for clarity; the control values are identical. All experiments included lysate and energy. See Figure 3—figure supplement 1 for validation of assay conditions and non-R-DPR testing, and Figure 3—figure supplement 2 for binding studies with FG-domains which contribute to the NPC selectivity barrier. Data are mean ± SEM for n = 3–6 biological replicates/condition (20–30 cells/replicate). *p<0.05, **p<0.01, ***p<0.001 vs. untreated cells at 5 min by one-way ANOVA with Dunnett’s post hoc test. See source file for raw data and exact p values.
-
Figure 3—source data 1
Raw data and p values for data in Figure 3 and supplements.
- https://cdn.elifesciences.org/articles/51685/elife-51685-fig3-data1-v1.xlsx
Figure 3—figure supplement 1
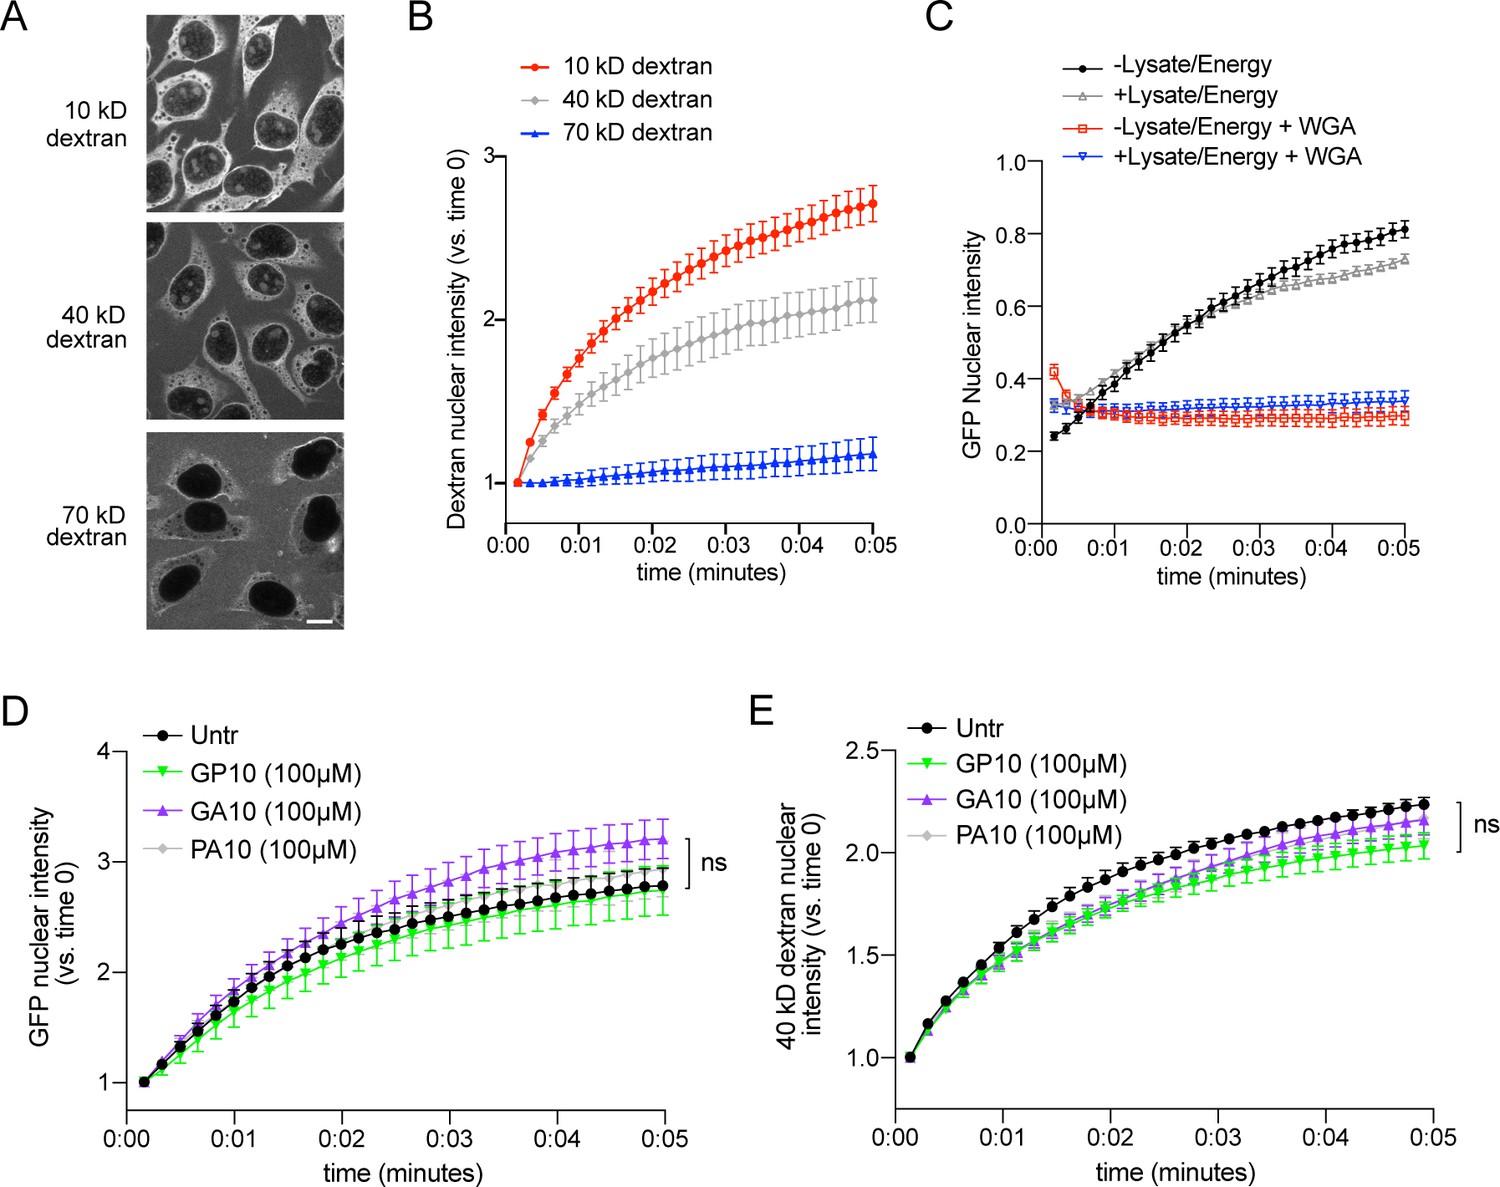
Validation of passive nuclear influx assay.
(A) Confocal images of permeabilized HeLa cells incubated with Texas Red-labeled dextrans of the indicated molecular weight for 15 min. Scale bar = 10 µm. (B) Time lapse imaging of dextran nuclear influx from 0 to 5 min. Nuclear intensity is normalized to time 0 for each cell (1 = no influx). Mean ± SEM is shown for n = 3 biological replicates (20–30 cells/replicate/condition). (C) Time lapse imaging of GFP nuclear influx, with or without lysate/energy, to verify passive transport of this 27 kD, non-NLS-containing protein. A subset of cells were pre-incubated with 0.8 mg/ml WGA as a positive control for impediment to transport. n = 1 (20–30 cells/condition). (D–E) Nuclear GFP (D) and 40 kD dextran (E) intensity for cells preincubated with 100 µM GP10, GA10, or PA10. All experiments included lysate and energy. Mean ± SEM is shown for n = 3 biological replicates (20–30 cells/replicate/condition, ns = no significant difference vs. untreated controls).
Figure 3—figure supplement 2
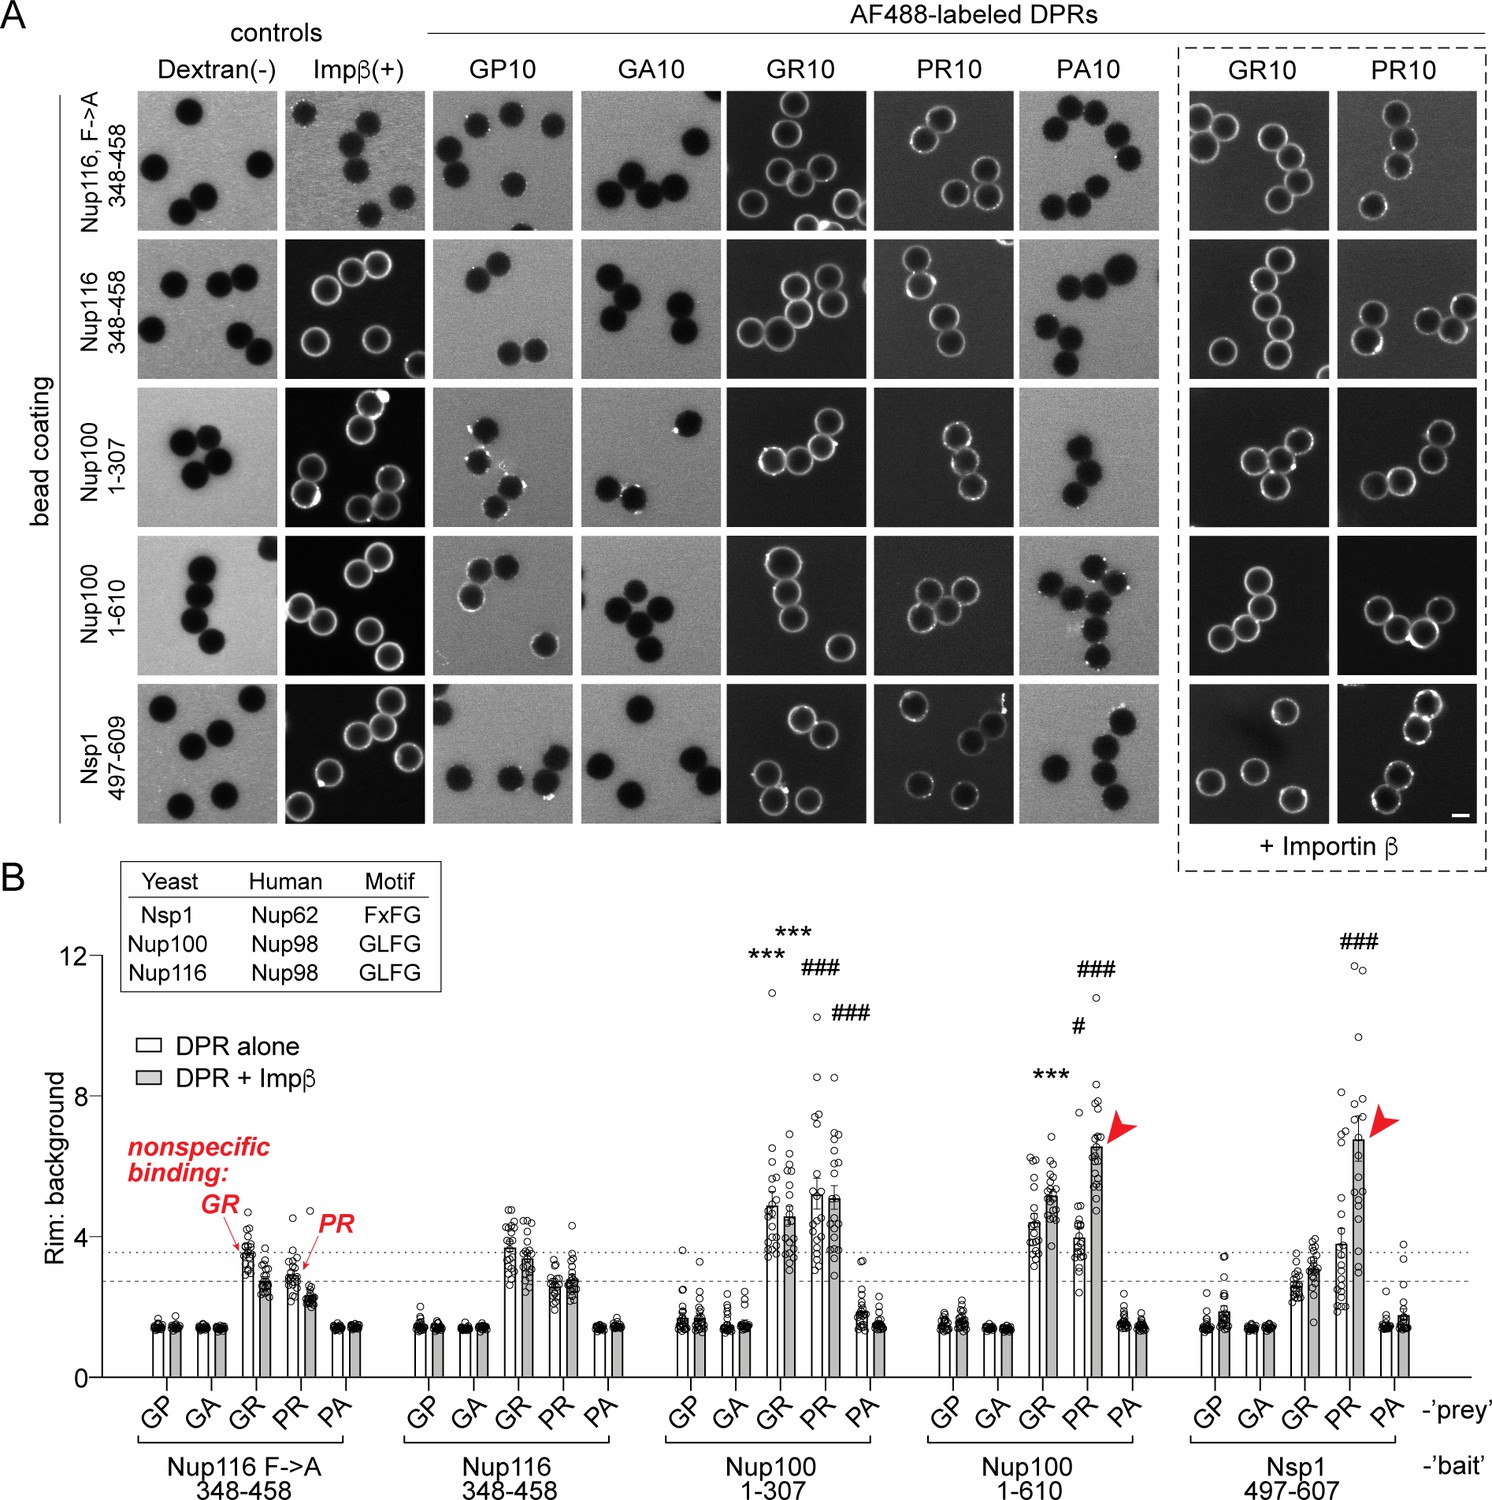
R-DPRs show modest binding to FG-domains in the bead halo assay, which can be augmented by importin β.
(A) Confocal images of AF488-labeled DPRs added to glutathione beads coated with yeast FG- and GLFG-domain GST-fusion proteins, in binding buffer with or without added unlabeled importin β. FITC-dextran = negative control (-), full length AF647-importin β = positive control (+). Scale bar = 4 µm. (B) Intensity profiles (rim vs. background) across all beads tested, including the Nup116 F→ A mutant which is used to define the background/non-specific binding level as indicated by the horizontal dashed lines. Correspondence between yeast and human Nups is given in the inset. Mean ± SEM is shown, for n = 20 beads (5 intensity profiles/bead). *p<0.05, **p<0.01, ***p<0.001 vs. Nup116 F→A by two-way ANOVA with Tukey post-hoc test (*denotes GR statistics, # denotes PR statistics, red arrows denote augmentation of binding by importin β (p<0.001)). See source file for raw data and exact p values.
Figure 4 with 2 supplements
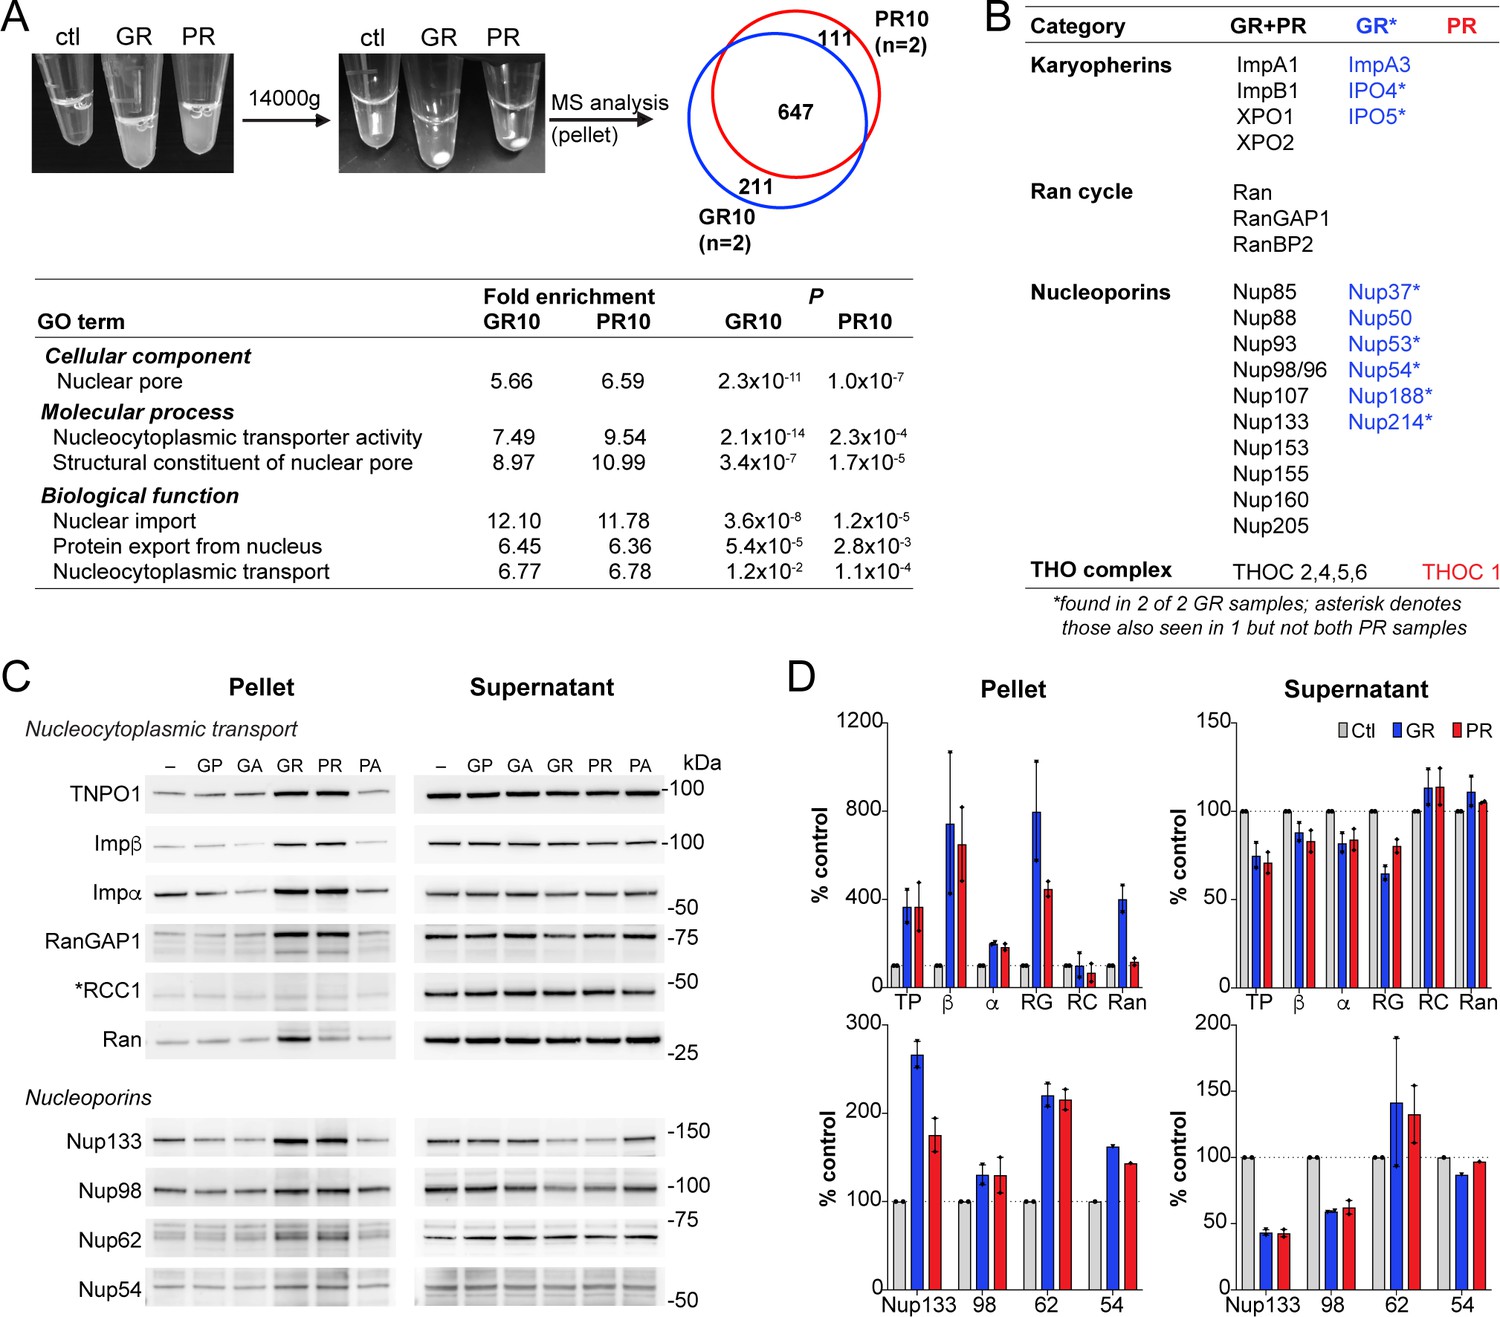
R-DPR-induced aggregates recruit NCT proteins.
(A) Aggregates formed by adding R-DPRs to HEK cell lysate in transport buffer (before and after 15 min centrifugation). Venn diagram indicates number of proteins identified by mass spectrometry analysis of pellets (n = 2 technical replicates). Enriched NCT-related GO terms are shown, with fold change and p value calculated by the DAVID algorithm. Overall top GO terms are shown in Figure 4—figure supplement 1. (B) List of identified NCT-related proteins, in all 4 samples (black), n = 2 GR10 samples (blue), and n = 2 PR10 samples (red). Asterisk denotes samples seen in n = 2 GR10 samples and only n = 1 PR10 sample. (C) Western blots for indicated NCT and Nup proteins in pellet vs. supernatant fractions. RCC1 is marked with an asterisk, as this protein was not identified in the MS results and serves as the negative control. All samples were loaded by volume, see Figure 4—figure supplement 2 for membrane protein stain and additional Western blots of disordered RNA binding proteins. (D) Quantification of blots in (C). Mean ± SD for two technical replicates is shown (TP = TNPO1, β = importin β, α = importin α, RG = RanGAP1, RC = RCC1, Ran = RanGTPase). See source file for raw data.
-
Figure 4—source data 1
Raw data and p values for data in Figure 4 and supplements.
- https://cdn.elifesciences.org/articles/51685/elife-51685-fig4-data1-v1.xlsx
Figure 4—figure supplement 1
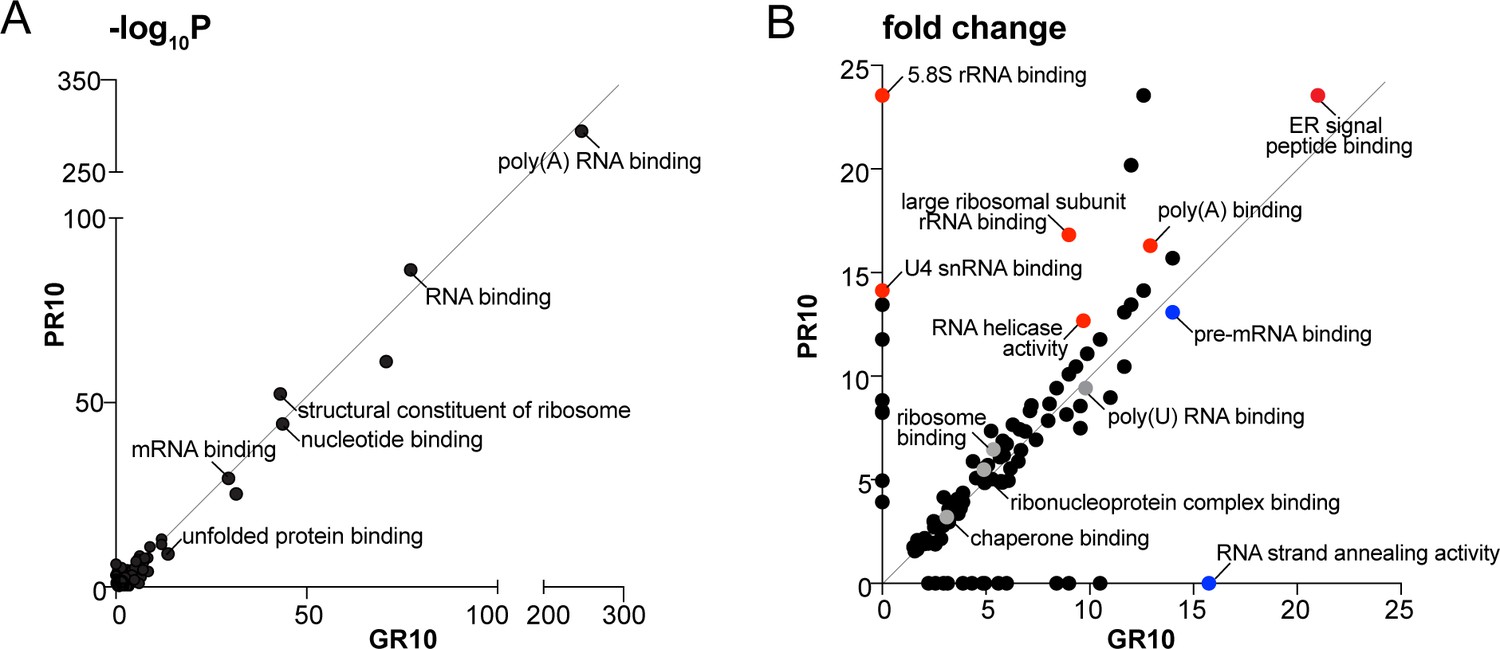
Overall top GO terms enriched in R-DPR aggregates.
(A-B) Top molecular function GO terms for GR10 and PR10 aggregates according to p value (shown as -log10) (A) and fold change (B). In B, selected GO categories enriched in PR samples are highlighted in red, and GR in blue.
Figure 4—figure supplement 2
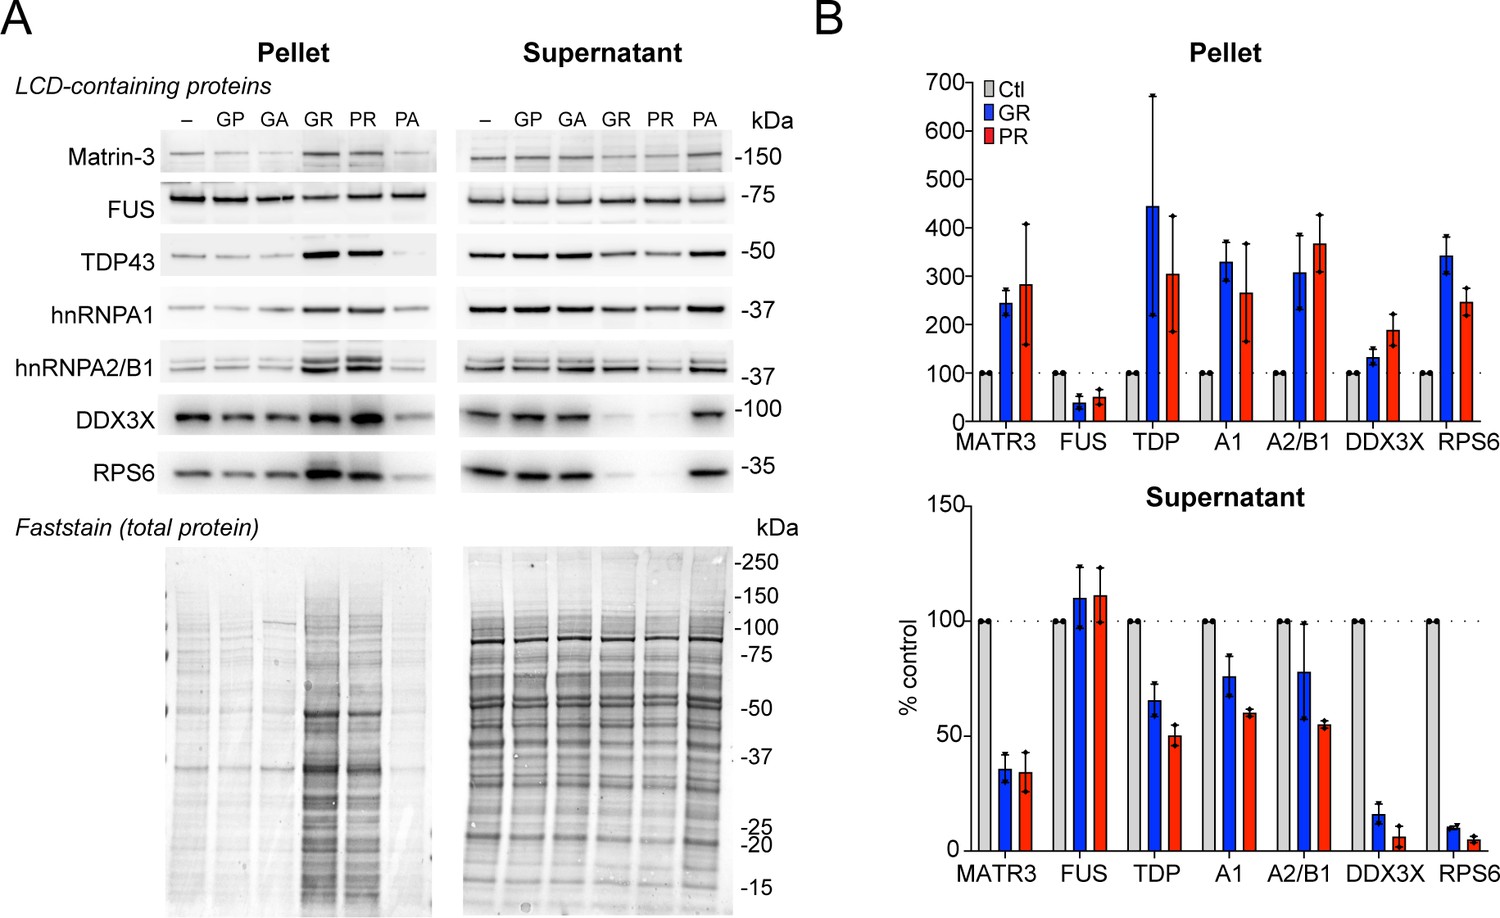
Western blots for selected low complexity-domain (LCD)-containing proteins in R-DPR supernatant vs. pellet fractions.
(A) Western blot for indicated proteins identified by R-DPR aggregate mass spectrometry in supernatant vs. pellet, loaded by volume. A representative post-transfer Faststain (total protein stain) is shown. (B) Quantification of blots in (A). Mean ± SD is shown for two technical replicates. See source file for raw data.
Figure 5 with 3 supplements

R-DPR nuclear import blockade does not require aggregates and is rescued by RNA.
(A) Rango N/C ratio in permeabilized HeLa transport reactions with 100 µM GR10 or PR10 and increasing concentrations of total HEK cell RNA +/- RNAse. See Figure 5—figure supplement 1 for attempts to rescue with 1,6-hexanediol and importin β. (B) Schematic of fractionated Rango transport assays, run with aggregates present or absent (supernatant only), followed by addition of RNA to a subset of reactions. See Figure 5—figure supplement 2 for western blots of fractionated samples ± RNA. (C) Rango N/C ratio from fractionated transport assays. (D) Confocal images of fractionated transport assays run in the presence of AF488-labeled R-DPRs and AF647-labeled importin β. Arrows mark R-DPR collection around the nuclear membrane in conditions where transport was inhibited. Acquisition parameters were kept constant for all images (scale bar = 10 µm). (E) Schematic of (1) lysate vs. (2) nuclei R-DPR preincubation assays. (F) Rango N/C ratio from preincubation assays. (G) Working model: R-DPRs block nuclear import by binding to importin β and preventing the formation of the importin α•importin β•NLS cargo complex in the soluble phase of the transport reaction, which can be alleviated by RNA. See Figure 5—figure supplement 3 for DPR/RNA electrophoretic mobility shift assay. For A,C,F mean ± SEM of n ≥ 3 biological replicates are shown (each data point represents 1462 ± 555 cells). *p<0.05, **p<0.01, ***p<0.001 vs. untreated cells by one-way ANOVA with Dunnett’s post-hoc test. See source file for raw data and exact p values.
-
Figure 5—source data 1
Raw data and p values for data in Figure 5 and supplements.
- https://cdn.elifesciences.org/articles/51685/elife-51685-fig5-data1-v1.xlsx
Figure 5—figure supplement 1

1,6-HD and importin β do not rescue nuclear import in the permeabilized cell assay.
(A-B) 1,6-hexanediol (1,6-HD) (A) and WT importin β (B) cause dose-dependent inhibition of Rango import in HeLa cells at baseline (mean ± SEM for n = 2 replicates is shown). (C) No rescue of mild Rango import inhibition (25 µM PR10) was seen for either intervention (n = 1 for 1,6-HD, and n = 2 replicates for importin β, 1622 ± 271 cells/data point). Note that values in C are not background corrected as some fell below the level observed for cells without energy or lysate added. See source file for raw data.
Figure 5—figure supplement 2

RNA only minimally attenuates R-DPR aggregate formation.
(A) Sypro Ruby-stained protein gel showing effect of total HEK RNA on R-DPR-mediated aggregate formation. HEK lysate pellets were prepared as for mass spec and Western blots in Figure 4, +/- 20 µg total HEK RNA. Minimal reduction of predominantly low molecular weight species was apparent by the protein stain (bracketed in red). (B–C) Western blots for indicated proteins +/- RNA in pellet vs. supernatant fractions (B), and quantifification of band intensity, expressed as percent untreated control (C). All samples were loaded by volume as in the parent figure. Mean ± SD for two technical replicates is shown.
Figure 5—figure supplement 3
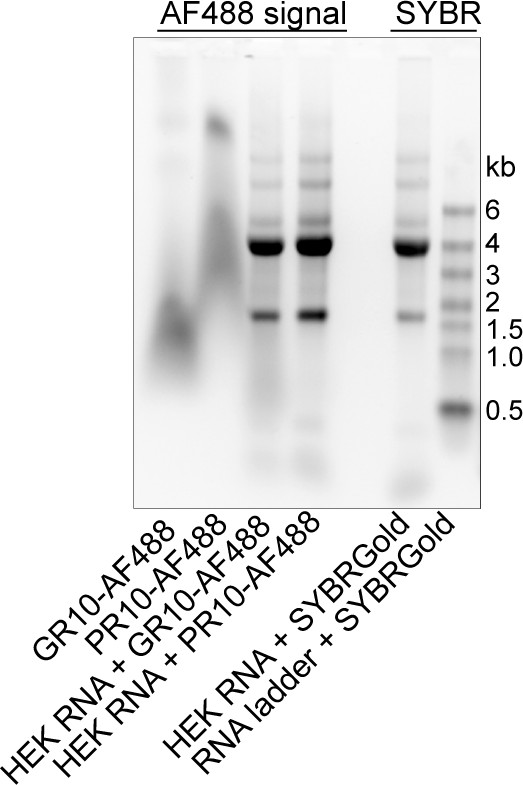
RNA binds R-DPRs in an electrophoretic mobility shift assay.
Electrophoretic mobility shift assay of AF488-labeled DPRs (10mers), +/- total HEK RNA, imaged by UV transillumination to simultaneously visualize the AF488 and SYBR Gold signals. Note the co-migration of AF488 R-DPRs with RNA, as visualized by AF488. No SYBR Gold was added to these lanes.
Tables
Key resources table
| Reagent type (species) or resource | Designation | Source or reference | Identifiers | Additional information |
|---|---|---|---|---|
| Cell line (Homo sapiens) | HeLa | ATCC Kaláb et al., 2006 | clone HeLa 61 | Single cell-derived clone |
| Cell line (Homo sapiens) | HEK293T | ATCC | ||
| Cell line (M. musculus) | Primary cortical neurons (embryonic) | This paper | Harvested from timed pregnant C57BL/6J females | |
| Recombinant DNA reagent | pRSET zzRanQ69L | This paper | pKW1234; pK1097 | E. coli expression of Protein A-tagged human RanQ69L |
| Recombinant DNA reagent | pRSET zzRCC1 | This paper | pKW1907; pK1098 | E. coli expression of Protein A-tagged human RCC1 |
| Recombinant DNA reagent | pRSET Rango-2/α1+linkers | This paper | pK44 | E. coli expression of Rango 2 with importin α1 IBB, optimized for FRET |
| Recombinant DNA reagent | pRSET Rango-2/α1 | This paper | pK188 | E. coli expression of Rango 2 with importin α1 IBB |
| Recombinant DNA reagent | pRSET GFP-AviTag | This paper | pK803 | E. coli expression of GFP, with C-terminal Avitag, used in non-biotinylated form here |
| Recombinant DNA reagent | pRSET Importin β- AviTag | This paper | pKW1982; pK1099 | E. coli expression of WT human Importin β, with C-terminal biotin tag |
| Recombinant DNA reagent | BirA ligase | Avidity.com | AVB101 | E. coli expression of untagged BirA biotin ligase for biotinylation of co-expressed AviTag proteins |
| Recombinant DNA reagent | pRSET YFP-M9-CFP | Soderholm et al., 2011 | pKW1006 | E. coli expression of fluorescent M9, TNPO1 cargo |
| Recombinant DNA reagent | pET30a 6His-S-Importin β(1-876) | Chi et al., 1997 | pKW485 | E. coli expression of WT S-tagged human Importin β |
| Recombinant DNA reagent | pGEX GST-GFP-NLS | Levy and Heald, 2010 | pMD49 | E. coli expression of fluorescent importin α cargo with SV40 NLS |
| Recombinant DNA reagent | pGEX-2TK-Nup100(1-610) | Onischenko et al., 2017 | pKW2960, ID 370 | E. coli expression of truncated GST-tagged GLFG domain of yeast Nup100 (human Nup98 homologue |
| Recombinant DNA reagent | pGEX-2TK-Nup100(1-307) | Onischenko et al., 2017 | pKW2959, ID369 | E. coli expression of GST-tagged GLFG domain of yeast Nup100 (human Nup98 homologue) |
| Recombinant DNA reagent | pGEX-2TK-Nup116(348-458) | Onischenko et al., 2017 | pKW2907, ID350 | E. coli expression of GST-tagged GLFG domain of yeast Nup116 (human Nup98 homologue) |
| Recombinant DNA reagent | pGEX-2TK-Nup116(348-458)F > A | Onischenko et al., 2017 | pKW2908, ID351 | E. coli expression of GST-tagged mutant GLFG domain of yeast Nup116 (human Nup98 homologue) |
| Recombinant DNA reagent | pGEX-2TK Nsp1(497-609) | Yamada et al., 2010 | pKW1609; pK1100 | E. coli expression of truncated, GST-tagged FG domain of yeast Nsp1 (human Nup62 homologue) |
| Antibody | Anti-TDP-43 (3H8) (mouse monoclonal) | Abcam | Cat#: ab104223 | WB (1:2000) |
| Antibody | Anti-Matrin 3 (rabbit monoclonal) | Abcam | Cat#: ab151714 | WB (1:5000) |
| Antibody | Anti-importin α (mouse monoclonal) | BD Bioscience | Cat#: 610485 | WB (1:2000) |
| Antibody | Anti-transportin 1 (mouse monoclonal) | BD Bioscience | Cat#: 558660 | WB (1:1000) |
| Antibody | Anti-Ran (mouse monoclonal) | BD Bioscience | BD:610341 | WB (1:500) |
| Antibody | Anti-FUS (rabbit polyclonal) | Bethyl | Cat#: A300-302A | WB (1:1000) |
| Antibody | Goat anti-rat (goat polyclonal, HRP linked) | Cell Signaling Technology | Cat#: 7077S | WB (1:5000) |
| Antibody | Goat anti-rabbit (goat polyclonal, HRP-linked) | Cell Signaling Technology | Cat#: 7074S | WB (1:5000) |
| Antibody | Horse anti-mouse (horse polyclonal, HRP-linked) | Cell Signaling Technology | Cat#: 7076S | WB (1:5000) |
| Antibody | Anti-RCC1 (rabbit polyclonal) | GeneTex | Cat#: GTX104590 | WB (1:2000) |
| Antibody | Anti-Nup62 (rat monoclonal) | Millipore Sigma | Cat#: MABE1043 | WB (1:500) |
| Antibody | Anti-DDX3X (rabbit polyclonal) | Millipore Sigma | Cat#: HPA001648 | WB (1:1000) |
| Antibody | Anti-importin β (mouse monoclonal) | Millipore Sigma | Cat#: I2534 | WB (1:2000) |
| Antibody | Anti-Nup54 (rabbit polyclonal) | Millipore Sigma | Cat#: HPA035929 | WB (1:250) |
| Antibody | Anti-ribosomal protein 6 (RPS6) (mouse monoclonal) | Santa Cruz Biotechnology | Cat#: sc-74459 | WB (1:1000) |
| Antibody | Anti-Nup133 (mouse monoclonal) | Santa Cruz Biotechnology | Cat#: sc-376699 | WB (1:2500) |
| Antibody | Anti-RanGAP1 (C-5) (mouse monoclonal) | Santa Cruz Biotechnology | Cat#: sc-28322 | WB (1:50) |
| Antibody | Anti-Nup98 (2H10) (rat monoclonal) | Santa Cruz Biotechnology | Cat#: sc-101546 | WB (1:2000) |
| Antibody | Anti-hnRNP A1 (4B10) (mouse monoclonal) | Santa Cruz Biotechnology | Cat#: sc-32301 | WB (1:200) |
| Antibody | Anti-hnRNP A2/B1 (EF-67) (mouse monoclonal) | Santa Cruz Biotechnology | Cat#: sc-53531 | WB (1:200) |
| Commercial assay or kit | miRNeasy kit | Qiagen | Cat#:217004 | |
| Chemical compound, drug | Sypro Ruby Protein Gel Stain | Millipore Sigma | Cat#: S4942 | |
| Chemical compound, drug | SYBR Gold Nucleic Acid Stain | ThermoFisher Scientific | Cat#: S11494 | |
| Chemical compound, drug | Importazole | Millipore Sigma | Cat#: SML0341 | |
| Chemical compound, drug | Alexa Fluor 647 NHS ester | ThermoFisher Scientific | Cat#: A37573 | |
| Chemical compound, drug | Alexa Fluor 488 C5 maleimide | ThermoFisher Scientific | Cat#: A10254 | |
| Chemical compound, drug | EZ-Link Sulfo-NHS-LC-biotin No-weigh format | ThermoFisher Scientific | Cat#: A39257 | |
| Chemical compound, drug | Ni-NTA Agarose | Qiagen | Cat#: 30210 | |
| Chemical compound, drug | Glutathione Sepharose 4B | GE Healthcare | Cat#:17-0756-01 | |
| Chemical compound, drug | Dextran, Texas Red, 10,000 MW | ThermoFisher Scientific | Cat#: D1863 | |
| Chemical compound, drug | Dextran, Texas Red, 40,000 MW | ThermoFisher Scientific | Cat#: D1829 | |
| Chemical compound, drug | Dextran, Texas Red, 70,000 MW | ThermoFisher Scientific | Cat#: D1864 | |
| Chemical compound, drug | Digitonin, high purity | Calbiochem | Cat#: 300410 | |
| Other | Ribo Ruler High Range RNA ladder | ThermoFisher Scientific | Cat#: SM1821 | |
| Other | HIS-Select HF Nickel Affinity Gel | Millipore Sigma | Cat#: HD537 | |
| Other | DNase (RNase free) | Qiagen | Cat#: 79254 | |
| Other | RNase A | ThermoFisher Scientific | Cat#: EN0531 | |
| Other | Glutathione-coated polystyrene particles 6.0–8.0 | Spherotech | Cat#: GSHP-60–5 | |
| Other | Neutravidin-coated polystyrene particles 6.0–8.0 | Spherotech | Cat#: NVP-60–5 | |
| Other | GFP Trap Magnetic Agarose | Chromotek | Cat#: Gtma-20 | |
| Other | Wheat germ agglutinin | Millipore Sigma | Cat#: L0636 | |
| Other | BSA, fatty acid-free | Roche | Cat#: 03117057001 |
Additional files
Download links
A two-part list of links to download the article, or parts of the article, in various formats.
Downloads (link to download the article as PDF)
Open citations (links to open the citations from this article in various online reference manager services)
Cite this article (links to download the citations from this article in formats compatible with various reference manager tools)
C9orf72 arginine-rich dipeptide repeat proteins disrupt karyopherin-mediated nuclear import
eLife 9:e51685.
https://doi.org/10.7554/eLife.51685


