Attacks on genetic privacy via uploads to genealogical databases
- University of California, Davis, United States
- University of Southern California, United States
Figures
Figure 1
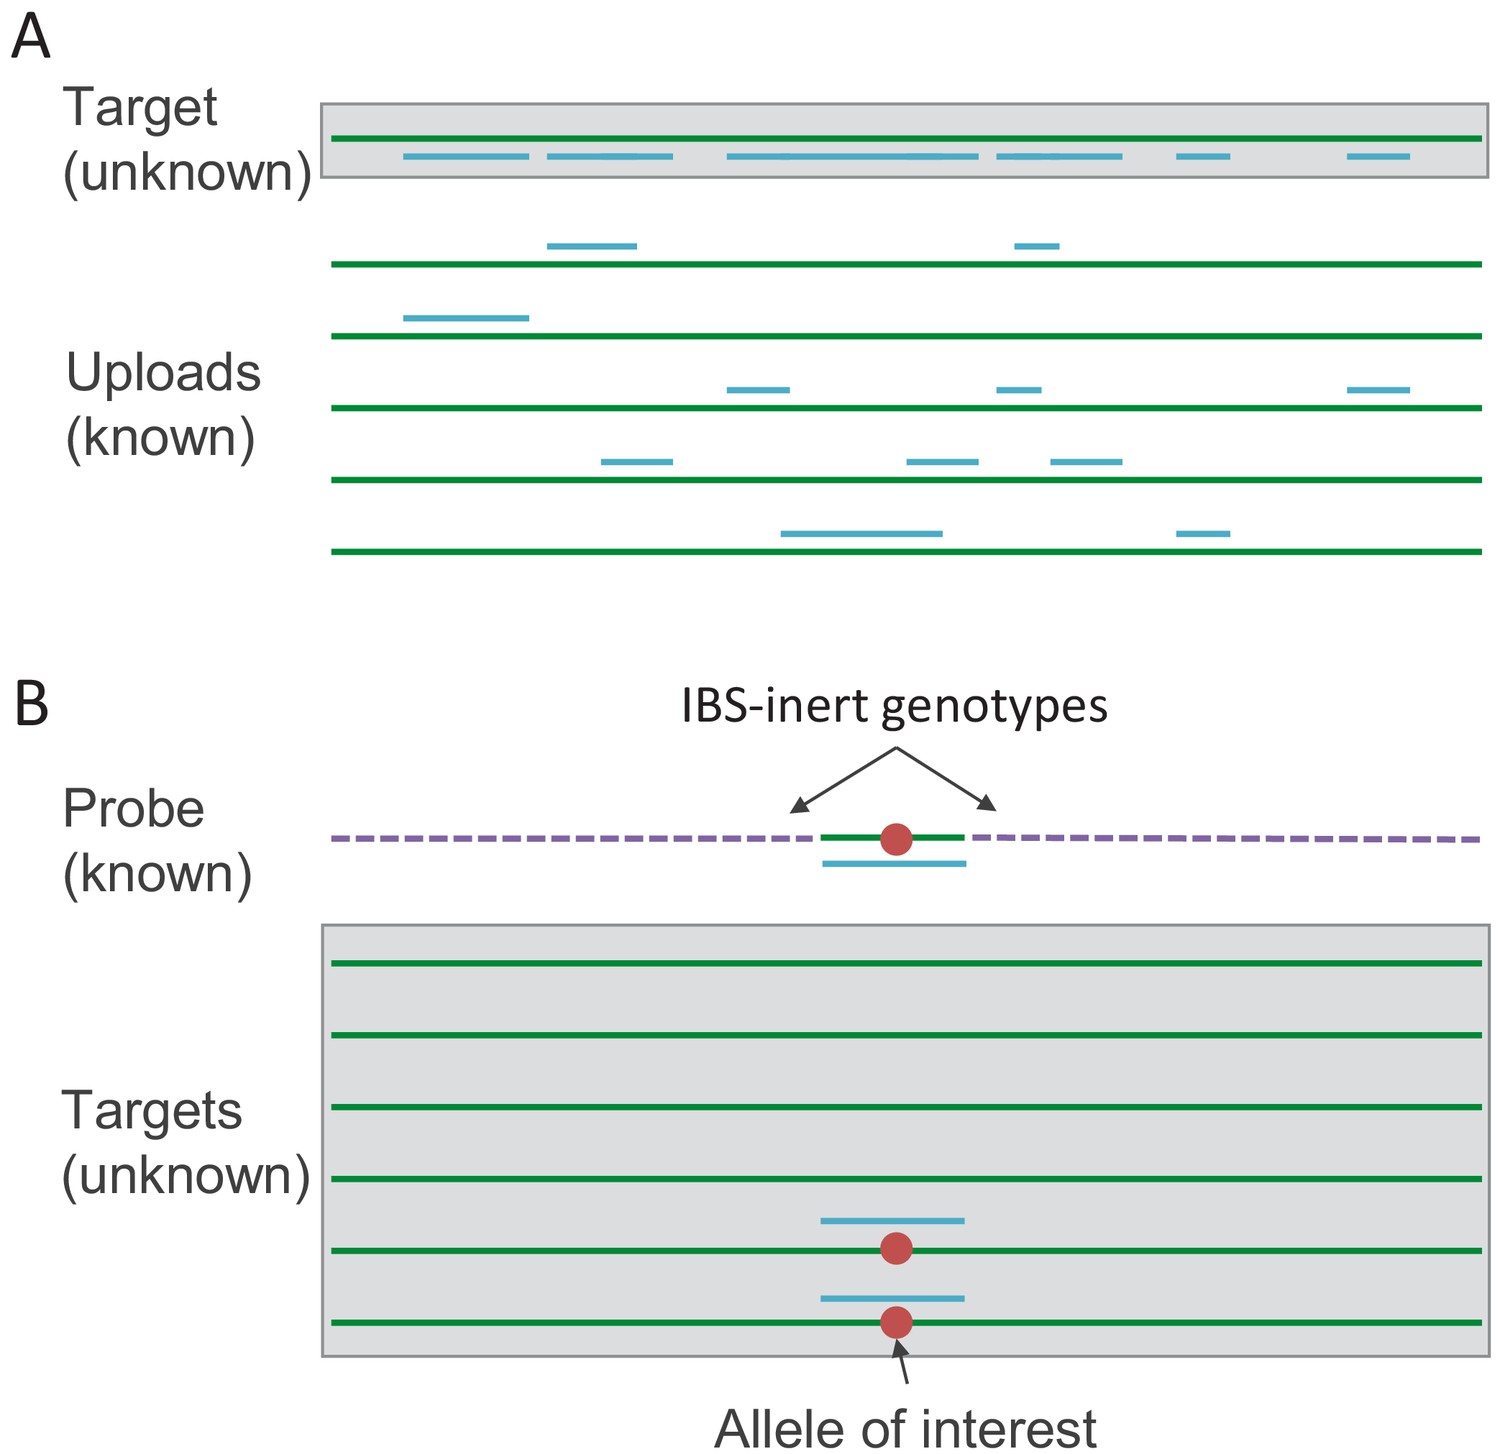
Schematics of the IBS tiling and IBS probing procedures.
(A) In IBS tiling, multiple genotypes are uploaded (green lines) and the positions at which they are IBS with the target (represented by blue lines) are recorded. Once enough datasets have been uploaded, the target will eventually have a considerable proportion of their genome 'tiled’ by IBS with uploads that have known genotypes. (B) In IBS probing, the uploaded probe consists of a haplotype carrying an allele of interest (red dot) surrounded by 'IBS-inert’ segments (purple dashed lines)—fake genotype data designed to be unlikely to share any IBS regions with anyone in the database. In the event of an IBS match in the database, the matching database entry is likely to carry the allele of interest.
Figure 2 with 5 supplements
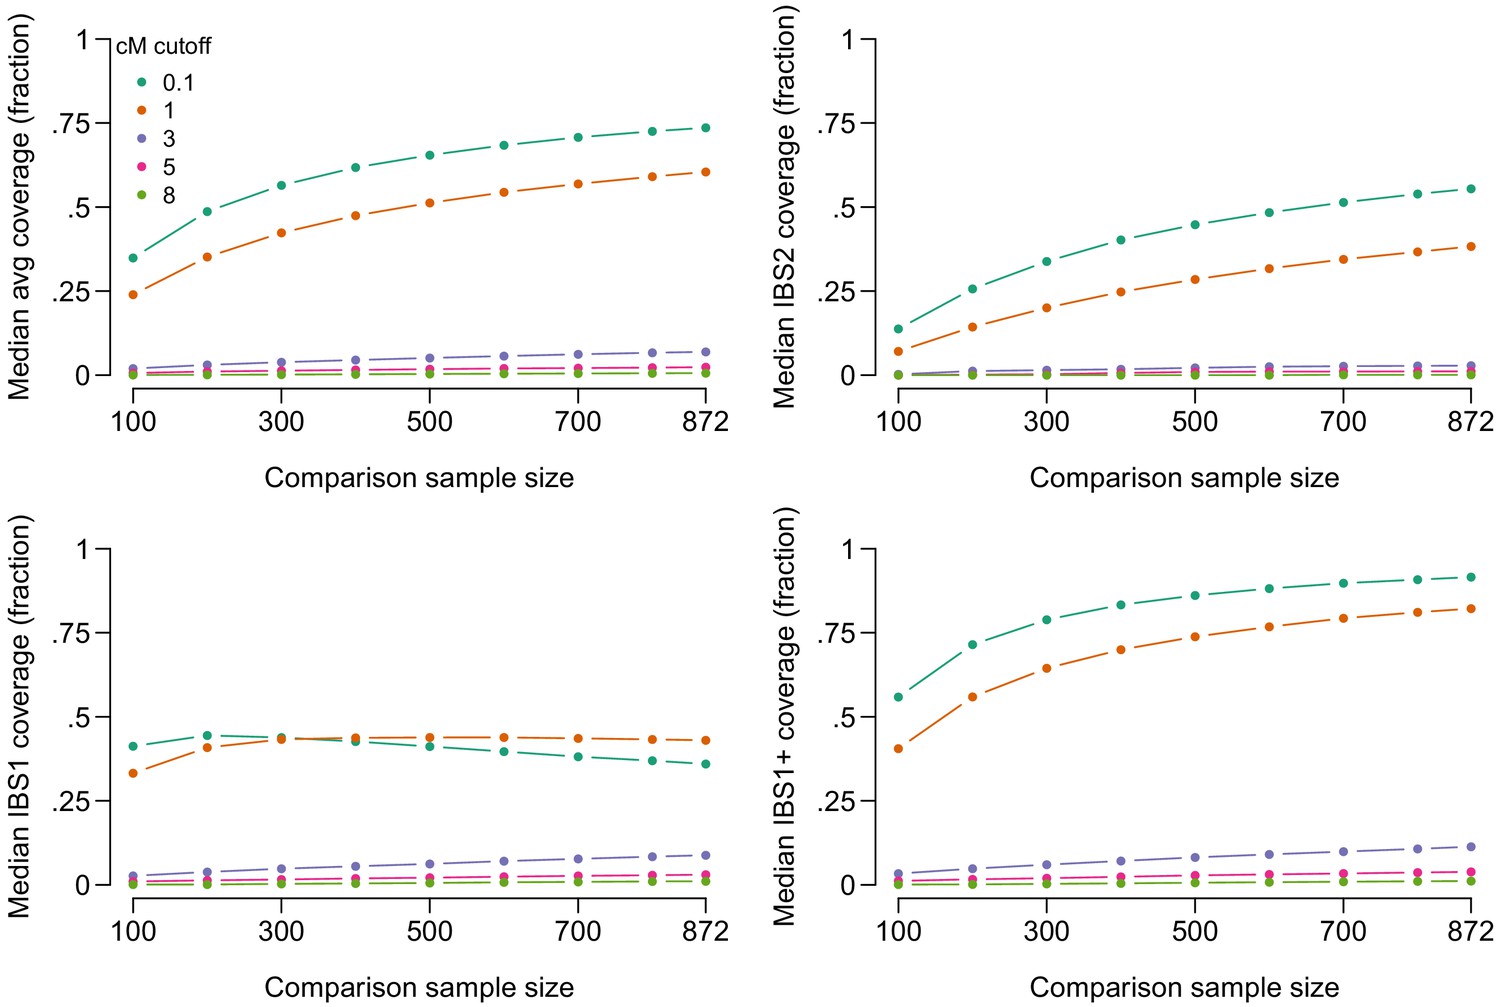
Lengths of genome in Giga base-pairs (Gbp) covered by IBS tiling as a function of minimum required length of IBS segments in centiMorgans (cM) and size of a randomly selected comparison sample for the median person in our dataset.
The top-left panel shows the average coverage across each of the person’s two haplotypes. The top-right shows IBS2 coverage, the length of genome where both haplotypes are covered by IBS tiles. The bottom-left panel shows IBS1, the length of genome where exactly one haplotype is covered by IBS tiles. (IBS1 coverage can decrease at larger comparison sample sizes because IBS2 coverage increases). The bottom-right panel shows IBS1+ coverage, the length of genome covered by either IBS1 or IBS2.
-
Figure 2—source data 1
IBS tiling performance.
- https://cdn.elifesciences.org/articles/51810/elife-51810-fig2-data1-v2.csv
Figure 2—figure supplement 1

Tiling performance with IBS segments that are unlikely to be IBD filtered out.
Conventions are the same as in Figure 2; the difference is that now only IBS segments that represent likely IBD (LOD score >3) are included. As expected, the amount of tiling possible is reduced when the LOD score threshold is increased, particularly when segments as short as 1 cM are allowed. However, tiling still reveals a substantial amount of information about target genotypes. Using a comparison sample of 871, and including all called IBS segments >1 cM, the median person has an average of 35% of the maximum length of 2.8 Gbp covered by IBD segments with LOD >3, and has at least one chromosome covered for approximately 57% of the genome. If only segments >3 cM are included, then averaging across the two chromosomes, median coverage is 5.0%, and the median proportion for which at least one chromosome is covered is 9.5%. As before, the percentage of the genome recoverable by tiling varies among people, and some people still have large proportions of their genetic data recoverable by tiling. With a LOD score threshold of 3, the top 10% of people have at least 58% of their total genotype information covered by IBD tiles, including one or more alleles at sites in at least 81% of the genome covered by IBD tiles.
-
Figure 2—figure supplement 1—source data 1
Tiling performance with IBS segments that are unlikely to be IBD filtered out.
- https://cdn.elifesciences.org/articles/51810/elife-51810-fig2-figsupp1-data1-v2.csv
Figure 2—figure supplement 2
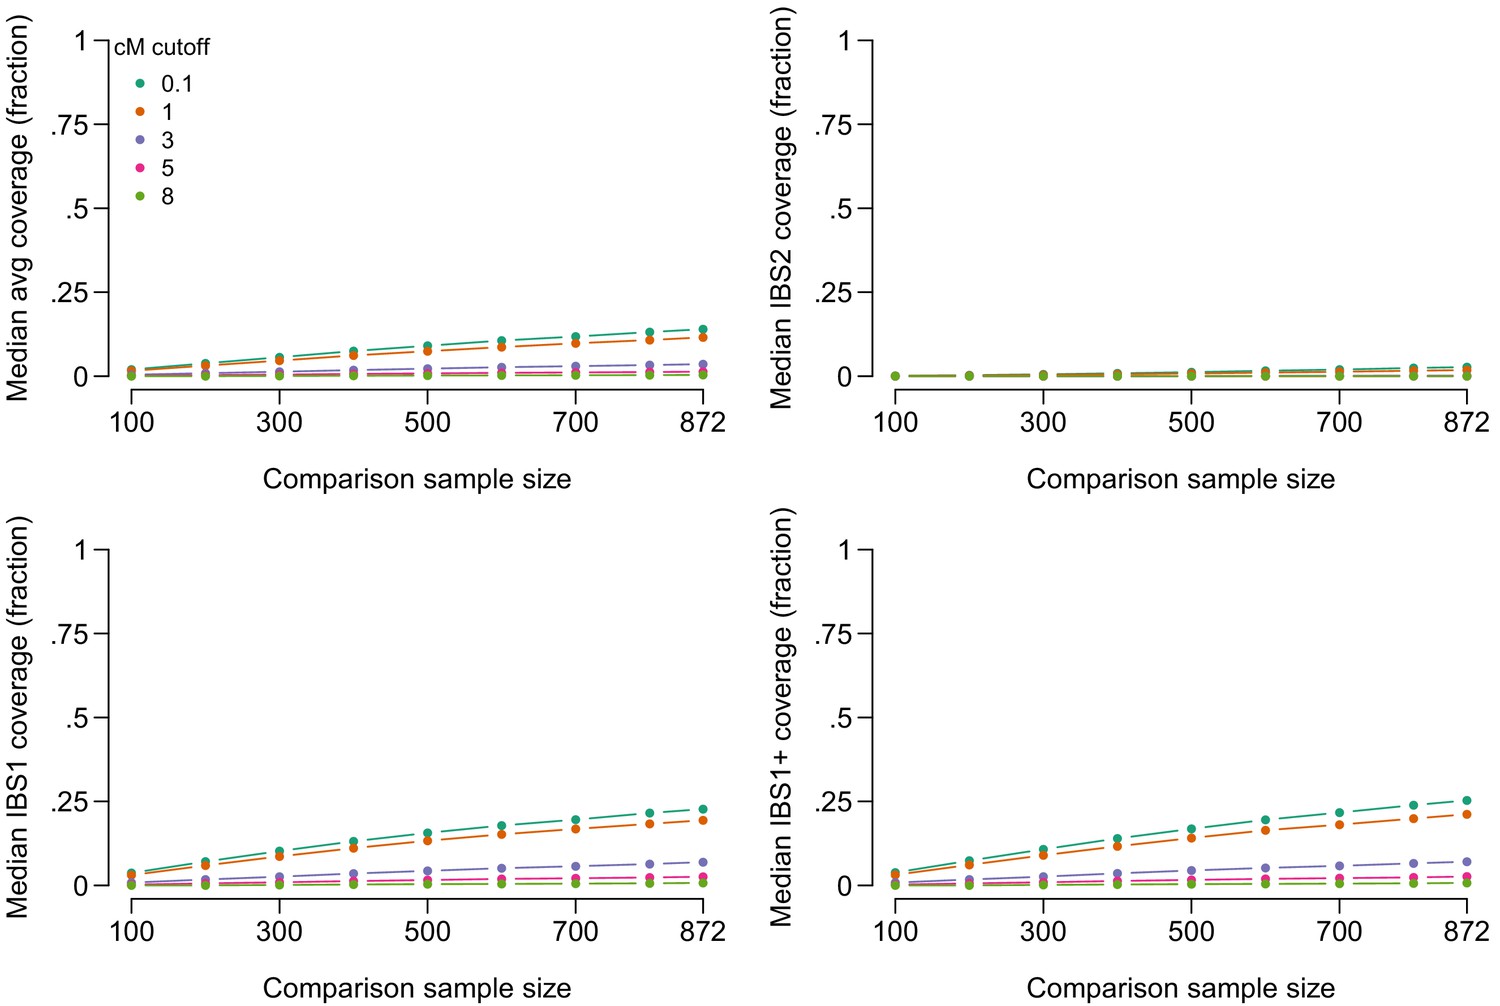
IBS tiling performance, limiting to comparison samples who share at least 1 IBS segment of 8 cM or more with the target.
Conventions are the same as in Figure 2. Some DTC genetics companies use a two-step approach for reporting IBS information to users. For example, at this writing, MyHeritage identifies people who are likely matches of a given user as all those who share an apparent IBD segment of at least 8 cM with the user. However, once matches are identified, inferred IBD segments down to a minimum length of 6 cM are reported to the user (see Table 1). Similarly, FamilyTreeDNA only reports matching segments for pairs of people who pass a sharing threshold, and for those pairs of individuals they report all matches down to 1 cM. As expected, reporting only IBS segments for pairs of people who share at least one long IBS segment (>8 cM) substantially reduces but does not eliminate the effectiveness of IBS tiling. With 872 comparison samples, the median person has approximately 12% of their genome covered by IBS tiles of 1 cM or more (averaged across both chromosomes) and at least one chromosome covered for 21% of the genome. People in the top 10% of IBS tiling coverage have 44% of their genome length recoverable by tiling (averaging across both chromosomes), with at least one chromosome tiled over more than 67% of the genome. Importantly, the practice of requiring at least one long IBS match in order to report any IBS segments will not reduce the effectiveness of IBS tiling if phase-unaware methods are used for calling IBS. In that case, the attacker could simply insert a long run of heterozygous sites in each of the genomic datasets uploaded, causing an apparent long run of IBS with every user in the database (see section 'IBS baiting’). After getting 'in the door’ with a long run of heterozygous sites, the attacker could then use tiling to find out about the rest of the genome.
-
Figure 2—figure supplement 2—source data 1
IBS tiling performance, limiting to comparison samples who share at least 1 IBS segment of8cMor more with the target.
- https://cdn.elifesciences.org/articles/51810/elife-51810-fig2-figsupp2-data1-v2.csv
Figure 2—figure supplement 3

IBS tiling performance when genotype phasing switches are disallowed.
Conventions are the same as in the Figure 2. We called IBS segments using Germline (Gusev et al., 2009), using the haploid flag to find IBS segments within the phased chromosomes produced by Beagle. We also set the err_hom argument to zero, set the bits argument to 32 to increase sensitivity for short segments, used the w_extend flag to extend segments beyond the slices produced by Germline, and set the minimum IBS segment length to 1 cM. (Setting the minimum segment length shorter than 1 cM does not appear to be possible in Germline). The amount of tiling possible is reduced somewhat when phase switches are disallowed. However, tiling still reveals substantial information about target genotypes. Using a comparison sample of 871, and including all called IBS segments >1 cM, the median person has an average of 57% of the maximum length of 2.8 Gbp covered by IBS segments, and has at least one chromosome covered for approximately 79% of the genome. If only segments >3 cM are included, then averaging across the two chromosomes, median coverage is 6.5%, and the median proportion for which at least one chromosome is covered is 11%. The top 10% of people have at least 73% of their genomes covered by IBS tiles of 1 cM or more, including one or more alleles at sites in at least 91% of the genome covered by IBS tiles.
-
Figure 2—figure supplement 3—source data 1
IBS tiling performance when genotype phasing switches are disallowed.
- https://cdn.elifesciences.org/articles/51810/elife-51810-fig2-figsupp3-data1-v2.csv
Figure 2—figure supplement 4
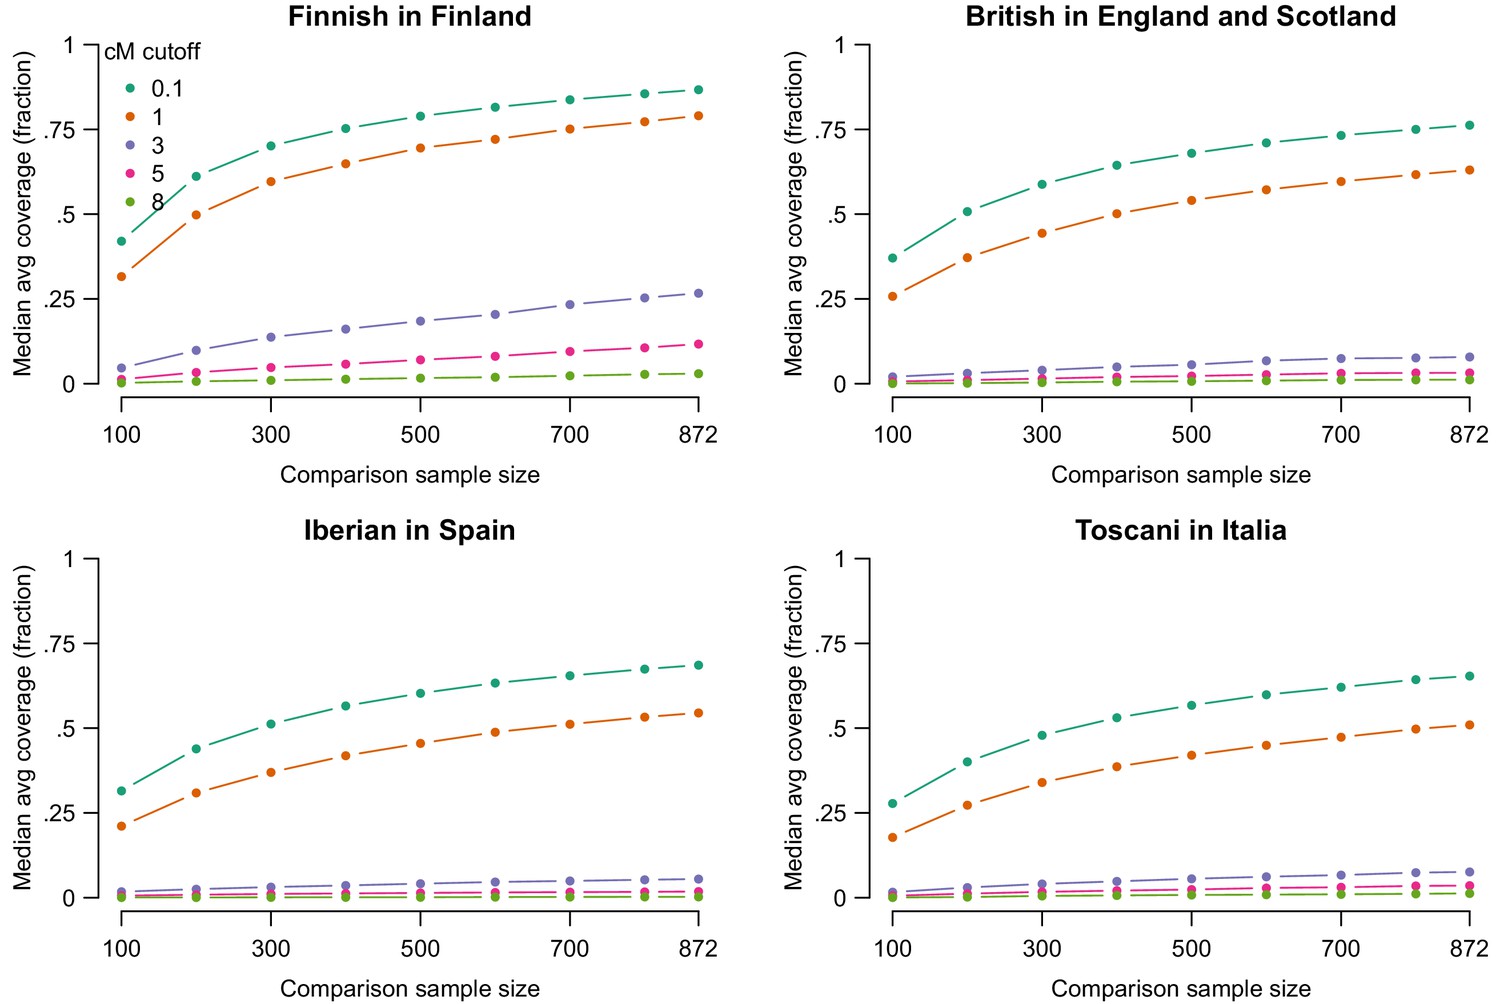
IBS tiling performance in selected populations.
We examined IBS tiling performance in four European populations from the 1000Genomes data—Finnish in Finland (FIN, top left, 99 people), British in England and Scotland (GBR, top right, 91 people), Iberian in Spain (IBS, bottom left, 107 people), and Toscani in Italia (TSI, bottom left, 107 people). In all panels, median average IBS tiling coverage is shown on the vertical axis using refinedIBD with LOD>1, as in the top-left panel of Figure 2. Median tiling accuracy varies among populations. For example, using IBS tiles >1 cM and with all 871 other individuals used in the comparison sample, the median coverage percentages by population were 79% (FIN), 63% (GBR), 55% (IBS), and 51% (TSI). The most striking population difference is the higher IBS tiling rates attained among Finns, who have long been of interest as a founder population, having experienced a bottleneck approximately 100 generations ago (Kere, 2001). Another factor that likely influences these results is the genetic similarity of members of each population to members of other populations included—for example, the CEU population of 1000Genomes is closely related to the GBR population, and the inclusion of CEU may partially account for the higher tiling rates in GBR than in IBS or TSI.
-
Figure 2—figure supplement 4—source data 1
IBS tiling performance in selected populations.
- https://cdn.elifesciences.org/articles/51810/elife-51810-fig2-figsupp4-data1-v2.csv
Figure 2—figure supplement 5
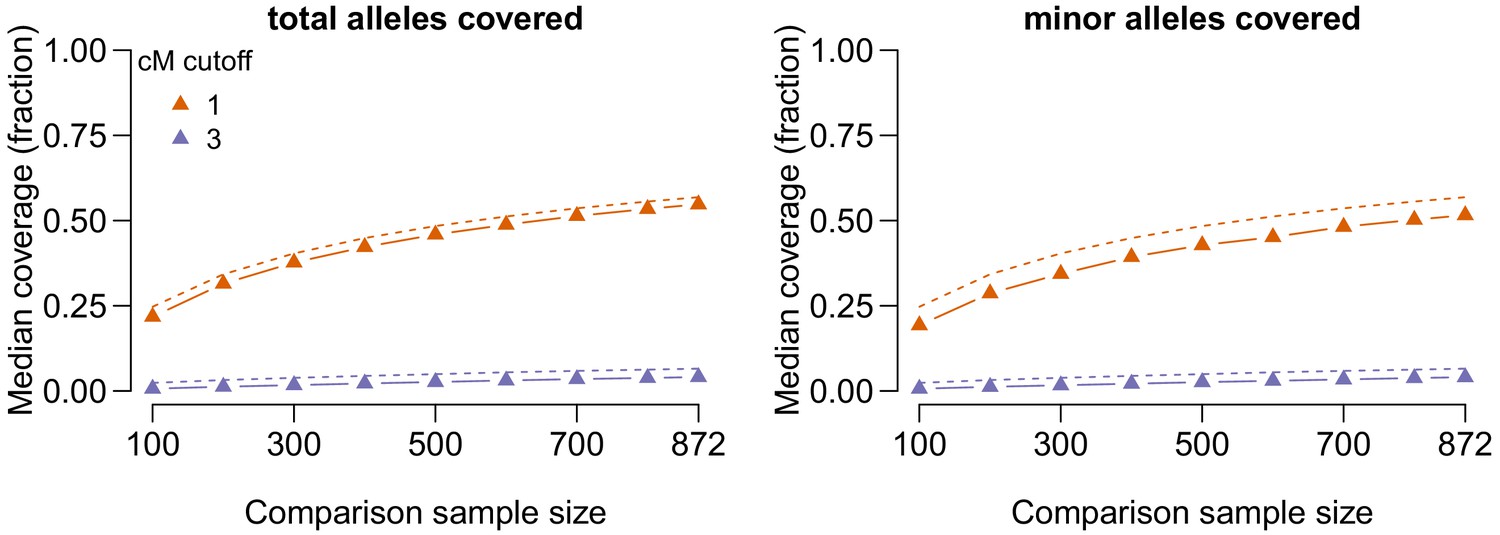
IBS tiling performance in terms of number of total alleles covered (left panel) and number of minor alleles covered (right panel, 18.6% of total alleles were minor alleles).
We used Germline in haploid mode (as in Figure 2—figure supplement 3), as it allows easier identification of which allele is covered by a given IBS segment. Dashed lines show the results in terms of fraction of base pairs covered, whereas the solid lines show results in terms of alleles covered. Results for cM cutoffs <1 are not shown because they cannot be run in Germline, and results for cM cutoffs >3 are not shown because it is difficult to distinguish the dashed and solid lines. As would be expected, there is a slight bias for IBS tiles to fall in regions with lower SNP density, leading to slightly fewer alleles on the chip being covered than would be expected on the basis of total base pairs covered. For example, with a 1 cM cutoff and all samples included, the median is 57% of the genome length in base pairs covered by IBS tiles, whereas the median proportion of total alleles covered by IBS tiles is 55%. It also appears that IBS tiles may be more likely to appear in regions that are less genetically diverse, as the proportion of minor alleles tiled is slightly lower than the proportion of total alleles covered. For example, with a 1 cM cutoff and all samples included, the proportion of minor alleles covered by IBS tiles is 52%.
-
Figure 2—figure supplement 5—source data 1
IBS tiling performance in terms of number of total alleles covered (left panel) and number of minor alleles covered.
- https://cdn.elifesciences.org/articles/51810/elife-51810-fig2-figsupp5-data1-v2.csv
Figure 3 with 2 supplements

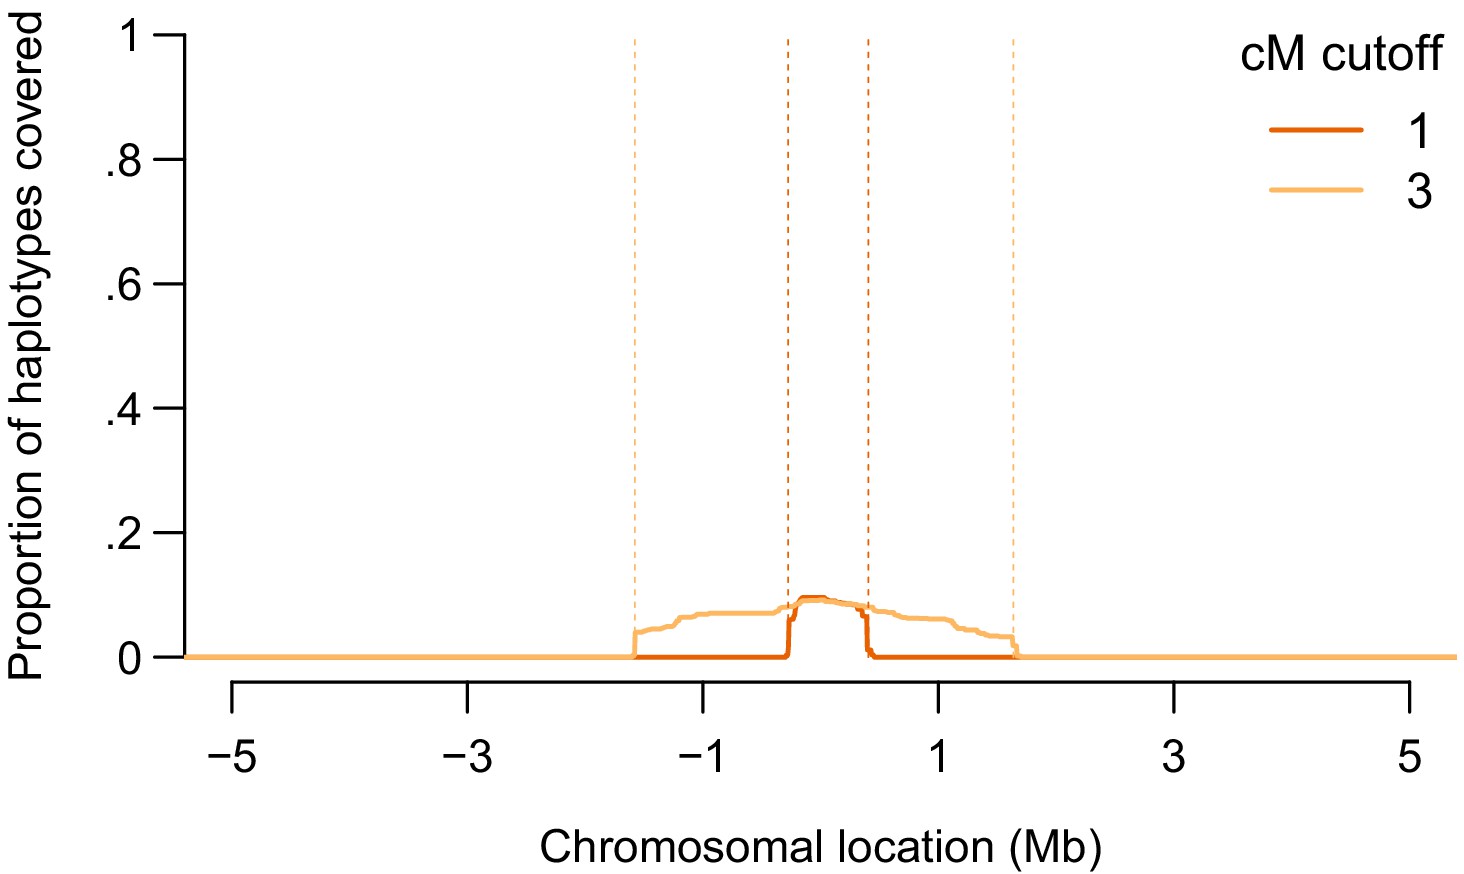
A demonstration of the IBS probing method around position 45411941 on chromosome 19 (GRCh37 coordinates), in the APOE locus.
We show the proportion of haplotypes among the 872 Europeans in our sample covered IBS by probes constructed from the sample, as a function of the chromosomal location in a 10-Mb region around the site of interest. In red, we show the coverage using a 1-cM threshold for reporting IBS, where the probes are constructed using real data in a 1.9-cM region centered on the site of interest (region boundaries shown in dashed orange). In orange, we show the coverage using a 3-cM threshold for reporting IBS, where the probes are constructed using real data in a 5.9-cM region around the site of interest.
Figure 3—figure supplement 1
IBS probing with including only segments with LOD>3.
A demonstration of the IBD probing method around position 45411941 on chromosome 19 (GRCh37 coordinates), in the APOE locus. Conventions are the same as in Figure 3; the difference is that only IBS segments with a LOD score >3 for IBD are included. When IBD probing is performed with a 1-cM threshold, 9.6% of haplotypes had a match among the probes constructed from the other 871 people in the dataset. With a 3-cM threshold, 9.2% of haplotypes had a match. .
Figure 3—figure supplement 2
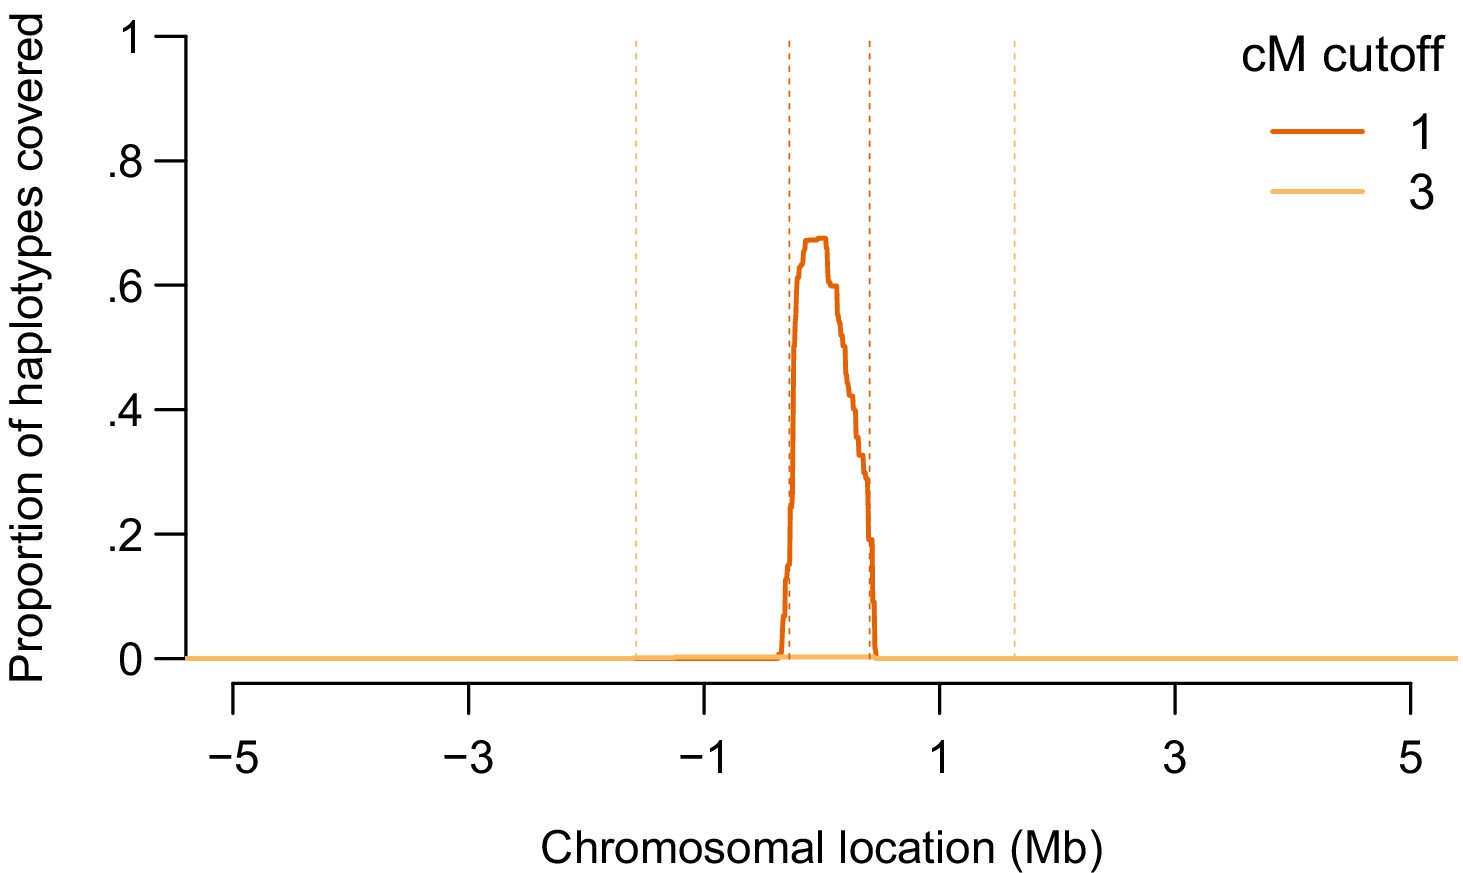
IBS probing using Germline (Gusev et al., 2009) in haploid mode.
A demonstration of the IBS probing method around position 45411941 on chromosome 19 (GRCh37 coordinates), in the APOE locus. Conventions are the same as in Figure 3; the difference is that IBS calling was performed by Germline (Gusev et al., 2009) in haploid mode, meaning that phasing switches are disallowed. We set the err_hom argument to zero, we used the w_extend flag to extend segments beyond the slices produced by Germline, and we set the minimum IBS segment length to 1-cM. All other arguments were kept at their default values. When IBS probing is performed with a 1-cM threshold, 67.5% of haplotypes had a match among the probes constructed from the other 871 people in the dataset. With a 3 cM threshold, 0.2% of haplotypes had a match.
Figure 4
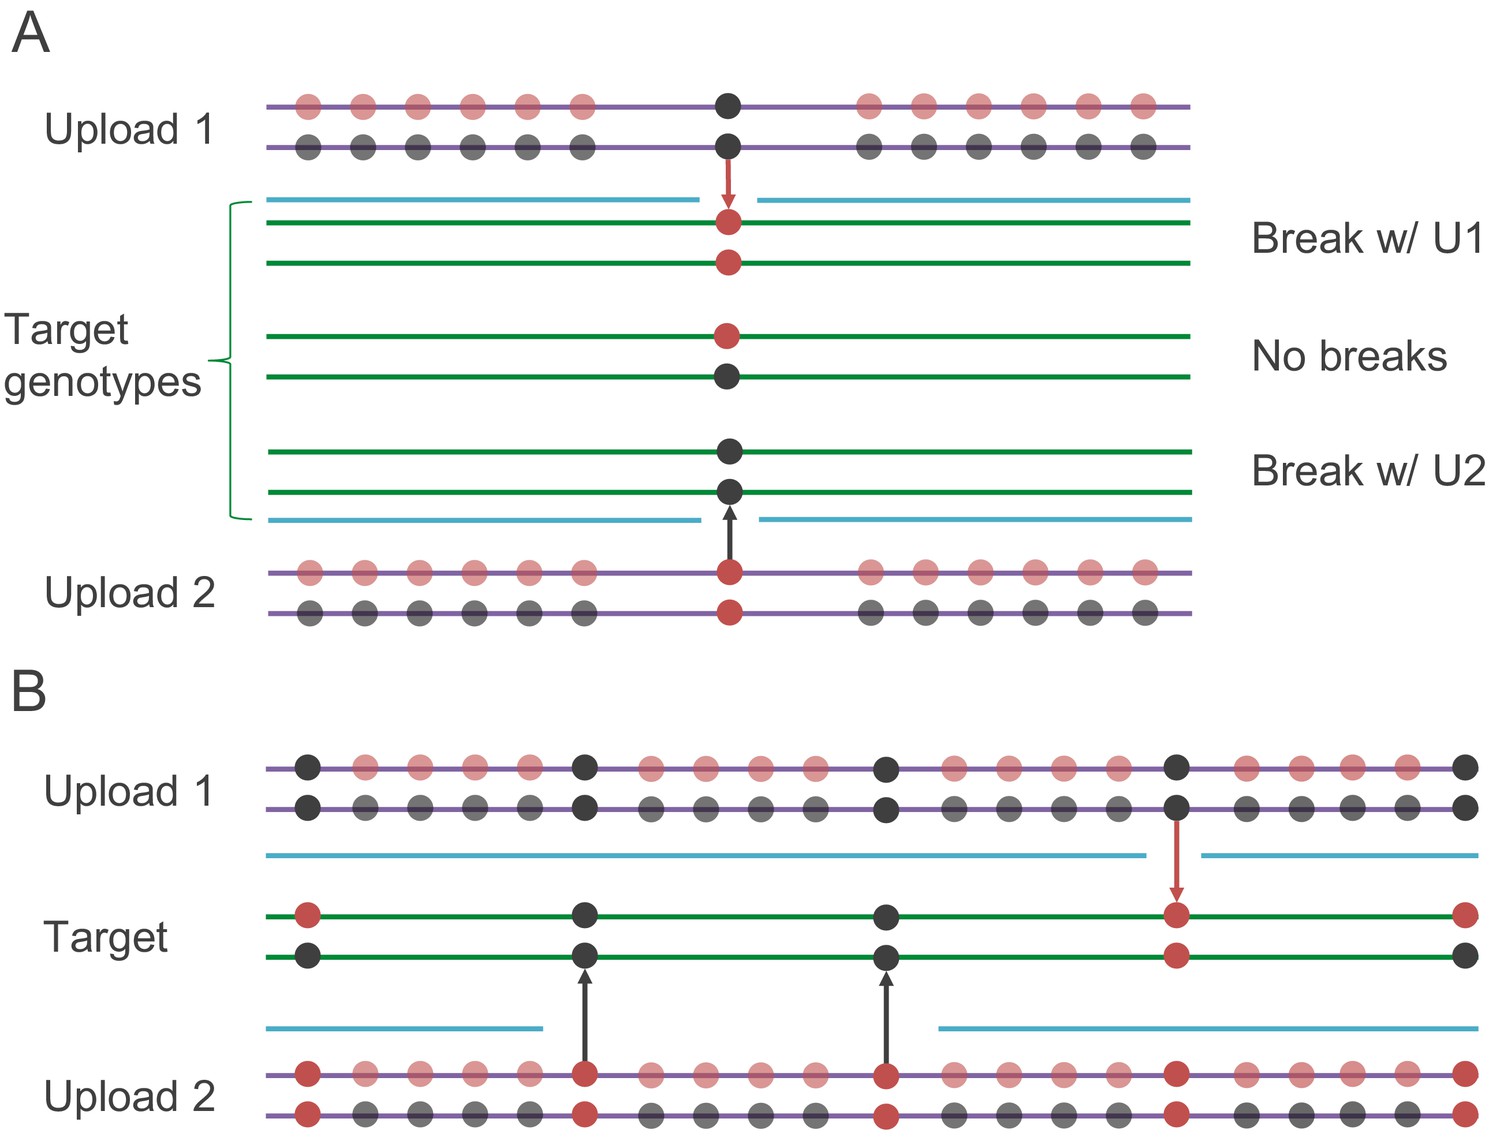
Schematics of the IBS baiting procedure.
(A) To perform IBS baiting at a single site, two uploads are required, each with runs of heterozygous genotypes flanking the key site. At the key site, the two uploaded datasets are homozygous for different alleles. The three possible target genotypes at the key site can each be determined by examining their IBS coverage with the uploads. If there is a break in IBS with either upload, then the target is homozygous for the allele not carried by the upload that shows the break in IBS (with the broken IBS segment shown as a cyan line). If there is no break in IBS with either upload, then the target is heterozygous at the key site. (B) Target genotypes at many key sites across the genome can be learned by comparison with two uploaded datasets, as long as key sites are spaced widely enough.
Figure 5
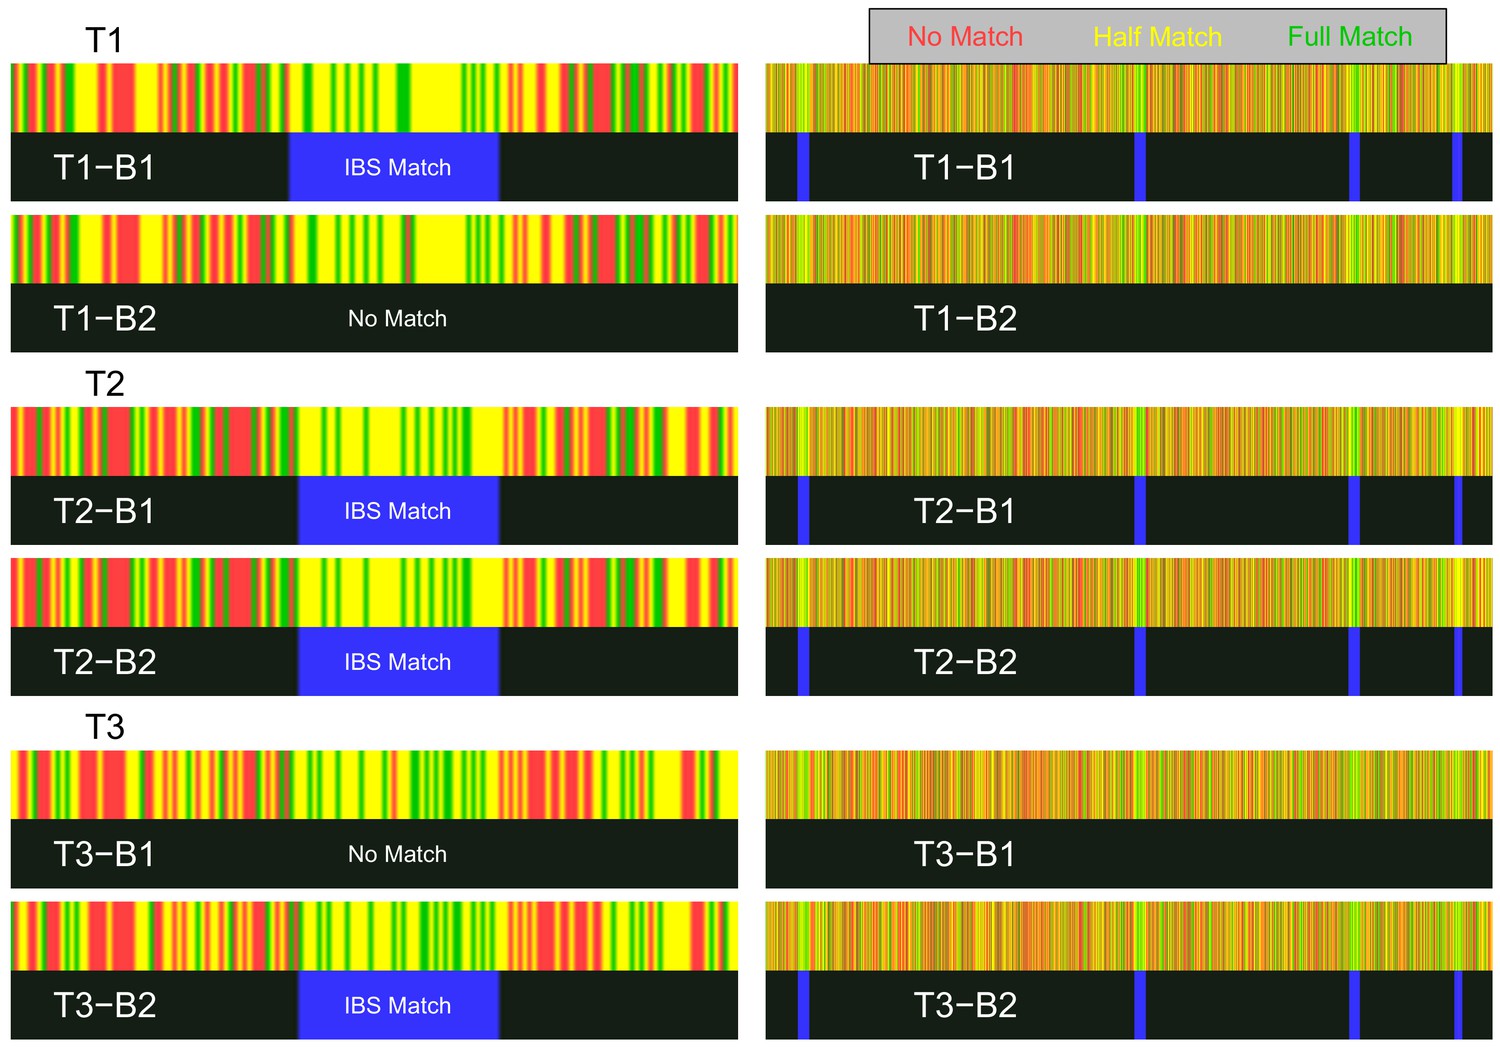
Visualization of IBS baiting using GEDmatch’s 1-to-1 chromosome browser.
Left: Zoomed-in view of the region containing key SNP 1, showing the three target kits (T1–T3) matched to the two bait kits (B1 and B2). Right: Zoomed-out views of regions containing all four key SNPs on chromosome 22. For each pair of bait and target kits, the top rectangle (red, yellow, or green) shows the GEDmatch SNP-level pairwise genotype-match image (colored to show no match, half match, or full match) returned by the 1-to-1 GEDmatch tool. The bottom rectangle (black and blue) shows the GEDmatch IBD-track image, black for no putative IBD match, blue regions showing putative IBD segments. The white text on the IBS track is not provided by GEDmatch and was added as a guide to the eye. Opposite-homozygote calls at the key SNP are seen in the left panel as a red line in an otherwise matching region (yellow and green). The spatial positions of SNPs in the match panel appears to have been jittered; for example the location of the red line varies slightly in the different plots that should have the same coordinate system (perhaps as a countermeasure against a Ney et al., 2020-style attack).
Tables
Table 1
Key parameters for several genetic genealogy services that allow user uploads as of July 26th, 2019.
| Service | Database size (millions) | Individuals shown | IBS/IBD Segments Reported |
|---|---|---|---|
| GEDmatch | 1.2 | 3000 closest matches shown free; Unlimited w/ $10/month license; any two kits can be searched against each other | Yes if longer than user-set threshold. Min. threshold 0.1 cM, default 7 cM |
| FamilyTreeDNA | 1* | All that share at least one 9 cM block or one 7.69 cM block and 20 total cM | Yes, down to 1 cM, for $19 per kit |
| MyHeritage | 3 | All that share at least one 8 cM block | Yes, down to 6 cM, for $29 per kit or unlimited for $129/year. Customers may opt out |
| LivingDNA | Unknown | Putative relatives out to about 4th-cousin range | Only sum length of matching segments reported |
| DNA.LAND** | 0.159 | Top 50 matches shown with minimum 3 cM segment | Yes |
-
*Although Regalado (2019) reports that FamilyTreeDNA has two million users, he also suggests that only about half of these are genotyped at genome-wide autosomal SNPs, which is in line with other estimates (Larkin, 2018).
**DNA.LAND has discontinued genealogical matching for uploaded samples as of July 26th, 2019.
Table 2
Potential countermeasures against the methods of attack outlined here, with their likely effectiveness against IBS tiling, IBS probing, and IBS baiting.
| Strategy | Prevents IBS tiling | Prevents IBS probing | Prevents IBS baiting |
|---|---|---|---|
| Require cryptographic signature from genotyping service | Yes | Yes | Yes |
| Restrict reporting of IBS to long segments (e.g. >8 cM) | Partially | Partially | Weakly |
| Report number and lengths of IBS segments but not locations | Yes | No | Partially |
| Block homozygous uploads | Partially | No | No |
| Report small number of matching individuals per kit | Partially | Partially | Partially |
| Disallow matching between arbitrary kits | Partially | Partially | Partially |
| Block uploads of publicly available genomes | Partially | No | No |
| Block uploads with evidence of IBS-inert segments | No | Yes | No |
| Block uploads with long runs of heterozygosity | No | No | Partially |
| Use phase-aware methods for IBS detection | No | No | Yes |
Table 3
Summary of the SNPs targeted by baiting and the IBS returned by GEDmatch.
For each region, we give the position of the key SNP (target bp). Because by design our bait kits are genetically identical outside of the target SNPs, the IBS regions returned by GEDmatch’s 1-to-1 tool are identical across bait kits generating a match. For each pairwise comparison, we report the IBS information returned: Left-Right bp of the IBS region, the cM length, the number (#) of SNPs in the IBS region with a non-missing target. We also report the number (#) of SNPs spanned by the region IBS when matched to the missing target Bmiss.
| Matching pairs | Target 1 | Target 2 | Target 3 | Target 4 | |
|---|---|---|---|---|---|
| target bp | 27613130 | 34024097 | 37673781 | 42008068 | |
| T1-(B1 Bmiss) | |||||
| IBS L bp | 27427698 | 33771672 | 37519864 | 40054428 | |
| IBS R bp | 27680780 | 34328741 | 37827711 | 43112674 | |
| IBS cM | 1.3 | 0.8 | 1.1 | 1.2 | |
| # SNPs | 47 | 45 | 42 | 40 | |
| # SNPs Bmiss | 46 | 44 | 41 | 39 | |
| T2-(B1 B2 Bmiss) | |||||
| IBS L bp | 27433179 | 33771672 | 37508507 | 40357667 | |
| IBS R bp | 27680780 | 34328741 | 37827711 | 43112674 | |
| IBS cM | 1.3 | 0.8 | 1.2 | 0.9 | |
| # SNPs | 45 | 45 | 45 | 32 | |
| # SNPs Bmiss | 44 | 44 | 44 | 31 | |
| T3-(B3 Bmiss) | |||||
| IBS L bp | 27433179 | 33771672 | 37519864 | 40357667 | |
| IBS R bp | 27680780 | 34328741 | 37827711 | 43112674 | |
| IBS cM | 1.3 | 0.8 | 1.1 | 0.9 | |
| # SNPs | 45 | 45 | 45 | 32 | |
| # SNPs Bmiss | 44 | 44 | 41 | 31 | |
| Tmiss-(All Baits) | |||||
| IBS L bp | 27433179 | 33771672 | 37519864 | 40357667 | |
| IBS R bp | 27680780 | 34328741 | 37827711 | 43112674 | |
| IBS cM | 1.3 | 0.8 | 1.1 | 0.9 | |
| # SNPs | 44 | 44 | 44 | 31 | |
| # SNPs Bmiss | 44 | 44 | 44 | 31 |
-
Table 3—source data 1
GEDmatch demonstration summary.
- https://cdn.elifesciences.org/articles/51810/elife-51810-table3-data1-v2.csv
Additional files
Download links
A two-part list of links to download the article, or parts of the article, in various formats.
Downloads (link to download the article as PDF)
Open citations (links to open the citations from this article in various online reference manager services)
Cite this article (links to download the citations from this article in formats compatible with various reference manager tools)
Attacks on genetic privacy via uploads to genealogical databases
eLife 9:e51810.
https://doi.org/10.7554/eLife.51810


