A delayed fractionated dose RTS,S AS01 vaccine regimen mediates protection via improved T follicular helper and B cell responses
- Department of Microbiology and Immunology, University of Miami Miller School of Medicine, United States
- Biotechnology HPC Software Applications Institute, Telemedicine and Advanced Technology Research Center, U.S. Army Medical Research and Development Command, United States
- Henry M. Jackson Foundation for the Advancement of Military Medicine, United States
- GSK Vaccine, Belgium
- PATH’s Malaria Vaccine Initiative, United States
Figures
Figure 1
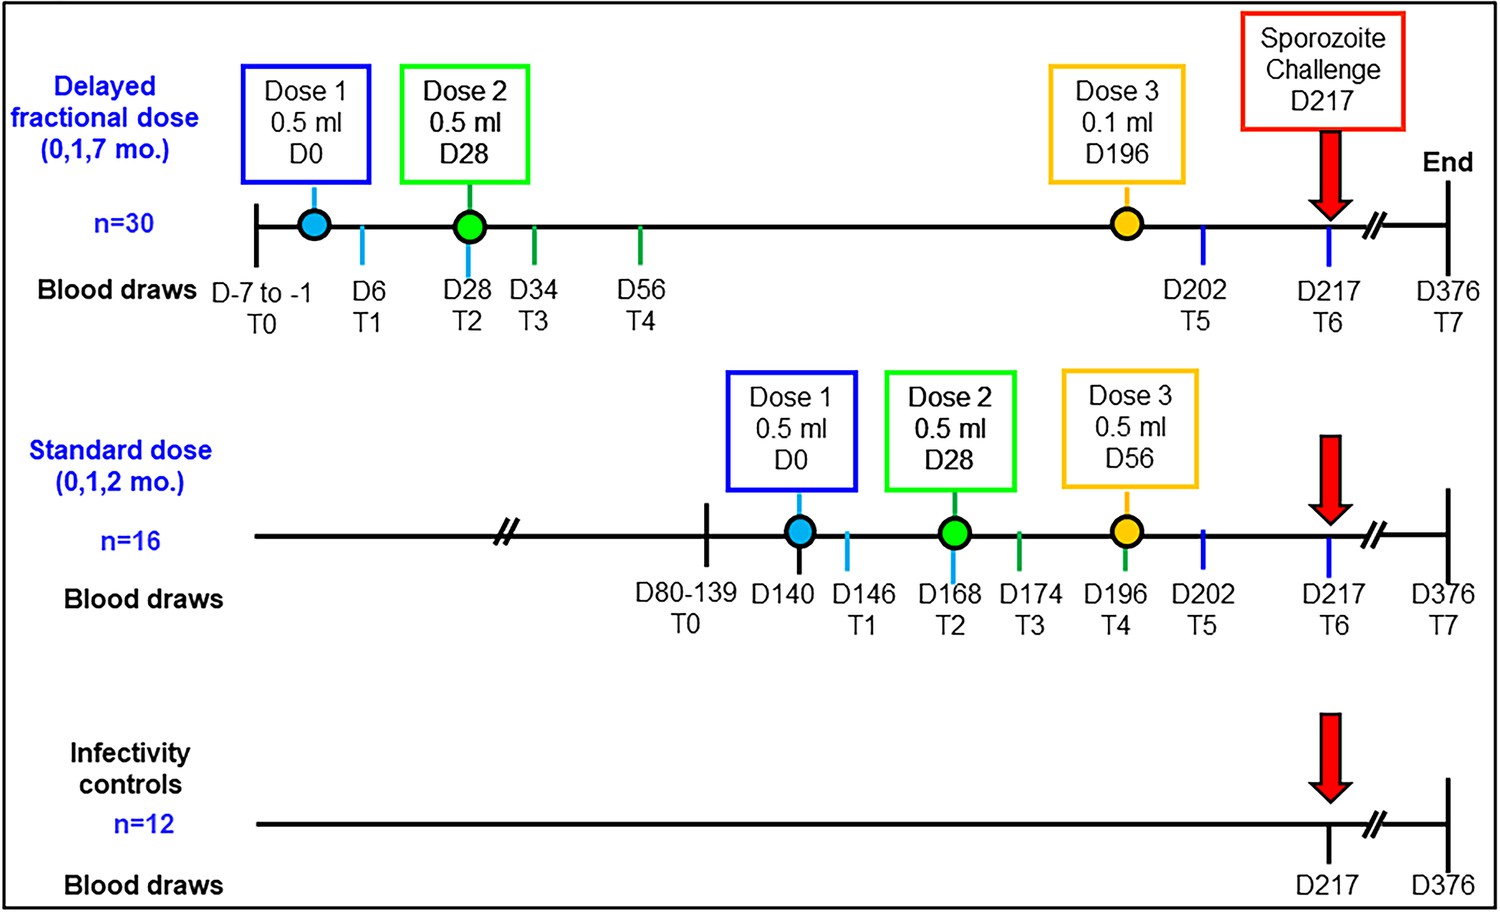
Study schema and assay timepoints.
Timings of the first, second and third vaccine doses in either the standard dose regimen or the delayed fractional dose regimen are depicted in blue, green and yellow circles, respectively. Blood draws for immunology studies were performed at 8 timepoints designated T0 to T7: pre-vaccination (T0), day 6 (T1) and day 28 post first vaccination (T2), day 6 post second vaccination (T3), day 28 post second vaccination (T4), day 6 post third vaccination (T5), day 21 post third vaccination (T6, day of challenge) and at study end (T7, day 376; 159 days post-challenge).
Figure 2 with 2 supplements
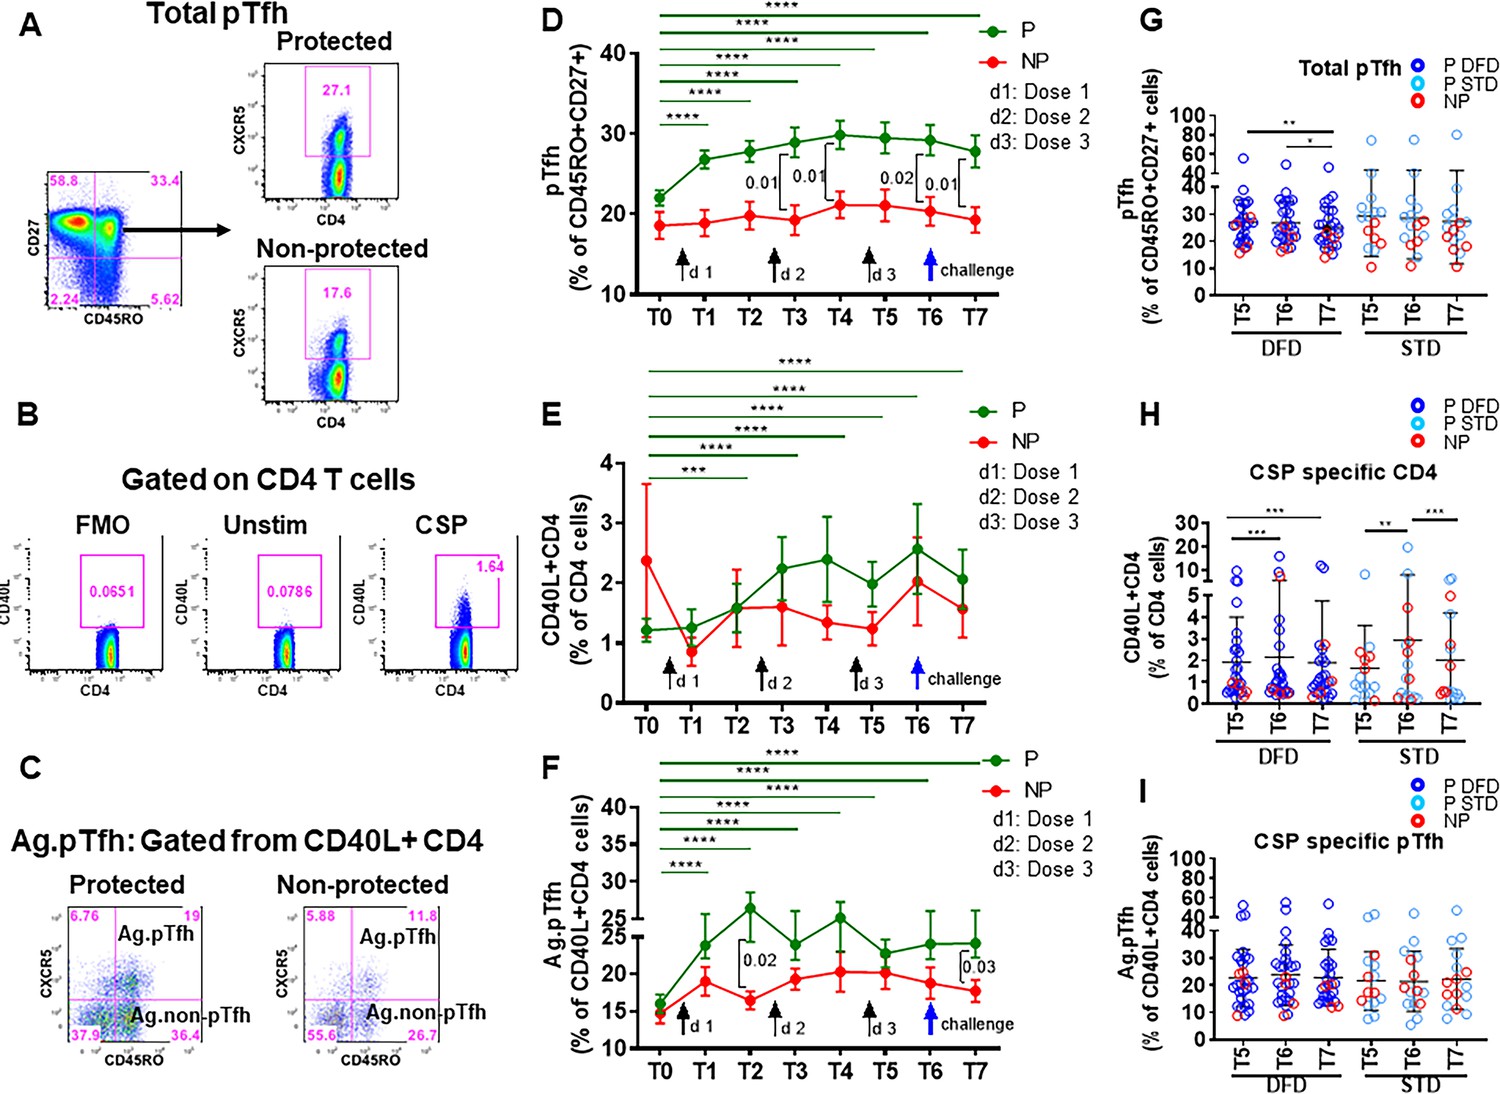
Higher frequencies of total pTfh and CSP-specific CD4 and CSP-specific pTfh cell responses in protected subjects.
Frequencies of total pTfh, CSP-specific CD4 T cells and CSP-specific pTfh cells were identified by flow cytometry after 12 hr of PBMC stimulation with a CSP peptide pool in vaccinated subjects at different timepoints. Longitudinal data at different time points were analyzed for protected (P, n = 35) and non-protected (NP, n = 10) participants. (A–C) Flow cytometry dot plots for total pTfh cells, i.e. CD45RO+CD27+CXCR5+ cells gated from CD4 T cells (A); CSP-specific CD4 T cells, i.e. CD40L+ CD4 T cells (B); and CSP-specific pTfh cells, i.e. CD45RO+CXCR5+ cells gated from CD40L+ CD4 T cells (C). (D–F) Line graphs with error bars indicating mean ± standard error of mean (SEM) for protected (green line) and non-protected (red line) individuals showing frequencies of total pTfh cells (D), CD40L+CD4 T cells (E) and CSP-specific pTfh cells (F). (G–I) Scatter plots of CD4 T cell subsets in DFD and STD regimens at T5, T6 and T7 showing total pTfh cells (F), CSP-specific CD4 T cells (G) and CSP-specific pTfh cells (I) with data for the protected group represented by dark blue open circles for DFD (P DFD) and light blue open circles for the STD regimen (P STD), and the non-protected group represented by red open circles (NP) for both regimens. Statistical analysis was performed using the generalized linear mixed-effects model via Penalized Quasi-Likelihood to accommodate repeated measures over time. P values shown within the graphs refer to significant difference between the P and NP groups at the indicated time points. Statistical significance is shown as *p, <0.05; **, p<0.01; ***, p<0.001.
-
Figure 2—source data 1
Total pTfh frequencies (Figure 2D).
- https://cdn.elifesciences.org/articles/51889/elife-51889-fig2-data1-v3.xlsx
-
Figure 2—source data 2
Frequencies of CSP-specific CD4 T cells (Figure 2E).
- https://cdn.elifesciences.org/articles/51889/elife-51889-fig2-data2-v3.xlsx
-
Figure 2—source data 3
Frequencies of CSP-specific pTfh cells (Figure 2F).
- https://cdn.elifesciences.org/articles/51889/elife-51889-fig2-data3-v3.xlsx
-
Figure 2—source data 4
Frequencies of total pTfh: DFD vs STD (Figure 2G).
- https://cdn.elifesciences.org/articles/51889/elife-51889-fig2-data4-v3.xlsx
-
Figure 2—source data 5
Frequencies of CSP-specific CD4 T cells: DFD vs STD (Figure 2H).
- https://cdn.elifesciences.org/articles/51889/elife-51889-fig2-data5-v3.xlsx
-
Figure 2—source data 6
Frequencies of CSP-specific pTfh cells: DFD vs STD (Figure 2I).
- https://cdn.elifesciences.org/articles/51889/elife-51889-fig2-data6-v3.xlsx
Figure 2—figure supplement 1
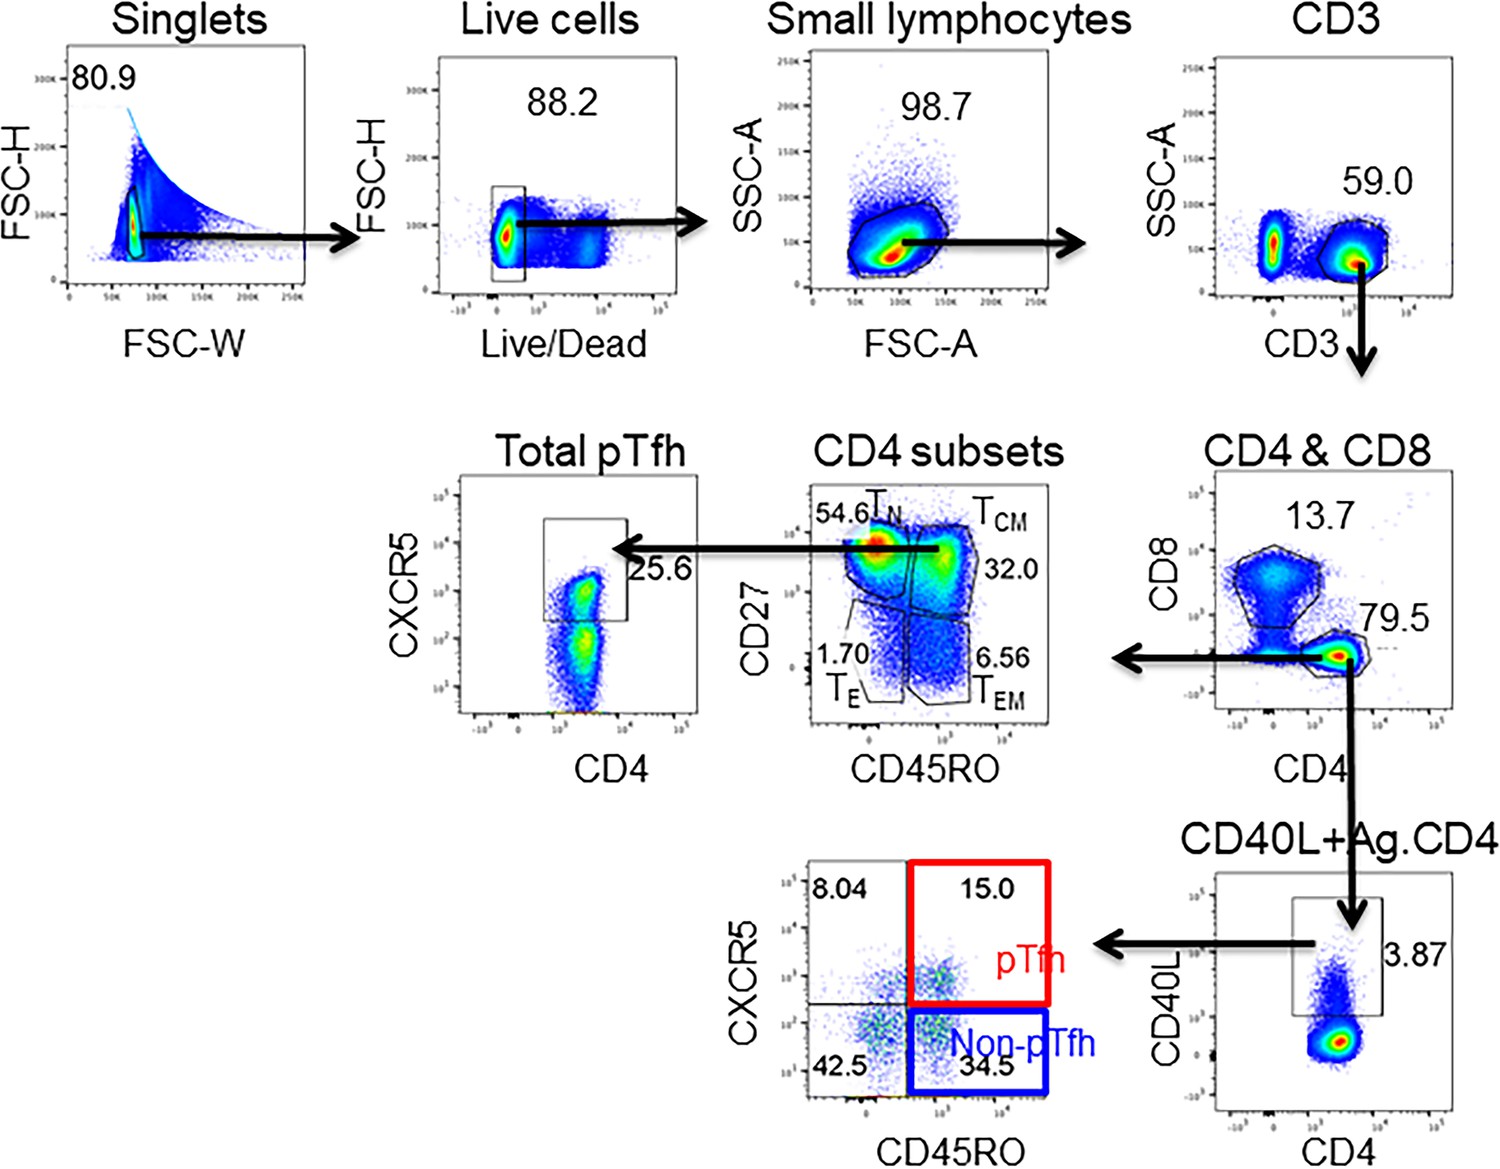
Gating strategy for the identification total pTfh, CSP-specific CD4 and CSP-specific pTfh.
CSP-specific CD4 T cells and pTfh cells were identified by flow cytometry after 12 hr of PBMC stimulation with a CSP peptide pool in vaccinated subjects at different timepoints. Live (Aqua-) cells were gated from the singlets followed by CD3+ T cell gating from the live small lymphocytes. CD4+ and CD8+ T cells were further gated from CD3+ T cells. on the basis of the expression of CD45RO and CD27, CD4 T cell maturation subsets were identified as naïve (TN: RO-CD27+), central memory (TCM) RO+CD27+, effector memory (TEM: RO+CD27–) and effector (TE: RO–CD27–). CXCR5+ Total pTfh cells were gated from TCM cells. CSP-specific CD4 T cells were identified on the basis of CD40L expression. CSP-specific CD4 T cells were further gated on the basis of the expression of CD45RO and CXCR5 as pTfh (CD45RO+CXCR5+) and non-pTfh (CD45RO+CXCR5–).
Figure 2—figure supplement 2

Frequency and function of CSP-specific non-pTfh did not differ between P and NP subjects.
CSP-specific non-pTfh cells were identified as CD4+CD40L+CD45RO+CXR5– cells in P (n = 35) and NP (n = 10) subjects. (A–D) The line graphs represent the mean ± SEM for frequencies of CSP-specific non-pTfh (A), IL-21+ CSP-specific non-pTfh (B), ICOS+ CSP-specific non-pTfh (C), and Ki67+ CSP-specific non-pTfh cells (D) in P (green line) and NP (red line) subjects. (E–H) Scatter plot compare CSP-specific non-pTfh cells (E), IL-21+ CSP-specific non-pTfh (F), ICOS+CSP-specific non-pTfh (G), and Ki67+CSP-specific non-pTfh (H) in DFD and STD regimens at T5, T6 and T7. Data from the protected group are represented as dark blue open circles for the DFD regimen (P DFD) and light blue open circles for STD regimen (P STD), and data from the non-protected group are represented as red open circles (NP) for both regimens. Statistical analysis was performed using the generalized linear mixed-effects model via Penalized Quasi-Likelihood to accommodate repeated measurements over time.
-
Figure 2—figure supplement 2—source data 1
Ag.non.pTfh frequency and function.
(A) Ag.non-pTfh (% of CD40L+ CD4 T cells). (B) IL-21+ Ag. Non-pTfh (% of Ag.non-pTfh). (C) ICOS+Ag.non-pTfh (% of Ag.non-pTfh). (D) Ki67+Ag.non-pTfh (% of Ag.non-pTfh). (E) Ag.non-pTfh (% of CD40L+ CD4 T cells) DFD vs STD. (F), IL-21+ Ag. Non-pTfh (% of Ag.non-pTfh) DFD vs STD. (G) ICOS+Ag.non-pTfh (% of Ag.non-pTfh) DFD vs. STD. (H) Ki67+Ag.non-pTfh (% of Ag.non-pTfh) DFD vs. STD.
- https://cdn.elifesciences.org/articles/51889/elife-51889-fig2-figsupp2-data1-v3.xlsx
Figure 3
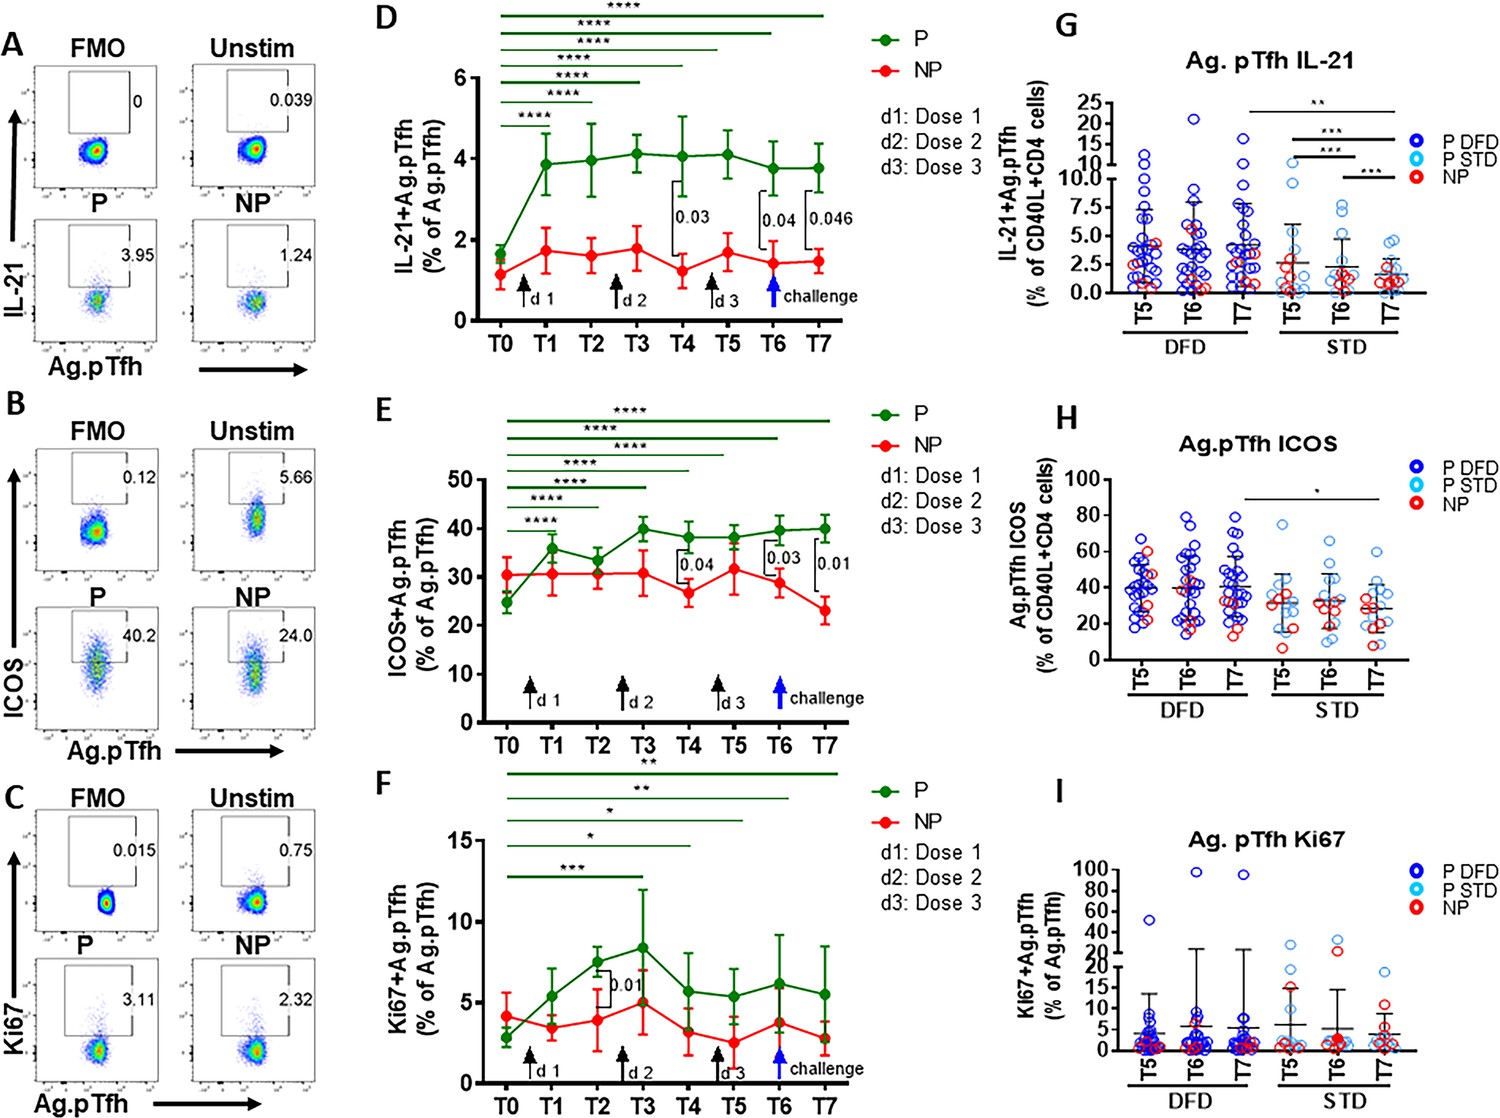
Higher induction of IL-21 and ICOS in CSP-specific pTfh cells from protected subjects.
Representative flow cytometry dot plots showing (A) IL-21, (B) ICOS and (C) Ki67 expression in CSP-specific pTfh cells in protected (P, n = 35) and non-protected (NP, n = 10) subjects. (D–F) Line graphs with error bars indicate mean ± standard error of mean (SEM) for frequencies of IL-21+ CSP-specific pTfh cells (D), ICOS+ CSP-specific pTfh (E) and Ki67+ CSP-specific pTfh (F) in the P (green line) and NP (red line) groups. (G–I) Scatter plots comparing IL-21+ (G), ICOS+(H) and Ki67+ CSP-specific pTfh (I) in DFD and STD regimens at T5, T6 and T7. Data from the protected group are represented by dark blue open circles for DFD (P DFD) and by light blue open circles for the STD regimen (P STD), whereas data from the non-protected group are shown as red open circles (NP) for both regimens. Statistical analysis was performed using the generalized linear mixed-effects model via the Penalized Quasi-Likelihood to accommodate repeated measurements over of time. P values shown within the graph refer to significant difference between the P and NP groups at the indicated timepoints. Statistical significance is shown as *p, <0.05; **, p<0.01; ***, p<0.001.
-
Figure 3—source data 1
Frequencies of IL-21+ Ag.pTfh (Figure 3D).
- https://cdn.elifesciences.org/articles/51889/elife-51889-fig3-data1-v3.xlsx
-
Figure 3—source data 2
Frequencies of ICOS+ Ag.pTfh (Figure 3E).
- https://cdn.elifesciences.org/articles/51889/elife-51889-fig3-data2-v3.xlsx
-
Figure 3—source data 3
Frequencies of Ki67+Ag.pTfh (Figure 3F).
- https://cdn.elifesciences.org/articles/51889/elife-51889-fig3-data3-v3.xlsx
-
Figure 3—source data 4
Frequencies of IL-21+Ag.pTfh: DFD vs STD (Figure 3G).
- https://cdn.elifesciences.org/articles/51889/elife-51889-fig3-data4-v3.xlsx
-
Figure 3—source data 5
Frequencies of ICOS+ Ag.pTfh: DFD vs STD (Figure 3H).
- https://cdn.elifesciences.org/articles/51889/elife-51889-fig3-data5-v3.xlsx
-
Figure 3—source data 6
Frequencies of Ki67+Ag.pTfh: DFD vs STD (Figure 3I).
- https://cdn.elifesciences.org/articles/51889/elife-51889-fig3-data6-v3.xlsx
Figure 4 with 4 supplements

Frequencies of CSP-specific memory B cell subsets are greater in the DFD regimen than in the STD regimen at later time points.
PBMC were cultured for 5 days in the presence of PF-CSP and PF-16 antigens and analyzed for frequencies of B cell maturation subsets: switched memory (SM: CD20+CD10–CD27+IgD–IgG+), switched activated memory (sAM: CD20+CD10–CD21lowCD27+IgD–IgG+) and Ki67 expression on total memory (Mem: CD20+CD10–CD27+) B cells in DFD (n = 29) and STD (n = 14) regimens at T5, T6 and T7. (A–C) The scatter plots show PF-CSP-specific SM (A); sAM (B) and Ki67+(C) memory B cells. (D–F) PF-16-specific SM (D); sAM (E) and Ki67+(F) memory B cells. Data for the protected group are represented as dark blue open circles for DFD (P DFD, n = 25) and as light blue open circles for STD regimen (P STD, n = 10) and non-protected as red open circles (NP, n = 10) for both regimens. Statistical analysis was performed using the generalized linear mixed-effects model via Penalized Quasi-Likelihood to accommodate repeated measurements over time. Statistical significance is shown as: *, p<0.05; **, p<0.01; ***, p<0.001.
-
Figure 4—source data 1
PF-CSP-specific SM B cells: DFD vs STD (Figure 4A).
- https://cdn.elifesciences.org/articles/51889/elife-51889-fig4-data1-v3.xlsx
-
Figure 4—source data 2
PF16-specific SM B cells: DFD vs STD (Figure 4D).
- https://cdn.elifesciences.org/articles/51889/elife-51889-fig4-data2-v3.xlsx
-
Figure 4—source data 3
PF CSP switched activated memory B cells: DFD vs STD (Figure 4B).
- https://cdn.elifesciences.org/articles/51889/elife-51889-fig4-data3-v3.xlsx
-
Figure 4—source data 4
PF 16-specific switched activated memory B cells: DFD vs STD (Figure 4E).
- https://cdn.elifesciences.org/articles/51889/elife-51889-fig4-data4-v3.xlsx
-
Figure 4—source data 5
PF CSP-specific Ki67+ memory B cells: DFD vs STD (Figure 4C).
- https://cdn.elifesciences.org/articles/51889/elife-51889-fig4-data5-v3.xlsx
-
Figure 4—source data 6
PF 16-specific Ki67+ memory B cells: DFD vs STD (Figure 4F).
- https://cdn.elifesciences.org/articles/51889/elife-51889-fig4-data6-v3.xlsx
Figure 4—figure supplement 1
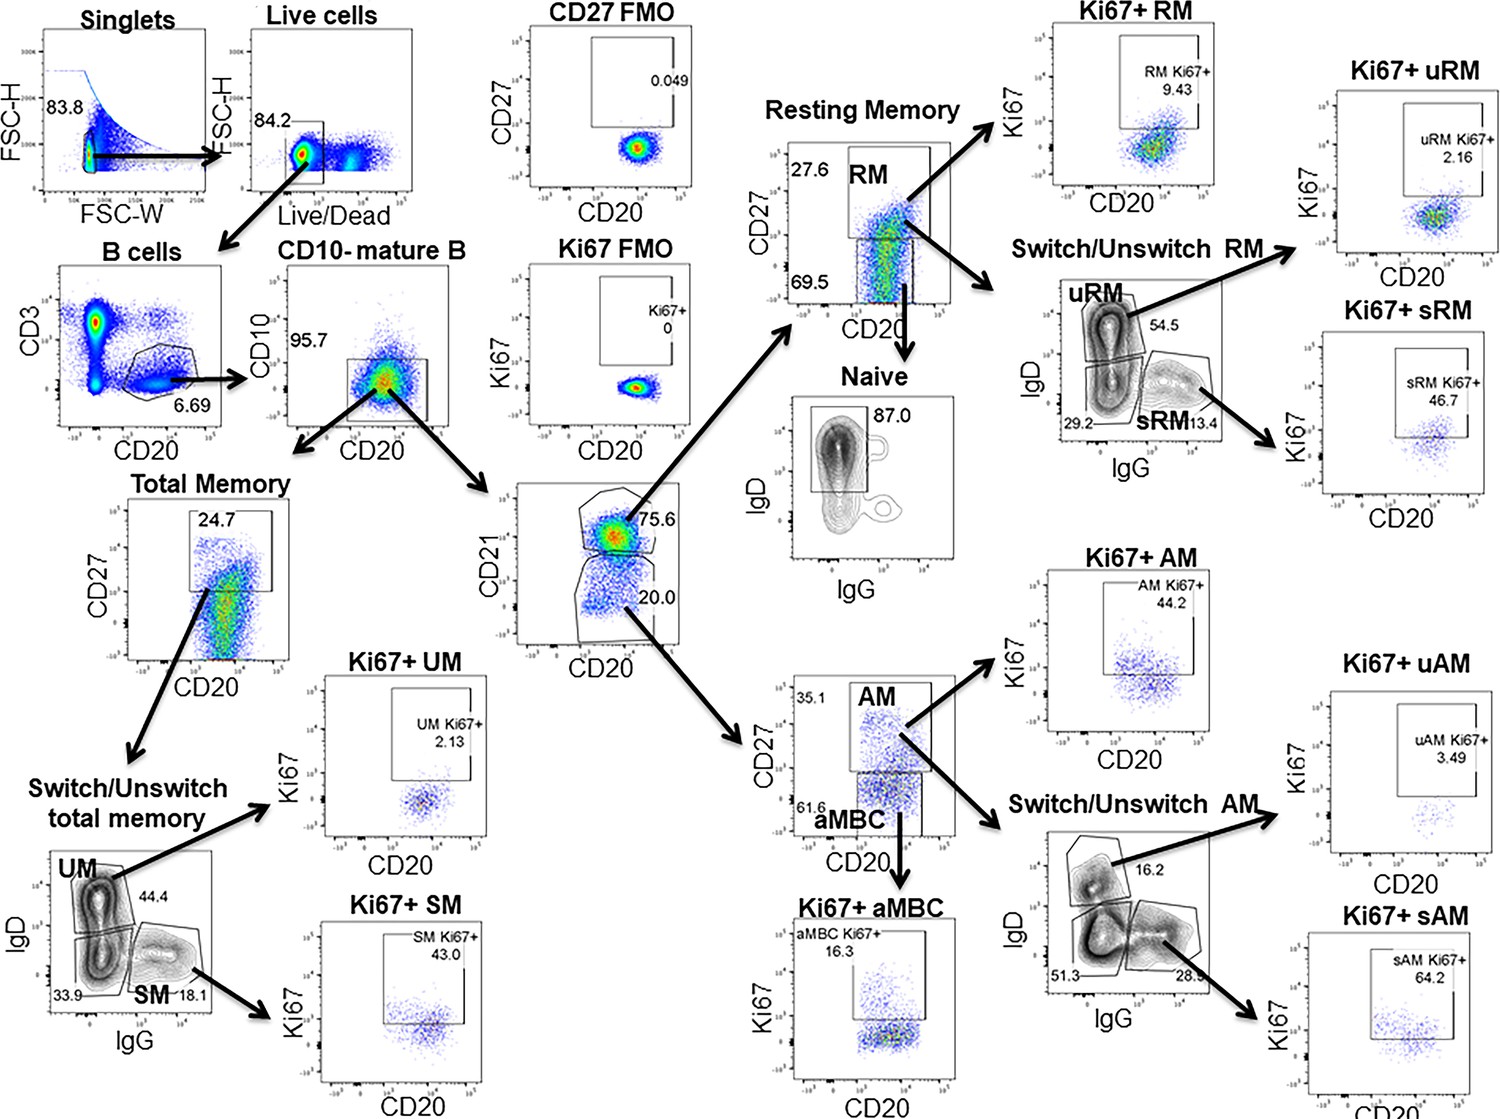
Gating strategy for the B cell subsets.
Live (Aqua–) cells were gated from the singlets followed by gating for the CD3–CD20+B cells from live lymphocytes. Mature B cells were identified as CD10–CD20+ B cells. From the mature B cells, total memory B cells were identified as CD20+CD27+ cells. On the basis of the expression of CD21, CD27 and IgD, B cell maturation subsets were identified as naïve (CD21hiCD27–IgD+) B cells, resting memory (RM: CD21hiCD27+) activated memory B cells (AM: CD21lowCD27+) and atypical memory B cells (aMBC: CD21lowCD27–). On the basis of the IgD and IgG expression, unswitch and switch memory B cells were identified as IgD+IgG– (UM: unswitch) and IgD–IgG+ (SM: switch). Switch memory B cells in total memory, RM and AM were designated as SM, sRM and sAM, respectively, while unswitch memory B cells were designated as UM, uRM, uAM for total memory, RM and AM, respectively. All B cell subsets were gated for the expression of the proliferation marker Ki67.
Figure 4—figure supplement 2
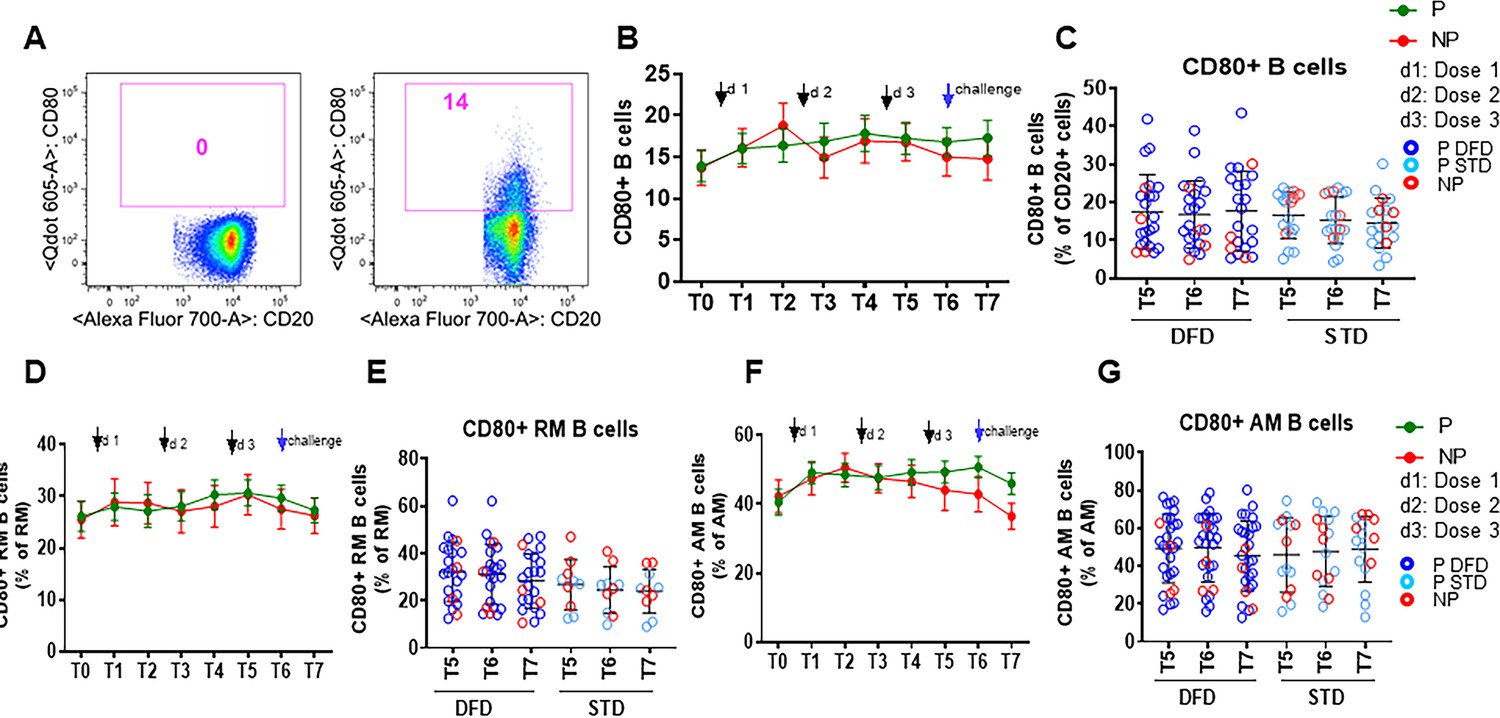
CD80 expression on the total B cell, RM and AM subsets.
CD80 expression was analyzed in ex vivo B cell subsets at all the timepoints by flow cytometry. Data were compared longitudinally and also between the P (green line; n = 35) and NP (red line; n = 10) groups at each timepoint. (A) Representative flow cytometry dot plot for CD80 staining of B cells. (B, D, F) Line graphs with error bars, indicating mean ± standard error of mean (SEM), for frequencies of CD80 expression on total (B), RM (D) and AM B cells (F). (C, E, G) Scatter plots comparing CD80 expression between the DFD and STD regimens at T5, T6 and T7 for total (C), RM (E) and AM (G) B cells. Data for the protected group are represented by dark blue open circles for DFD (P DFD) and by light blue open circles for the STD regimen (P STD), whereas data for the non-protected group are shown as red open circles (NP) for both regimens. Statistical analysis was performed using the generalized linear mixed-effects model via Penalized Quasi-Likelihood to accommodate repeated measurements over time. Differences between timepoints in P and NP and between P and NP at each timepoint are not statistically significant.
-
Figure 4—figure supplement 2—source data 1
CD80 expression on B cell subsets.
(B) CD80+ B cells (% of CD20+ B cells). (C) CD80+ B cells (% of CD20+ B cells). (D) CD80+ RM B cells (% of RM B cells). (E) CD80+ RM B cells (% of RM B cells). (F) CD80+ AM B cells (% of AM B cells). (G) CD80+ AM B cells (% of AM B cells).
- https://cdn.elifesciences.org/articles/51889/elife-51889-fig4-figsupp2-data1-v3.xlsx
Figure 4—figure supplement 3
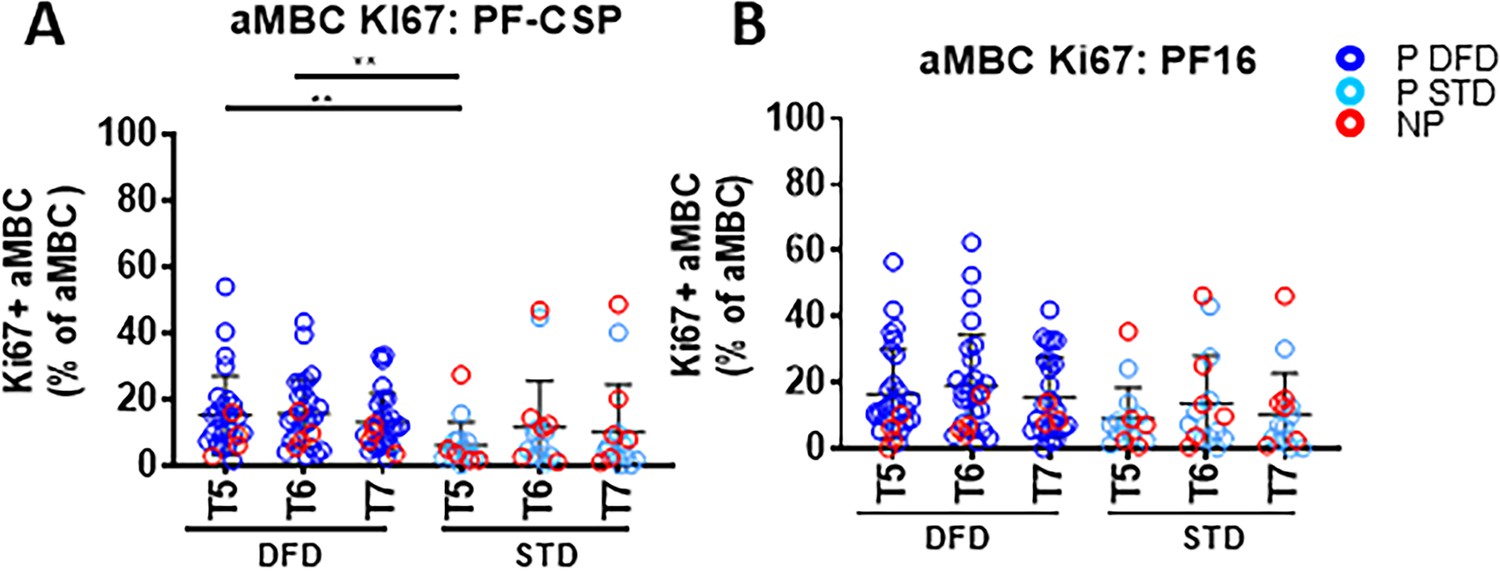
Higher atypical memory B cells (aMBC) at T5 and T6 in the DFD group.
PBMC were cultured for 5 days in the presence of PF-CSP and PF-16 antigens, and atypical memory B cells (aMBC) were identified as CD3–CD20+CD21lo/negCD10–CD27– by flow cytometry. (A, B) Scatter plots showing aMBC specific to PF-CSP (A) and PF-16 (B). Data from the protected group are indicated as dark blue open circles for the DFD regimen (P DFD) and as light blue open circles for the STD regimen (P STD), whereas data from the non-protected group are represented as red open circles (NP) for both regimens. Statistical analysis was performed using the generalized linear mixed-effects model via Penalized Quasi-Likelihood package to accommodate repeated measurements over time. Statistical significance shown as: *, p<0.05; **, p<0.01; ***, p<0.001.
-
Figure 4—figure supplement 3—source data 1
Ki67+ aMBC specific to PF-CSP and PF-16.
(A) PF-CSP-specific Ki67+ aMBC (% of aMBC). (B) PF-16 specific Ki67+ aMBC (% of aMBC).
- https://cdn.elifesciences.org/articles/51889/elife-51889-fig4-figsupp3-data1-v3.xlsx
Figure 4—figure supplement 4
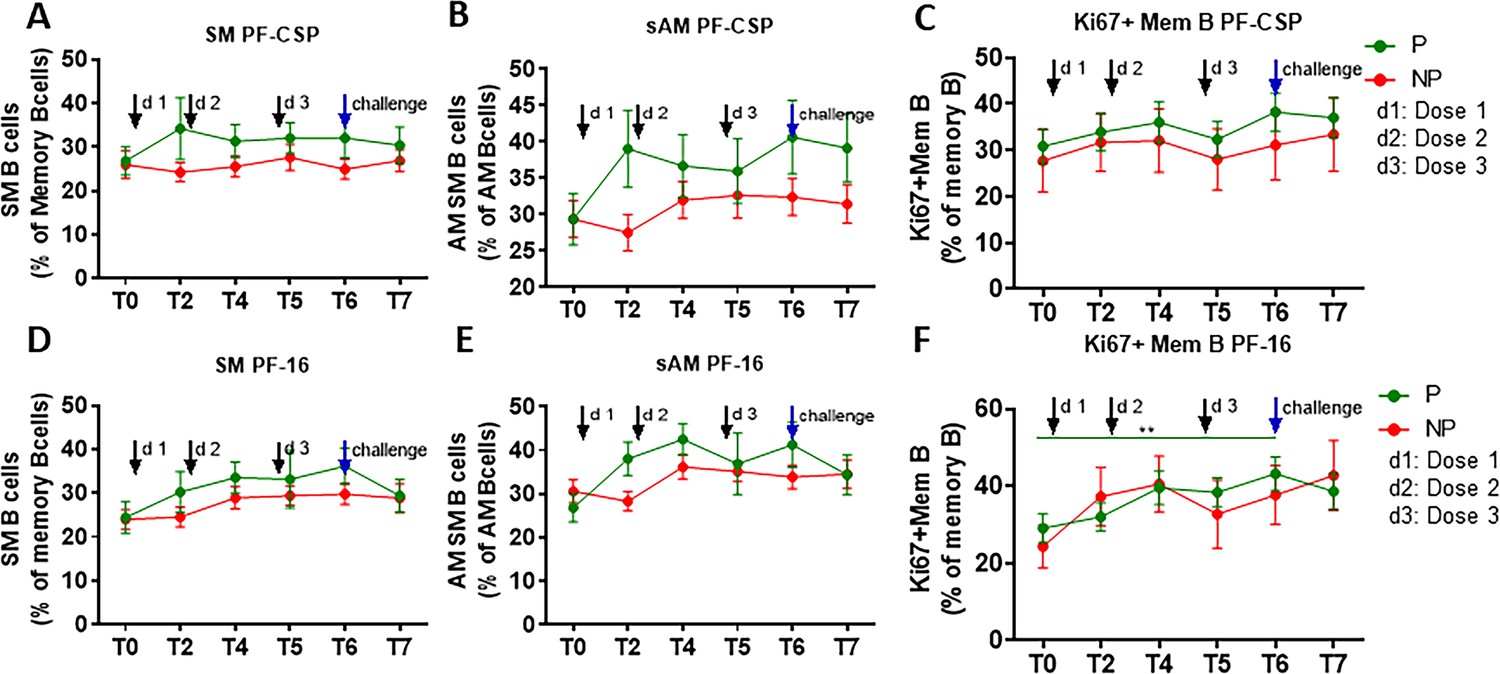
CSP-specific memory B cell subsets in P and NP subjects.
PBMC were cultured for 5 days in the presence of PF-CSP and PF-16 antigens, and B cell maturation subsets and Ki67 expression on B cell subsets were analyzed by flow cytometry. Line graphs with error bars indicate mean cell frequencies ± standard errors of the mean (SEM) for B cell subsets in the P (green; n = 35) and NP (red, n = 10) subjects for (A) SM, (B) sAM and (C) Ki67+ mem B cells. (D–F) Frequencies of PF-16-specific (D) SM, (E) sAM and (F) Ki67+ mem B cells. Statistical analysis was performed using the generalized linear mixed-effects model via Penalized Quasi-Likelihood to accommodate repeated measurements over time. Statistical significance is shown as: *, p<0.05; **, p<0.01; ***, p<0.001.
-
Figure 4—figure supplement 4—source data 1
Mean frequencies of mory B cell subsets between P and NP subjects.
(A) Frequencies of PF-CSP-specific SM B cells (% of memory B cells). (B) Frequencies of PF-CSP-specific sAM B cells (% of AM B cells). (C) Frequencies of PF-CSP-specific Ki67+ memory B cells (% of memory B cells). (D) Frequencies of PF-16-specific SM B cells (% of memory B cells). (E) Frequencies of PF-16-specific sAM B cells (% of AM B cells). (F) Frequencies of PF-16-specific Ki67+ memory B cells (% of memory B cells).
- https://cdn.elifesciences.org/articles/51889/elife-51889-fig4-figsupp4-data1-v3.xlsx
Figure 5 with 1 supplement
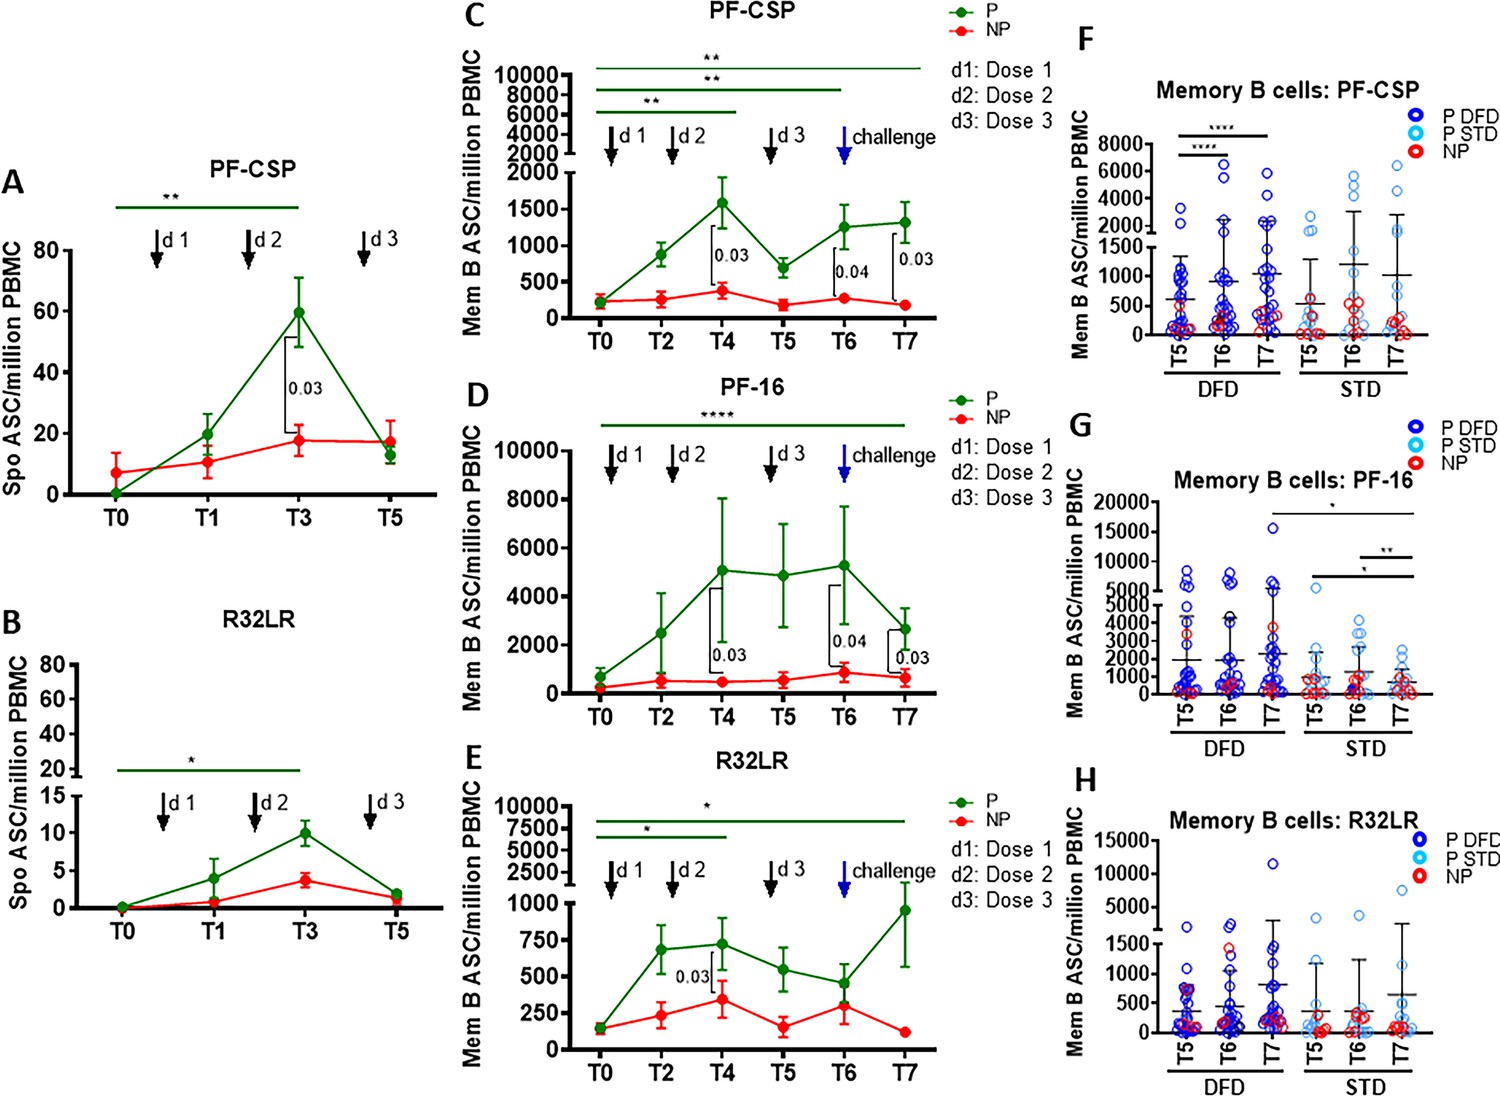
Higher CSP-specific plasmablast and memory B cell ASC responses in the P subjects.
Spontaneous antibody secreting cells (ASC) at T0, T1, T3, and T5 were determined in unstimulated PBMC for plasmablast responses by ELISpot against PF-CSP, PF-16 and R32LR antigens. Memory B cell ASC responses were analyzed at T0, T2, T4, T5, T6 and T7 using ELISpot assay in PBMC stimulated with PF-CSP, PF-16, or R32LR antigens. Line graphs with error bars indicate mean ± standard error of mean (SEM). (A, B) Spontaneous ASC/million PBMC for the protected (P, green line, n = 33) and non-protected (NP, red line, n = 10) study groups for PF-CSP (A) and R32LR (B) antigens. (C–E) Memory B cell ASC/million PBMC for PF-CSP (C), PF-16 (D) and R32LR (E) for P and NP subjects. (F–H) Scatter plots showing memory B cells responses as ASC/million PBMC in the DFD and STD regimens at T5, T6 and T7 for PF-CSP (F), PF-16 (G) and R32LR (H) antigens. Data from the protected group are represented as dark blue open circles for DFD (P DFD) and as light blue open circles for the STD regimen (P STD), whereas data for the non-protected group are represented as red open circles (NP) for both regimens. Statistical analysis was performed using the generalized linear mixed-effects model via Penalized Quasi-Likelihood to accommodate repeated measurements over time. P values shown within the graph refer to significant difference between the P and NP groups at the indicated timepoints. Statistical significance shown as: *, p<0.05; **, p<0.01; ***, p<0.001.
-
Figure 5—source data 1
Spontaneous ASC/million PBMC: PFCSP (Figure 5A).
- https://cdn.elifesciences.org/articles/51889/elife-51889-fig5-data1-v3.xlsx
-
Figure 5—source data 2
Spontaneous ASC/million PBMC: R32LR (Figure 5B).
- https://cdn.elifesciences.org/articles/51889/elife-51889-fig5-data2-v3.xlsx
-
Figure 5—source data 3
Memory B cell ELISpot: PFCSP (Figure 5C).
- https://cdn.elifesciences.org/articles/51889/elife-51889-fig5-data3-v3.xlsx
-
Figure 5—source data 4
Memory B cell ELISpot: PF16 (Figure 5D).
- https://cdn.elifesciences.org/articles/51889/elife-51889-fig5-data4-v3.xlsx
-
Figure 5—source data 5
Memory B cell ELISpot: R32LR (Figure 5E).
- https://cdn.elifesciences.org/articles/51889/elife-51889-fig5-data5-v3.xlsx
-
Figure 5—source data 6
PF-CSP-specific memory B cell ELISpot: DFD vs STD (Figure 5F).
- https://cdn.elifesciences.org/articles/51889/elife-51889-fig5-data6-v3.xlsx
-
Figure 5—source data 7
PF-16-specific memory B cell ELISpot: DFD vs STD (Figure 5G).
- https://cdn.elifesciences.org/articles/51889/elife-51889-fig5-data7-v3.xlsx
-
Figure 5—source data 8
R32LR-specific Memory B cell ELISpot: DFD vs STD (Figure 5H).
- https://cdn.elifesciences.org/articles/51889/elife-51889-fig5-data8-v3.xlsx
Figure 5—figure supplement 1
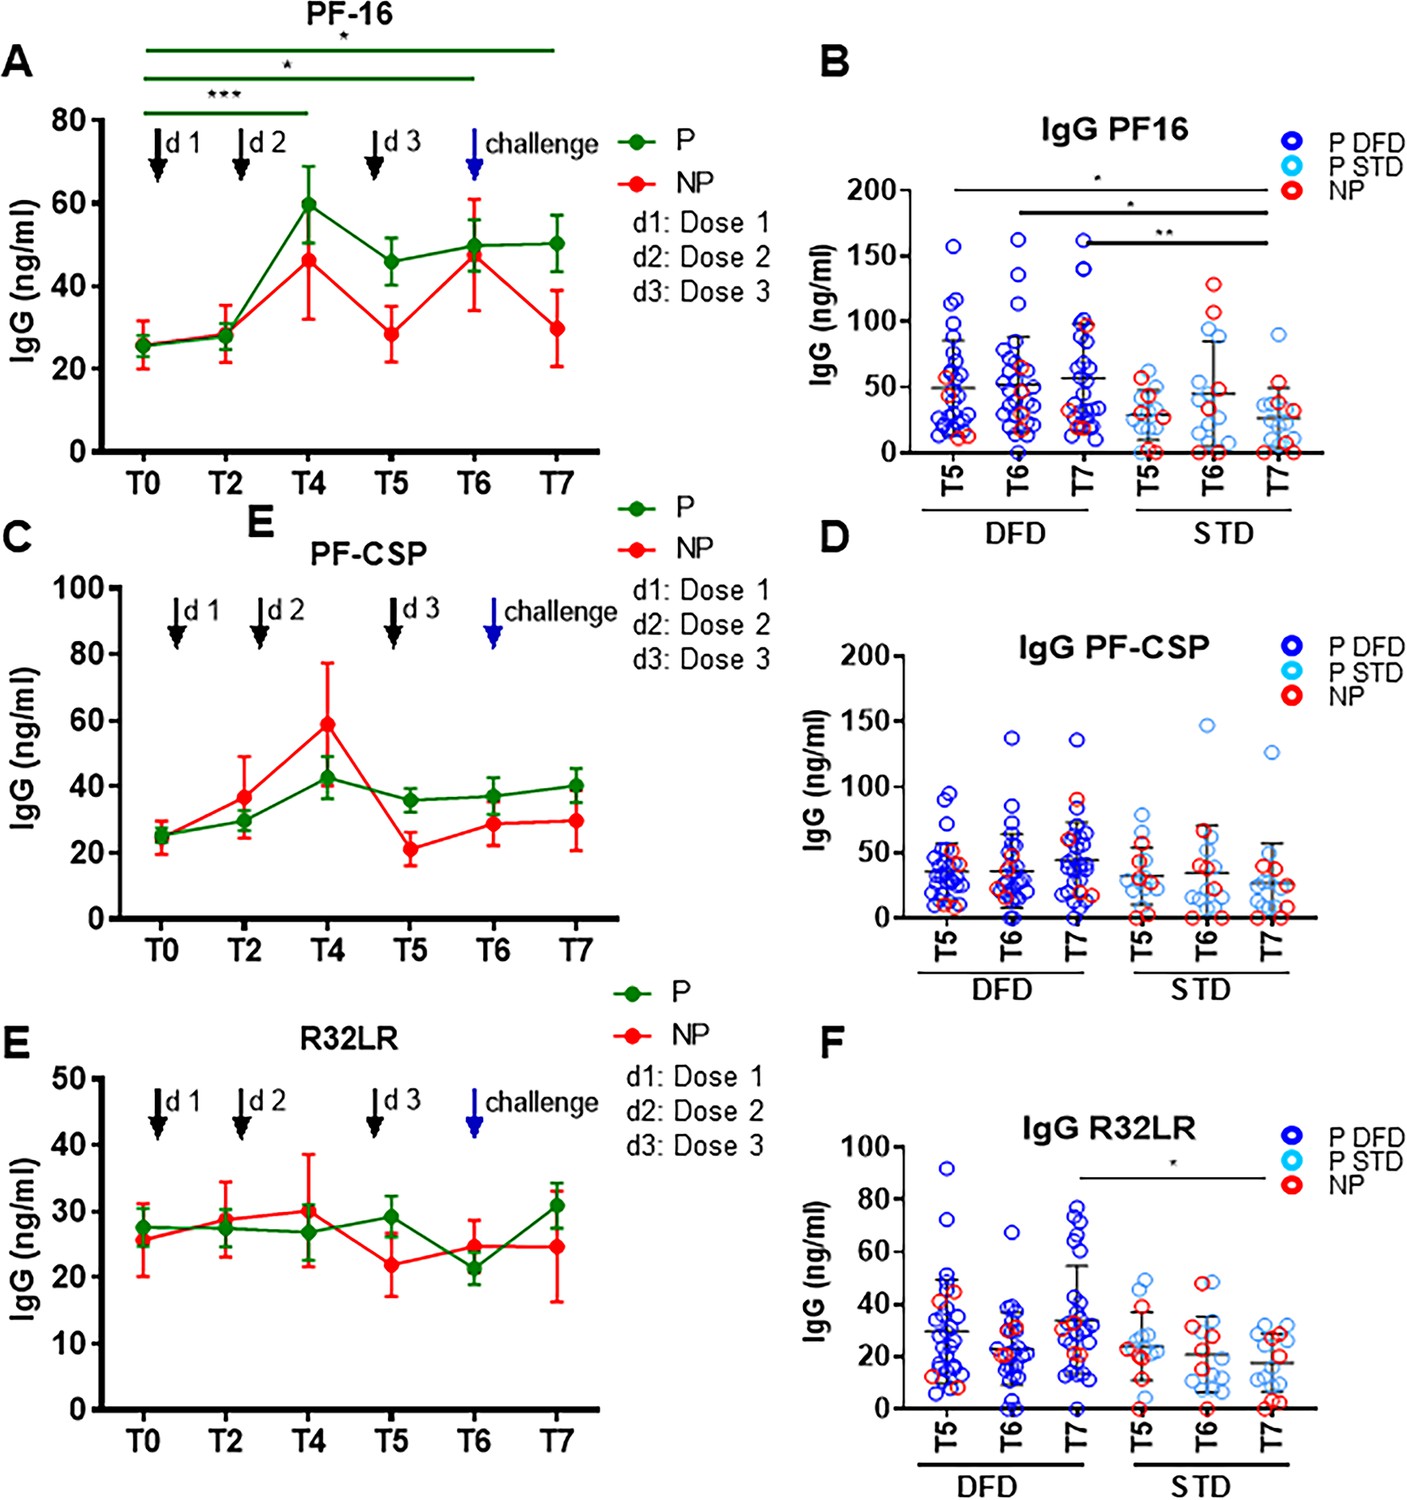
IgG specific to PF-16, PF-CSP and R32LR in PBMC culture supernatants.
PBMC were cultured for 5 days in the presence of PF-CSP, PF-16 or R32LR antigens and total IgG was measured in the culture supernatants by ELISA. (A, C, E) Line graphs with error bars indicate mean ± standard error of mean (SEM) for the frequencies of IgG specific to PF-16 (A), PF-CSP (C) and R32LR (E). (B, D, F) Scatter plots comparing IgG levels between the DFD and STD regimens at T5, T6 and T7 specific to PF-16 (B), PF-CSP (D) and R32LR (F). Data from the protected group are represented as dark blue open circles for the DFD (P DFD) regimen and as light blue open circles for the STD regimen (P STD), whereas data for the non-protected group are respresented as red open circles (NP) for both regimens. Statistical analysis was performed using the generalized linear mixed-effects model via Penalized Quasi-Likelihood to accommodate repeated measurements over time. Statistical significance is shown as: *, p<0.05; **, p<0.01; ***, p<0.001.
-
Figure 5—figure supplement 1—source data 1
IgG in culture supernatants.
(A) PF-16-specific IgG (ng/ml). (B) PF-16-specific IgG compared between DFD and STD (ng/ml). (C) PF-CSP-specific IgG (ng/ml). (D) PF-CSP-specific IgG compared between DFD and STD (ng/ml). (E) R32LR-specific IgG (ng/ml). (F) R32LR-specific IgG compared between DFD and STD (ng/ml).
- https://cdn.elifesciences.org/articles/51889/elife-51889-fig5-figsupp1-data1-v3.xlsx
Figure 6 with 2 supplements

PCA plots showing regimen-specific and protection-status differences.
PCA plots using parameters identified by machine learning as being predictive of (A) regimen differences for DFD (purple) and STD (orange) subjects and (B) protection status for protected (blue) and non-protected (red) subjects.
Figure 6—figure supplement 1
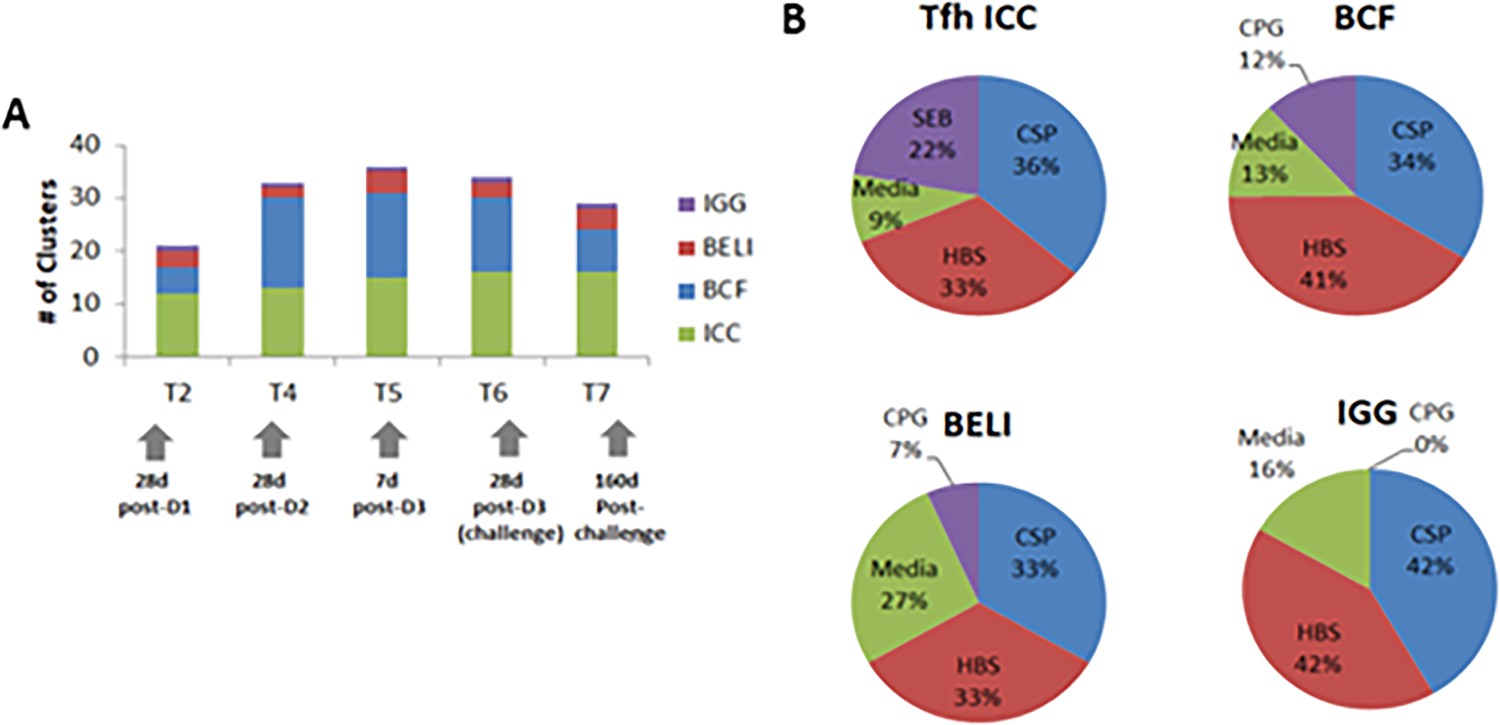
Summary of vaccine-induced responses.
(A) Vaccine-induced immune responses by immune cluster across timepoints for frequencies of CSP- and HBs-specific B cell subsets by flow cytometry (BCF), frequencies and function of total pTfh, CSP-, HBs- and SEB-specific CD4 and pTfh data (Tfh ICC), CSP- and HBs-specific memory B cell ELISpot data (BELI), and CSP- and HBs-specific PBMC culture supernatant IgG (IGG). (B) Antigen-specificity following ex vivo stimulation of vaccine-induced responses for each assay.
Figure 6—figure supplement 2

General workflow for the data integration approach.
Figure 7
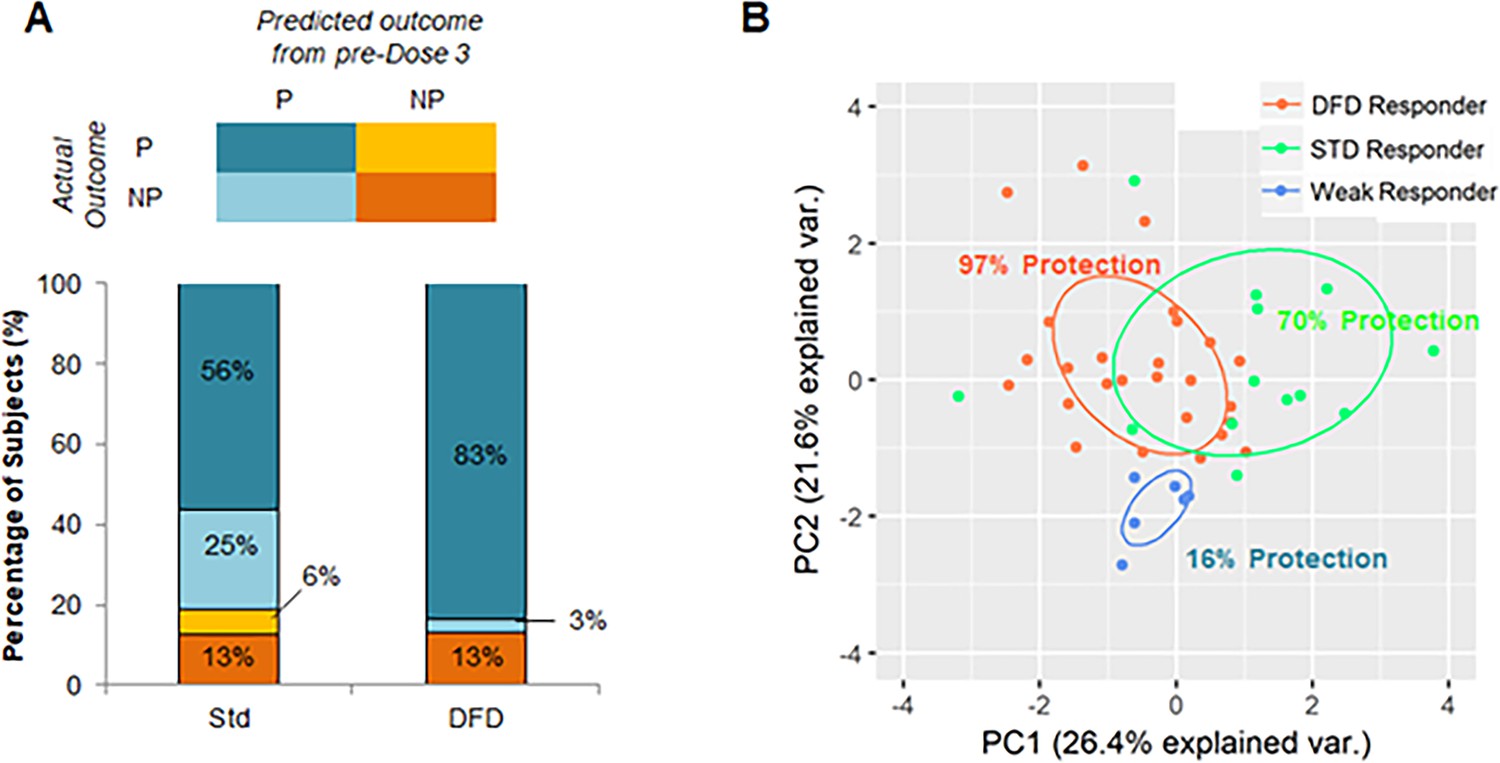
Identification of subjects with promising early-stage immune responses.
(A) Comparison of STD and DFD subjects in terms of their predicted outcome from early-stage (pre-dose 3) immune response data and their actual outcomes. (B) PCA using immune parameters that are predictive of regimen and protection-status as determined by machine learning. Subjects are color-coded on the basis of their classification (on the basis of early-stage [pre-dose 3] immune data) as DFD responders (DFD subjects predicted to be protected), STD responders (STD subjects predicted to be protected), and weak responders (subjects predicted to be not protected). Protection rate is shown as the percentage of subjects in each group that was found to be protected in the study.
Author response image 1
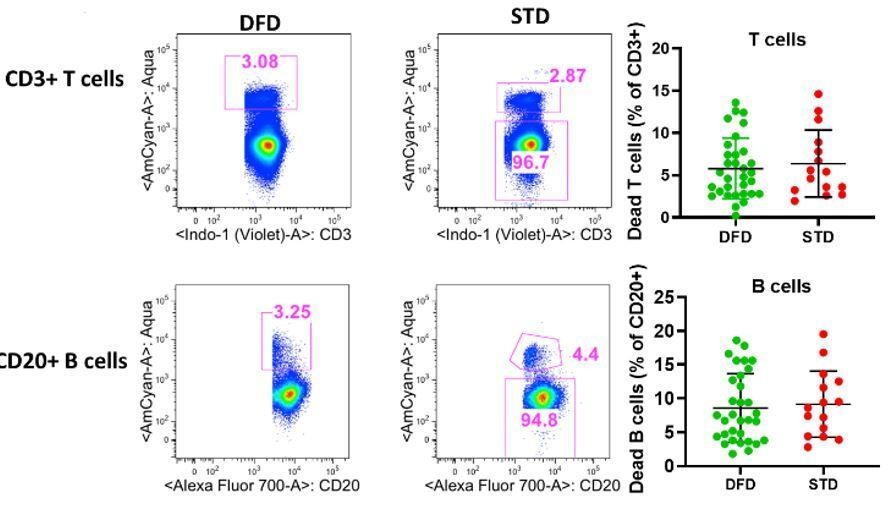
Frequencies of dead cells in T cell and B cell compartments at T5 (6 days post dose 3).
Dead cells were gated from total CD3+ and CD20+ cells based live dead aqua staining as CD3+aqua+and CD 20+aqua+ cells. Scatter dot plots showing frequencies of dead cells for T cells (top right) and B cell (bottom right) betweeen DFD vs. STD regimen.
Author response image 2
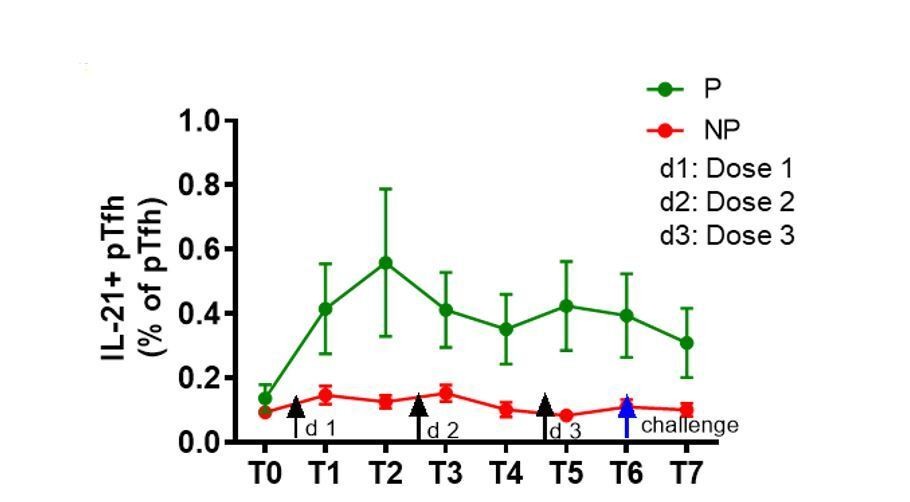
Trend of higher frequencies of total pTfh cells expressing IL-21 after vaccination in P subjects.
Il-21+ total pTfh cells after CSP stimulation by flow cytometry. IL-21+ pTfh cells were identified as CD4+CD45RO+CD27+CXCR5 cells.
Tables
Table 1
Parameters that are most predictive of vaccine regimen.
| Cell type | Phenotype | Parameter | Weight |
|---|---|---|---|
| B cell | Ki67+memory B cells | BCF.Mem.Ki67.HBs.T5 | 100 |
| BCF.Mem.Ki67.PF.CSP.T6 | 73 | ||
| BCF.Mem.Ki67.MED.T6 | 55 | ||
| BCF.Mem.Ki67.PF.CSP.T5 | 53 | ||
| BCF.Mem.Ki67.PF.16.T6 | 45 | ||
| sAM | BCF.sAM.PF.16.T6 | 91 | |
| BCF.sAM.PF.CSP.T5 | 67 | ||
| BCF.sAM.HBs.T6 | 53 | ||
| SM | BCF.SM.PF.CSP.T5 | 54 | |
| BCF.SM.HBs.T5 | 50 | ||
| aMBCKi67 | BCF. aMBC.Ki67.PF.CSP.T5 | 54 | |
| BCF. aMBC.Ki67.PF.16.T5 | 48 | ||
| BCF. aMBC.Ki67.HBs.T5 | 44 | ||
| BCF. aMBC.Ki67.PF.CSP.T6 | 42 | ||
| BCF.sAM.Ki67.PF.CSP.T5 | 40 |
-
Abbreviations: sAM, switched activated memory; SM, switched memory; aMBCKi67, Ki67+atypical memory B cells; BCF, antigen-specific memory B cell responses by flow cytometry.
Table 2
Parameters that are most predictive of protection.
| Cell type | Phenotype | Parameter | Weight |
|---|---|---|---|
| B cell | Memory B cell ELISpot | PF.CSP.T2 | 79 |
| PF.16.T4 | 64 | ||
| PF.CSP.T5 | 53 | ||
| T cell | CD40L+CD4 | CD40L.CSP.T4 | 100 |
| CD40L.CSP.T6 | 57 | ||
| CD40L.CSP.T2 | 52 | ||
| Ag.pTfh | Ag.pTfh.CSP.T2 | 71 | |
| Ag.pTfh.IL.21.HBs.T4 | 60 | ||
| Ag.pTfh.IL.21.CSP.T6 | 56 | ||
| Ag.pTfh.IL.21.HBs.T6 | 55 | ||
| Ag.pTfh.IL.21.CSP.T4 | 49 | ||
| Total. pTfh | Total.pTfh.MED.T2 | 49 | |
| Total.pTfh.MED.T4 | 43 | ||
| Total.pTfh.MED.T6 | 40 | ||
| Ag.CD4 | CSP.T4 | 46 | |
| CSP.T6 | 38 | ||
| MED.T6 | 42 | ||
| HBs.T4 | 52 |
-
Abbreviations: Ag.pTfh, antigen specific peripheral T follicular helper cells; Ag.CD4, antigen stimulated total CD4 T cells; ELIspot, memory B cell ELISpot responses; CD40L+CD4, CD40L+ CD4 T cells.
Key resources table
| Reagent type (species) or resource | Designation | Source or reference | Identifiers | Additional information |
|---|---|---|---|---|
| Peptide, recombinant protein | Staphylococcal enterotoxin B | List Biological laboratories | # 122 | 1 µg/ml, PBMC stimulation |
| Peptide, recombinant protein | CPG ODN 2016 | In-Vivogen | # tlrl2006-1 | 1 µg/ml, PBMC stimulation |
| Peptide, recombinant protein | HBs peptide pool | PATH’s Malaria Vaccine Initiative | 2 µg/ml, PBMC stimulation | |
| Peptide, recombinant protein | CSP peptide pool | PATH’s Malaria Vaccine Initiative | 2 µg/ml, PBMC stimulation | |
| Peptide, recombinant protein | CS repeat region protein (R32LR) | GSK | 2 µg/ml, PBMC stimulation | |
| Peptide, recombinant protein | HBs protein | GSK | 2 µg/ml, PBMC stimulation | |
| Peptide, recombinant protein | CSP protein | PATH’s Malaria Vaccine Initiative | 2 µg/ml, PBMC stimulation | |
| Peptide, recombinant protein | C-terminal peptide (PF-16) | PATH’s Malaria Vaccine Initiative | 2 µg/ml, PBMC stimulation | |
| Biological sample (Homo-sapiens) | Primary human mononuclear cells | GSK | Cryopreserved in liquid nitrogen | |
| Antibody | Anti-human CD3 BUV 395, mouse monoclonal, Clone SK7 | BD Biosciences | RRID:AB_2744382; Cat# 564001 | 5 µl/test, FACS |
| Antibody | Anti-human ICOS BV 421, regimenenian hamster monoclonal, Clone C398.4A | Biolegend | RRID:AB_2562545; Cat# 313524 | 0.156 µl/test, FACS |
| Antibody | Anti-human CXCR5 Alexa 647, rat monoclonal, Clone RF8B2 | BD Biosciences | RRID:AB_2737606; Cat# 558113 | 0.625 µl/test, FACS |
| Antibody | Anti-human CD8 Alexa 700, mouse monoclonal, Clone RPA-T8 | BD Biosciences | RRID:AB_10643765; Cat# 561453 | 2.5 µl/test, FACS |
| Antibody | Anti-human CCR7 PE-CF594, mouse monoclonal, Clone 150503 | BD Biosciences | RRID:AB_11153301; Cat# 562381 | 5 µl/test, FACS |
| Antibody | Anti-human CD28 PE-Cy5, mouse monoclonal, Clone CD28.2 | Biolegend | RRID:AB_314312 Cat# 302910 | 2.5 µl/test, FACS |
| Antibody | Anti-human CD45RO FITC, mouse monoclonal, Clone UCHL1 | Beckman Coulter | Cat# IM1247U | 8 µl/test, FACS |
| Antibody | Anti-human CD4 PerCP-Cy5.5, mouse monoclonal, Clone L200 | BD Biosciences | RRID:AB_394488 Cat# 552838 | 2.5 µl/test, FACS |
| Antibody | Anti-human CD40L BV 605, mouse monoclonal, Clone 24–31 | Biolegend | RRID:AB_2563832 Cat# 310826 | 0.625 µl/test, FACS |
| Antibody | Anti-human Ki-67 BV 711, mouse monoclonal, Clone Ki-67 | Biolegend | RRID:AB_ 2563861 Cat# 350516 | 1.25 µl/test, FACS |
| Antibody | Anti-human CD69 APC-Cy7, mouse monoclonal, Clone FN50 | Biolegend | RRID:AB_314849 Cat# 310914 | 0.156 µl/test, FACS |
| Antibody | Anti-human IL-21 PE, mouse monoclonal, Clone 12-7219-42 | eBioscience | RRID:AB_1582260 Cat# 12-7219-42 | 0.156 µl/test, FACS |
| Antibody | Anti-human IFN-g PE-Cy7, mouse monoclonal, Clone B27 | BD Biosciences | RRID:AB_396760 Cat# 557643 | 2.5 µl/test, FACS |
| Antibody | Anti-human IgG BV 421, mouse monoclonal, Clone G18-145 | BD Biosciences | RRID:AB_2737665 Cat# 562581 | 2.5 µl/test, FACS |
| Antibody | Anti-human CD80 BV 605, mouse monoclonal, Clone 2D10 | Biolegend | RRID:AB_11123909 Cat# 305225 | 0.625 µl/test, FACS |
| Antibody | Anti-human IL-21R APC, mouse monoclonal, Clone 2G1-K12 | Biolegend | RRID:AB_2123988 Cat# 347808 | 2.5 µl/test, FACS |
| Antibody | Anti-human CD20 Alexa 700, mouse monoclonal, Clone 2H7 | Biolegend | RRID:AB_493753 Cat# 302322 | 0.625 µl/test, FACS |
| Antibody | Anti-human CD38 PE, mouse monoclonal, Clone HIT2 | BD Biosciences | RRID:AB_395853 Cat# 555460 | 2.5 µl/test, FACS |
| Antibody | Anti-human CD21 PE-Cy5, mouse monoclonal, Clone Bly4 | BD Biosciences | RRID:AB_394028 Cat# 551064 | 3.75 µl/test, FACS |
| Antibody | Anti-human CD10 PE-Cy7, mouse monoclonal, Clone HI10A | BD Biosciences | RRID:AB_400216 Cat# 341092 | 2.5 µl/test, FACS |
| Antibody | Anti-human IgD FITC, mouse monoclonal, Clone IA6-2 | Biolegend | RRID:AB_10612567 Cat# 348206 | 0.625 µl/test, FACS |
| Antibody | Anti-human CD27 BV 650, mouse monoclonal, Clone L128 | BD Biosciences | RRID:AB_2744352 Cat# 563228 | 2.5 µl/test, FACS |
| Antibody | Anti-human ICOSL biotin, mouse monoclonal, Clone 2D3 | Biolegend | RRID:AB_528729 Cat# 309406 | 1.25 µl/test, FACS |
| Antibody | Anti-human streptavidin BV 711, mouse monoclonal | Biolegend | Cat# 405241 | 0.7 µl/test, FACS |
| Antibody | Anti-human Ki-67 PerCP-Cy5.5, mouse monoclonal, Clone B56 | BD Biosciences | RRID:AB_10611574 Cat# 561284 | 2.5 µl/test, FACS |
| Antibody | Anti-human CD27 PerCP-Cy5.5, mouse monoclonal, Clone MT271 | Bioegend | RRID:AB_2561906 Cat# 356408 | 0.312 µl/test, FACS |
| Antibody | Anti-human CD28 unconjugated, mouse monoclonal, Clone L293 | BD Biosciences | RRID:AB_400197 Cat# 340975 | 1 µg/ml, PBMC stimulation |
| Commercial assay or kit | Human IgG ELISA Quantitation Set | Bethyl Laboratories | Cat# E80-104 | IgG ELISA, PBMC culture supernatants |
| Chemical compound, drug | Brefeldin A | Sigma Aldrich | Cat# B7651-5mg | 10 µg/ml, PBMC stimulation |
| Software, algorithm | FlowJo | BD Biosciences | https://www.flowjo.com | |
| Software, algorithm | Prism 8 | GraphPad | https://www.graphpad.com/scientific-software/prism/ | |
| Software, algorithm | BD FACSDiva | BD Biosciences | https://www.bdbiosciences.com/en-us/instruments/research-instruments/research-software/flow-cytometry-acquisition/facsdiva-software | |
| Other | LIVE/DEAD Fixable Aqua Dead Cell Stain | Invitrogen | L34957 | 0.5 µl/ml, FACS |
Additional files
-
Supplementary file 1
Supplementary file 1A. Summary of vaccine-induced immune measures. Abbreviations: Spontaneous antibody secreting cell ELSIPOT (AELI), CSP- and HBs-specific B cell subsets by flow cytometry (BCF), frequencies and function of total pTfh, CSP-, HBs- and SEB-specific CD4 and pTfh data (Tfh ICC), CSP- and HBs-specific memory B cell ELISpot data (BELI), CSP- and HBs-specific PBMC culture supernatant IGG (IgG).
Supplementary file 1B. Parameters most predictive of protection using the early-response (pre-Dose 3) immune data.
- https://cdn.elifesciences.org/articles/51889/elife-51889-supp1-v3.docx
-
Transparent reporting form
- https://cdn.elifesciences.org/articles/51889/elife-51889-transrepform-v3.docx
Download links
A two-part list of links to download the article, or parts of the article, in various formats.
Downloads (link to download the article as PDF)
Open citations (links to open the citations from this article in various online reference manager services)
Cite this article (links to download the citations from this article in formats compatible with various reference manager tools)
A delayed fractionated dose RTS,S AS01 vaccine regimen mediates protection via improved T follicular helper and B cell responses
eLife 9:e51889.
https://doi.org/10.7554/eLife.51889


