Mechanistic basis of the inhibition of SLC11/NRAMP-mediated metal ion transport by bis-isothiourea substituted compounds
- University of Zurich, Switzerland
- University of Bern, Switzerland
- Inselspital, University of Bern, Switzerland
Figures
Figure 1 with 3 supplements
Chemical structure of compounds and their inhibition of human DMT1.
(A) Chemical structures of compounds used in this work. Their synthesis is described in detail in Appendix 1. Abbreviations are indicated. (B) IC50 values determined by measuring radioactive 55Fe2+ transport (at 1 μM) into HEK293 cells stably expressing hDMT1. Data from brominated compounds are colored in lilac and data from compounds with modified isothiourea groups in violet. Values show averages of 6–8 biological replicates, errors are s.d.
Figure 1—figure supplement 1
Characterization of compounds.
(A) pH titration of TMBIT and Br-BIT with NaOH (right) or with HCl (left). The compounds were dissolved in H2O to a final concertation of 1 mM and titrated with the respective solutions. Data points for H2O are shown for comparison. (B) Isothermal titration of MnCl2 to solutions of TMBIT and Br-BIT. Control experiments were performed using buffer or EDTA solutions in the sample cell. For each titration, the absorbed heats upon addition of MnCl2 (top) and the integrated heats (bottom) are shown. Addition of MnCl2 to TMBIT and Br-BIT did not result in enthalpic contributions beyond what is observed in titrations of buffer solution. Titration of EDTA, shown as control, resulted in large exothermic signals. The integrated data was fitted to a model assuming one set of binding sites. The binding isotherm (solid line) depicts an affinity in the low nanomolar range.
Figure 1—figure supplement 2
Inhibition of hDMT1.
Dose-dependent inhibition of hDMT1 mediated transport assayed at 1 μM Fe2+ of HEK293 cells stably expressing the protein. Values show averages of 6–8 biological replicates, errors are s.d. Solid lines show a fit to a single binding site isotherm with IC50 values displayed in Figure 1B. Compound 1, Br-DBFIT (A), compound 2, TMBIT (B), compound 3, TEBIT (C), compound 4, Br-BIT (D), compound 5, oBr-BIT (E), compound 6 (F) and compound 7 (G).
Figure 1—figure supplement 3
Transport kinetics of hDMT1 at different inhibitor concentrations.
Compound 1, Br-DBFIT (A), compound 2, TMBIT (B), compound 3, TEBIT (C) and compound 4, Br-BIT (D). Experiments where performed with HEK293 cells stably expressing hDMT1. The solid lines are fits to the Michaelis-Menten equation. Values show averages of 3 biological replicates, errors are s.d.
Figure 2 with 1 supplement
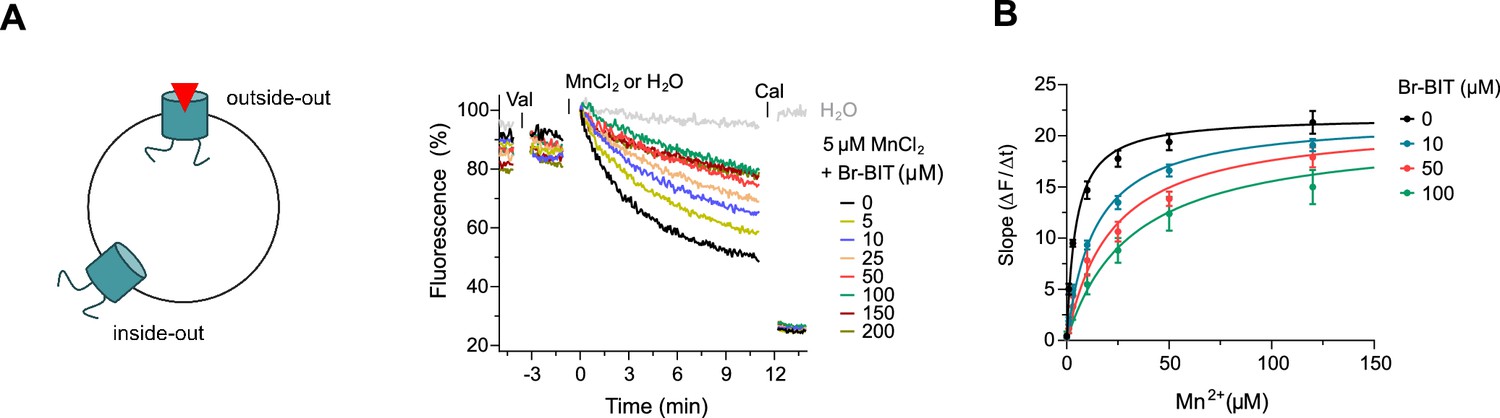
Inhibition of EcoDMT by Br-BIT.
(A) EcoDMT mediated Mn2+ transport into proteoliposomes in presence of Br-BIT assayed by the quenching of the fluorophore calcein trapped inside the vesicle. Br-BIT was added at different concentration (5–200 µM) to the outside of the liposomes. The transport is started by the addition of the potassium ionophore Valinomycin (Val) and 5 µM MnCl2. To equilibrate the Mn2+ ions, the ionophore Calcimycin (Cal) was added at the end of the run. Schematic figure (left) depicts the sidedness of inhibition which is responsible for the remaining activity at large inhibitor concentrations. (B) Transport kinetics of EcoDMT at the indicated Br-BIT concentrations. The solid lines are fits to the Michaelis-Menten equation assuming similar kinetic properties of transport for both orientations of the transporter. The observed kinetic parameters thus describe apparent values obtained from an average of transport properties in inside-out and outside-out orientations. Values show averages of six technical replicates obtained from three independent proteoliposome preparations, errors are s.e.m.
Figure 2—figure supplement 1
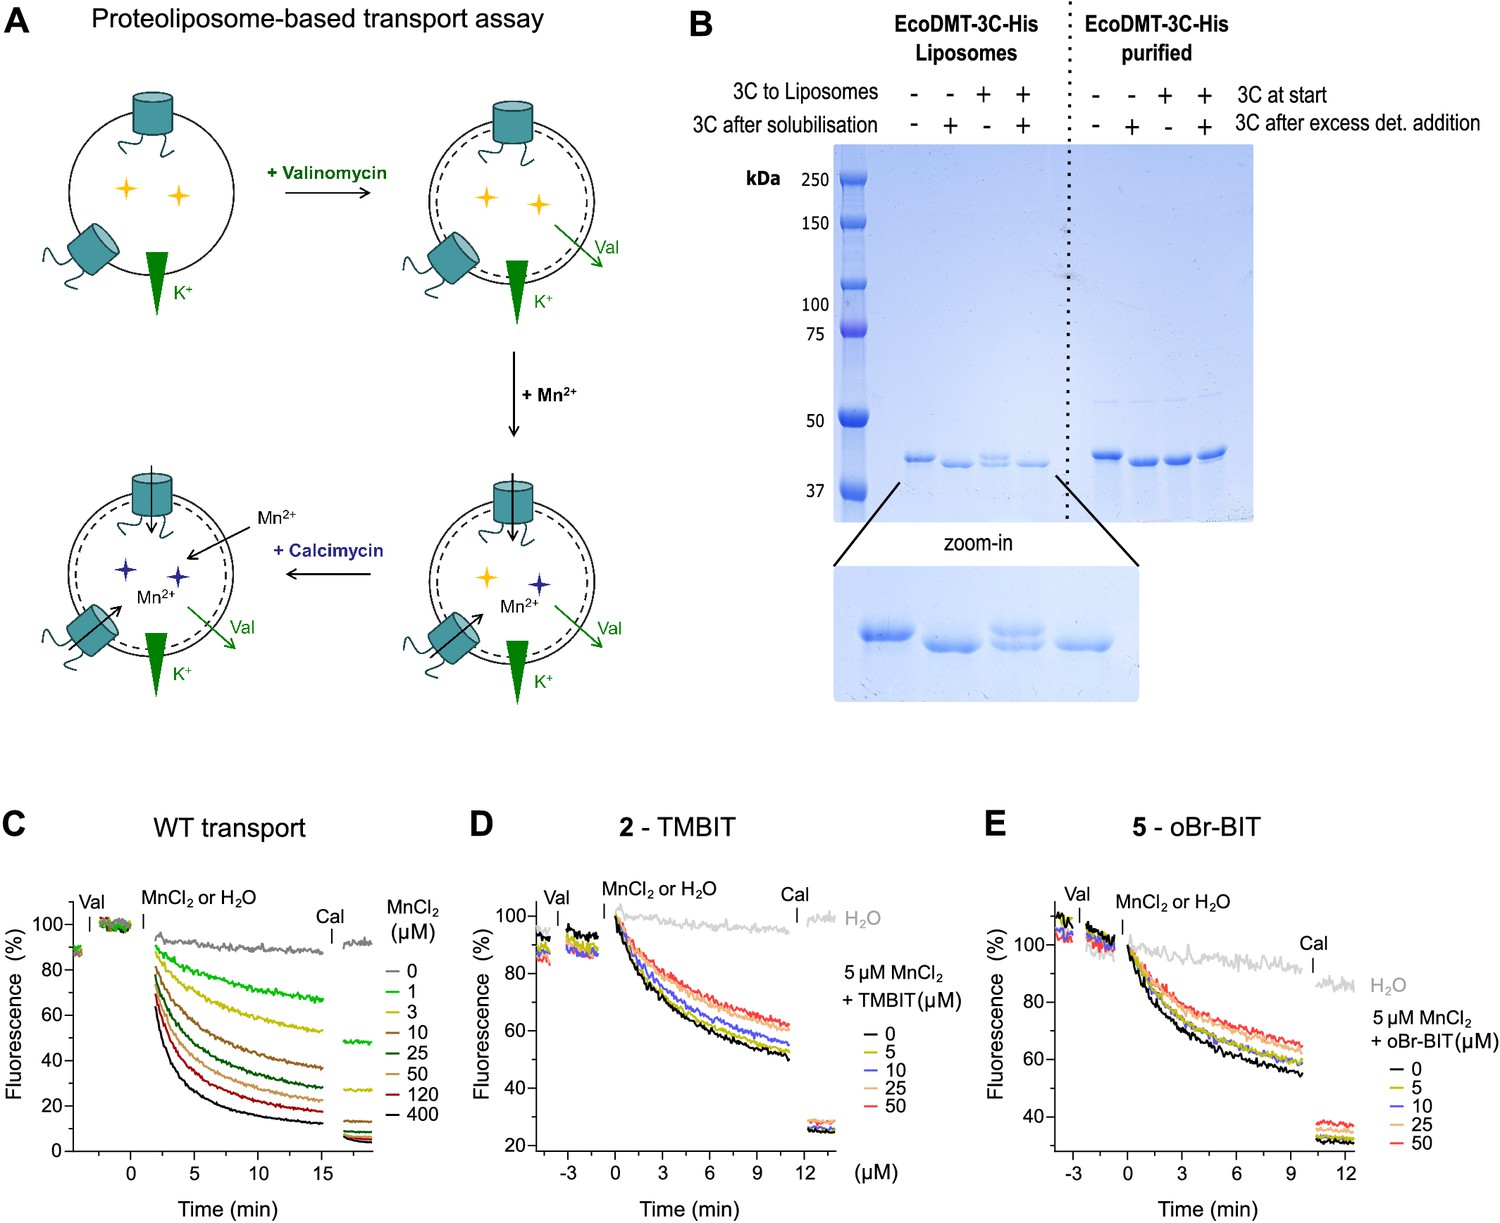
Characterization of EcoDMT inhibition.
(A) Scheme of proteoliposome-based assay. The metal sensitive fluorophore Calcein (yellow stars) was incorporated into proteoliposomes. Valinomycin (Val) was added to dissipate the membrane potential established upon Mn2+ transport into the vesicles. The time-dependent quenching of the Calcein fluorescence (blue stars) was recorded for several minutes. As a control, the metal ion ionophore Calcimycin (Cal) was added at the end of the assay to equilibrate the Mn2+ ions. (B) To determine the orientation of the transporters in the proteoliposomes the accessibility of the C-terminus of EcoDMT was probed using a C-terminally His-tagged version of EcoDMT in which the tag was preceded by a 3C protease cleavage site (EcoDMT-3C-His). The Coomassie blue stained SDS-PAGE gel shows the cleavage of the tag upon addition of the 3C protease to the outside of unilammellar vesicles (3C to Liposomes) and incubation for 2 hr. The 3C protease was subsequently removed from the outside solution and the vesicles were solubilized in detergent and digested with 3C protease (3C after solubilization). As a control, the cleavage of the tag was also assessed with purified EcoDMT-3C-His before (3C at start) and after addition of detergent (3C after excess det. addition). Upon addition of the 3C protease to the outside of proteoliposomes (third sample from the left), the His-tag is cleaved in about 50% of the transporters, which suggests an about equal ratio of outside-out and outside-in orientations. (C) Transport properties of EcoDMT WT assayed at the indicated Mn2+ concentrations. D-E, EcoDMT mediated Mn2+ transport into proteoliposomes in presence of compound 2, TMBIT (D) or compound 5, oBr-BIT (E). Inhibitor concentrations are indicated.
Figure 3 with 2 supplements

Structure of inhibitor complexes.
(A-B) Close-up views of the crystal structure of EcoDMT in complex with Br-BIT determined at 3.8 Å resolution viewed from within the membrane. The refined 2Fo-Fc electron density is shown as blue mesh. The position of Br-BIT is defined by the anomalous difference density of the Br-atom (shown as magenta mesh, contoured at 7σ) and by residual density in the 2Fo-Fc omit map (dark yellow mesh). C-D, Ribbon representations of the EcoDMT structure viewed from within the membrane (C) and from the extracellular side (D). The Mn2+ binding site is indicated with a red asterisk. The molecular surfaces are represented as gray meshes. The C-terminal sub-domain (α-helices 6–12) is shown in dark blue, α-helices 11 and 12 in magenta. (E) Position of Br-BIT in the binding pocket (gray mesh) of EcoDMT. (F) Detailed view of the residues in contact distance to Br-BIT. (G) Position of Br-BIT in the binding pocket (gray mesh) of a homology model of human DMT1. (H) Potential interactions of Br-BIT with the homology model of human DMT1. A-H, The proximal (p) isothiourea group is close to the metal ion coordinating residues (marked with a black asterisk) and the distal (d) isothiourea group is in proximity to α-helix 11.
Figure 3—figure supplement 1
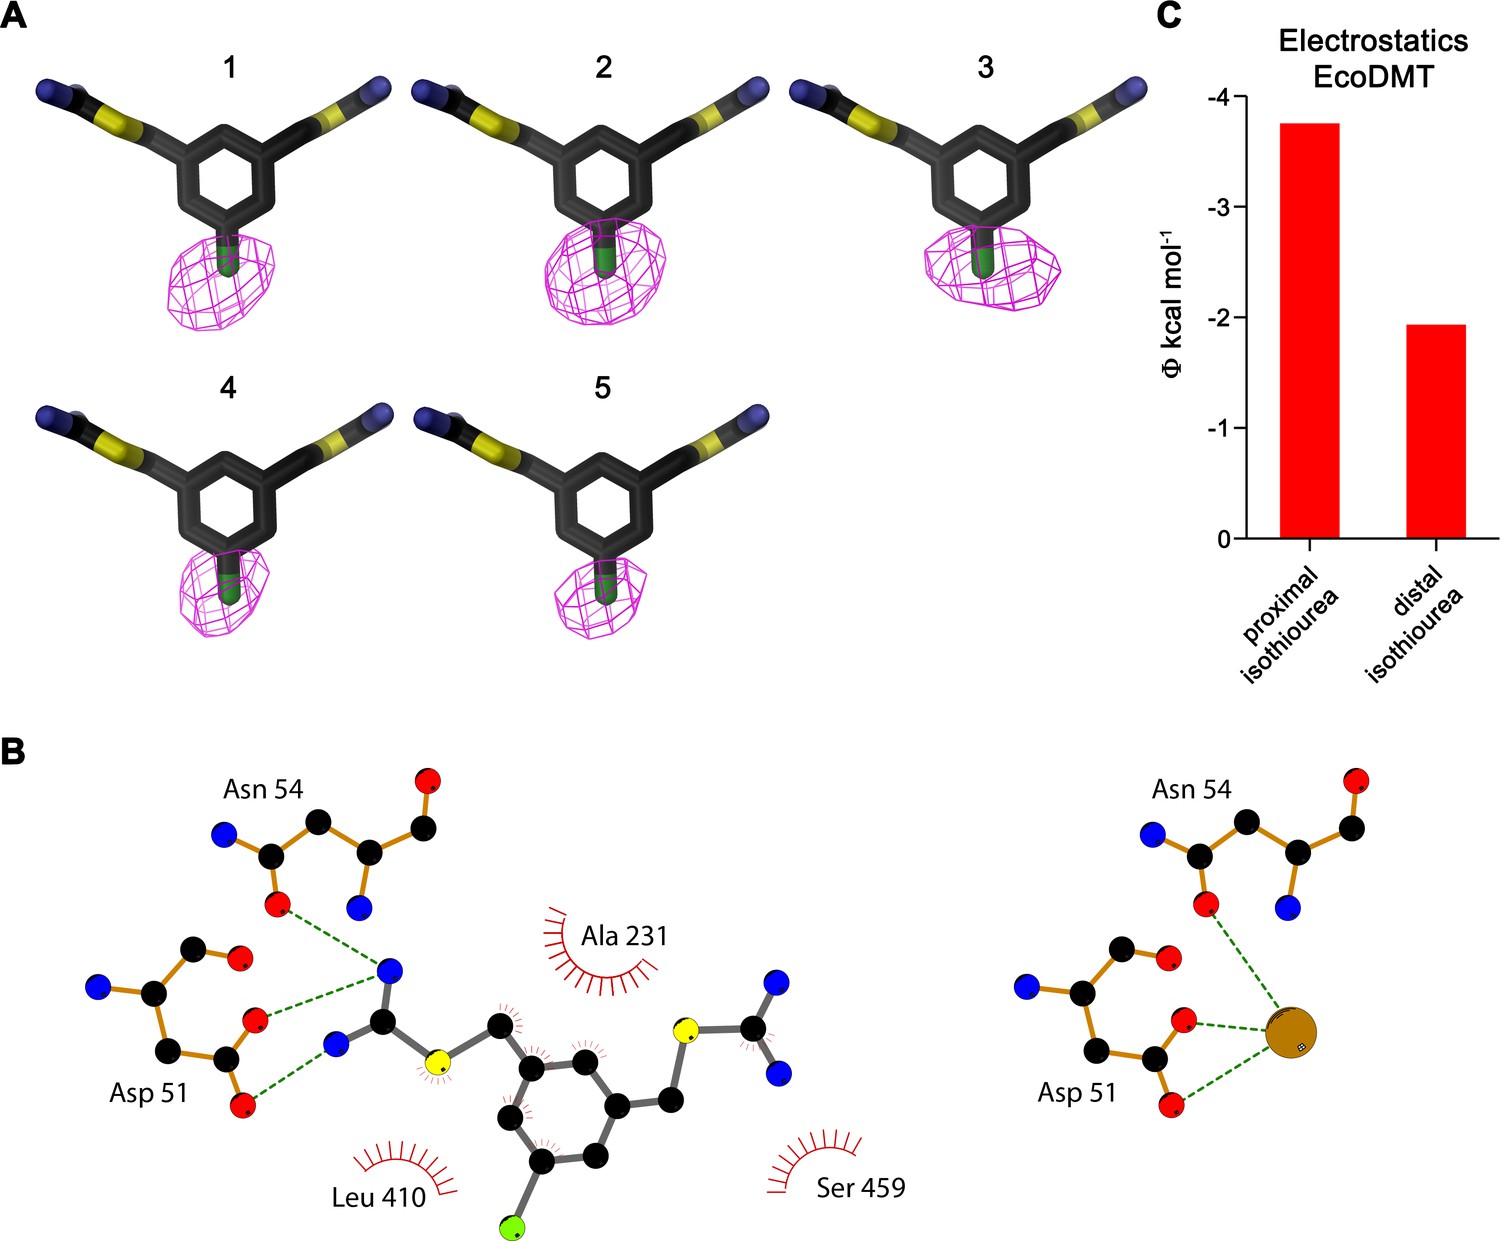
Inhibitor binding to EcoDMT.
(A) Anomalous difference density of five datasets of EcoDMT/Br-BIT complexes. The numbering of datasets is as in Table 3. The inhibitor is shown as stick, the anomalous difference density of the Br-atom (1, 3–5 contoured at 6σ, 2 at 4σ) as magenta mesh. (B) Schematic depiction of interactions between Br-BIT and EcoDMT (left) as observed in the complex structure compared to the assumed interactions between the metal ion (brown sphere) and EcoDMT (right). Hydrogen bonds and ionic interactions are indicated by dashed lines and hydrophobic contacts are represented by an arc. The 2D plots were generated using LIGPLOT (Wallace et al., 1995). (C) Electrostatic potential within the inhibitor binding site of EcoDMT as obtained from a numerical solution of the Poisson-Boltzmann equation calculated from the protein in the absence of the inhibitor. Red bars show the potential measured at the respective center of either the proximal or distal isothiourea group obtained from the coordinates of the refined inhibitor complex. The negative potential underlines the attractive electrostatic environment for interactions with the positively charged groups.
Figure 3—figure supplement 2
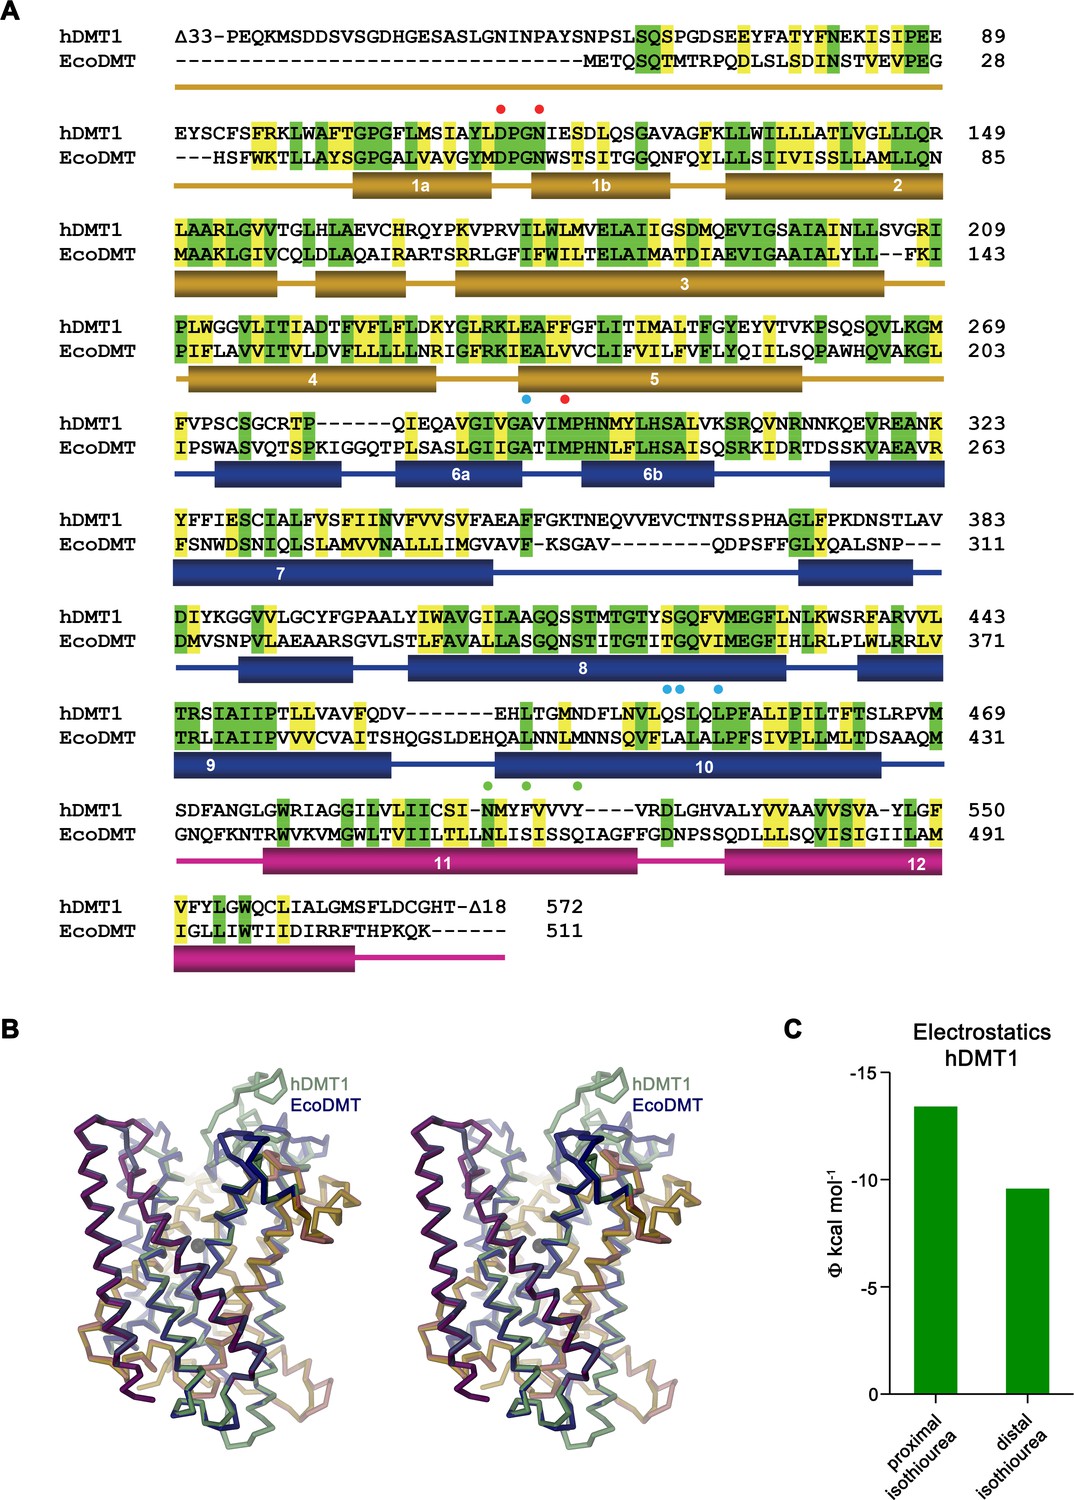
Homology model of hDMT1.
(A) Sequence alignment of hDMT1 (UniProtID: P49281-3) and EcoDMT (UniProtID: E4KPW4). Secondary structure elements of EcoDMT are indicated below. Identical residues are highlighted in green, similar residues in yellow. Red spheres mark residues of the metal ion binding site, green spheres residues mutated in hDMT1 and EcoDMT and blue spheres residues mutated in hDMT1. (B) Stereo view of a superposition of EcoDMT with a homology model of hDMT1. The location of the metal ion binding site is indicated by a black sphere. (C) Electrostatic potential within the inhibitor binding site of hDMT1 as obtained from a numerical solution of the Poisson-Boltzmann equation calculated from a homology model of the protein in the absence of the inhibitor. Green bars show the potential measured at the respective center of either the proximal or distal isothiourea group obtained from the coordinates of a modeled inhibitor complex. The negative potential underlines the attractive electrostatic environment for interactions with the positively charged groups.
Figure 4 with 2 supplements
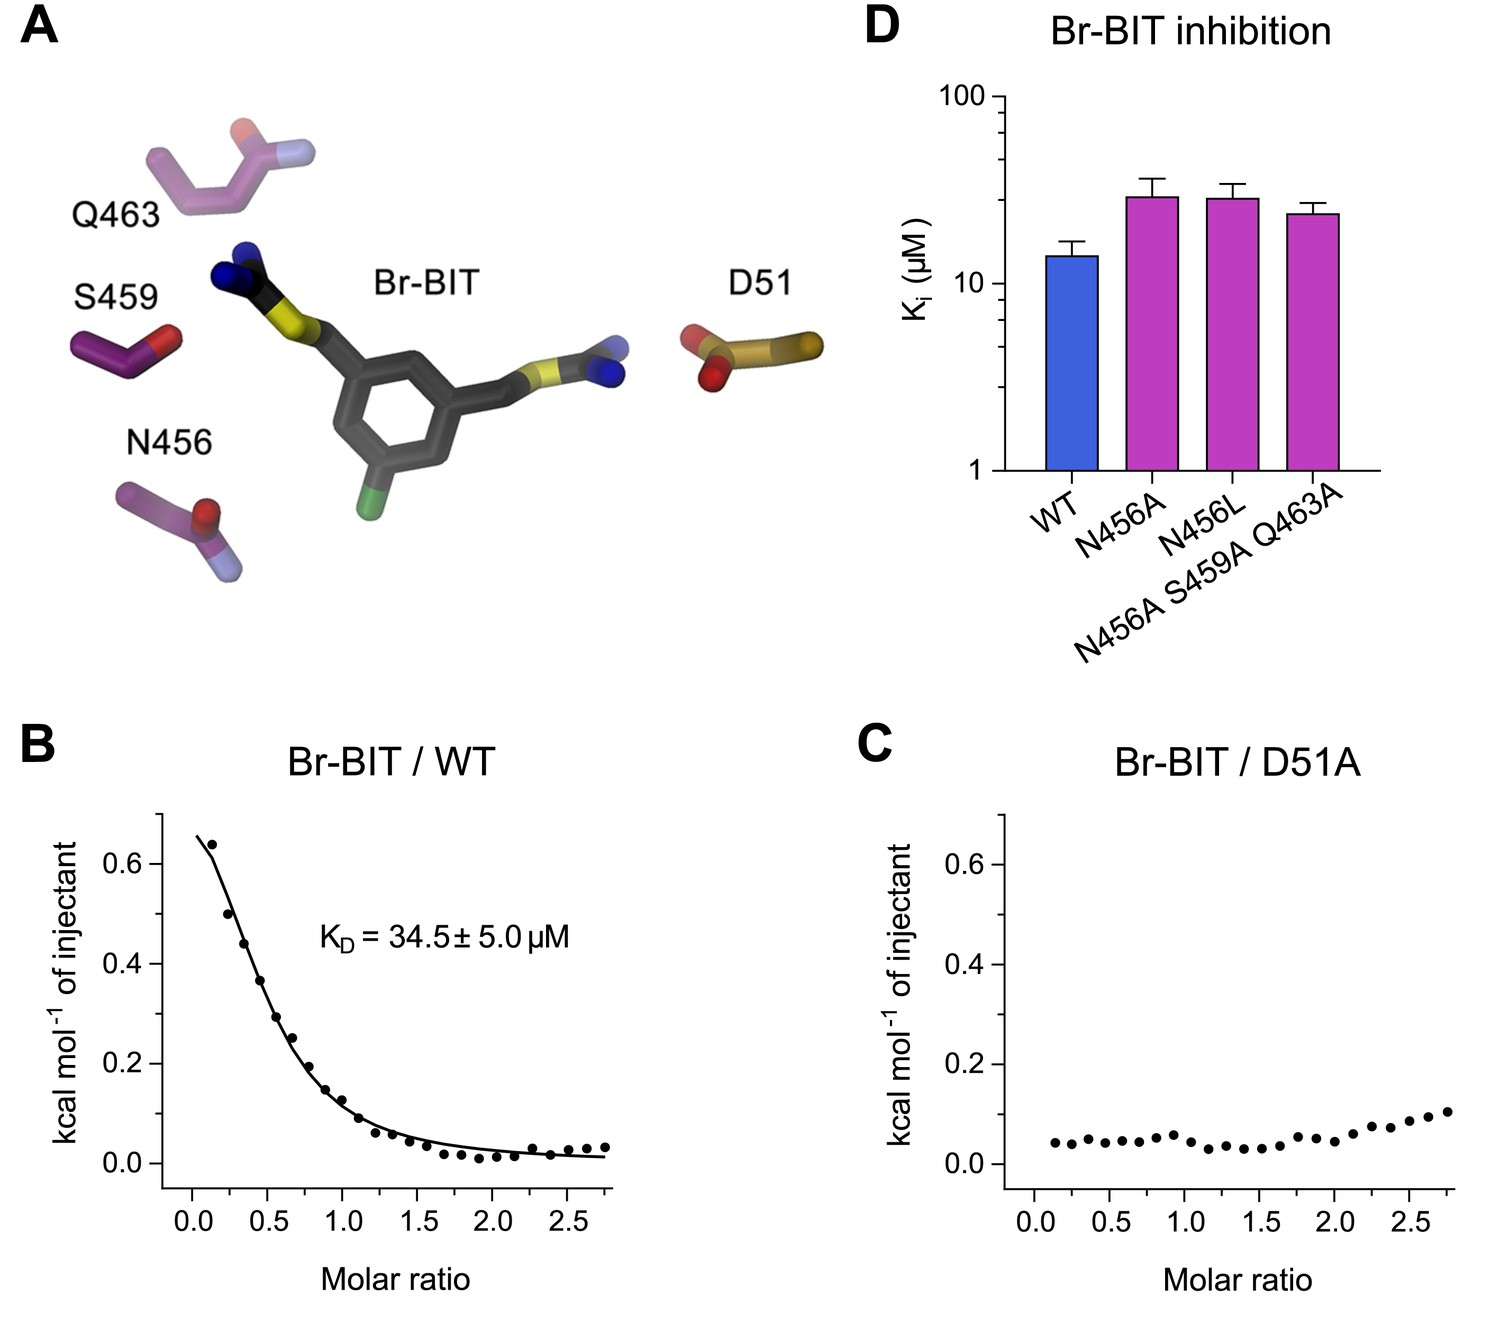
Characterization of inhibitor interactions in EcoDMT mutants.
(A) Close-up view of mutated residues surrounding Br-BIT in EcoDMT. B-C, Binding isotherms obtained from isothermal titrations of Br-BIT to EcoDMT WT (B) and the metal ion binding site mutant D51A (C). For WT, the data was fitted to a model assuming a single set of binding sites with the binding isotherm shown as solid line. Error represent fitting errors. (D) Equilibrium dissociation constants (Ki) of Br-BIT binding to WT and mutants of EcoDMT determined using the proteoliposome transport assay and by fitting the data to the mixed enzyme inhibition model (Equation 2).
Figure 4—figure supplement 1
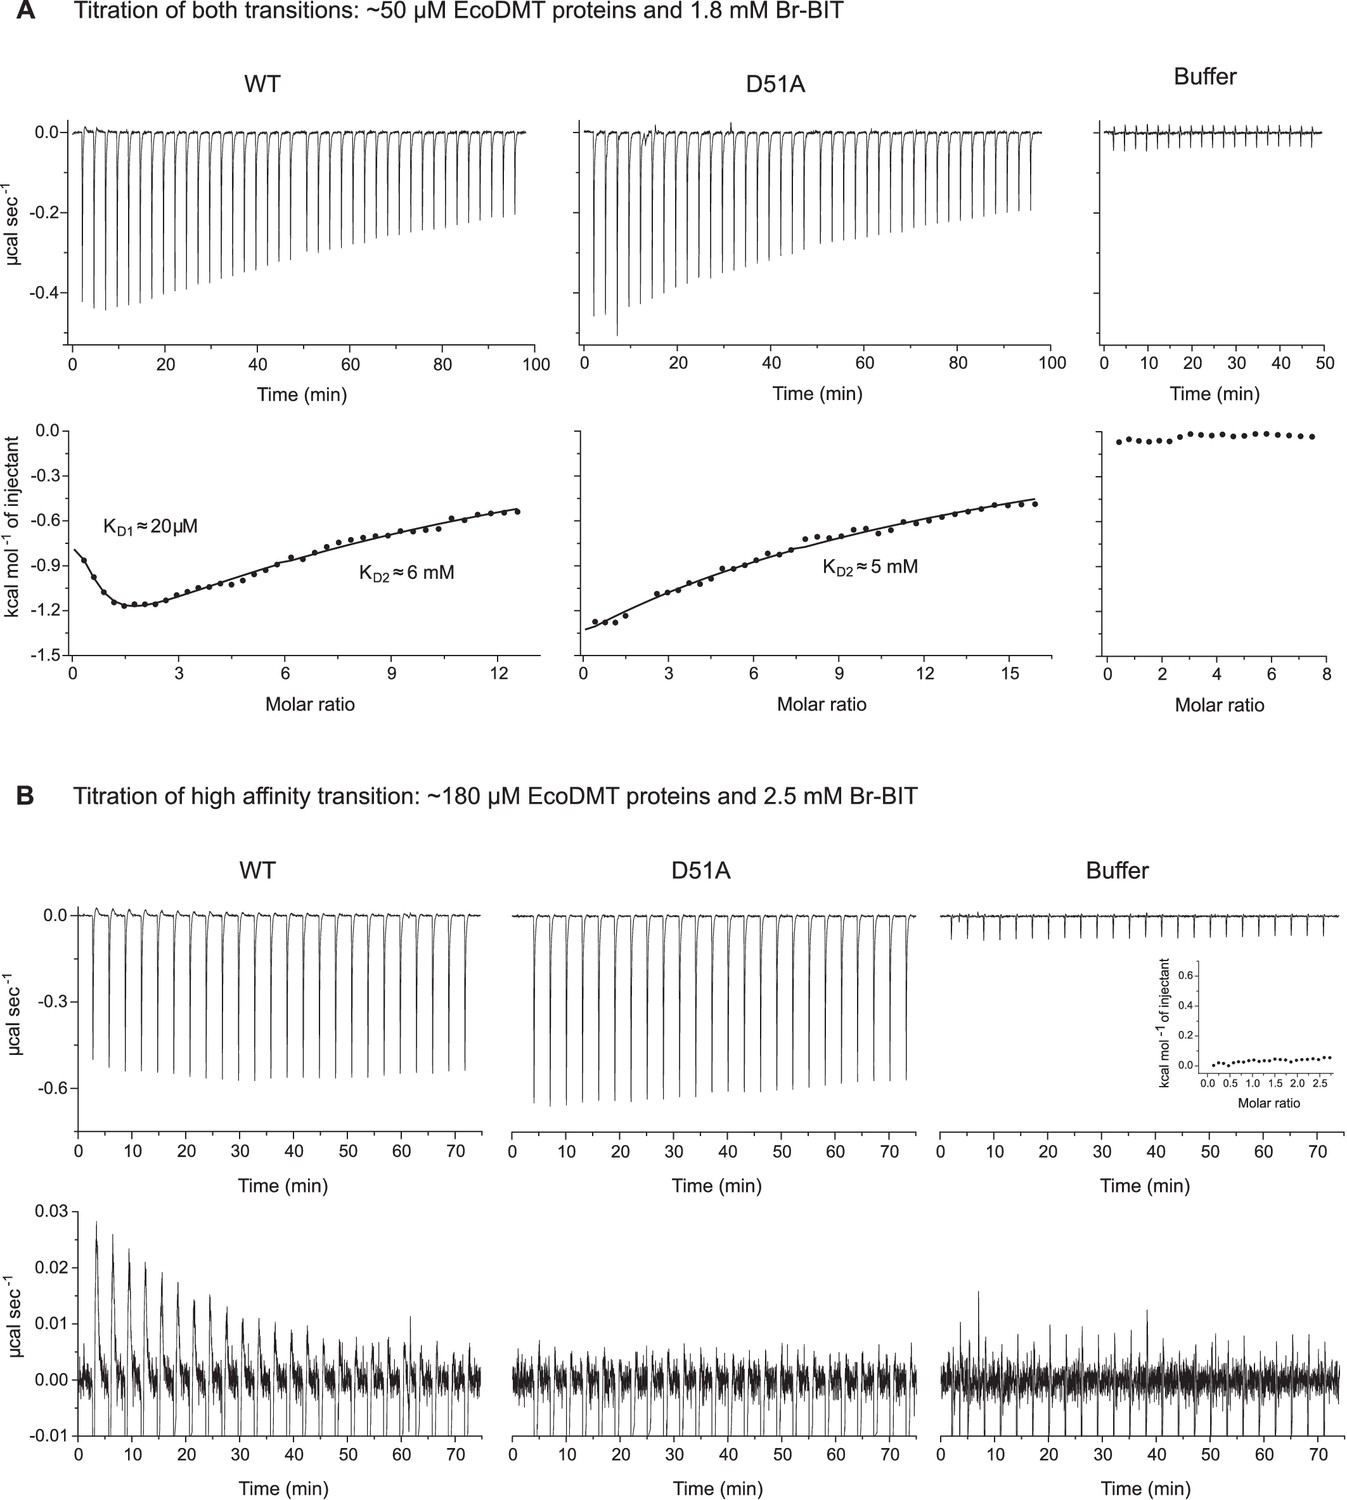
Isothermal titration calorimetry.
A-B, Isothermal titration of Br-BIT to solutions of EcoDMT WT, the binding site mutant D51A or a buffer solution. (A) Titration of high- and low-affinity transitions. Thermograms obtained after addition of Br-BIT are shown at the top and the integrated heats at the bottom. For WT, the data was fitted to a model assuming two set of binding sites. For D51A, the data was fitted to a model assuming one set of binding sites. The binding isotherms are shown as solid lines. (B) Titration of the high affinity transition. Absorbed heats upon addition of Br-BIT. Close-up at the bottom is shown for better illustration of the endothermic signal found in titrations to the WT protein. For WT and D51A, the integrated heats are displayed in Figure 4B,C and for the buffer as inset.
Figure 4—figure supplement 2

Transport inhibition of EcoDMT mutants.
A-C, Transport properties of EcoDMT mutants N456A (A), N456L (B) and the triple mutant N456A, S459A, Q463A (C) assayed at the indicated Mn2+ concentrations. D-F, Transport kinetics of EcoDMT N456A (D), N456L (E) and the triple mutant N456A, S459A, Q463A (F) at the indicated Br-BIT concentrations. The solid lines are fits to the Michaelis-Menten equation assuming similar kinetic properties of transport for both orientations of the transporter. The observed kinetic parameters thus describe apparent values obtained from an average of transport properties in inside-out and outside-out orientations. Values show averages of at least four technical replicates obtained from three independent proteoliposome preparations, errors are s.e.m.
Figure 5 with 1 supplement

Characterization of inhibitor interactions in hDMT1 mutants.
A, D Close-up view of mutated residues surrounding Br-BIT (A, D) and Br-DBFIT (D) in a homology model of hDMT1. (B) Transport activity of HEK293 cells transiently transfected with a vector not containing an insert (EV) or with WT and human DMT1 mutants determined using a cellular iron uptake assay. Data show mean of 15–39 replicates, errors are s.d. (C) Inhibition of cellular iron uptake by 10 μM TEBIT of HEK293 cells transiently transfected with WT and mutants of human DMT1 at 1 μM Fe2+. Data show mean of 6–9 replicates, errors are s.d. (E) Characterization of inhibitory properties of Br-BIT, TMBIT, TEBIT and Br-DBFIT in HEK293 cells transiently transfected with the respective hDMT1 mutants. The ratio of IC50 WT / IC50 mutant is displayed. Low values, reflect a strong effect of the mutation on inhibition. As Br-BIT did not inhibit transport of the mutant N520L at the tested concentrations, IC50 ratios are not displayed (-).
Figure 5—figure supplement 1

Transport inhibition of hDMT1 mutants.
(A) Transport properties of HEK293 cells transiently transfected with the hDMT1 mutants S476V, N520L and F523A. For each mutant, the data was normalized to a respective transfection with WT hDMT1. The lines show a fit to the Michaelis-Menten equation. Values show averages of 3–5 biological replicates. B-D, Inhibition of cellular iron uptake by 10 μM TMBIT (B), 10 μM Br-BIT (C) and 10 μM Br-DBFIT (D) of HEK293 cells transiently transfected with WT and mutants of hDMT1 at 1 μM Fe2+. Data show mean of 6–9 replicates. (E) Dose-dependent inhibition of hDMT1 mediated transport assayed at 1 μM Fe2+ of transiently transfected HEK293 cells. Data for the mutants S476V, N520L and F523A show mean of 3–5 biological replicates. The lines show a fit to a single binding site isotherm. IC50 values are depicted in Table 4. A-E, Errors are s.d. A, E, The fit to WT data is shown as dotted line for comparison.
Figure 6
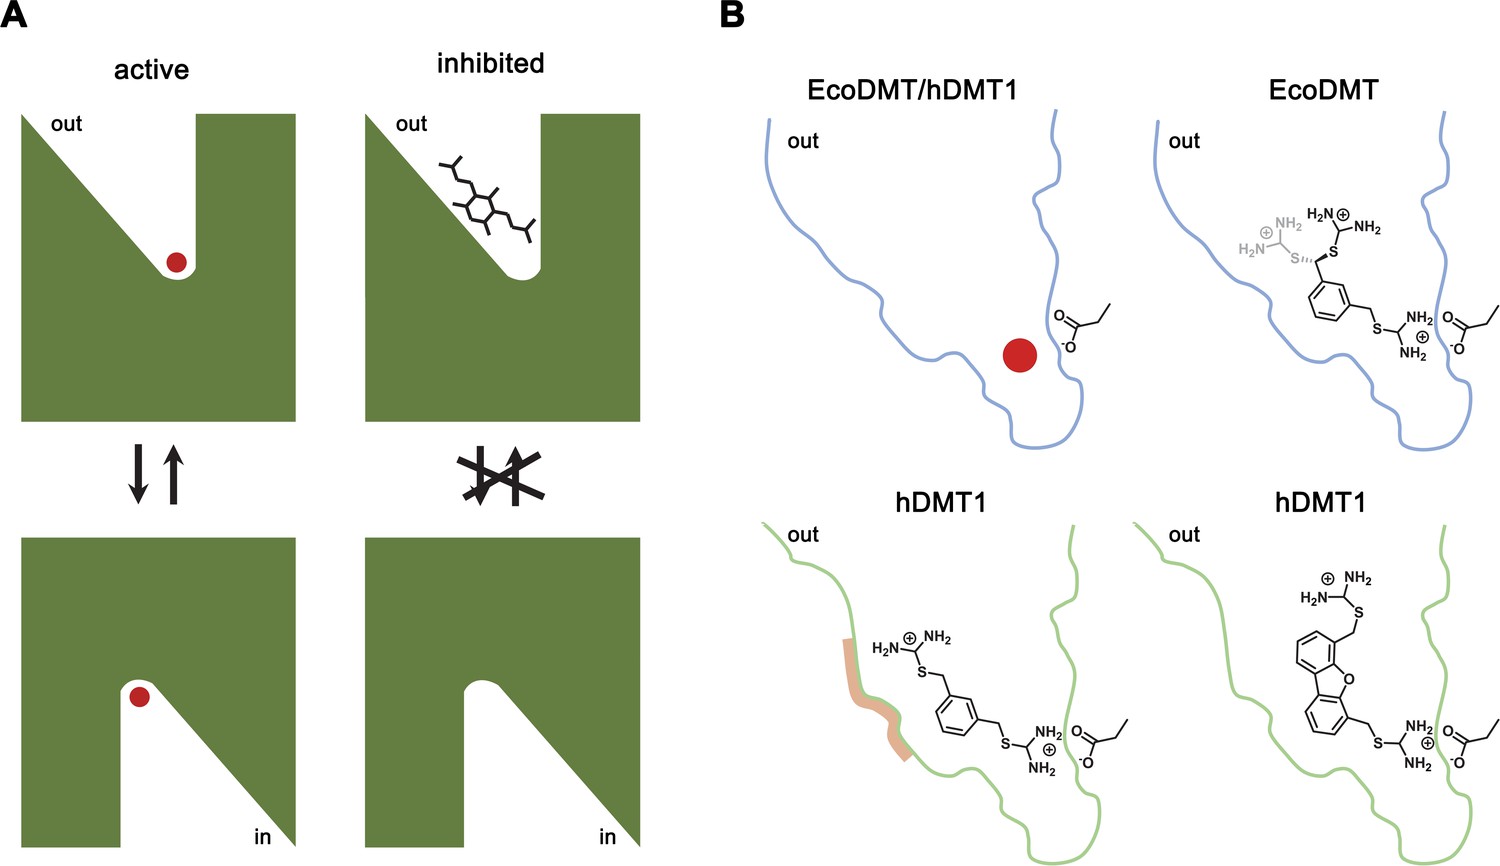
Inhibition mechanism.
(A) Scheme of the inhibitor binding to the outward-facing cavity of an SLC11 transporter thereby preventing substrate binding and conformational changes. (B) Interactions of the transported ion and different inhibitors with the outward-facing cavity of EcoDMT and hDMT1. The shape of the cavity is indicated, the sidechain of the conserved aspartate of the metal ion binding site and the chemical structures of different inhibitors are shown.
Scheme 1
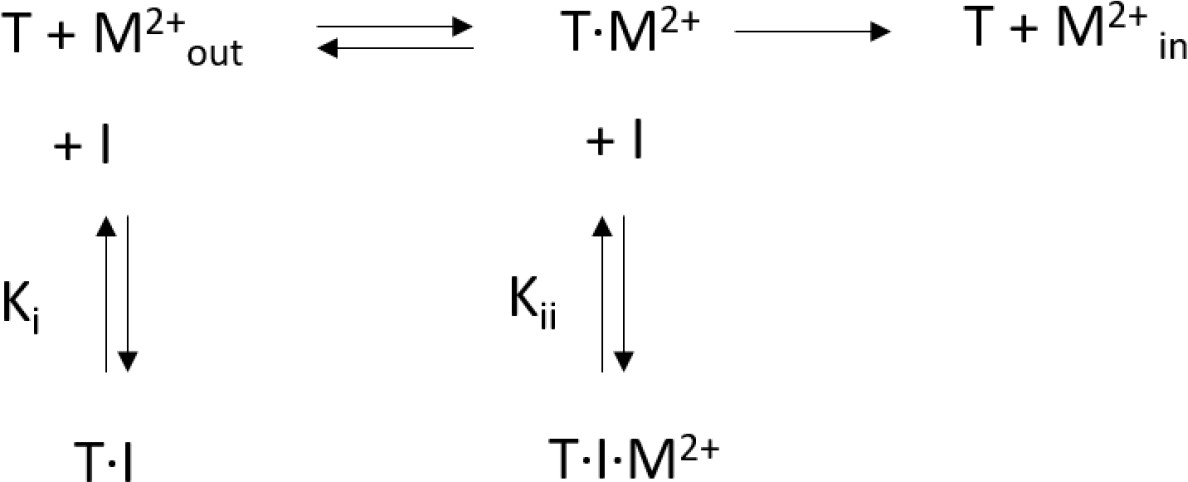
Mixed enzyme inhibition model.
Appendix 1—figure 1
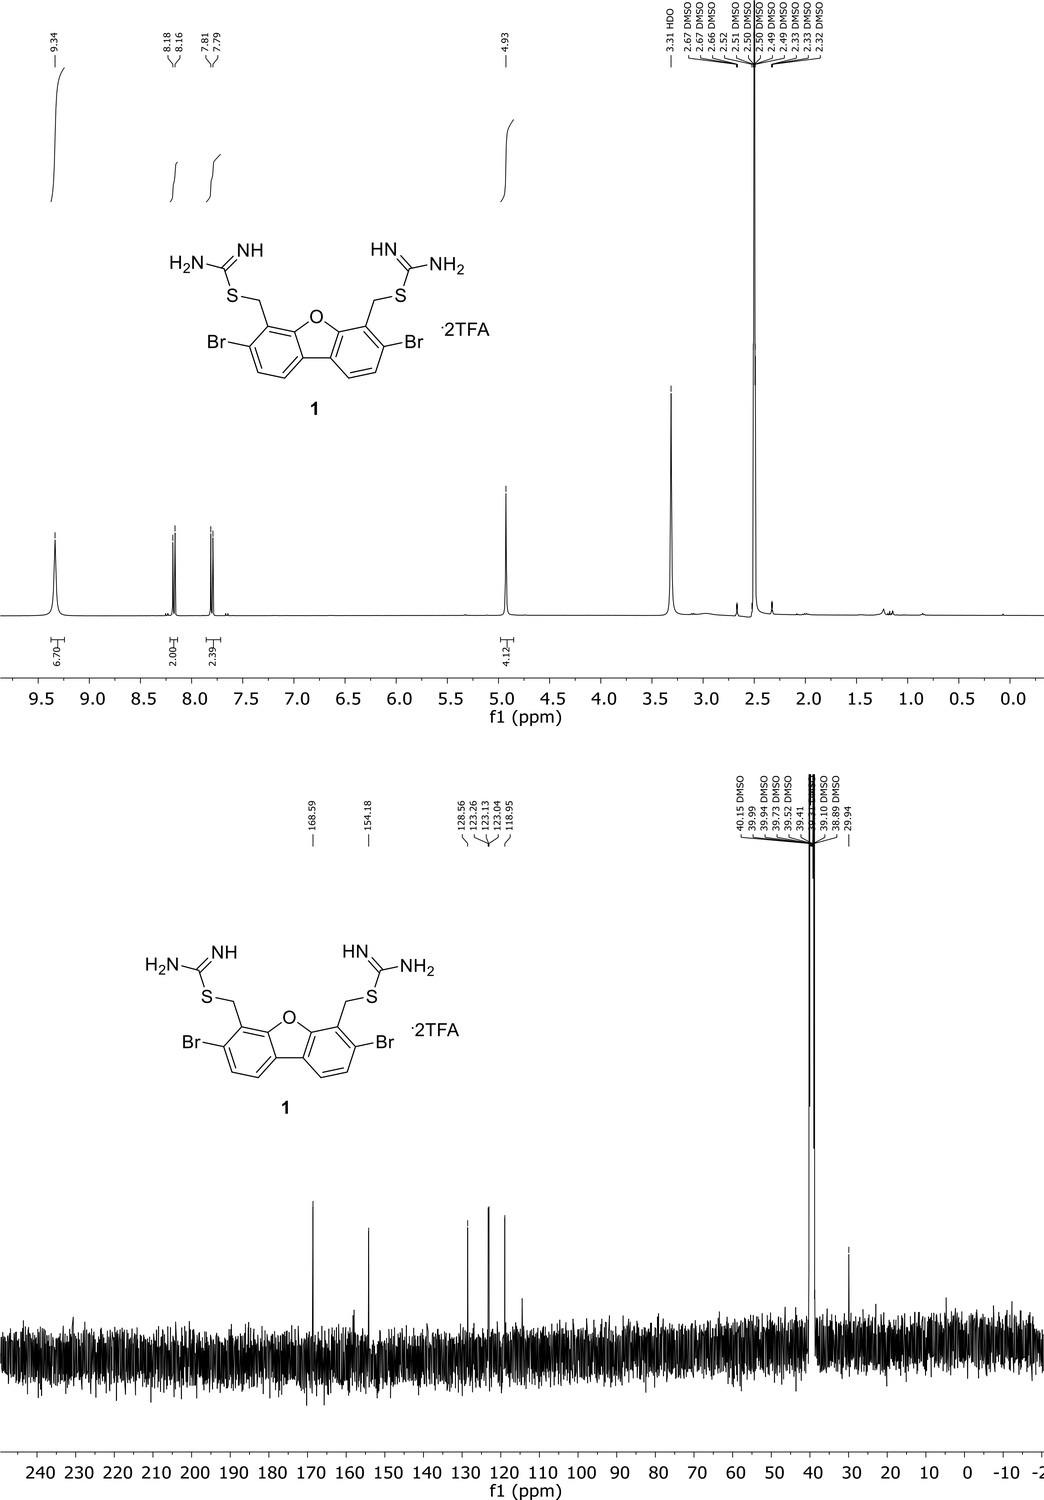
Spectroscopic characterization of compound 1.
1H NMR spectrum of the purified compound is shown on the top, 13C NMR spectrum on the bottom. Chemical shifts are displayed and listed in the respective synthesis section.
Appendix 1—figure 2

Spectroscopic characterization of compound 2.
1H NMR spectrum of the purified compound is shown on the top, 13C NMR spectrum on the bottom. Chemical shifts are displayed and listed in the respective synthesis section.
Appendix 1—figure 3
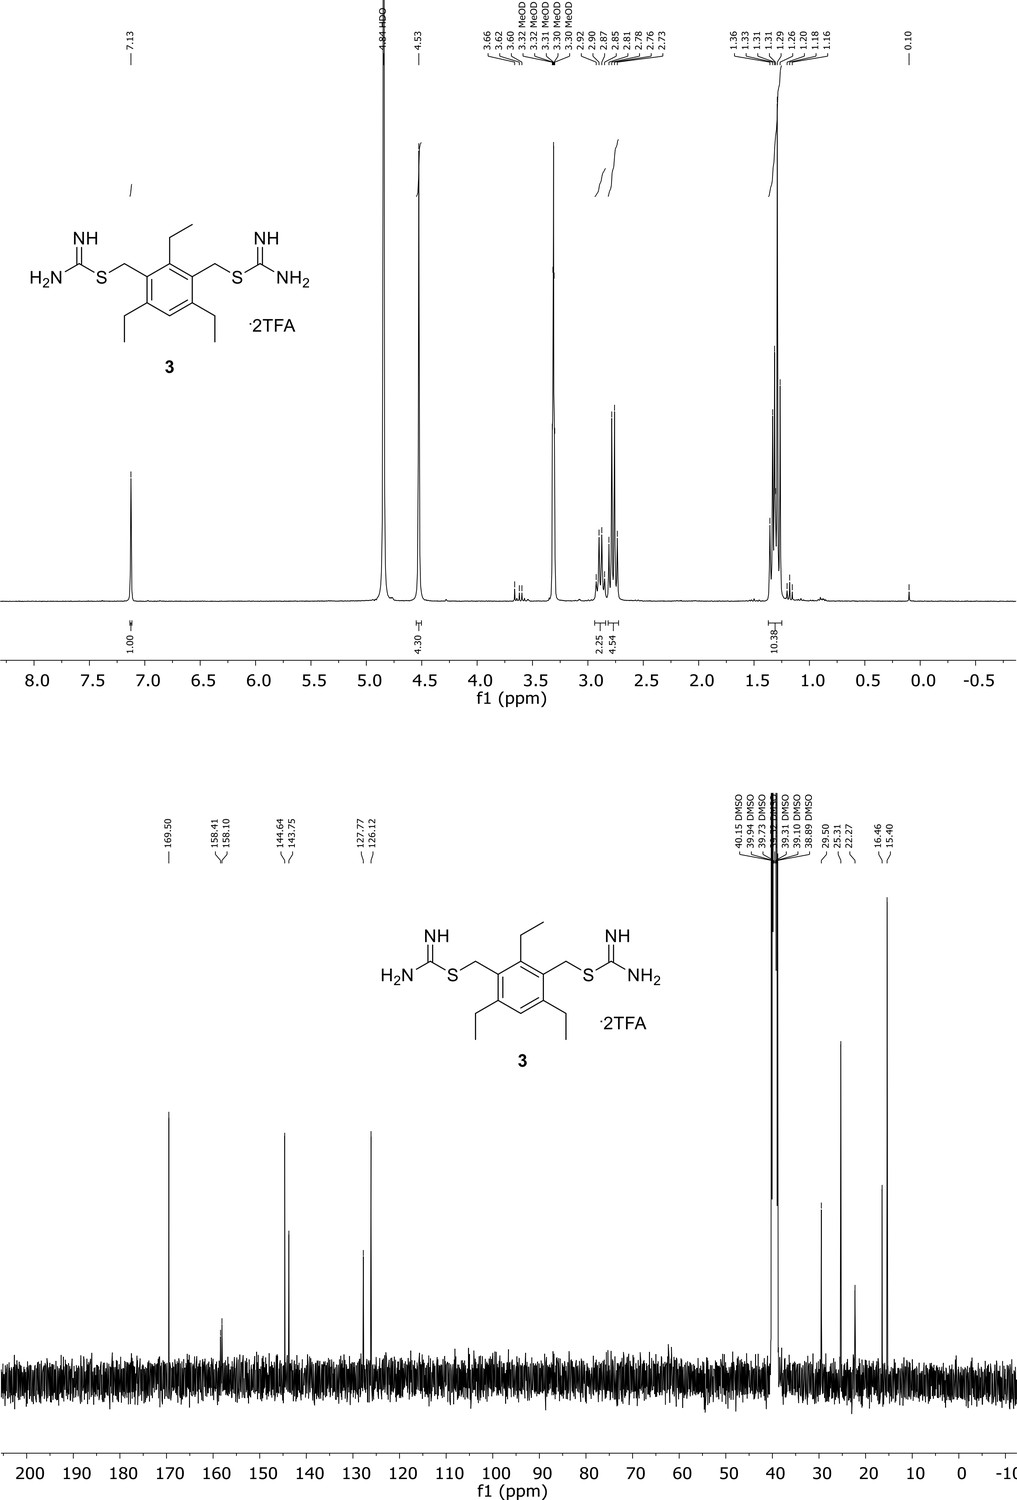
Spectroscopic characterization of compound 3.
1H NMR spectrum of the purified compound is shown on the top, 13C NMR spectrum on the bottom. Chemical shifts are displayed and listed in the respective synthesis section.
Appendix 1—figure 4

Spectroscopic characterization of compound 4.
1H NMR spectrum of the purified compound is shown on the top, 13C NMR spectrum on the bottom. Chemical shifts are displayed and listed in the respective synthesis section.
Appendix 1—figure 5
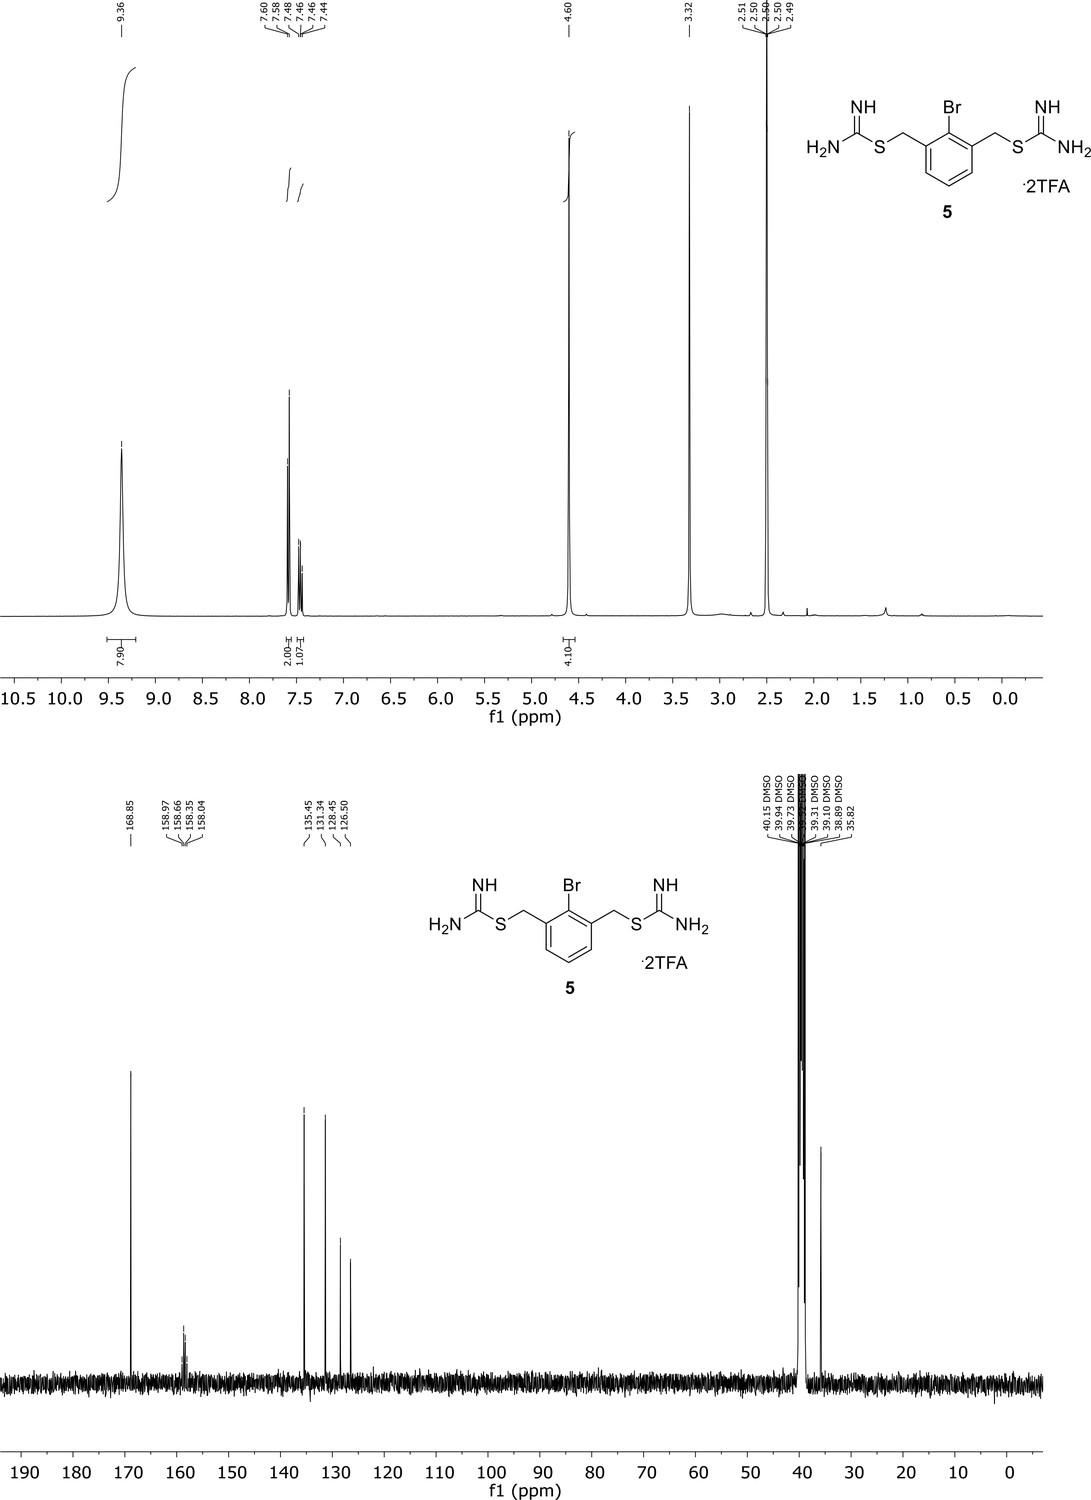
Spectroscopic characterization of compound 5.
1H NMR spectrum of the purified compound is shown on the top, 13C NMR spectrum on the bottom. Chemical shifts are displayed and listed in the respective synthesis section.
Appendix 1—figure 6
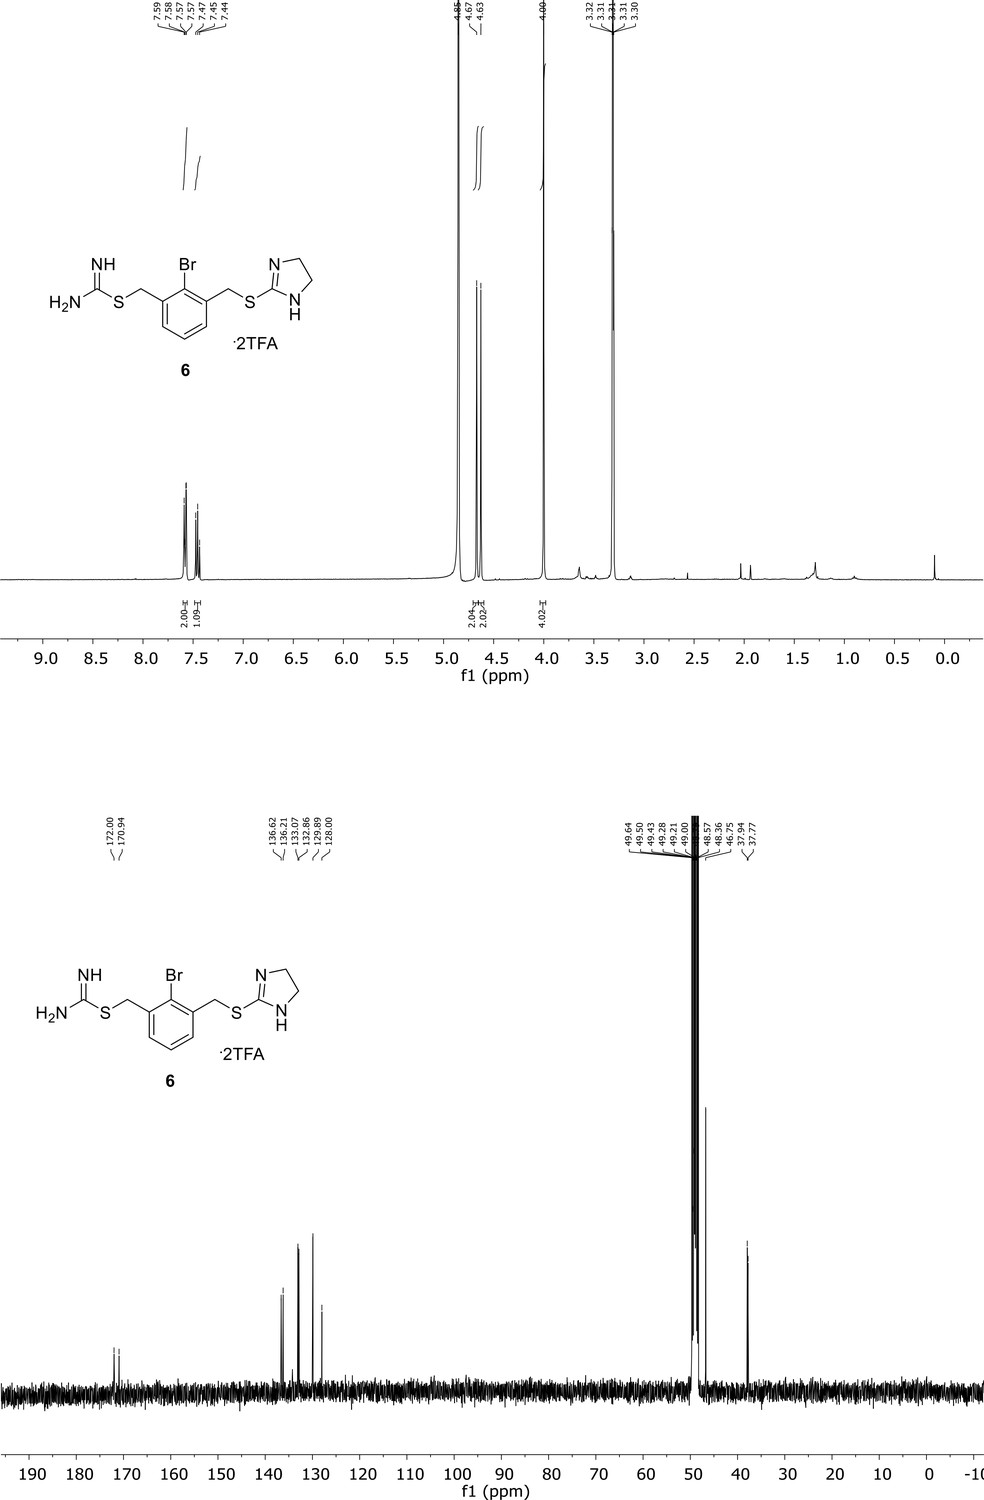
Spectroscopic characterization of compound 6.
1H NMR spectrum of the purified compound is shown on the top, 13C NMR spectrum on the bottom. Chemical shifts are displayed and listed in the respective synthesis section.
Appendix 1—figure 7
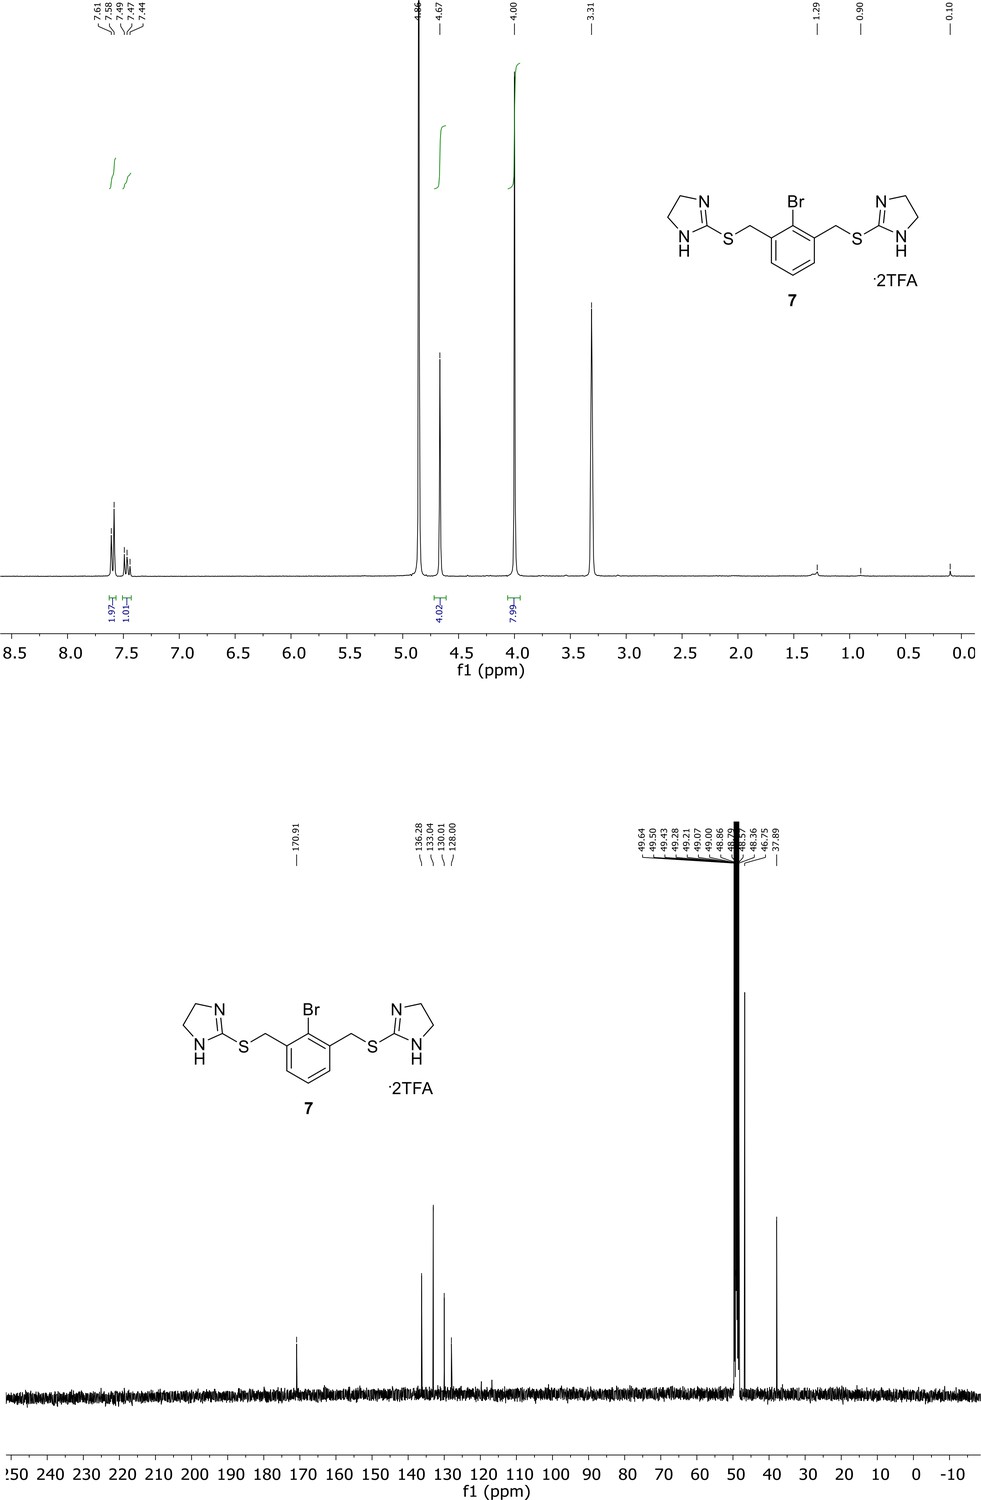
Spectroscopic characterization of compound 7.
1H NMR spectrum of the purified compound is shown on the top, 13C NMR spectrum on the bottom. Chemical shifts are displayed and listed in the respective synthesis section.
Tables
Table 1
Transport kinetics and inhibition.
| Protein | Inhibitor | KM (µM) | vmax* | Ki (µM) | α |
|---|---|---|---|---|---|
| Michaelis-Menten | Equation 2 | ||||
| hDMT1 | - | 3.1 ± 0.6 | 4.6 ± 0.3 | 0.57 ± 0.17 | >100 |
| 1 µM Br-DBFIT | 9.2 ± 1.2 | 4.2 ± 0.2 | |||
| 2.5 µM Br-DBFIT | 14.7 ± 2.8 | 4.3 ± 0.4 | |||
| 5 µM Br-DBFIT | 14.4 ± 3.0 | 3.4 ± 0.4 | |||
| hDMT1 | - | 2.6 ± 0.5 | 2.6 ± 0.1 | 0.35 ± 0.07 | 17.4 |
| 0.25 µM TMBIT | 4.0 ± 0.4 | 2.3 ± 0.1 | |||
| 0.5 µM TMBIT | 6.1 ± 0.8 | 2.4 ± 0.1 | |||
| 1.25 µM TMBIT | 8.0 ± 1.0 | 2.1 ± 0.1 | |||
| hDMT1 | - | 2.9 ± 0.4 | 3.1 ± 0.1 | 0.08 ± 0.01 | >100 |
| 0.25 µM TEBIT | 13.1 ± 3.3 | 3.0 ± 0.4 | |||
| 0.5 µM TEBIT | 18.3 ± 5.3 | 2.9 ± 0.5 | |||
| 1.25 µM TEBIT | 26.8 ± 8.6 | 2.5 ± 0.5 | |||
| hDMT1 | - | 2.6 ± 0.5 | 2.6 ± 0.1 | 3.6 ± 0.7 | 13.5 |
| 5 µM Br-BIT | 6.7 ± 0.7 | 2.4 ± 0.1 | |||
| 10 µM Br-BIT | 7.4 ± 1.2 | 2.2 ± 0.1 | |||
| 25 µM Br-BIT | 12.4 ± 3.7 | 1.6 ± 0.2 | |||
| hDMT1 S476V | - | 2.3 ± 0.5 | - | - | - |
| hDMT1 N520L | - | 2.4 ± 0.5 | - | - | - |
| hDMT1 F523A | - | 2.7 ± 0.6 | - | - | - |
| EcoDMT | - | 4.3 ± 0.5 | 21.9 ± 0.5 | 14.2 ± 2.6 | >100 |
| 10 µM Br-BIT | 13.7 ± 1.2 | 21.7 ± 0.4 | |||
| 50 µM Br-BIT | 21.7 ± 3.6 | 21.4 ± 1.0 | |||
| 100 µM Br-BIT | 31.5 ± 6.9 | 20.4 ± 1.3 | |||
| EcoDMT N456A | - | 12.5 ± 1.7 | 19.1 ± 0.6 | 29.3 ± 7.1 | 8.5 |
| 10 µM Br-BIT | 17.8 ± 4.0 | 18.3 ± 1.1 | |||
| 50 µM Br-BIT | 28.8 ± 5.4 | 14.9 ± 0.8 | |||
| 100 µM Br-BIT | 33.9 ± 6.9 | 13.8 ± 0.8 | |||
| EcoDMT N456L | - | 7.5 ± 0.7 | 17.3 ± 0.4 | 28.8 ± 5.3 | 29.2 |
| 10 µM Br-BIT | 13.1 ± 1.7 | 16.2 ± 0.5 | |||
| 50 µM Br-BIT | 19.0 ± 2.4 | 13.8 ± 0.5 | |||
| 100 µM Br-BIT | 27.0 ± 3.9 | 15.1 ± 0.6 | |||
| EcoDMT N456A S459A Q463A | 7.2 ± 0.9 | 21.9 ± 0.5 | 23.8 ± 3.2 | >100 | |
| 10 µM Br-BIT | 15.7 ± 1.7 | 21.7 ± 0.4 | |||
| 50 µM Br-BIT | 32.3 ± 4.5 | 21.4 ± 1.0 | |||
| 100 µM Br-BIT | 47.9 ± 5.6 | 20.4 ± 1.3 | |||
-
*νmax values for hDMT1 measurements are given in pmol min−1 well−1 and νmax values for EcoDMT measurements in ΔF Δt−1.
Table 2
X-ray data collection and refinement statistics.
| EcoDMT-Br-BIT complex | |
|---|---|
| Data collection | |
| Space group | C2 |
| Cell dimensions | |
| a, b, c (Å) | 150.0, 81.7, 95.6 |
| α, β, γ (°) | 90, 107.4, 90 |
| Wavelength (Å) | 0.92 |
| Resolution (Å) | 50–3.8 (3.9–3.8)* |
| Rmerge (%) | 9.8 (154.6) |
| CC½ (%) | 100.0 (81.7) |
| I /σI | 15.6 (2.1) |
| Completeness (%) | 99.3 (99.3) |
| Redundancy | 14.3 (13.9) |
| Refinement | |
| Resolution (Å) | 12–3.8 |
| No. Reflections | 10576 |
| Rwork/Rfree (%) | 21.6/25.8 |
| No. atoms | |
| Protein | 3780 |
| Ligand/ion | 17 |
| Water | - |
| B factors | |
| Protein | 171.3 |
| Ligand/ion | 237.1 |
| r.m.s. deviations | |
| Bond lengths (Å) | 0.005 |
| Bond angles (°) | 0.65 |
-
*Values in parentheses are for highest-resolution shell.
Table 3
X-Ray data collection statistics of additional datasets.
| EcoDMT-Br-BIT complexes | 1 | 2 | 3 | 4 | 5 |
|---|---|---|---|---|---|
| Data collection | |||||
| Space group | C2 | C2 | C2 | C2 | C2 |
| Cell dimensions (Å), (°) | |||||
| a b c | 147.9 81.2 95.3 | 149.7 81.7 95.5 | 148.7 81.1 94.8 | 150.1 81.6 95.5 | 148.9 81.3 95.4 |
| α β γ | 90 107.3 90 | 90 107.3 90 | 90 107.1 90 | 90 107.3 90 | 90 107.3 90 |
| Wavelength (Å) | 0.92 | 0.92 | 0.92 | 0.92 | 0.92 |
| Resolution (Å) | 50–3.8 (3.9–3.8)* | 50–4.0 (4.1–4.0)* | 50–4.3 (4.4–4.2)* | 50–4.1 (4.2–4.1)* | 50–4.2 (4.3–4.2)* |
| Rmerge (%) | 6.7 (182.1) | 7.8 (142.0) | 7.2 (152.6) | 8.3 (112.5) | 11.8 (198.9) |
| CC½ (%) | 100.0 (80.4) | 100.0 (81.0) | 100.0 (71.6) | 100.0 (53.9) | 100.0 (77.1) |
| I /σI | 15.6 (1.5) | 19.3 (1.6) | 14.8 (1.4) | 13.7 (1.6) | 14.5 (1.5) |
| Completeness (%) | 99.2 (99.7) | 99.0 (99.5) | 97.4 (74.0) | 94.8 (40.5) | 99.8 (100.0) |
| Redundancy | 14.6 (14.6) | 21.0 (11.7) | 14.2 (11.8) | 8.7 (5.1) | 14.0 (14.4) |
-
*Values in parentheses are for highest-resolution shell.
Table 4
IC50 values (μM) of WT and mutant proteins.
| TEBIT | TMBIT | Br-BIT | Br-DBFIT | |
|---|---|---|---|---|
| WT | 0.48 ± 0.09 | 1.28 ± 0.54 | 4.2 ± 1.5 | 1.43 ± 0.34 |
| S476V | 32.1 ± 6.3 | 36.1 ± 8.0 | 47.6 ± 6.8 | 11.3 ± 0.3 |
| N520L | 13.7 ± 3.9 | 21.7 ± 6.9 | - | 2.0 ± 0.4 |
| F523A | 17.8 ± 7.0 | 82.9 ± 5.3 | 17.3 ± 0.5 | 2.9 ± 0.9 |
-
Measurements were performed using 1 μM Fe2+ with transiently transfected HEK293 cells expressing the indicated hDMT1 constructs. The values shown for WT deviate from the values shown in Figure 1—figure supplement 2, due to small differences in the experimental setup (i.e. the use of a stable cell line vs. transiently transfected cells).
Key resources table
| Reagent type (species) or resource | Designation | Source or reference | Identifier | Additional information |
|---|---|---|---|---|
| Chemical compound, drug | Opti-MEM | Thermo fisher Scientific | Cat#11058021 | |
| Chemical compound, drug | Lipofectamine 2000 TransfectionReagent | Thermo fisher Scientific | Cat#11668027 | |
| Chemical compound, drug | Dulbecco’s Modified Eagle’s Medium - high glucose | MERCK | Cat#D6429 | |
| Chemical compound, drug | Fetal Bovine Serum (FBS) | MERCK | Cat#F7524 | |
| Chemical compound, drug | MEM Non-essentialAmino Acid Solution(100x) | MERCK | Cat#M7145 | |
| Chemical compound, drug | Poly-D-lysine hydrobromide | MERCK | Cat#P6407 | |
| Chemical compound, drug | Penicillin-Streptomycin | MERCK | Cat#P4333 | |
| Chemical compound, drug | HEPES solution | MERCK | Cat#H0887 | |
| Chemical compound, drug | Sodium pyruvatesolution | MERCK | Cat# S8636 | |
| Chemical compound, drug | MicroScint-20 | PerkinElmer | Cat# 6013621 | |
| Chemical compound, drug | Iron-55 Radionuclideas Ferricchloride/s.A.>3 Ci/g,Ferric chloride in 0.5MHCl | ANAWA Biomedical Servicesand Products | Cat# ARX-0109–2 | |
| Chemical compound, drug | Terrific Broth (TB) medium | Sigma | Cat#T9179 | |
| Chemical compound, drug | Ampicillin | AppliChem | Cat#A0839 | |
| Chemical compound, drug | L-(+)-Arabinose | Sigma-Aldrich | Cat#A3256 | |
| Chemical compound, drug | Lysozyme | AppliChem | Cat#A3711 | |
| Chemical compound, drug | DNase I | AppliChem | Cat#A3778 | |
| Chemical compound, drug | n-decyl-β-D-maltoside (DM) | Anatrace | Cat#D322 | |
| Chemical compound, drug | n-dodecyl-β-D-maltoside (DDM) | Anatrace | Cat#D310 | |
| Chemical compound, drug | 1-palmitoyl-2-oleoyl-sn-glycero-3-phosphoethanolamine (POPE) | Avanti Polar Lipids, Inc | Cat#850757 | |
| Chemical compound, drug | 1-palmitoyl-2-oleoyl-sn-glycero-3-phospho-(1'-rac-glycerol) (POPG) | Avanti Polar Lipids, Inc | Cat#840457 | |
| Chemical compound, drug | Diethyl ether | Millipore Sigma | Cat#296082 | |
| Chemical compound, drug | Triton X-100 | Millipore Sigma | Cat#T9284 | |
| Chemical compound, drug | Calcein | Thermo Fisher Scientific | Cat#C481 | |
| Chemical compound, drug | Valinomycin | Thermo Fisher Scientific | Cat#V1644 | |
| Chemical compound, drug | A-23187 Free Acid (Calcimycin) | Thermo Fisher Scientific | Cat#A1493 | |
| Peptide, recombinant protein | HRV 3C protease | Expressed andpurified (Expression vector pET-3C) RaimundDutzler laboratory | N/A | |
| Commercial assay or kit | Corning96 Well Black PolystyreneMicroplate | MERCK | Cat# CLS3603 | |
| Commercial assay or kit | PfuUltra High-fidelityDNA Polymerase | Agilent Technologies | Cat# 600380 | |
| Commercial assay or kit | Nickel NTA Agarose Resin | ABT Agarose Bead Technologies | 6BCL-NTANi-X | |
| Commercial assay or kit | Superdex 200 10/300 GL | GE Healthcare | Cat#17517501 | |
| Commercial assay or kit | 24-well Cryschem M crystallization plate | Hampton Research | Cat#HR1-002 | |
| Commercial assay or kit | Bio-Beads SM-2 | Bio-Rad | Cat#1523920 | |
| Commercial assay or kit | Avestin LiposoFastLiposome FactoryBasic | Millipore Sigma | Cat#Z373400 | |
| Commercial assay or kit | 400 nm polycarbonatefilters for LiposoFast | Millipore Sigma | Cat#Z373435 | |
| Commercial assay or kit | 96-well black-walled microplate | Thermo Fisher Scientific | Cat#M33089 | |
| Commercial assay or kit | Amicon 50 kDa MWCO centrifugal filter | EMD Millipore | Cat#UFC805024 | |
| Commercial assay or kit | 0.22 µm Ultrafree-MC Centrifugal Filter | EMD Millipore | Cat#UFC30GV | |
| Strain, strain background | Escherichia coli MC1061 | Thermo Fisher Scientific | Cat#C66303 | |
| Strain, strain background | Eremococcus coleocola strain | https://www.dsmz.de/collection | DSM No. 15696 | |
| Cell line (human) | HEK-293 | ATCC | CRL-1573 | |
| Cell line (human) | HEK-293T | ATCC | CRL-3216 | |
| Recombinant DNA | Human SLC11A2 isoform 1A-IRE (+) ORF inserted in pBluescript SK - vector | Hentze laboratory- EMBL, Heildelberg, Germnay | N/A | |
| Recombinant DNA | pIRES2 DsRed-Express2 Vector | Takara Clontech | Cat# 632540 | |
| Recombinant DNA | Expression vector pBXC3GH | Addgene | Cat#47070 | |
| Recombinant DNA | Expression vector pBXC3H | Addgene | Cat#47068 | |
| Recombinant DNA | Expression vector pET-3C | Dr. Arie Geerlof, EMBL Munich | N/A | |
| Software, algorithm | XDS | Kabsch, 2010 | http://xds.mpimf-heidelberg.mpg.de/ | |
| Software, algorithm | CCP4 | Collaborative Computational Project, 1994 | http://www.ccp4.ac.uk/ | |
| Software, algorithm | Coot 0.8.9 | Emsley and Cowtan, 2004 | https://www2.mrc-lmb.cam.ac.uk/personal/pemsley/coot/ | |
| Software, algorithm | PHENIX 1.17 | Adams et al., 2002 | http://phenix-online.org/ | |
| Software, algorithm | MSMS | Sanner et al., 1996 | http://mgltools.scripps.edu/packages/MSMS/ | |
| Software, algorithm | DINO 0.9.4 | http://www.dino3d.org | http://www.dino3d.org | |
| Software, algorithm | LIGPLOT | Wallace et al., 1995 | https://www.ebi.ac.uk/thornton-srv/software/LIGPLOT/ | |
| Software, algorithm | CHARMM | Brooks et al., 1983 | https://www.charmm.org/charmm/ | |
| Software, algorithm | SWISS-MODEL | Biasini et al., 2014 | https://swissmodel.expasy.org/ | |
| Software, algorithm | Prism 8.3.0 | GraphPad | https://www.graphpad.com/ | |
| Software, algorithm | MicrocalOrigin 5.0 | Microcal Software, Inc. | http://www.microcal.com | |
| Software, algorithm | MicroCal Concat ITC | Malvern Panalytical | https://www.malvernpanalytical.com/en/ |
Appendix 1—table 1
Compound properties.
| Compound | Smile | IC50 (hDMT1) (µM) | IC50 (hDMT1-S476V) (µM) | IC50 (hDMT1-N520L) (µM) | IC50 (hDMT1-F523A) (µM) |
|---|---|---|---|---|---|
| 1 | BrC1 = CC = C(C(C = CC(Br)=C2CSC(N)=N)=C2O3)C3 = C1CSC(N)=N | 1.24 ± 0.23 | 11.3 ± 0.3 | 2.0 ± 0.4 | 2.9 ± 0.9 |
| 2 | CC1 = C(CSC(N)=N)C(C)=CC(C)=C1CSC(N)=N | 0.35 ± 0.04 | 36.1 ± 8.0 | 21.7 ± 6.9 | 82.9 ± 5.3 |
| 3 | NC(SCC1 = C(CC)C = C(CC)C(CSC(N)=N)=C1 CC)=N | 0.27 ± 0.07 | 32.1 ± 6.3 | 13.7 ± 3.9 | 17.8 ± 7.0 |
| 4 | BrC1 = CC(CSC(N)=N)=CC(CSC(N)=N)=C1 | 4.66 ± 0.4 | 47.6 ± 6.8 | - | 17.3 ± 0.5 |
| 5 | NC(SCC1 = CC = CC(CSC(N)=N)=C1 Br)=N | 2.3 ± 0.25 | |||
| 6 | NC(SCC1 = CC = CC(CSC2 = NCCN2)=C1 Br)=N | 8.13 ± 0.47 | |||
| 7 | BrC1 = C(CSC2 = NCCN2)C = CC = C1CSC3 = NCCN3 | 161 ± 24 |
Appendix 1—table 2
HPLC Purity of final compounds.
| Compound | Retention time | Purity [%] | HPLC method* |
|---|---|---|---|
| 1 | 3.27 min | 99 | B |
| 2 | 1.31 min | 99 | A |
| 3 | 1.52 min | 99 | A |
| 4 | 1.25 min | 99 | A |
| 5 | 1.18 min | 99 | A |
| 6 | 1.21 min | 99 | A |
| 7 | 1.17 min | 99 | A |
-
*Method A: in 2.2 min from 100% A to 100% D, then staying on 100% D. Method B: in 7.5 min from 100% A to 100% D, then staying on 100% D.
Additional files
Download links
A two-part list of links to download the article, or parts of the article, in various formats.
Downloads (link to download the article as PDF)
Open citations (links to open the citations from this article in various online reference manager services)
Cite this article (links to download the citations from this article in formats compatible with various reference manager tools)
Mechanistic basis of the inhibition of SLC11/NRAMP-mediated metal ion transport by bis-isothiourea substituted compounds
eLife 8:e51913.
https://doi.org/10.7554/eLife.51913


