Reticulon proteins modulate autophagy of the endoplasmic reticulum in maize endosperm
- University of Wisconsin, United States
- Washington University in St. Louis, United States
Figures
Figure 1 with 2 supplements

Maize Rtn1 and Rtn2 are reticulon proteins.
(A) Diagrams of reticulon proteins with functions in ER-phagy. The position of functional AIMs in RTN3L and FAM134B/Atg40p and of predicted AIMs in maize Rtn1/2 are marked by red stars. (B) Split-ubiquitin Y2H assay showing homo- and hetero- interactions between Rtn1 and Rtn2. Plates show colonies grown on −LW medium (selecting for transformation) and on −LWHA medium (selecting for interaction). Negative controls were performed by co-expressing Rtn1 or Rtn2 with the corresponding empty vector. Bar graphs show ratios between the number of colonies grown on −LWHA medium versus −LW medium. The ratios from control plates were subtracted from those testing direct interactions between the Rtn proteins. Between 200 and 300 colonies were counted in each case. The graphs show the average of three independent experiments; error bars indicate SD. (C) Rtn1 and Rtn2 fused to GFP colocalize with the ER marker mCherry-KDEL in maize mesophyll protoplasts. The two lower panels show details of the preferential localization of Rtn1-GFP and Rtn2-GFP to tubular ER junctions (arrowheads). (D) Increasing expression of Rtn2-mCherry leads to the architectural reorganization of the ER. Arabidopsis protoplasts were transformed with increasing amounts (4, 9, and 14 μg) of plasmid containing 35S:Rtn2-mCherry along with a constant amount of an independent plasmid encoding the ER lumenal marker CFP-KDEL. (E) Overlapping localization of Rtn2-mCherry and CFP-KDEL as shown by box and whisker plots of Pearson correlation coefficients (PCC) calculated for the protoplasts as shown in (D). The experiment was performed three times; graph shows the results of a representative experiment. Between 8 and 10 randomly selected protoplasts for each treatment were included in the analysis. Scale bars = 5 μm.
Figure 1—figure supplement 1
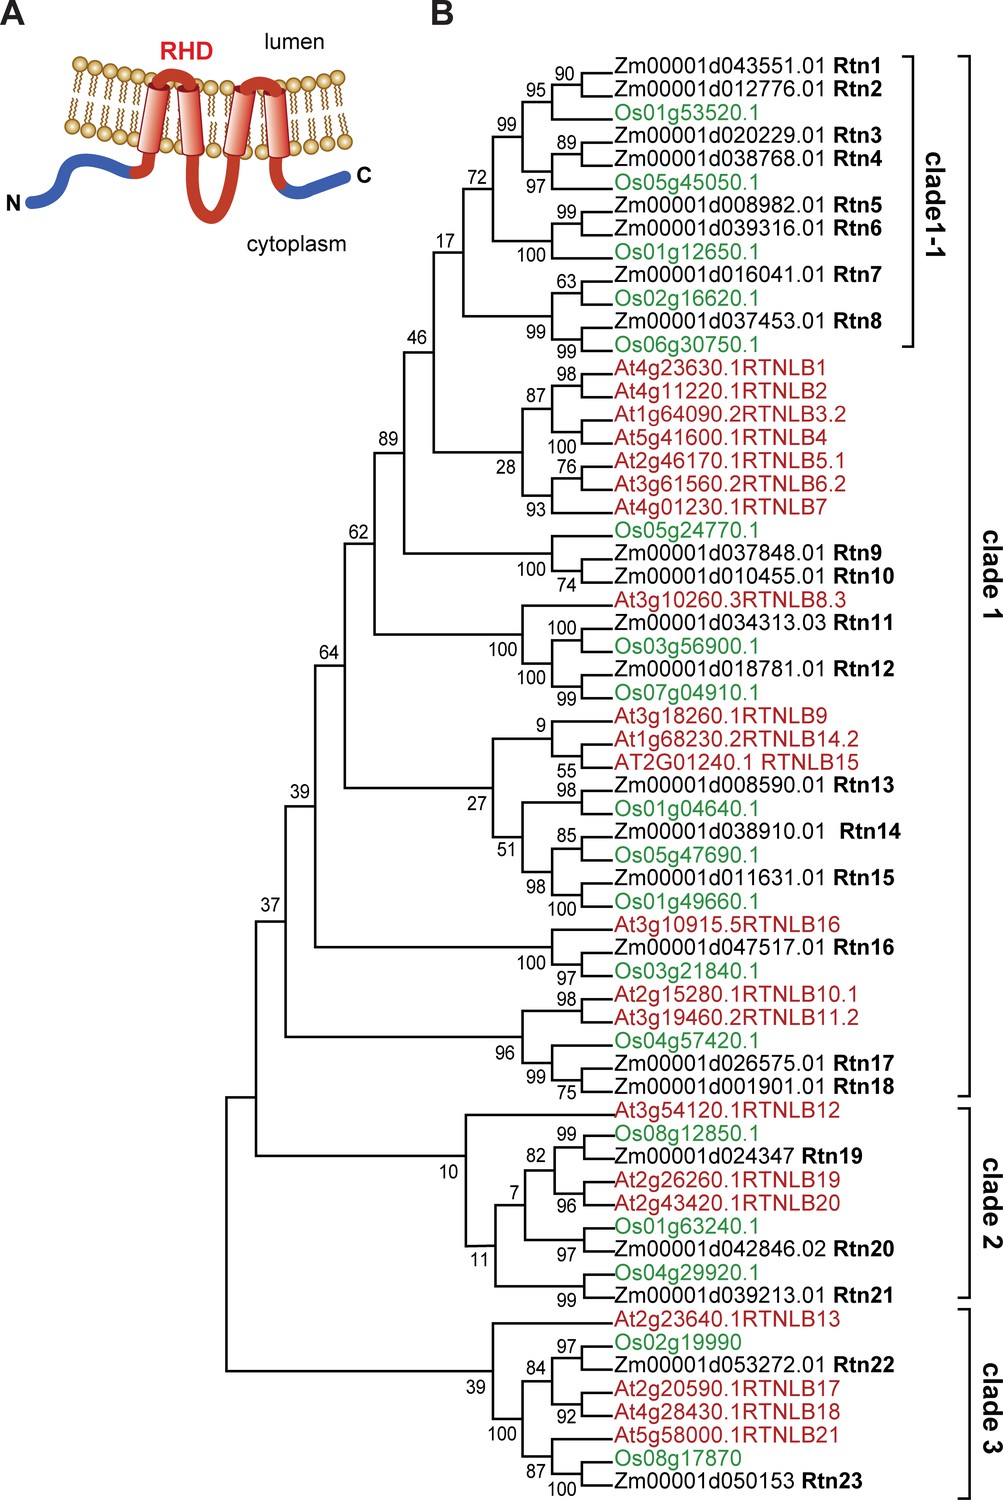
Structure and organization of plant reticulons.
(A) Diagram of the predicted structure of a typical plant reticulon protein. (B) Phylogenetic analysis of RHD-containing protein sequences from Arabidopsis thaliana, rice (Oriza sativa), and maize (Zea mays B73). The evolutionary history was inferred by using the Maximum Likelihood method based on the JTT matrix-based model (Jones et al., 1992). The bootstrap consensus tree was inferred from 100 replicates.
Figure 1—figure supplement 2

Expression patterns of reticulons in maize and rice.
(A) Tissue expression patterns of Rtn genes in developing maize seeds (http://bar.utoronto.ca/efp_maize/cgi-bin/efpWeb.cgi?dataSource=Sekhon_et_al_Atlas). Log TPM (transcript per million) values are depicted according to colour scale. AL, aleurone; EMB, embryo; ES, endosperm; BETL, basal endosperm transfer layer; CZ, central starchy endosperm zone. RNA-sequencing data of AL, BETL, CZ, EMB at 8 days after pollination (DAP) (Zhan et al., 2015), EMB at 14DAP (Waters et al., 2011), AL and ST at 15 DAP (Yi et al., 2015), ES at 18DAP (Chen et al., 2014), EMB at 18 DAP (Buell, 2013), and EMB at 22DAP (Chen et al., 2014), and AL and ST at 18DAP (accession numbers: SRX2612066, SRX2612067, SRX2612068, SRX2612069, SRX2612070, SRX2612071, SRX2612072, SRX2612073) were downloaded from National Center for Biotechnology Information (NCBI). (B) Tissue expression patterns of Rtn genes in rice (http://bar.utoronto.ca/efprice/cgi-bin/efpWeb.cgi). Log TPM (transcript per million) values are depicted according to colour scale. (C) Amino acid sequence alignment between maize Rtn1 and Rtn2 performed with ClustalW. Identical amino acids are shown in black boxes. Putative AIM sequences are enclosed in red boxes.
Figure 2 with 2 supplements

Rtn1 and Rtn2 interact with maize Atg8a.
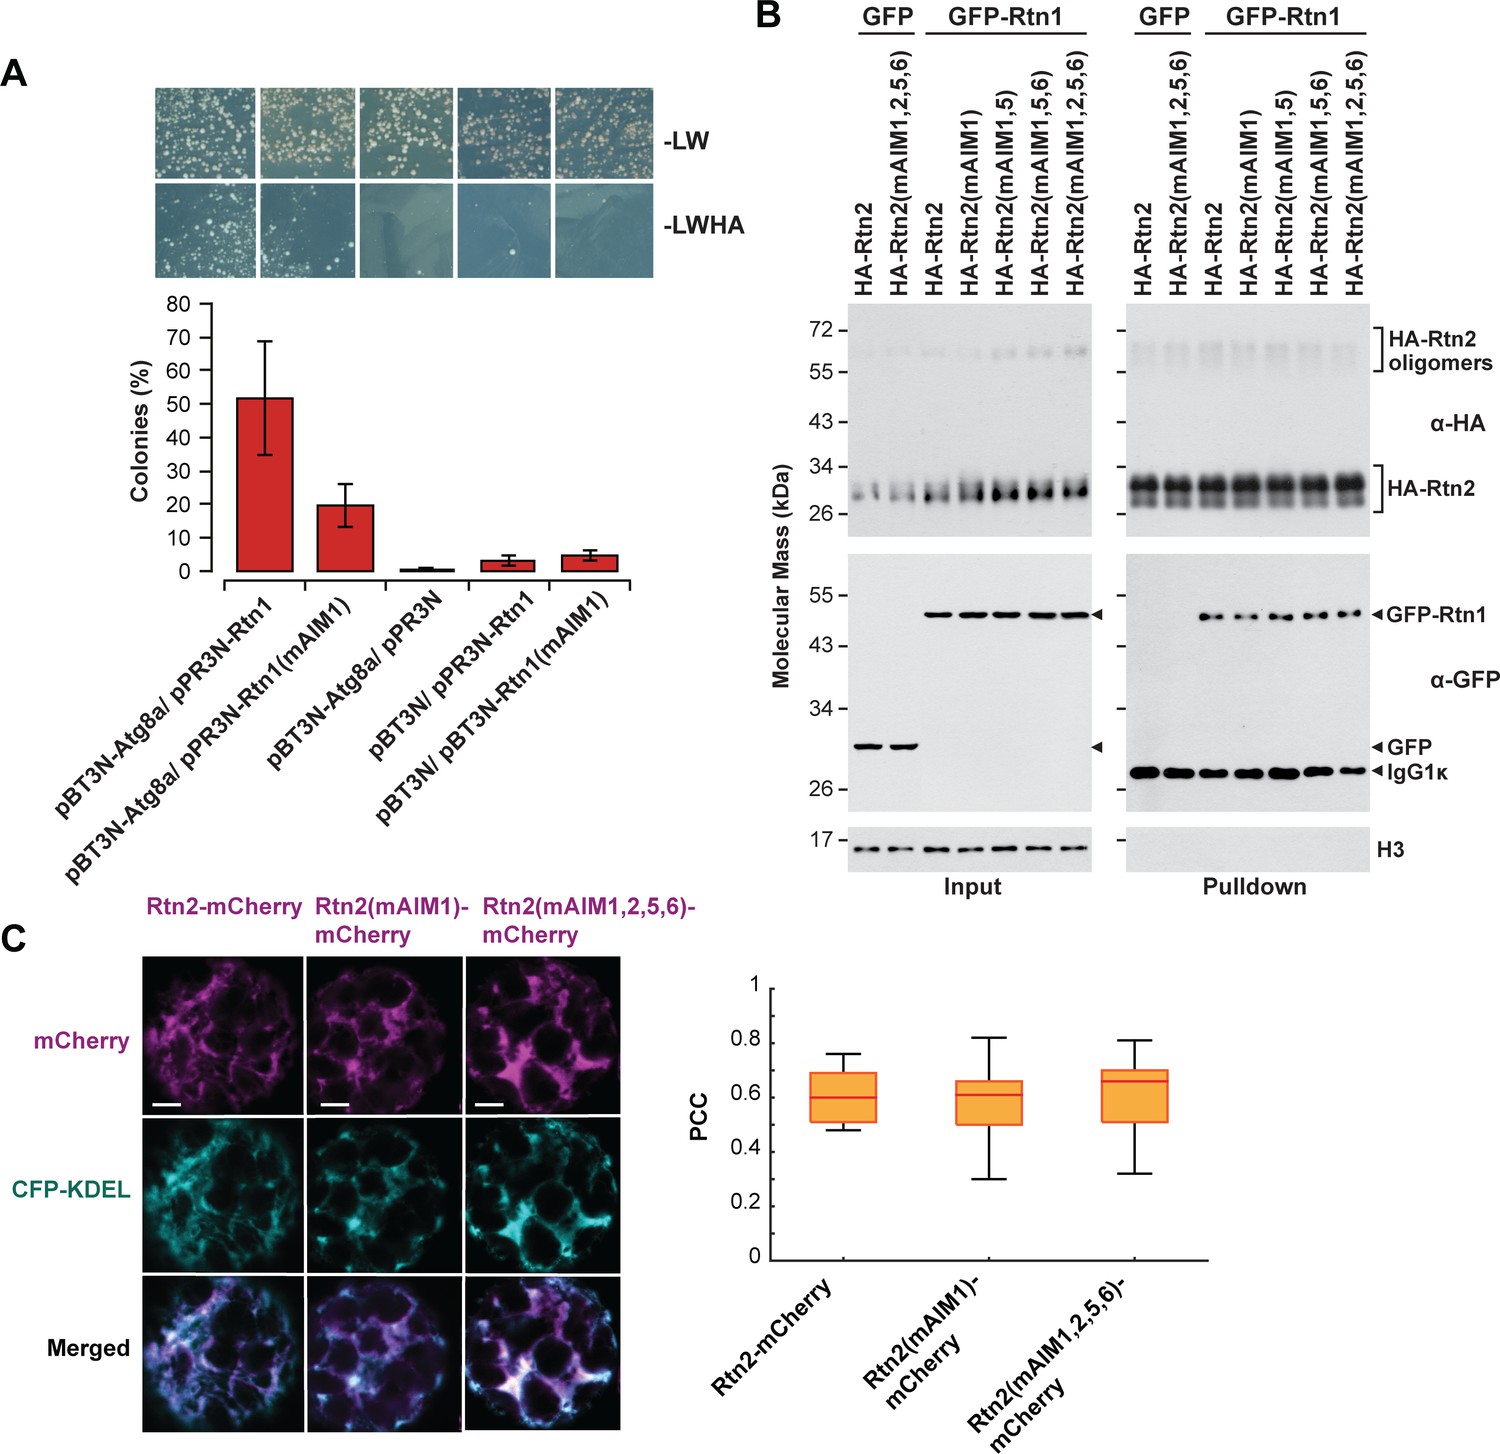
(A) Split-ubiquitin Y2H assays showing interactions between Rtn1/2 and Atg8a. Plates show colonies grown on −LW medium (selecting for transformation) and on −LWHA medium (selecting for interaction). Controls were performed by co-expressing Rtn1, Rtn2, or Atg8a proteins with the corresponding empty vector. Bar graphs show ratios between the number of colonies grown on −LWHA medium versus −LW medium. The ratios from control plates were subtracted from those testing direct interactions between Rtn proteins and Atg8a. Between 200 and 300 colonies were counted in each case. The graphs show the average of three independent experiments; error bars indicate SD. (B) Co-immunoprecipitation assays showing interactions between HA-Rtn2 and GFP-Atg8a. Immunoprecipitation was performed with anti-HA antibodies in Arabidopsis protoplasts transiently expressing HA-Rtn2 and either GFP alone (negative control) or GFP-Atg8a. Immunodetection of histone 3 (H3) was used to confirm near equal loading of the input fractions. (C) Diagram showing positions of the predicted AIMs in Rtn1 and Rtn2. (D) Y2H assays testing the interactions between Atg8a and either the N-terminal (N), cytoplasmic intermembrane loop (L), or C-terminal (C) regions of Rtn2. The interaction between Atg8a and Atg7 was used as a positive control. Negative controls included the individual prey or bait sequences expressed with the corresponding empty vectors. (E) Split-ubiquitin Y2H assay between Atg8a and Rtn2 or Rtn2 proteins with mutations in putative AIM domains. Bar graphs show ratios between the number of colonies grown on −LWHA medium versus −LW medium as in (A). (F) Co-immunoprecipitation of HA-Rtn2 or HA-Rtn2 mAIM mutant proteins with either GFP alone (negative control) or GFP-Atg8 in transformed Arabidopsis protoplasts. Immunoprecipitation was performed with anti-HA antibodies. Immunodetection of histone 3 (H3) was used to confirm near equal loading of the input fractions. (G) Densitometric quantification of GFP-Atg8 bands from the immunoblots shown in (F), plus two additional independent biological replicates. Bars represent the mean (± S.D.) normalized to the amount of GFP-Atg8a immunoprecipitated by wild-type HA-Rtn2. (H) Stability assay of HA-Rtn2 and HA-Rtn2(mAIM1,2,5,6) expressed in wild type (WT) or atg7-2 mutant Arabidopsis protoplasts and treated with cycloheximide (CHX) for 0, 30, 60, and 180 min. Control protoplasts (C) not treated with CHX were collected and processed 180 min after the initiation of the CHX treatment.
Figure 2—figure supplement 1
Effects of mutations in Rtn AIM domains.
(A) Split-ubiquitin Y2H assay between either Rtn1 or Rtn1 (mAIM1) and Atg8a. Plates show colonies grown on −LW medium (selecting for transformation) and on −LWHA medium (selecting for interaction). Controls were performed by co-expressing Rtn1, Rtn1(mAIM1), or Atg8 proteins with the corresponding empty vector. Bar graphs show ratios between the number of colonies grown on −LWHA medium versus −LW medium. The ratios from control plates were subtracted from those testing direct interactions between Rtn proteins and Atg8a. Between 200 and 300 colonies were counted in each case. The graphs show the average of three independent experiments; error bars indicate ± SD. (B) Co-immunoprecipitation assays between wild-type and mutant forms of HA-Rtn2 and Rtn1-GFP. The assay was performed Arabidopsis protoplasts transiently expressing HA-Rtn2 or HA-Rtn2(mAIM) proteins with mutated AIM domains and Rtn1-GFP. Immunodetection of histone 3 (H3) with anti-H3 antibodies was used to confirm equal loading. (C) Colocalization analysis of Rtn2-mCherry, Rtn2(mAIM1)-mCherry, and Rtn2(mAIM1,2,5,6)-mCherry and CFP-KDEL expressed in Arabidopsis protoplasts. Box and whisker plots show Pearson correlation coefficients (PCC) for the three Rtn2 proteins. The experiment was performed three times; graph shows the results of a representative experiment. Between 8 and 10 randomly selected protoplasts for each treatment were included in the analysis. Scale bars = 5 μm.
Figure 2—figure supplement 2
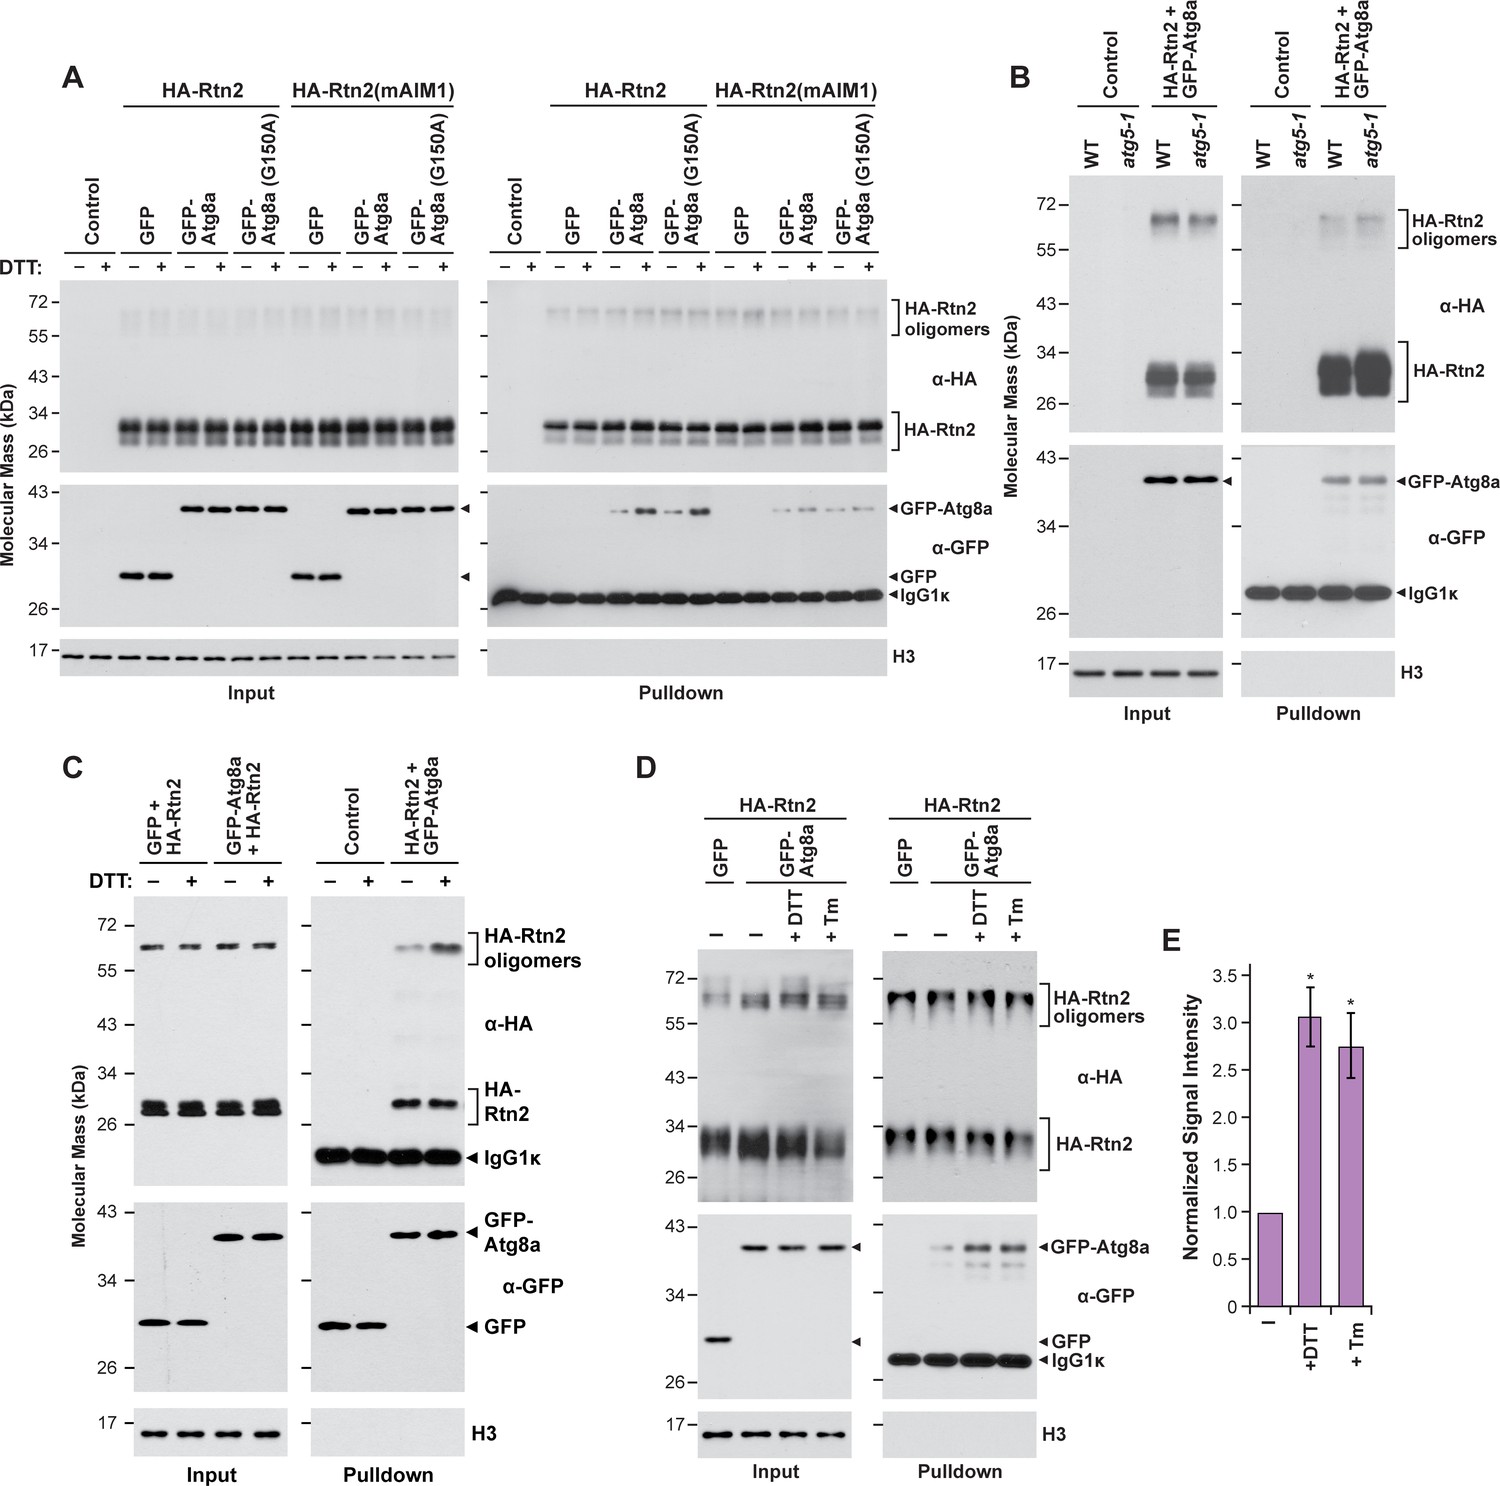
Interactions between Rtn2 and Atg8a are promoted by ER stress-inducing agents but do not require Atg8 lipidation.
(A) Co-immunoprecipitation assay with Ha-Rtn2 and GFP-Atg8a(G150). The assays were performed using anti-HA antibodies with proteins transiently expressed in Arabidopsis protoplasts transiently expressing HA-Rtn2 or HA-Rtn2(mAIM1) together with GFP alone (negative control), GFP-Atg8a, or GFP-Atg8a(G150) and incubated with or without DTT for 3 hr. (B) Co-immunoprecipitation assay using anti-HA antibodies in Arabidopsis wild type or atg5 mutant protoplasts transiently expressing HA-Rtn2 and GFP-Atg8a. (C) Co-immunoprecipitation assay using anti-GFP antibodies in Arabidopsis protoplasts transiently expressing HA-Rtn2 with either GFP alone (negative control) or GFP-Atg8a and incubated with or without DTT for 3 hr. (D) Co-immunoprecipitation assay using anti-HA antibodies in Arabidopsis protoplasts transiently expressing HA-Rtn2 with either GFP alone (negative control) or GFP-Atg8a and incubated with or without DTT or tunicamycin (Tm) for 3 hr. Immunodetection of histone 3 (H3) was used to confirm near equal loading in (A), (B), (C) and (D). (E) Densitometric quantification of GFP-Atg8 bands from immunoblots shown in c,) plus two additional independent biological replicates. Bars represent the mean (± S.D.) normalized to the amount of GFP-Atg8a immunoprecipitated by wild-type HA-Rtn2 in the absence of DTT or Tm treatment. Asterisks indicate a significant difference between treatment and control conditions as determined by one-way ANOVA followed by Tukey’s post-hoc tests, p<0.01). Increased binding between Rtn2 and GFP-Atg8 was detected for both DTT and TM treatments.
Figure 3
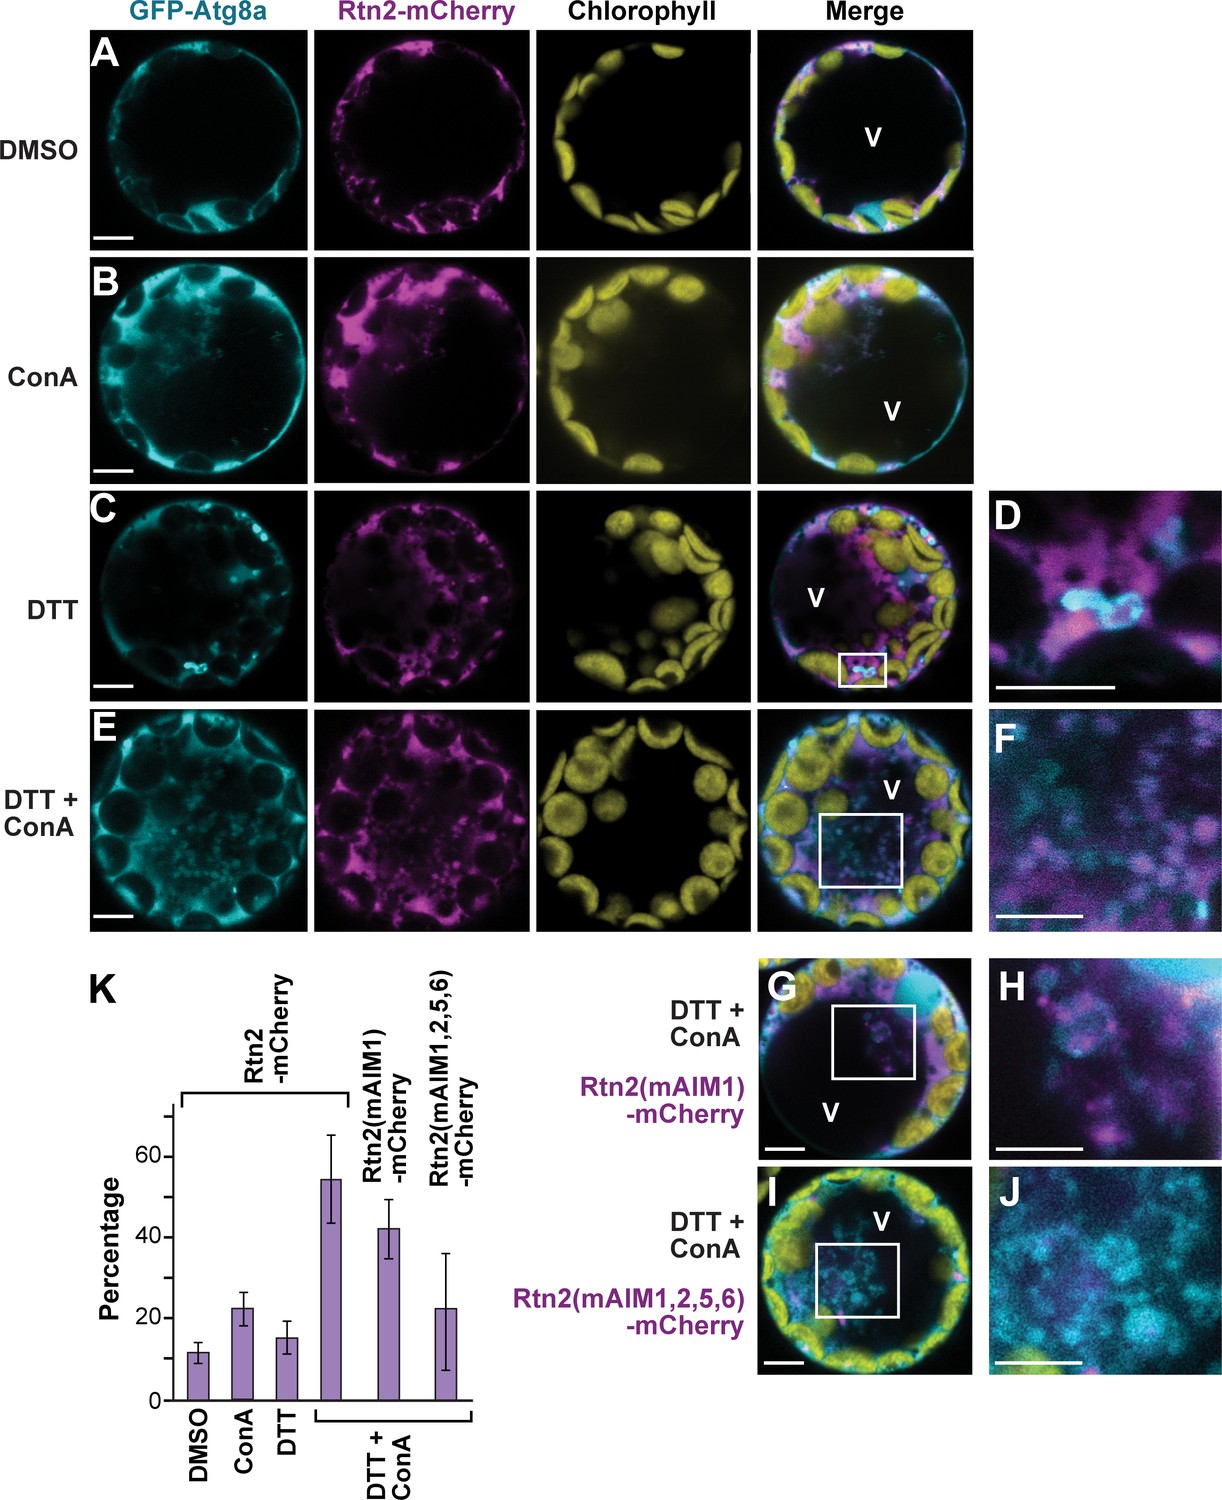
ER stress promotes association of Rtn2 with autophagic organelles during ER-phagy.
(A–J) Co-expression of GFP-Atg8a with either Rtn2-mCherry (A–F), Rtn2(mAIM1)-mCherry (G, H), or Rtn2(mAIM1,2,5,6)-mCherry (I, J) in Arabidopsis protoplasts treated with 1 μM ConA, 2 mM DTT, and/or DMSO (control). Shown are representative protoplasts imaged by confocal fluorescence microscopy. (D), (F), (H), and (J) are enlarged images of the areas highlighted by white boxes in the preceding merged channel images. (D) shows a putative autophagosome decorated with GFP-Atg8a and containing Rtn2-mCherry. (F), (H) and, (J) show autophagic bodies inside the central vacuole (V). Note that autophagic bodies in (J) are positive for GFP-Atg8a but largely devoid of Rtn2(mAIM1,2,5,6)-mCherry. (K) Percentage of observed protoplasts showing vacuolar autophagic bodies positive for both GFP-Atg8a and Rtn2-mCherry. Graph shows average of three independent biological replicates (± S.D.). Between 10 and 15 randomly selected protoplasts were analyzed in each case. Scale bars = 5 μm.
Figure 4 with 2 supplements
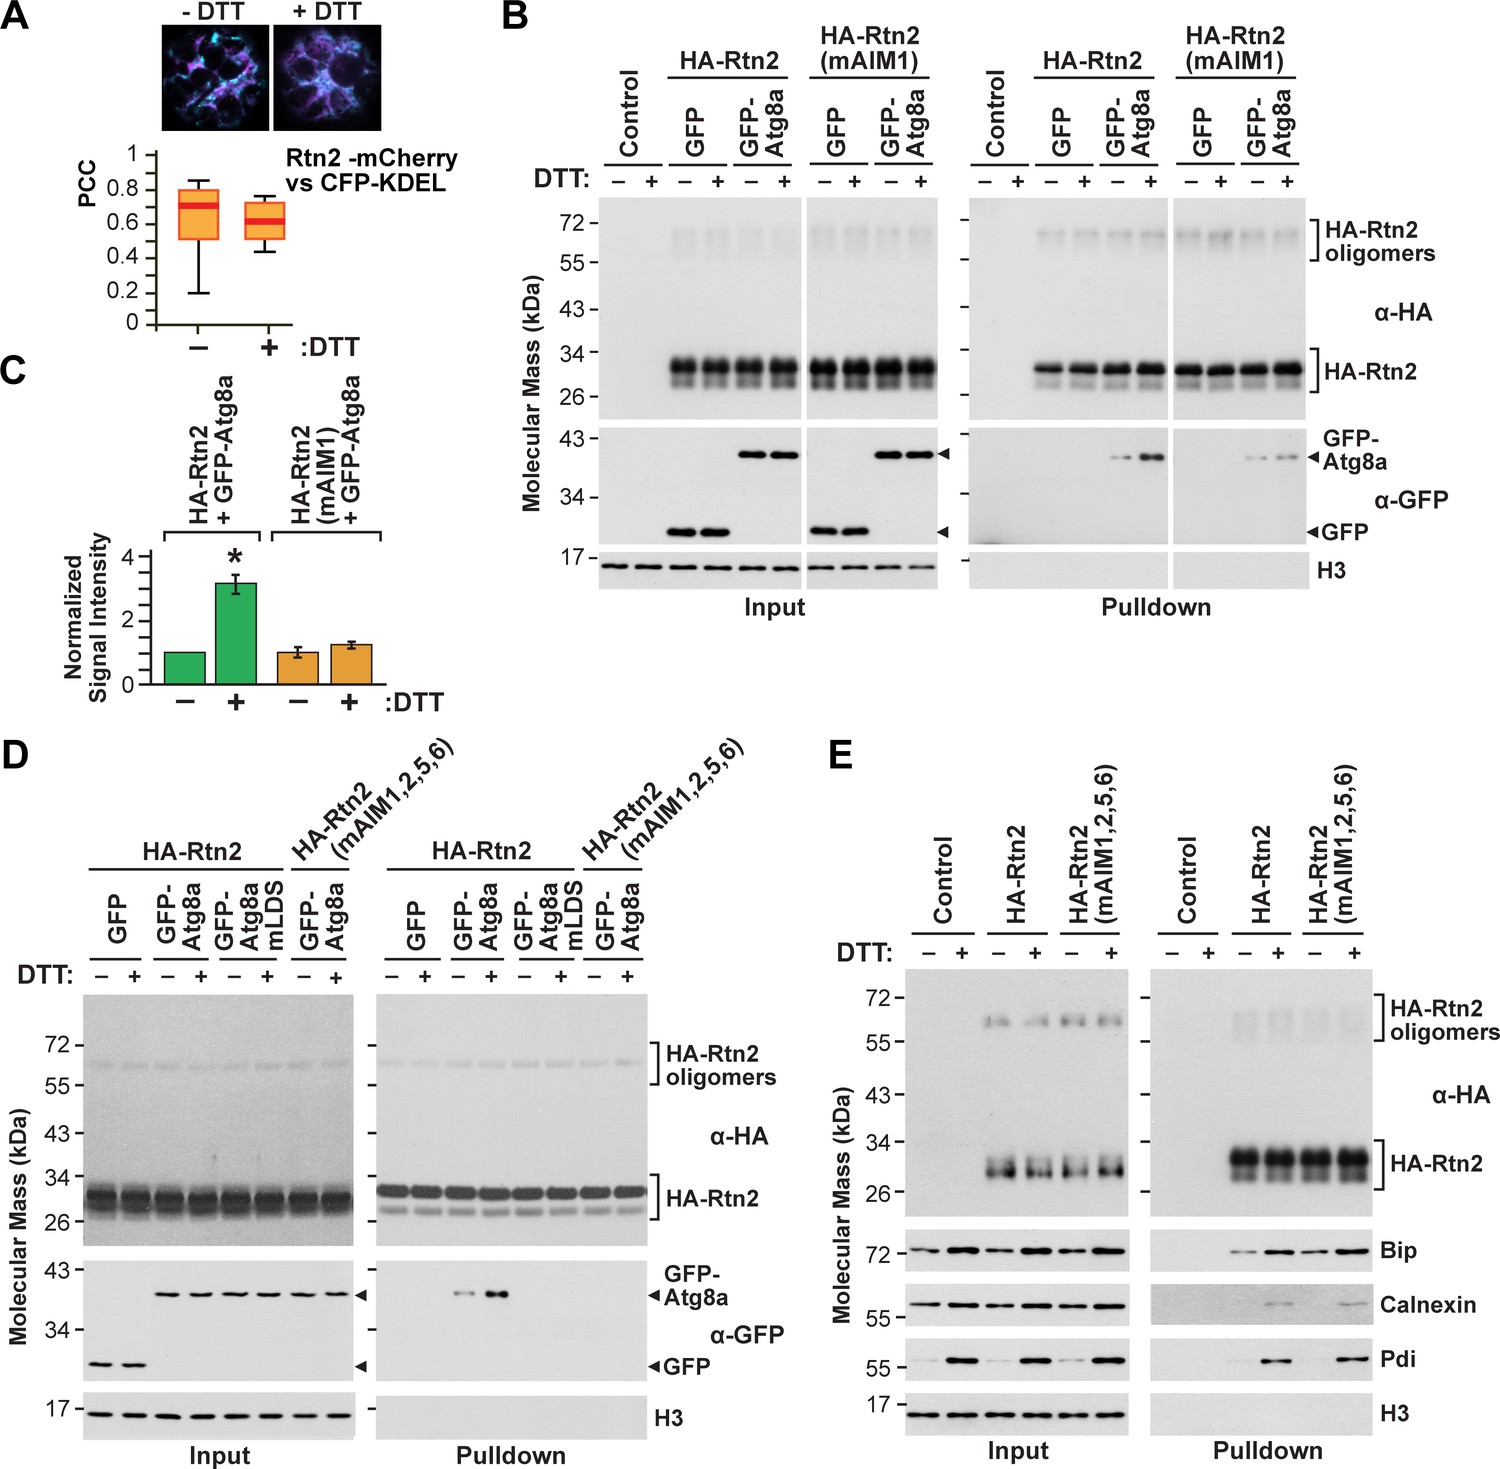
Rtn2 distribution and interactions during ER stress.
(A) Colocalization analysis of Rtn2-mCherry and CFP-KDEL in protoplasts treated with or without DTT for 3 hr. One representative protoplast of each treatment is shown. The box and whisker plot represents the Pearson correlation coefficients (PCC) calculated for Rtn2-mCherry and CFP-KDEL. The experiment was performed three times; graph shows the results of a representative experiment. At least 10 randomly selected protoplasts for each treatment were included in the analysis. (B) Co-immunoprecipitation of HA-Rtn2 or HA-Rtn2(mAIM1) mutant protein with either GFP alone (negative control) or GFP-Atg8 from transformed Arabidopsis protoplasts treated with or without DTT for 3 hr. (C) Densitometric quantification of GFP-Atg8 bands from the immunoblots shown in B), plus two additional independent biological replicates. Bars represent the mean (± S.D.) normalized to the amount of GFP-Atg8a immunoprecipitated by wild-type HA-Rtn2 in the absence of DTT treatment. The asterisk indicates a significant difference between GFP-Atg8 bands from protoplasts treated with or without DTT as determined by one-way ANOVA followed by Tukey’s post-hoc tests, p<0.01. Note the increase in GFP-Atg8 bound to HA-Rtn2 but not to HA-Rtn2(mAIM1) in samples treated with DTT. (D) Co-immunoprecipitation of HA-Rtn2 or HA-Rtn2(mAIM1,2,5,6) with GFP alone (negative control), GFP-Atg8, or GFP-Atg8a(mLDS) from transformed Arabidopsis protoplasts treated with or without DTT for 3 hr. (E) Co-immunoprecipitation of HA-Rtn2 with calnexin, Bip, and Pdi from protoplasts treated with or without DTT, as in (B). In (B), (D), and (E), the immunoprecipitation was performed with anti-HA antibodies and immunodetection of histone 3 (H3) was used to confirm near equal loading for the input fractions.
Figure 4—figure supplement 1

Interactions between Rtn2 and Atg8a are not affected by the cysteine residues near the hinge region of Rtn2.
(A) Position of conserved cysteine residues (highlighted in yellow) in the hinge regions close to the ER lumen in maize Rtn1 and Rtn2 and Arabidopsis RTNLB1 and RTNBL2. Position of the predicted transmembrane segment are depicted inside a box. (B) Co-immunoprecipitation assay using anti-HA antibodies from Arabidopsis protoplasts transiently expressing HA-Rtn2 or HA-Rtn2(CA) with either GFP alone (negative control) or GFP-Atg8a and incubated with or without DTT for 3 hr. Detection of histone 3 (H3) was used as near equal loading control. The increased in binding between Rtn2 and GFP-Atg8 upon DTT treatment was not affected by the alanine substitution of the four cysteine residues located near the hinge regions.
Figure 4—figure supplement 2
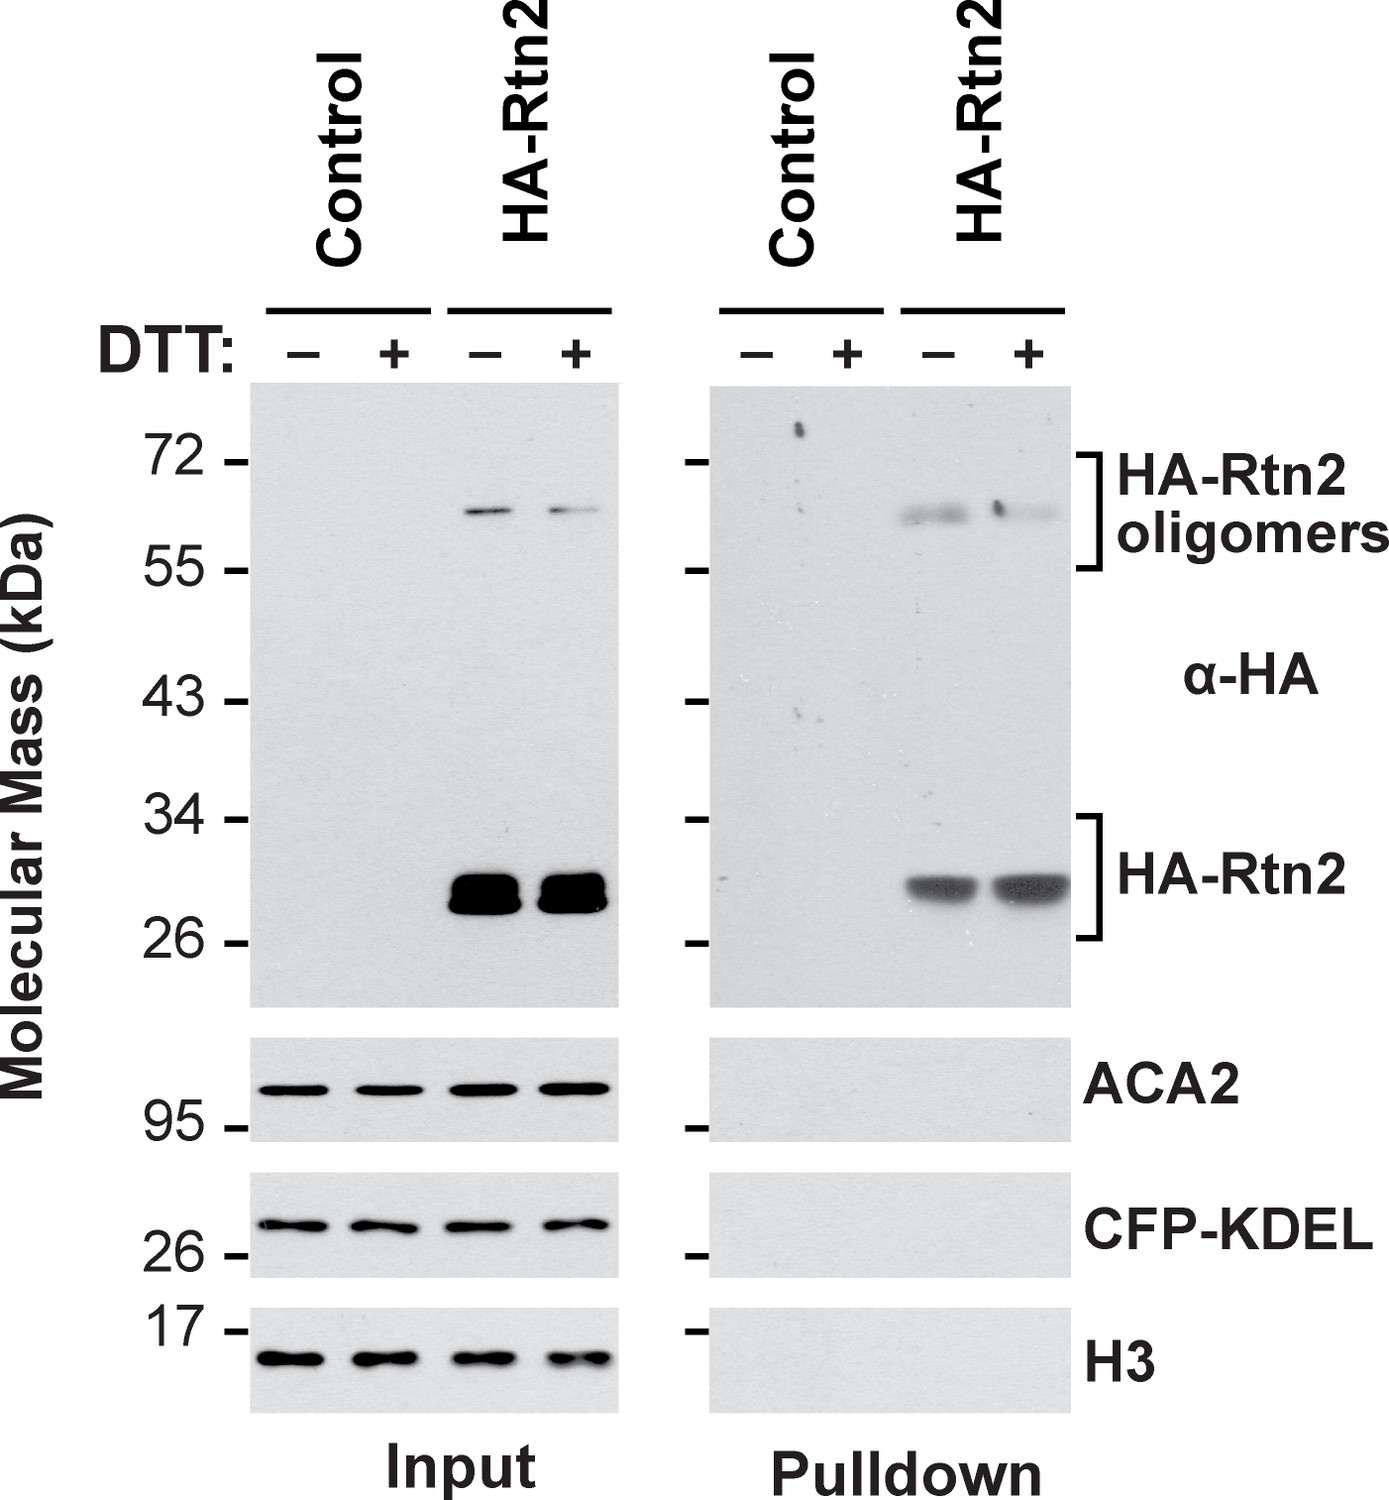
Co-immunoprecipitation assay of HA-Rtn2 and ER proteins.
Whereas HA-Rtn2 is able to co-immunoprecipitate calnexin, Bip, and Pdi from protoplasts treated with or without DT (Figure 4E), it fails to co-immunoprecipitate the ER-resident proteins ACA2 or the ER lumenal marker CFP-KDEL. The immunoprecipitation was performed with anti-HA antibodies and immunodetection of histone 3 (H3) was used to confirm near equal loading for the input fractions.
Figure 5 with 3 supplements

Characterization of maize rtn1 and rtn2 mutants.
(A, B) Diagrams of Rtn1 (A) and Rtn2 (B) showing the position of the Mu insertions, plus RT-PCR of the mutated transcripts (see Figure 5—figure supplement 1 for predicted protein sequences derived from the amplified transcripts). (C–I) Transmission electron micrographs of protein storage vacuoles (PSVs) in aleurone cells from homozygous wild-type W22 (C), rtn2-2 (D–G), atg12-2 (H), and rtn2-2 atg12-2 (I) developing seeds at 20 days after pollination. Note the accumulation of ER, whole mitochondria (M), and other membranous structures (red arrowheads) in the vacuolar matrix of the rtn mutants. (J) Percentage of vacuoles showing cytoplasmic contents in the vacuolar matrix. At least 100 PSVs of each genotype were used for the analysis. (K) Immunoblot analysis of autophagy related proteins (Nbr1 and Atg8), the proteasome component Rpt4, the ER-resident channel Aca2, and the mitochondrial protein Vdac in aleurone and starchy endosperm samples from wild-type W22, the three rtn2 mutants, atg12-2, and rtn2-2 atg12-2 developing seeds. Immunodetection of histone 3 (H3) was used to confirm near equal protein loading. Scale bars = 500 nm.
Figure 5—figure supplement 1
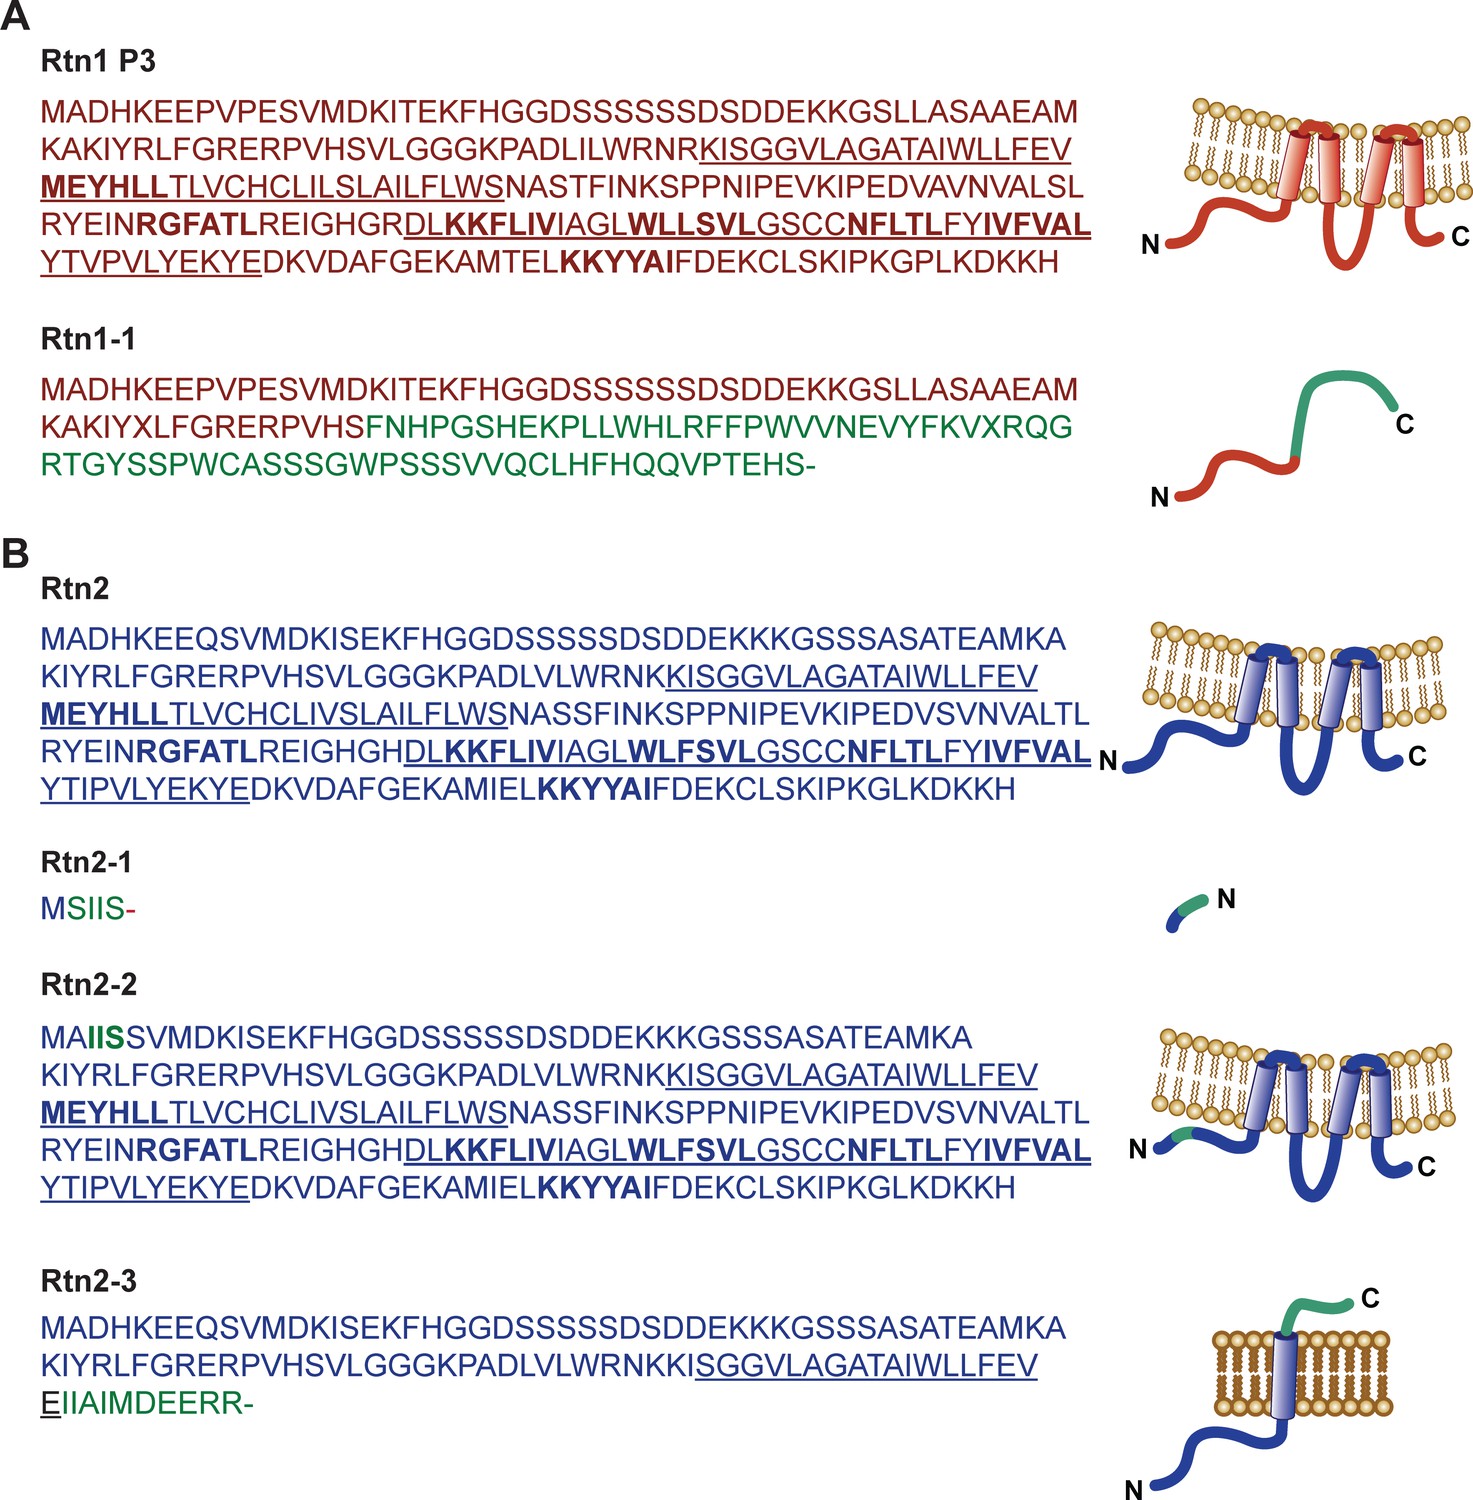
Predicted amino acid sequences of Rtn1 and Rtn2 polypeptides.
Amino acid sequences predicted from translated transcripts of wild type and mutant versions of Rtn1 (A) and Rtn2 (B). The mRNAs were isolated from W22, Mu-08559 (rtn1-1), Mu-02254 (rtn2-1), Mu-03723 (rtn2-2), and Mu-00381 (rtn2-3). Underlined sequences correspond to transmembrane regions; coloured amino acids correspond to mutated sequences; bold amino acids indicate predicted AIMs.
Figure 5—figure supplement 2
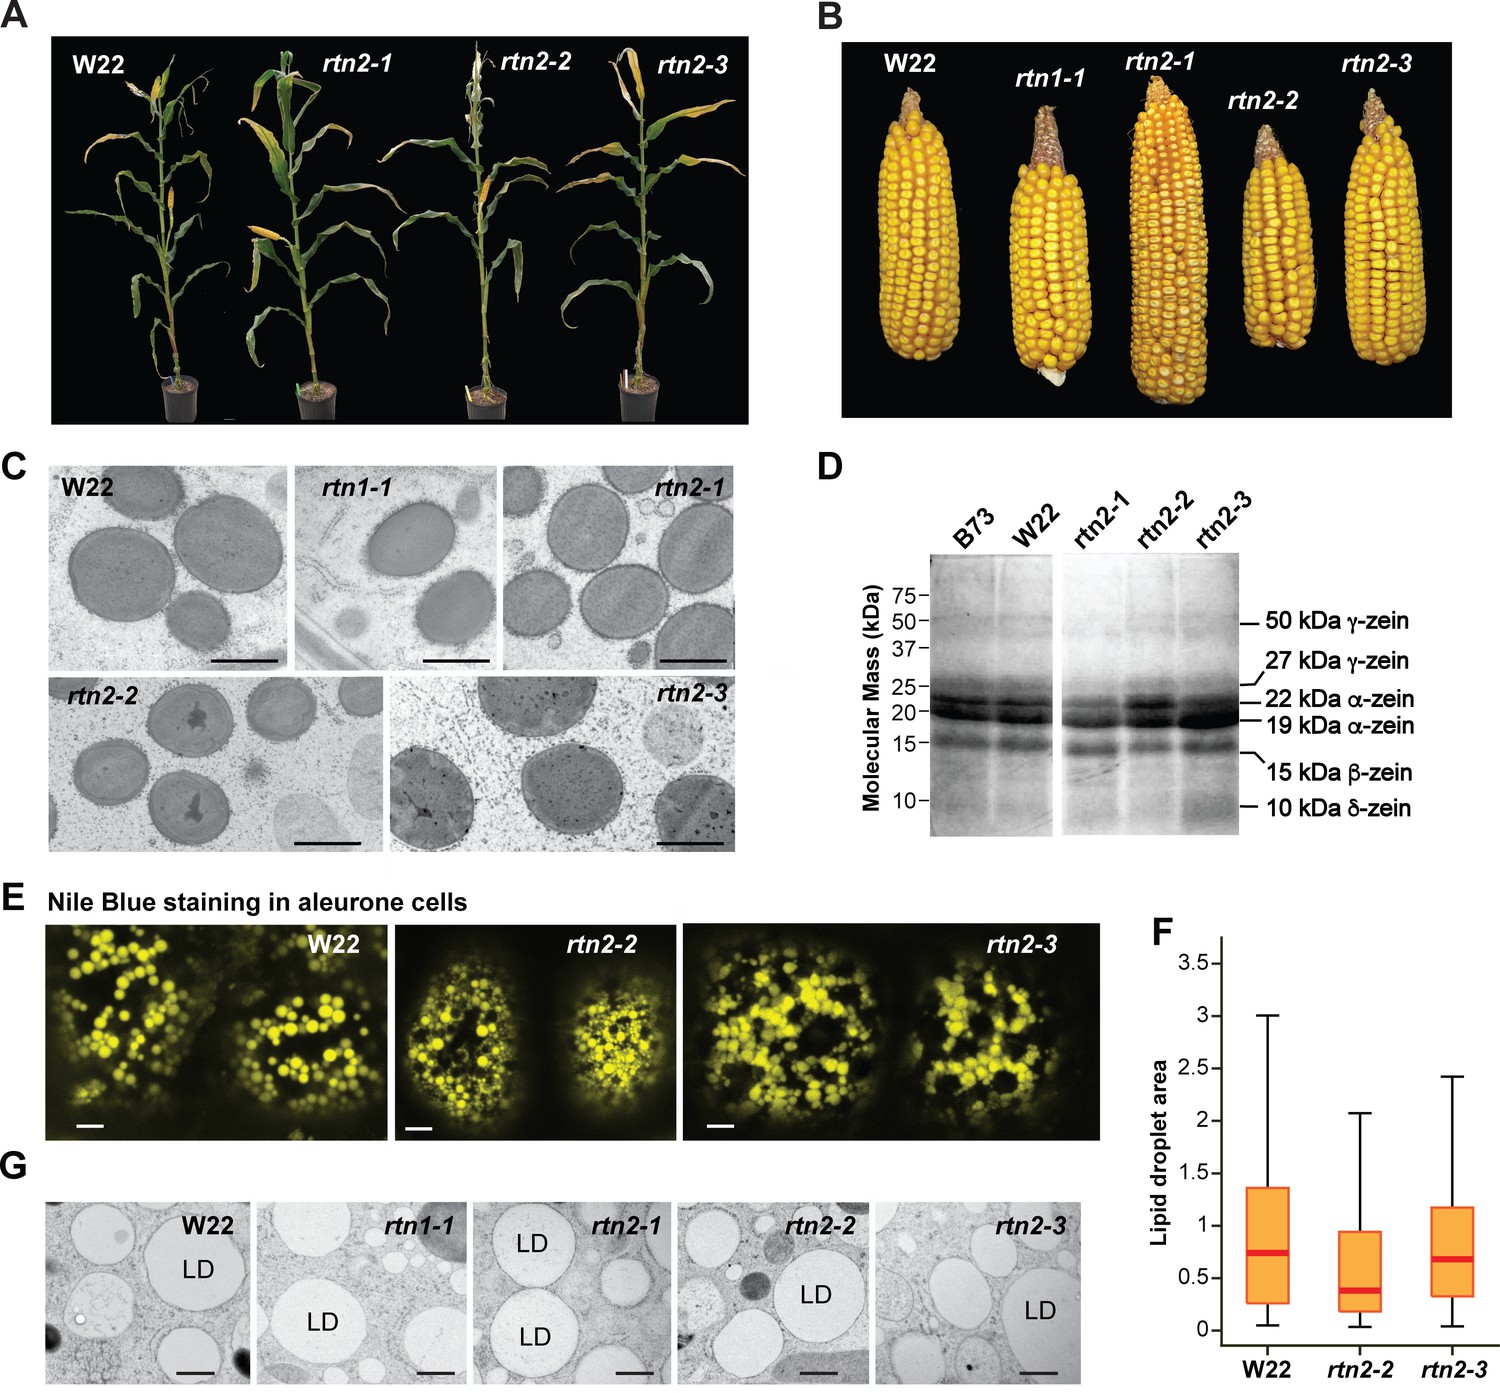
Plant growth and seed development for the maize rtn1 and rtn2 mutants.
(A) W22 and rtn2 mutant plants. The rtn2 mutants grew normally under greenhouse growing conditions (16-hr-light/8-hr-dark photoperiod, supplemental lighting, and average temperature of 28°C during the light period and 21°C during the dark period). (B) Mature ears from W22, and rtn1 and rtn2 mutants grown in the field. (C) Transmission electron micrographs of protein bodies in starchy endosperm cells of rtn1 and rtn2 single mutants. (D) Storage protein profiles from mature B73, W22, and rtn2 mutants. (E) Analysis of lipid droplet morphology in aleurone cells of W22, rtn2-2 and rtn2-3 by Nile Blue staining and light microscopy. (F) Quantification of lipid droplet area based on confocal imaging of Nile blue-stained aleurone cells. At least 100 lipid droplets were used from each genotype for this analysis. (G) Transmission electron micrographs of lipid droplets in aleurone cells of W22, rtn1 and rtn2 mutants. Scale bars = 1 μm in (C), 5 μm in (E), 600 nm in (G).
Figure 5—figure supplement 3
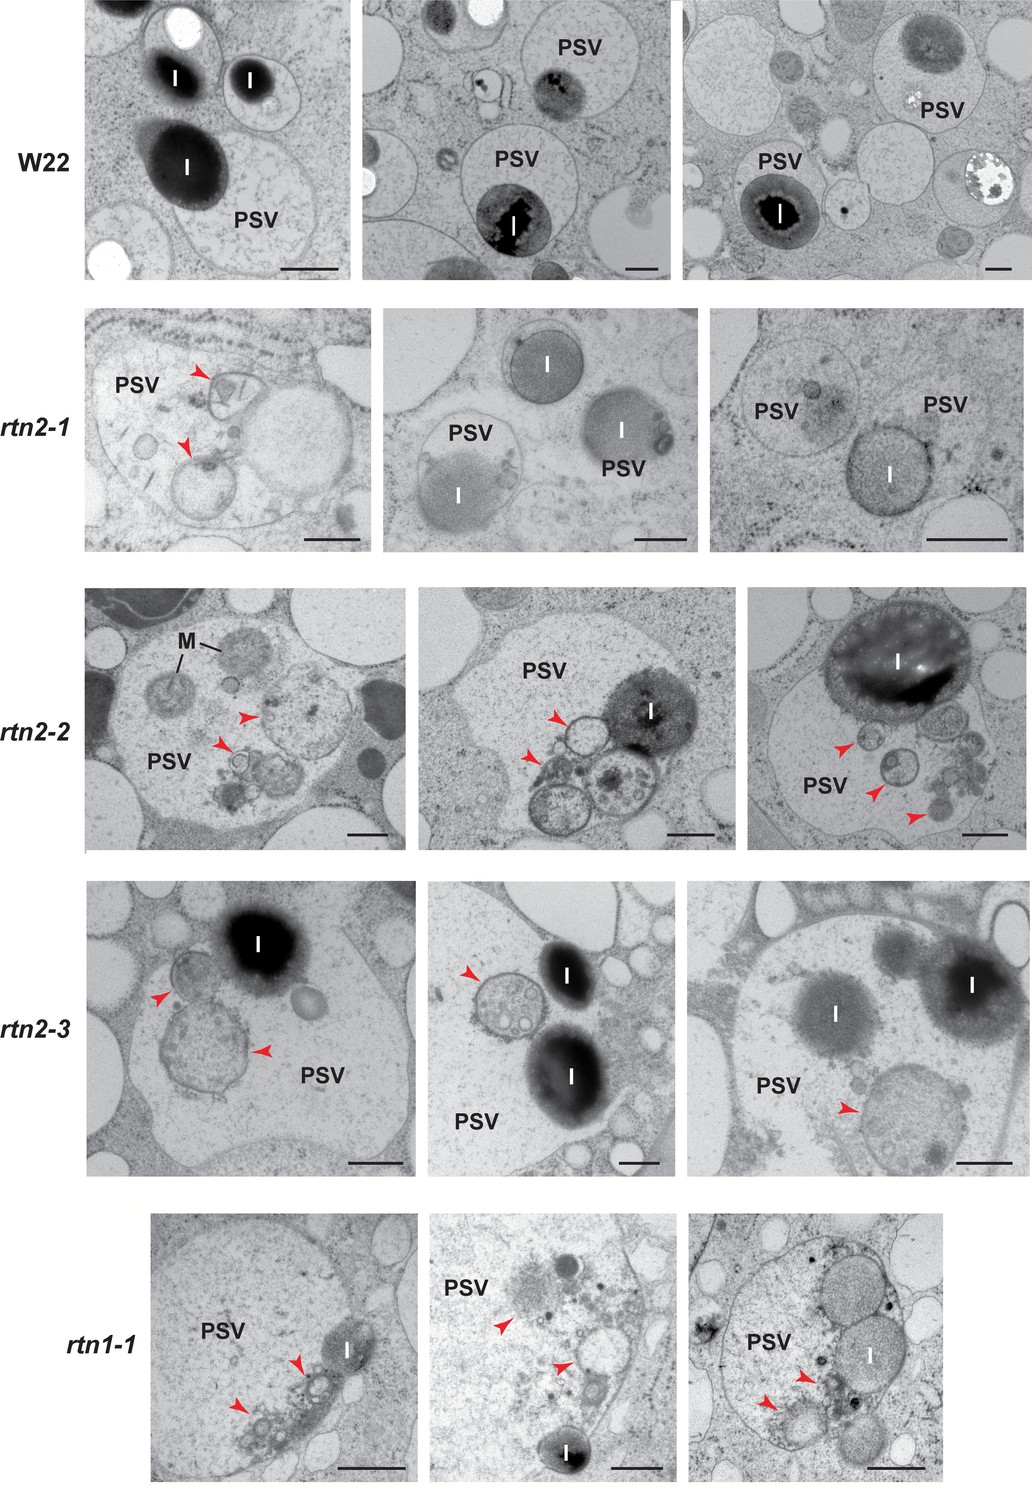
Abnormal contents in protein storage vacuoles (PSVs) of rtn1/2 mutant aleurone cells.
Transmission electron micrographs of PSV from aleurone cells at 20–21 days after pollination from W22 (control) and rtn1 and rtn2 mutants. Arrowheads indicate cytoplasmic contents within vacuoles. I, protein inclusion; M, mitochondria. Scale bars = 500 nm.
Figure 6
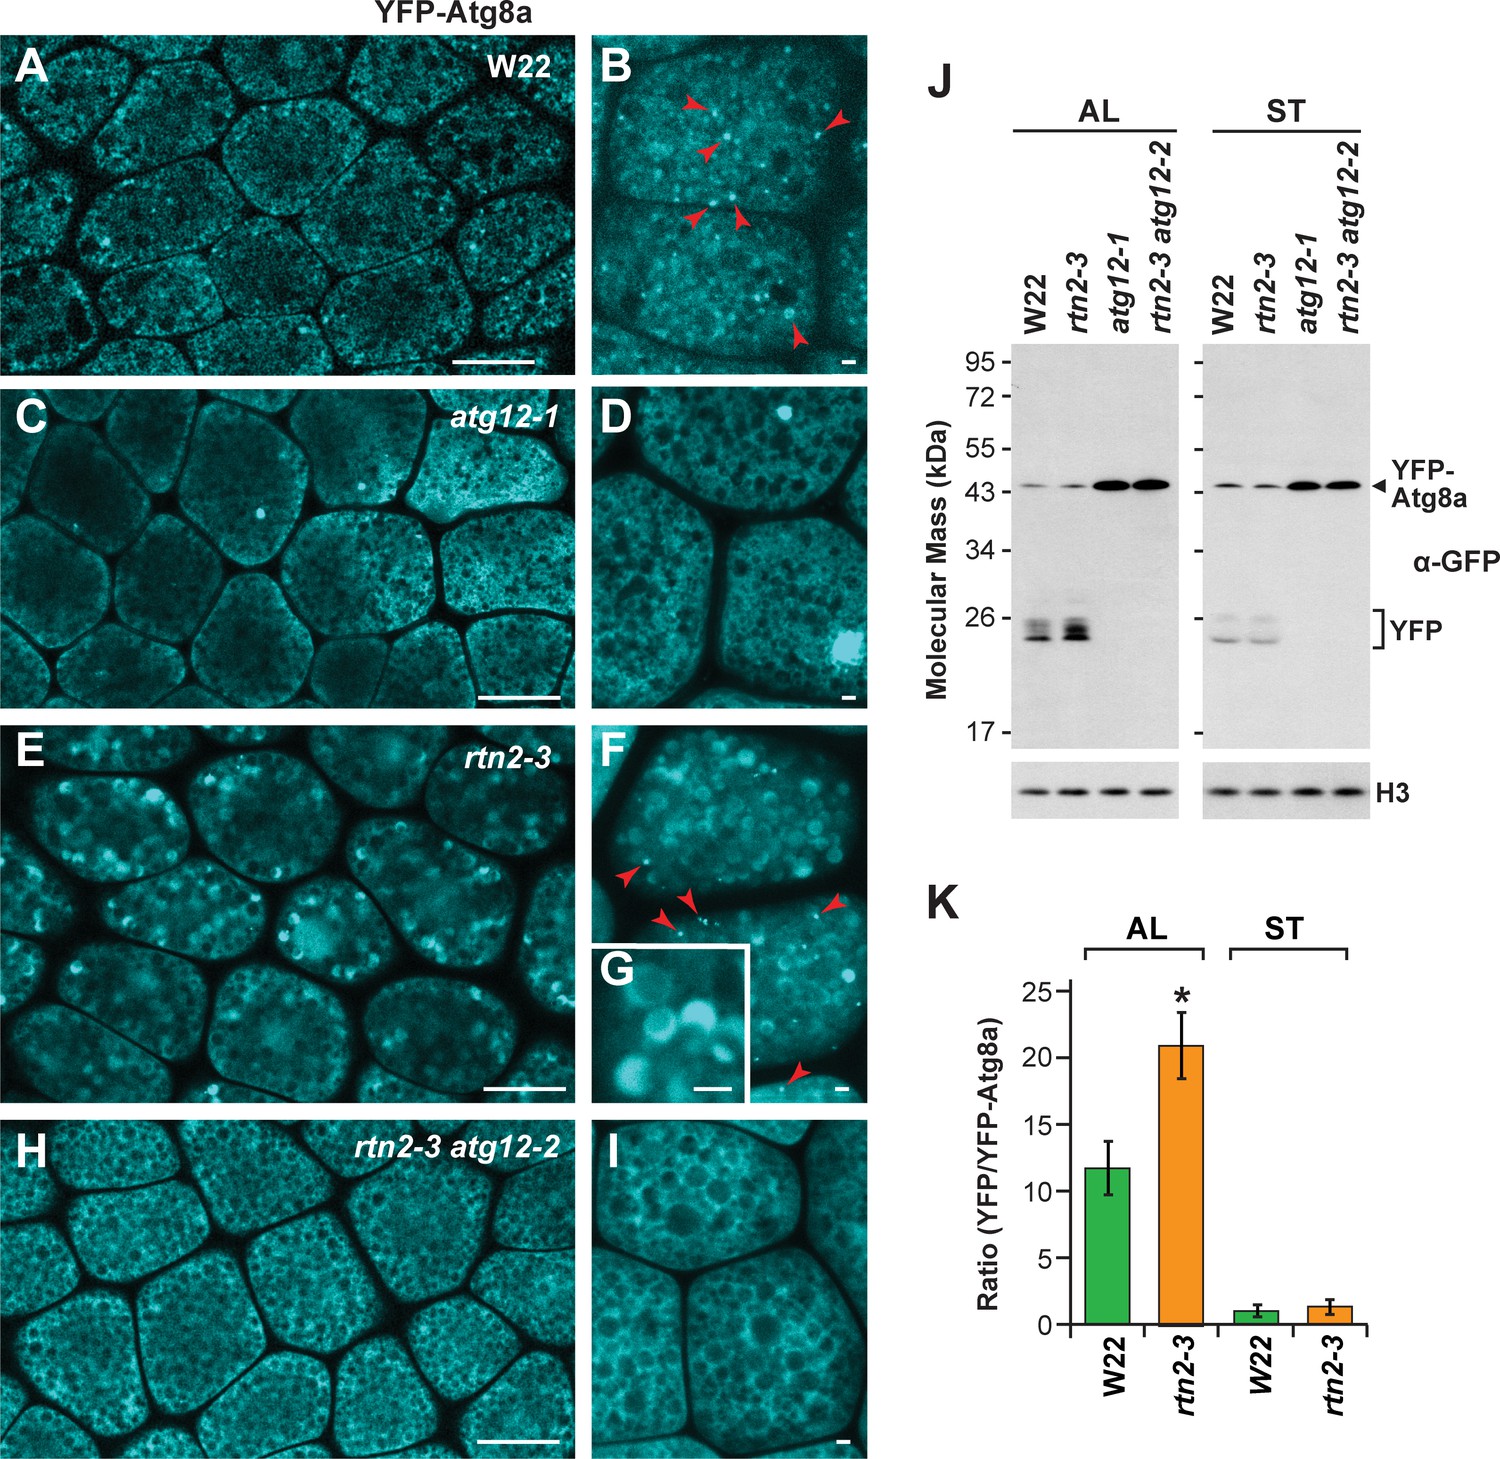
Autophagic flux is increased in rtn2 mutant aleurone cells.
(A–I) Confocal imaging of YFP-Atg8a in W22 (A, B), atg12-1 (C, D), rtn2-3 (E, G), and rtn2-3 atg12-2 (H, I) aleurone cells from seeds harvested at 20 days after pollination. YFP-Atg8a-positive puncta consistent with autophagosomes were detected in W22 (B) red arrowheads) and rtn2-3 (F), red arrowheads) aleurone cells but not in lines harbouring either the atg12-1 or atg12-2 mutations. Notice the strong, crescent-shape YFP signal detected in the matrix of rtn2-3 aleurone vacuoles in (G). (J) Immunoblot detection of YFP-Atg8a and cleaved YFP with anti-GFP/YFP antibodies. Immunodetection of histone 3 (H3) was used to confirm near equal protein loading. (K) Densitometric quantification of the YFP/YFP-Atg8a ratio from the immunoblots shown in (j), plus two additional independent biological replicates. Bars represent the mean (± S.D.). The asterisk indicates a significant difference between the rtn2-3 mutant and the wild type as determined by one-way ANOVA followed by Tukey’s post-hoc tests, (p<0.05). Note the increased release of YFP from YFP-Atg8a in aleurone but not starchy endosperm cells of the rtn2-3 mutant. Scale bars = 20 μm in (A), (C), (E), (H), and 1 μm in (B), (D), (F), (G), (I).
Figure 7

ER-stress in rtn2 and atg12 mutant endosperm cells.
(A) qRT-PCR of Rtn1 and Rtn2 from aleurone cells treated with 2 mM DTT for 3 hr. Amplification of Bip2 transcripts was used as an indicator of UPR induction. The graph combined results from four independent biological replicates, each consisting of three technical replicates for samples treated either with or without DTT. (B) qRT-PCR quantification of Bip2 transcripts in W22, rtn2-2, atg12-2, and rtn2-2 atg12-2 aleurone and starchy endosperm cells. EF1α was used as reference gene in (A) and (B). (C) Model of the action of Rtn proteins in maize aleurone cells and the response of rtn1/2 mutant cells. When Rtn-mediated ER-phagy and/or other Rtn functions are reduced in aleurone cells, ER stress increases, promoting general autophagy as a compensatory mechanism for ER turnover.
Additional files
-
Supplementary file 1
Key resources table.
- https://cdn.elifesciences.org/articles/51918/elife-51918-supp1-v2.docx
-
Transparent reporting form
- https://cdn.elifesciences.org/articles/51918/elife-51918-transrepform-v2.docx
Download links
A two-part list of links to download the article, or parts of the article, in various formats.
Downloads (link to download the article as PDF)
Open citations (links to open the citations from this article in various online reference manager services)
Cite this article (links to download the citations from this article in formats compatible with various reference manager tools)
Reticulon proteins modulate autophagy of the endoplasmic reticulum in maize endosperm
eLife 9:e51918.
https://doi.org/10.7554/eLife.51918


